

Abstract
Atomic force microscopy (AFM) is one of the most commonly used scanning probe microscopy techniques for nanoscale imaging and characterization of lipid-based particles. However, obtaining images of such particles using AFM is still a challenge. The present study extends the capabilities of AFM to the characterization of proteoliposomes, a special class of liposomes composed of lipids and proteins, mimicking matrix vesicles (MVs) involved in the biomineralization process. To this end, proteoliposomes were synthesized, composed of 1,2-dipalmitoyl-sn-glycero-3-phosphocholine (DPPC) and 1,2-dipalmitoyl-sn-glycero-3-phospho-l-serine (DPPS), with inserted tissue-nonspecific alkaline phosphatase (TNAP) and/or annexin V (AnxA5), both characteristic proteins of osteoblast-derived MVs. We then aimed to study how TNAP and AnxA5 insertion affects the proteoliposomes’ membrane properties and, in turn, interactions with type II collagen, thus mimicking early MV activity during biomineralization. AFM images of these proteoliposomes, acquired in dynamic mode, revealed the presence of surface protrusions with distinct viscoelasticity, thus suggesting that the presence of the proteins induced local changes in membrane fluidity. Surface protrusions were measurable in TNAP-proteoliposomes but barely detectable in AnxA5-proteoliposomes. More complex surface structures were observed for proteoliposomes harboring both TNAP and AnxA5 concomitantly, resulting in a lower affinity for type II collagen fibers compared to proteoliposomes harboring AnxA5 alone. The present study achieved the topographic analysis of lipid vesicles by direct visualization of structural changes, resulting from protein incorporation, without the need for fluorescent probes.
Keywords: Atomic force microscopy, Proteoliposomes, Tissue-nonspecific alkaline phosphatase, Annexin V, Matrix vesicles, Collagen
Graphical abstract
1. Introduction
Biomineralization is the process by which hydroxyapatite (HA) crystals are deposited onto an extracellular matrix (ECM). The deposition of HA in specific ECM areas is highly orchestrated and regulated by the activity of several proteins and lipids in the membrane of matrix vesicles (MVs). MVs are structures ranging from 100 to 300 nm in diameter that arise from the membrane of hypertrophic chondrocytes, osteoblasts, and odontoblasts and they are initial sites for the formation of HA minerals [1–4]. Biomineralization occurs by a sequence of physicochemical and biochemical processes. The first step is the deposition of an amorphous mineral complex, i.e. the nucleation core (NC), which crystalizes to form HA inside MVs [5–8]. Concomitantly, MVs bleb out from cell membranes, bind collagen fibrils through specific molecular interactions and decompose to release their HA crystals, enabling HA propagation onto the collagenous ECM. Although several studies are compatible with this sequence of events, it remains unclear how MVs form and how specific proteins and lipids contribute to MV anchorage to the collagenous matrix [9].
Formation of HA inside MVs is accomplished by proteins and lipids involved in Ca2 + and inorganic phosphate (Pi) homeostasis, including tissue-nonspecific alkaline phosphatase (TNAP) and annexin V (AnxA5). TNAP is a peripheral membrane enzyme attached to the outer membrane of MVs by a glycosyl-phosphatidylinositol (GPI) anchor. It is one of four alkaline phosphatase (AP) isozymes found in mammals and is expressed in a variety of tissues throughout development [9]. The 3D structure of placental AP [10] suggests molecular dimensions for TNAP of 10.1 nm × 5.7 nm and a bi-lobular organization with 65 kDa subunits and a longitudinal stain-filled groove [10]. TNAP critically controls HA deposition during skeletal and dental mineralization through hydrolysis of inorganic pyrophosphate (PPi), a potent inhibitor of mineralization [11].
Some findings suggest that lipids are involved in bone formation. For example, phospholipids can facilitate cartilage mineralization in the growth plate [5,8]. DPPC and DPPS are two of the main lipids found in MV membranes [4–5,8], and many studies have revealed that they regulate both the calcium entry into the MVs and the formation of HA crystals [2–5,8,12]. The MVs’ membrane containing phosphatidylserine-rich domains may offer an ideal environment for optimal protein-protein and protein-lipid interactions and optimal function of AnxA5 in Ca2 + influx and cartilage matrix mineralization [12].
AnxA5 is an integral membrane protein that forms a hydrophilic pore, having been proposed to serve as a selective Ca2 +-channel in the membrane of MVs [12]. The 3D crystal structure of AnxA5, established more than 20 years ago [13] revealed molecular dimensions of 6.4 nm × 4 nm × 3 nm for a protein folded into four domains with similar structures and dimensions [13]. Each domain consists of five α-helices wound into a right-handed superhelix, yielding a globular structure with a diameter of 18 nm [13]. More than any other protein involved in biomineralization, AnxA5 significantly accelerates the crystallization of the NC and triggers the de novo HA formation inside MVs [5]. Additionally, AnxA5 interacts with collagen and this interaction regulates mineralization of growth plate chondrocytes. Increased types II and X collagen secretion by chondrocytes in the presence of ascorbate results in increased interactions of AnxA5 with collagen fibers, stimulation of AnxA5-mediated Ca2 +-influx, enhanced TNAP expression, cell activity and mineralization [14,15].
As a model to mimic natural membranes, proteoliposomes have been produced by inserting target proteins within lipid vesicles [16]. Proteoliposomes based on large unilamellar vesicles (LUVs, from 50 to 400 nm) are promising systems for drug delivery, mainly owing to their size, hydrophobic/hydrophilic properties, biocompatibility, biodegradability and low toxicity in the human body [17–21]. During the last decade, these biomimetic systems have gained interest as tools for biophysical studies of lipid–protein interactions as well as for biotechnological applications [16,22]. There is an increasing interest in the study and characterization of the structure, geometry, size and physical properties of proteoliposomes prepared for medical applications. Spectroscopic techniques such as nuclear magnetic resonance (NMR) and electron spin resonance (ESR) [23], and calorimetric techniques such as differential scanning calorimetry (DSC) [1,24] currently provide the main source of information about the structure of liposome membrane in the presence or absence of proteins. However, these techniques reveal only indirect structural information. Fluorescence microscopy is widely used to image membrane structures at the nanoscale but it requires the use of fluorescence dyes during vesicle preparation. Confocal laser scanning microscopy (CLSM) has been identified as one of the best ways to study liposomal architecture, but it also requires fluorescent labeling [25]. Therefore, there is a need for high-resolution imaging techniques that work on soft nanosystems with minimal degree of perturbation of the system.
AFM enables morphologic analysis of proteoliposomes at the nanoscale without the use of fluorescent dyes. Since 1986, AFM has become a versatile tool in biological sciences [26], emerging as a technique that is capable of resolving the molecular details of the cell surface under ambient conditions [27–29]. Natural membranes and many biomolecules, including proteins and nucleic acids [30,31], have been imaged by means of AFM [32]. The AFM cantilevered-tip can move on top of individual vesicles and provide information about the morphology of surface structures at the nanoscale. This technique has also found applications in nanobiotechnology, pharmacology, microbiology, structural and molecular biology and genetics, providing topographic images of surfaces with spatial resolutions close to 1 Å and force-distance curves with a detection limit of around 10−12 N [33–36]. AFM leads to many advantages over conventional optical and electron microscopes because it does not require freezing, metal coating, vacuum and labeling with fluorescent dyes. The resolution of AFM is extremely high, often achieving atomic resolution on hard surfaces and molecular resolution on soft samples [37]. Nonetheless, AFM has received little attention so far in the characterization of liposomes and proteoliposomes. Here, we have used AFM to structurally characterize biologically relevant proteoliposomes as mimetic systems of MVs harboring two important proteins involved in endochondral ossification, i.e., TNAP and AnxA5. Since in MVs, PS can represent from 9.3% [5] to 16.3% [4] of the total lipid composition, we chose 9:1 DPPC:DPPS (molar ratio) for liposome preparation [8].
2. Materials and methods
2.1. Materials
All aqueous solutions were prepared using Millipore® DirectQ ultra-pure apyrogenic water. Bovine serum albumin (BSA), tris hydroxymethyl-amino-methane (Tris), sodium dodecylsulfate (SDS), p-nitrophenyl phosphate disodium salt (pNPP), dexamethasone, β-glycerophosphate, polyoxyethylene-9-lauryl ether (polidocanol) and glutaraldehyde (Grade I, specially purified for use as an electron microscopy fixative) were obtained from Sigma Chemical Co. (St. Louis, MO). Calbiosorb resin was from Merck Chemicals (Darmstadt, Germany), and 1,2-dipalmitoyl-sn-glycero-3-phosphocholine (DPPC) and 1,2-dipalmitoyl-sn-glycero-3-phospho-l-serine (DPPS) from Avanti Polar Lipids, Inc. (Alabaster, AL). α-MEM, fetal bovine serum, ascorbic acid, gentamicin and Fungizone were from Gibco-Life Technologies (Grand Island, NY). All reagents were analytical grade and used without further purification.
2.2. Expression of Annexin V
The plasmid for AnxA5 (pProEx.Htb.annexin V) was kindly provided by Prof. Seamus J. Martin (Trinity College Dublin, Ireland). Human AnxA5 cDNA (accession no. NM_001154) was amplified from a Jurkat cDNA library through PCR and cloned into the bacterial expression vector pProEx.Htb using the restriction sites BamHI and EcoRI. The pProEx.Htb vector contains an ampicillin resistance cassette to enable the selection and growth of colonies expressing the pProEx.Htb.annexin V plasmid. Additionally, the vector encodes an N-terminal poly-histidine tag, which facilitates protein purification from bacterial lysates by using Ni–nitrilotriacetic acid (NTA) agarose [38]. The Trc promoter within the pProEx.Htb.annexin V plasmid is under the control of the lacI repressor and can be activated by the addition of isopropyl-b-D-thiogalactopyranoside (IPTG) to the bacterial growth medium, to induce the expression of recombinant AnxA5 proteins.
2.3. Production of TNAP
Rat bone marrow cells were prepared and cultured to isolate membrane-bound TNAP (0.02 mg/mL of total protein) [39], which was solubilized with 1% polidocanol (10 mg/mL) (final concentration) for 1 h with constant stirring at 25 °C. After centrifugation at 100,000 × g for 1 h, at 4 °C, the solubilized enzyme was concentrated as described by Ciancaglini et al. [40]. To remove excess detergent, 1 mL of polidocanol-solubilized enzyme (~ 0.05 mg protein/mL) was added to 200 mg of Calbiosorb resin as described by Camolezi et al. [41], and the suspension was incubated for 2 h, at 4 °C. The supernatant was the source of detergent-free, solubilized TNAP. The enzyme was used immediately after detergent removal to avoid aggregation.
2.4. Liposome preparation
DPPC, DPPS and DPPC:DPPS with a molar ratio of 9:1 were dissolved in chloroform and dried under a nitrogen flow. The resulting lipid film was kept under vacuum overnight and resuspended in 50 mmol/L Tris-HCl buffer, pH 7.5, containing 2 mmol/L MgCl2, to yield a final solution with 1.5 mg/mL of lipids. The mixture was incubated for 1 h at 70 °C and vortexed at 10 min intervals. LUVs were prepared by extruding the suspension through 100-nm polycarbonate membranes in a LiposoFast extrusion system (LiposoFast, Sigma-Aldrich). LUVs were prepared and used on the same day [1,24].
2.5. Proteoliposome preparation
TNAP (0.02 mg/mL) and AnxA5 (0.2 mg/mL) were incorporated into 9:1 DPPC:DPPS liposomes dispersed in a 50 mmol/L Tris-HCl buffer, pH 7.5, containing 2 mmol/L MgCl2 by direct insertion in a 1:15,000 and 1:100 protein:lipid ratio, respectively. The mixture was incubated overnight at 25 °C and, then, ultracentrifuged at 100,000 × g for 1 h, at 4 °C. The pellet containing proteoliposomes was resuspended in an appropriate volume of the same buffer. The p-NPPase activity of both pellet and supernatant were measured to determine the percentage of TNAP incorporation into liposomes [1]. To quantify the amount of each protein incorporated into proteoliposomes harboring both TNAP and AnxA5, we treated the proteoliposomes with PIPLC [8] and recovered TNAP after ultracentrifugation in the supernatant and AnxA5 in the pellet. The protein concentration was estimated as described by Hartree [42] in the presence of 2% SDS (0.2 g/mL). Bovine serum albumin was used as a standard. The protein quantifications revealed that TNAP and AnxA5 represented 25% and 75%, respectively, of the total protein incorporated into the proteoliposomes, regardless of the presence of DPPS.
2.6. Dynamic light scattering measurement (DLS)
Liposome and proteoliposome size distributions were determined by dynamic light scattering (DLS) using a N5 Submicron Particle Size Analyzer (Beckman Coulter, Inc., Fullerton, CA) with a 25 mW HeNe laser with fixed scattering angle of 90° as light source. Samples (prepared under the same conditions as described in Sections 2.4 and 2.5) were filtered through 0.8 μm-pore size Millipore® membranes five times before DLS measurements. The average liposome diameters were measured at 25 °C by taking the unimodal distribution [1,24].
2.7. Atomic force microscopy analysis (AFM)
AFM can operate in two modes that differ in the way the tip moves over and interacts with the sample, i.e., static (or contact) mode and dynamic mode, also known as tapping or intermittent contact mode. In contact mode, the cantilevered-tip is continuously in contact with the sample and is deflected by topographic changes. In dynamic mode, a cantilevered-tip vibrating close to its resonant frequency scans the sample and the changes in the amplitude and phase of tip oscillations are recorded to gather information about sample topography and viscoelasticity, respectively. The dynamic mode is advantageous for imaging biological specimens because it diminishes the contact interval between the cantilevered-tip and the sample, thus avoiding changes induced by lateral forces [25,43,44].
Liposome and proteoliposome samples (prepared under the same conditions as described in Sections 2.4 and 2.5) were filtered through 0.8 μm-pore size Millipore® membranes and stabilized by adding 1:1 (v/v) glutaraldehyde (~ 5% final concentration) to avoid vesicle deformation and disruption. The mixtures were homogenized, and then 5 μL of the sample was dropped onto freshly cleaved mica substrates, left to dry at room temperature and imaged by AFM. AFM micrographs were obtained by means of a Shimadzu SPM-9600 Scanning Probe Microscopy (Shimadzu Corporation, Japan) operating in dynamic mode. Scanning was performed in air at 25 °C by using silicon probes with a resonance frequency ranging from 324 to 369 kHz (Nanosensors™, Switzerland). The scan rate was set at 0.2–0.3 Hz to prevent tip-induced vesicle deformations and/or damages. The values of the spring constants of the cantilevers were approximately 38 ± 8 N/m and the values of their resonance frequencies were approximately 336 ± 67 kHz. The roughness values were determined by SPM Offline software, from Shimadzu. The best results obtained from 3 different experiments with distinct samples have been reported. For each analysis, N = 100 vesicles were analyzed.
2.8. Collagen-coated microliter plates
First, type II collagen from bovine nasal septum was dissolved in 50 mM CH3COOH at a concentration of 1.0 mg/mL and stirred for 1 h. Next, the collagen solution was diluted to a final concentration of 125 μg/mL in 50 mM CH3COOH. Fifty (50) microliters of collagen solution were mixed with 200 μL of 50 mmol/L Tris-HCl buffer, pH 7.5, containing 2 mmol/L MgCl2 and added to each well of a 96 wells microplate. The plate was kept covered overnight at 4 °C, emptied and blocked with the same buffer containing 1% BSA (250 μL/well) for 1 h at room temperature. Finally, the plate was washed 3 times with the same buffer without BSA and immediately used to perform binding assays between proteoliposomes and collagen.
2.9. Analysis of binding between proteoliposomes and coated collagen
Proteoliposomes composed by 9:1 DPPC:DPPS (molar ratio) prepared under the same conditions as described in Section 2.5 were labeled with Rhodamine 6G (0.2 mol%) and used to assess the interaction between proteoliposomes and collagen fibers. The wells of a collagen-coated plate were filled with 300 μL of proteoliposome solutions (1.5 mg/mL) and gently shaken in the dark for 2 h at 25 °C. The wells were emptied and washed with 50 mmol/L Tris-HCl buffer, pH 7.5, containing 2 mmol/L MgCl2. The binding measurements were performed in an IN Cell 2000 Analyzer (GE Healthcare Life Sciences, Chicago, Illinois, USA), after quantitative image analysis of bound fluorescence via Image J.
Liposomes (vesicles without protein incorporated) were used as control in the binding assays with collagen. The binding values obtained for liposomes were subtracted from the values obtained for proteoliposomes in order to obtain information about the role of the proteins in the ability of proteoliposomes to bind collagen.
3. Results
3.1. AFM analysis of liposomes
AFM 3D topographic images of DPPC liposomes (Fig. 1A) revealed spherical-like particles with a smooth and homogeneous surface. Next, we imaged liposomes based on a 9:1 DPPC:DPPS (molar ratio) mixture (Fig. 1B), to evaluate the influence of negatively charged DPPS lipids on the morphology of DPPC liposomes. AFM 3D topographic images showed that these vesicles were also spherical but with a rougher surface than DPPC liposomes (Table 1 and Fig. 1B). AFM topographic profiles showed that DPPC and 9:1 DPPC:DPPS liposomes had an average diameter of 204.2 nm and 346.4 nm, respectively (Table 1). All particles were stabilized with glutaraldehyde before being dropped onto mica substrates in order to avoid changes in the organization of vesicle membranes during imaging. In order to confirm that glutaraldehyde treatment did not affect the vesicles’ physical properties, the phase transition temperatures (Tc) of the LUVs membranes constituted by DPPC (1.5 mg/mL) with gradual increasing of glutaraldehyde (GA) were studied by means of differential scanning calorimetry (DSC). The gradual increase of GA into DPPC-liposomes (from 1% to 10%, v/v) did not provide significant changes in the behavior of DSC curves, i.e. there is neither displacement of the main transition temperature peak nor loss of the pre-transition (Supplementary material, Fig. S1). It was observed only a slight broadening of the phase transition peaks, small decreasing of Δt1/2 values, promoting a small decrease in enthalpy values (ΔH) without significantly altering the Tc values (Supplementary material, Table S1).
Fig. 1.

3D topographic AFM images of liposomes (1.5 mg.mL−1) samples composed by (A) DPPC (1000.00 × 1000.00 nm and y axis from 0 to 30.79 nm scales) and (B) 9:1 DPPC:DPPS (molar ratio) (1000.00 × 1000.00 nm and y axis from 0 to 84.50 nm scales).
Table 1.
Biophysical characterization of liposomes and proteoliposomes constituted by DPPC and 9:1 DPPC:DPPS (molar ratio) carrying AnxA5, TNAP or TNAP + AnxA5 by DLS and AFM techniques.
| *Liposome/**Proteoliposome (lipid/protein composition) | DLS | AFM | ||||
|---|---|---|---|---|---|---|
| Diameter (nm) | PI | Diameter (nm) | Height (nm) | Volume × 106 (nm3) | Roughness (nm) | |
| * DPPC | 111.0 ± 0.1 | 0.063 ± 0.015 | 204.2 ± 58.5 | 24.9 ± 4.4 | 0.4 ± 0.2 | 5.3 ± 2.1 |
| * 9:1 DPPC:DPPS | 107.7 ± 0.4 | 0.056 ± 0.040 | 346.4 ± 94.3 | 70.2 ± 15.2 | 4.5 ± 3.0 | 14.9 ± 6.9 |
| ** 9:1 DPPC:DPPS - AnxA5 | 125.2 ± 31.9 | 0.462 ± 0.457 | 357.2 ± 101.0 | 35.5 ± 7.6 | 2.4 ± 1.7 | 10.5 ± 3.2 |
| ** 9:1 DPPC:DPPS - TNAP | 124.1 ± 19.5 | 0.266 ± 0.133 | 531.2 ± 161.3 | 26.3 ± 3.9 | 3.6 ± 3.3 | 5.2 ± 1.6 |
| ** 9:1 DPPC:DPPS - TNAP + AnxA5 | 158.5 ± 33.7 | 0.307 ± 0.388 | 489.8 ± 141.2 | 36.3 ± 8.9 | 4.5 ± 3.1 | 9.5 ± 4.9 |
3.2. AFM analysis of proteoliposomes
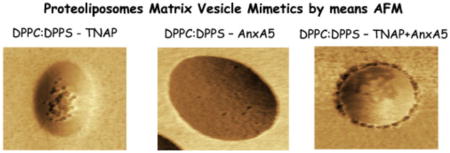
AFM images of TNAP-containing 9:1 DPPC:DPPS proteoliposomes are shown in Fig. 2. Topographic images showed the presence of surface protrusions (Fig. 2B and D), which matched spots with lower phase angle shift values in phase images (Fig. 2A). These protrusions formed by TNAP (Fig. 2C) on the surface of liposomes had a diameter of 58.2 ± 3.8 nm and a height of 0.98 ± 0.26 nm (N = 100).
Fig. 2.

AFM images of 9:1 DPPC:DPPS proteoliposomes (0.75 mg.mL−1) containing TNAP: (A) phase image; (B) 2D topographic profile; (C) Height analysis of domains formed by TNAP insertion on the surface of liposomes (graphics obtained from line 4); (D) 3D topographic profile and (E) zoomed detail at the surface of only one vesicle (472.03 × 472.03 nm and y axis from 0 to 28.96 nm scales).
Insertion of AnxA5 into 9:1 DPPC:DPPS liposomes led to the formation of surface protrusions more homogeneously distributed than those formed by the addition of TNAP (Fig. 3A and D). The protrusions formed by AnxA5 (Fig. 3B and C) on the surface of liposomes were less evident (height < 0.5 nm, Fig. 3E) than those formed by TNAP (Fig. 2E), thus, the accurate measurement of their height was not possible. Proteoliposomes produced by adding both AnxA5 and TNAP to 9:1 DPPC:DPPS liposomes exhibited on their surface clusters of protrusions larger (size) than those observed on the surface of proteoliposomes harboring AnxA5 or TNAP alone (Fig. 4A, B and D). Topographical images (4C and 4E) also show height of domains formed by both proteins in the surface of liposomes.
Fig. 3.

AFM images in phase mode of 9:1 DPPC:DPPS proteoliposomes (0.75 mg.mL−1) containing AnxA5: (A) phase image; (B) 2D topographic profile; (C) Height analysis of domains formed by AnxA5 on the surface of liposomes (first graphic obtained from line 4 and second graphic obtained from line 8); (D) 3D topographic profile and (E) zoomed detail at the surface of only one vesicle (312.50 × 312.50 nm and y axis from 0 to 34.67 nm scales).
Fig. 4.

AFM images of 9:1 DPPC:DPPS proteoliposomes (0.75 mg.mL−1) containing AnxA5 + TNAP: (A) phase image with 2.0 μm scale bar; (B) phase image with 500 nm scale bar; (C) 2D topographic profile; (D) 3D topographic surface profile of only one vesicle (1.25 × 1.25 m and y axis from 0 to 21.92 nm scales) and (E) Height analysis of domains formed by both proteins in the surface of liposomes (graphic obtained from line 3).
The values of proteoliposomes diameter obtained by AFM were considerably higher than those obtained by DLS measurements (Table 1). Proteoliposomes harboring TNAP and AnxA5 (alone or concomitantly) showed a roughness that was lower than that of 9:1 DPPC:DPPS liposomes but greater than that of DPPC liposomes (Table 1).
3.3. Binding affinity analysis between proteoliposomes and collagen matrix
For this study, we used 9:1 DPPC:DPPS proteoliposomes harboring AnxA5, and/or TNAP. These proteoliposomes were labeled with rhodamine and incubated with type II collagen-coated substrates. Proteoliposomes bound the collagen matrix with different affinity. Vesicles harboring AnxA5 showed the highest affinity for type II collagen with 74% binding, whereas those harboring TNAP and both AnxA5 and TNAP showed relative binding affinities of approximately 20% and 30%, respectively (Fig. 5).
Fig. 5.

Effect of AnxA5, TNAP and AnxA5 + TNAP on the binding percentage of 9:1 DPPC:DPPS-proteoliposome to type II collagen matrix, by fluorescence microscopy. The vesicles (450 μg/mL, lipid concentration incubated) were labeled with Rhodamine 6G (0.2 mol%) and the analysis as described in Material and Methods: White bar proteoliposomes harboring A5; Black bar proteoliposomes harboring TNAP and Striped bar proteoliposomes harboring TNAP + AnxA5. The asterisks indicate significant differences (p < 0.001).
4. Discussion
4.1. Advantages of using AFM phase imaging
Liposomes and proteoliposomes are soft samples and can be deformed by the forces applied during AFM imaging in contact mode. Moreover, these vesicles adhere weakly to the substrate and can be easily displaced or destroyed by the lateral forces that arise during scanning if the cantilevered-tip interacts with the sample for a sufficiently prolonged time. Although the disruptive effect of AFM cantilevered-tips during scanning cannot be completely avoided, the AFM dynamic mode was chosen to image our samples [29,45–47]. In dynamic mode, AFM enables to record phase images by monitoring the shift between the phase angle of the cantilever oscillations relatively to that of the drive signal. When the cantilevered-tip comes close enough to the sample surface, the interaction between the tip and the sample leads to a shift in the phase angle of the cantilever oscillations. This change in the phase angle of cantilever oscillations is related to the viscoelasticity of the sample. Thus, phase imaging allows to expand sample analysis over the simple topography and to reveal differences in surface viscosity, elasticity and viscoelasticity, as the tip experiences different adhesive/repulsive interactions while scanning the sample [45,48–53].
Since proteins and lipids have different physical properties, the presence of proteins within lipid membranes can be detected as surface regions with distinct phase angle shifts in AFM phase images, thus enabling the mapping of single proteins as well as protein aggregates on lipid membranes. The way in which proteins organize within and/or onto biomaterials strongly affects their interactions with cells and bacteria. Thus, a precise 3-dimensional characterization of surface features at the nanoscale is crucial for understanding the biological responses of nanostructured biomaterials [45,54,55].
4.2. Advantages and disadvantages of using fixation methods in AFM experiments imaging liposomes and proteoliposomes
Several investigators have attempted to better understand the interactions between proteins and lipids by using mimetic biomembranes. These model systems enable detailed analyses of how lipids influence the structure and dynamics of proteins and, conversely, how proteins affect the behavior of lipid bilayers [13]. The literature contains numerous AFM-based studies on lipid-lipid, lipid-peptide and peptide-peptide interactions, which have provided fundamental insights, impossibly provided by other techniques [56–58]. Most of these studies reported analysis at the nanoscale of microdomain structures on supported bilayers (SBLs) formed by vesicle fusion at high temperature, followed by deposition on a flat surface. Although this methodology allows the observation of microdomains, it leads to a high degree of perturbation, causing vesicles to lose their original spherical shape [56–58]. Our approach enabled to assess lipid-protein interactions on intact vesicles. This new approach is based on a technique similar to that of cell fixation performed to assess cell morphology through light or electron microscopy. Cell fixation is mostly carried out using alcohols and aldehydes, however fixation based on aldehydes performs better than that based on alcohols, since aldehydes cross-link biomacromolecules on cell membrane while maintaining the integrity of the membrane [59]. Fixation based on glutaraldehyde enabled to observe the ultrastructure of bacteria cell membrane [60]. Once liposomes and proteoliposomes are soft samples and can be pierced by the sharp tip at the end of the AFM cantilever, we have used glutaraldehyde to embed the vesicles into a polymeric shell. Our data showed that glutaraldehyde treatment protected the vesicles from rupture while drying on mica substrates, did not affect the vesicles’ physical properties (e.g., roughness, fluidity and Supplementary results) and prevented damages to vesicles during raster scanning. Hollmann et al. [61], who have shown absence of changes in the liposome surface properties after glutaraldehyde treatment by zeta potential, also validated our findings. However, our approach, based on glutaraldehyde-coated vesicles imaged by an AFM probe raster scanning the sample in air, suffers from some weaknesses. First, vesicles partially lost their spherical shape while drying onto mica substrates and acquired an oblate spheroid shape, thus leading to diameter values obtained by AFM analysis greater than those obtained by means of DLS. Additionally, the drying process, which is necessary to perform AFM measurements in air, could have led to a partial rearrangement of proteins and lipids on the vesicles’ surface. In order to avoid these phenomena and validate our approach, analyses of liposomes and proteoliposomes in a hydrated state are warranted. The analysis of vesicles in a hydrated state will necessitate to raster scan the sample by means of an AFM probe immersed in liquid, which may slightly decrease the sensitivity of the microscope and make difficult to visualize fine details of vesicle membrane surface. Additionally, the presence of the liquid in the measurement chamber may drag away the vesicles from the substrate, thus requesting to stably anchor the vesicles on the mica substrate by means of strong interactions between moieties protruding from the vesicles’ surface and functional groups conjugated to the substrate. The development of an approach aimed at analyzing vesicles in a hydrated state by means of AFM is ongoing and will be the subject of future publications.
4.3. Liposomes characterization by AFM
Our results with DPPC liposomes showed spherical-like particles with a smooth surface, suggesting that sample preparation and AFM scanning did not disrupt the vesicles. Three-dimensional topographic images showed that the particles had a homogeneous surface, as expected for one-lipid component liposomes and no lipid phase transitions. The small distortion of the spherical shape can be explained by considering that the drying procedure may have caused a certain degree of flattening and/or distortion in the particles’ diameter [29]. Indeed, the interaction between the liposomes and the substrate, as well as the movement of the cantilevered-tip over the particles, can induce deformations [62] depending mainly on vesicle composition [63].
Liposomes based on a 9:1 DPPC:DPPS (molar ratio) also showed topographic images with spherical vesicles but with a rougher surface than DPPC liposomes. Similar results were described previously using freeze-fracture electron microscopy and spin-label data by Luna and McConnell [64]. The AFM cantilevered-tip did not cause significant sample distortions during imaging, as the trace and retrace images were almost identical (data not shown). The diameter of the liposomes calculated by AFM was higher than that recorded by DLS in solution. Differences between liposome diameter measured by AFM and DLS were also reported by Mao et al. [65] and Ruozi et al. [48,66] and can be explained by vesicle flattening due to the interaction with the substrate surface. Besides that, when compared differences in size measurements between different analytical tools, it is also important to consider the preparation methodology, polydispersity and structural properties of the samples.
4.4. Proteoliposomes characterization by AFM
AFM images of TNAP-containing 9:1 DPPC:DPPS proteoliposomes showed the presence of regions protruding from the surface (Fig. 2B and D), and having phase angle shift values lower than those of other regions of the proteoliposomes’ surface (Fig. 2A). Using AFM in moderate/soft tapping mode, spots with higher (resp. lower) phase angle shift values in AFM phase images correspond to regions with a higher (resp. lower) stiffness values [67,68]. Thus, our findings illustrate the existence of TNAP-rich (or TNAP-induced) regions on the surface of TNAP-containing 9:1 DPPC:DPPS proteoliposomes with lower stiffness (higher fluidity) with respect to regions of the membrane composed exclusively by lipids.
Insertion of AnxA5 into 9:1 DPPC:DPPS liposomes also led to the formation of surface protrusions but more homogeneously distributed and less evident than those formed by the addition of TNAP (Fig. 3). Proteoliposomes composed by 9:1 DPPC:DPPS and harboring both
AnxA5 and TNAP concomitantly exhibited larger (size) and more clustered protrusions than those observed on the surface of proteoliposomes harboring AnxA5 or TNAP alone. Phase imaging revealed that these protrusions were formed by an annular region with low phase angle shift values surrounding a central region with greater phase angle shift values (Fig. 4B). This result suggests that, when AnxA5 and TNAP are simultaneously present within a lipid membrane, they organize themselves in more complex geometries, suggestive of mutual interactions between both proteins in the lipid membrane. Thus, future studies by means of others methodologies (e.g. immunofluorescence) will be necessary in order to elucidate if the proteins are co-localized in segregated regions with specific fluidity and charge.
Proteoliposomes diameter obtained by AFM were considerable higher than those obtained by DLS measurements, suggesting a flattening effect caused during the measurements by means of AFM, as observed for liposomes measurements.
TNAP act as enzyme dimers with a molecular weight twice that of the monomer, i.e. around 130 kDa [9]. Taking into account that APs are extracellular enzymes, inserted into cell membranes exclusively via a C-terminal GPI-anchor [69], our findings suggest that the observed surface protrusions corresponded to individual TNAP dimers, further organized into larger structures, such as GPI-anchor controlled tetramers [9]. In contrast, AnxA5 has a transmembrane organization and the phosphatidylserine-rich bilayers can induce the formation of hexameric structures [12].
Wang et al. [70] studied the role of bound charged nanoparticles on the fluidity of liposome membranes by fluorescence microscopy and calorimetry. They found that negatively charged nanoparticles induced the gelation of a fluid area, whereas positively charged nanoparticles had the opposite effect. Additionally, the change in fluidity was independent of lipid composition, liposome size or nanoparticle size, but did depend on the charge density and location on nanoparticle surface. In our study, AFM images obtained in dynamic mode enabled the identification of differences in fluidity among distinct regions of the liposome surface. Considering that protein molecules are naturally charged nanoparticles, when proteins are incorporated within supported lipid bilayers or liposome membranes, it is possible to identify the charge density of exposed protein moieties by changes in local membrane fluidity measured via variations in phase angle shift in AFM images (Fig. 4). According to Wang et al. [70], the charges of AnxA5 and TNAP inserted within the proteoliposomes membrane lead to changes in the local fluidity of the lipid bilayer (Fig. 4B). Since we used AFM in moderate/soft tapping mode to scan our samples, stiffer (less fluid) regions exhibited higher phase angles shifts with respect to softer (more fluid) regions, that is, less fluid regions appeared brighter than more fluid ones in phase images. A dark annular region surrounded the vesicles in AFM phase images in Fig. 4, when both TNAP and AnxA5 were simultaneously inserted, suggesting that positive charges clustered around the proteoliposomes upon vesicle deposition onto mica substrates. This phenomenon was probably caused by the negative charge of the substrate. In this regard, silica surface may have selectively recruited AnxA5 and TNAP, triggering the dark annular distribution, indicating that AnxA5 and TNAP were co-localized. However, only few small dark spots appeared on the surface of vesicles in phase images of proteoliposomes harboring AnxA5 (Fig. 3), suggesting that the presence of protein charge within the membrane induced only slight decrease in local lipid fluidity. Alternatively, the dark spots could be interpreted as the proteins themselves, which had different viscoelastic properties, respective to the lipid membrane. Since the dark spots in phase images matched protrusions in topographical images, the last hypothesis seems the most plausible. Additionally, AnxA5 protrudes much less from the surface, as presently confirmed via AFM, in addition being more homogeneously distributed over the vesicles’ surface. The small height (< 0.5 nm) of these protrusions is compatible with the hypothesis of transmembrane channel formation by AnxA5. Thus, we conclude that only a small portion of the AnxA5 molecule protruded from the lipid bilayer, resulting in membrane regions having slightly greater height and lower fluidity than portions of membrane devoid of proteins.
Similar observations can be made for proteoliposomes harboring TNAP (Fig. 2). However, TNAP is a peripheral GPI-anchored protein, thus it induces higher and larger protrusions on the proteoliposomes’ surface than those generated by AnxA5 as observed by 3D topographic profiles (Figs. 2D and 3D, respectively).
The different roughness values observed for proteoliposomes harboring TNAP and AnxA5 (alone or concomitantly) suggest that negative charges of 9:1 DPPC:DPPS liposomes did not uniformly distribute on the surface of vesicles in the presence of proteins. We hypothesize that negatively charged DPPS are clustered around protein domains, thus decreasing the average roughness of the vesicles’ surface. AnxA5 has high affinity for PS. The driving force for MV mineralization is a NC composed by amorphous calcium phosphate (ACP) complexed with PS, to form calcium–phosphate–lipid (PS-ACP) complexes, and by AnxA5, the principal lipid-dependent Ca2 +-binding protein in MVs. More than any other protein present in the membrane of MVs, AnxA5 greatly accelerates NC activity by binding to PS-ACP complexes and trigger the de novo formation of calcium phosphate minerals inside MVs [5]. Previous data also suggest that negatively charged lipids cluster around TNAP molecules inserted in proteoliposomes and influence hydrolysis of different TNAP substrates, with a higher effect on PPi relatively to other substrates [8]. Thus, the lipid charge plays a crucial role in the interaction of proteins with lipids and affects their catalytic activity.
4.5. Proteoliposomes binding affinity to collagen matrix
DPPC and 9:1 DPPC:DPPS proteoliposomes harboring AnxA5, TNAP, or both TNAP and AnxA5 have been previously studied by our research group [8]. The enzymatic activity, Ca2 + uptake and phase contrast microscopy of giant proteoliposomes validated the functional incorporation of both proteins in MV biomimetic membranes. AnxA5 mediated Ca2 +-influx into both DPPC and 9:1 DPPC:DPPS proteoliposomes at physiological Ca2 + concentrations and this process was not affected by the presence of TNAP. However, the presence of AnxA5 and DPPS significantly affected the hydrolysis of TNAP substrates [8].
Binding affinity assay were performed in order to evaluate if the presence of TNAP within the membrane of proteoliposomes alters the interaction of vesicles harboring AnxA5 with collagen fibers. Proteoliposomes bound to the collagen matrix with different affinities. These results clearly showed that AnxA5 on proteoliposomes has an affinity for type II collagen fibers greater than that of TNAP on similar vesicles. Surprisingly, the presence of both proteins on the same vesicle strongly affected the role of AnxA5 during binding. This effect can be related to the different structure of the surface protrusions formed by insertion of AnxA5, when combined with TNAP, as shown by the AFM images (Fig. 4). These images suggest that, when both AnxA5 and TNAP are inserted in vesicle membranes, they cluster to form annular regions with high fluidity (dark annular spots), which surround regions with lower fluidity (bright spots). The central regions with lower fluidity had probably a high concentration of negatively charged lipids, which was the driving force for the formation of the annular protein-rich region. A similar cluster of negatively charged lipids, a “lipid annulus”, would be expected to also surround the regions with high fluidity, however the sensitivity of our instrument was not sufficient to resolve this region [71,72]. This organization caused by the insertion of AnxA5 and TNAP in the lipid bilayer may lead to steric impediment for the interaction of AnxA5 with collagen fibers. Further investigations about the spatial disposition of TNAP and AnxA5 within lipid membranes are warranted.
5. Conclusions
AFM is a very suitable technique to identify proteins on vesicle surfaces due to its ability to detect differences in membrane viscoelasticity. To the best of our knowledge, AFM studies on proteoliposomes as those presented here have not been previously reported. Although AFM has been used to analyze membranes, these analyses were mostly performed using supported lipid bilayers [43,44,70], i.e. only few studies have used intact liposomes [25,66,73]. In the present study, we have applied AFM to obtain topographic and phase images of intact proteoliposomes composed by DPPC and 9:1 DPPC:DPPS, harboring AnxA5, TNAP or both. Intact vesicles could be imaged without the need for fluorescent dyes, vesicle fusion and deposition on supported bilayers. Phase images of proteoliposomes evidenced the possibility to identify proteins on the surface of 9:1 DPPC:DPPS liposomes and indicate the existence of regions with different chemical compositions formed by proteins or induced by the presence of proteins in the lipid bilayer. In a previous study, the insertion of TNAP and AnxA5 into proteoliposomes membranes generated a phospholipid microenvironment that enabled us to study the kinetics of phospho-substrate catabolism in a setting mimicking the native MV microenvironment [8]. The present AFM study provides basic yet crucial information about the structure of lipid-protein microdomains on the surface of MVs that other microscopy techniques could not have provided. Since our experimental approach can provide information on specific regions on more complex protein-containing lipid vesicles, it can be exploited to shed the light on processes involving lateral heterogeneity on cellular membranes, including domain-induced budding and possibly MV formation, both of which are considered critical for the biomineralization process [5,74].
Supplementary Material
Highlights.
AFM analysis suggested that proteins can induce local changes in membrane fluidity.
Phase images evidenced the possibility to identify proteins on the liposomes surface.
Distinct proteins induce the microdomains formation with distinct morphologies.
Proteoliposomes harboring AnxA5 showed the highest affinity for type II collagen.
TNAP presence may lead to steric impediment for AnxA5 interaction to collagen fibers.
Acknowledgments
The authors thank FAPESP (2014/11941-3 and 2014/00371-1), CAPES (7124/12-0) and CNPq (306166/2013-5) for the financial support given to our laboratory. MB and AMSS received a FAPESP and CAPES scholarship, respectively. PC also acknowledges CNPq for research fellowships. This work was also supported in part by grants DE12889 and AR53102 from the National Institutes of Health (USA) and by grants from the Arthritis National Research Foundation, respectively. The authors thank Dr. R. Itri (University of São Paulo, SP, Brazil) for the helpful comments.
Appendix A. Supplementary data
AFM characterization of proteoliposomes harboring lipids and proteins mimicking matrix vesicles involved in the biomineralization process.
Footnotes
Transparency document
Transparency document.
References
- 1.Bolean M, Simao AM, Favarin BZ, Millan JL, Ciancaglini P. The effect of cholesterol on the reconstitution of alkaline phosphatase into liposomes. Biophys Chem. 2010;152:74–79. doi: 10.1016/j.bpc.2010.08.002. [DOI] [PubMed] [Google Scholar]
- 2.Wuthier RE. Lipids of matrix vesicles. Fed Proc. 1976;35:117–121. [PubMed] [Google Scholar]
- 3.Anderson HC. Mineralization by matrix vesicles Scan. Electron Microsc. 1984:953–964. [PubMed] [Google Scholar]
- 4.Thouverey C, Strzelecka-Kiliszek A, Balcerzak M, Buchet R, Pikula S. Matrix vesicles originate from apical membrane microvilli of mineralizing osteoblast-like Saos-2 cells. J Cell Biochem. 2009;106:127–138. doi: 10.1002/jcb.21992. [DOI] [PubMed] [Google Scholar]
- 5.Wuthier RE, Lipscomb GF. Matrix vesicles: structure, composition, formation and function in calcification. Front Biosci. 2011;16:2812–2902. doi: 10.2741/3887. [DOI] [PubMed] [Google Scholar]
- 6.Balcerzak M, Hamade E, Zhang L, Pikula S, Azzar G, Radisson J, Bandorowicz-Pikula J, Buchet R. The roles of annexins and alkaline phosphatase in mineralization process. Acta Biochim Pol. 2003;50:1019–1038. [PubMed] [Google Scholar]
- 7.Golub EE. Biomineralization and matrix vesicles in biology and pathology. Semin Immunopathol. 2011;33:409–417. doi: 10.1007/s00281-010-0230-z. [DOI] [PMC free article] [PubMed] [Google Scholar]
- 8.Bolean M, Simao AM, Kiffer-Moreira T, Hoylaerts MF, Millan JL, Itri R, Ciancaglini P. Proteoliposomes with the ability to transport Ca(2 +) into the vesicles and hydrolyze phosphosubstrates on their surface. Arch Biochem Biophys. 2015;584:79–89. doi: 10.1016/j.abb.2015.08.018. [DOI] [PMC free article] [PubMed] [Google Scholar]
- 9.Millan JL. The role of phosphatases in the initiation of skeletal mineralization. Calcif Tissue Int. 2013;93:299–306. doi: 10.1007/s00223-012-9672-8. [DOI] [PMC free article] [PubMed] [Google Scholar]
- 10.Le Du MH, Millan JL. Structural evidence of functional divergence in human alkaline phosphatases. J Biol Chem. 2002;277:49808–49814. doi: 10.1074/jbc.M207394200. [DOI] [PubMed] [Google Scholar]
- 11.Millán JL. Mammalian Alkaline Phosphatases: From Biology to Applications in Medicine and Biotechnology. 2006 [Google Scholar]
- 12.Kirsch T, Nah HD, Demuth DR, Harrison G, Golub EE, Adams SL, Pacifici M. Annexin V-mediated calcium flux across membranes is dependent on the lipid composition: implications for cartilage mineralization. Biochemistry. 1997;36:3359–3367. doi: 10.1021/bi9626867. [DOI] [PubMed] [Google Scholar]
- 13.Huber R, Romisch J, Paques EP. The crystal and molecular-structure of human Annexin-V, an anticoagulant protein that binds to calcium and membranes. EMBO J. 1990;9:3867–3874. doi: 10.1002/j.1460-2075.1990.tb07605.x. [DOI] [PMC free article] [PubMed] [Google Scholar]
- 14.vonderMark K, Mollenhauer J. Annexin V interactions with collagen. Cell Mol Life Sci. 1997;53:539–545. doi: 10.1007/s000180050069. [DOI] [PMC free article] [PubMed] [Google Scholar]
- 15.Kim HJ, Kirsch T. Collagen/annexin V interactions regulate chondrocyte mineralization. J Biol Chem. 2008;283:10310–10317. doi: 10.1074/jbc.M708456200. [DOI] [PMC free article] [PubMed] [Google Scholar]
- 16.Ciancaglini P, Simao AM, Bolean M, Millán JL, Rigos CF, Yoneda JS, Colhone MC, Stabeli RG. Proteoliposomes in nanobiotechnology. Biophys Rev. 2012;4:67–81. doi: 10.1007/s12551-011-0065-4. [DOI] [PMC free article] [PubMed] [Google Scholar]
- 17.Benech RO, Kheadr EE, Laridi R, Lacroix C, Fliss I. Inhibition of Listeria innocua in cheddar cheese by addition of nisin Z in liposomes or by in situ production in mixed culture. Appl Environ Microbiol. 2002;68:3683–3690. doi: 10.1128/AEM.68.8.3683-3690.2002. [DOI] [PMC free article] [PubMed] [Google Scholar]
- 18.Shehata T, Ogawara K, Higaki K, Kimura T. Prolongation of residence time of liposome by surface-modification with mixture of hydrophilic polymers. Int J Pharm. 2008;359:272–279. doi: 10.1016/j.ijpharm.2008.04.004. [DOI] [PubMed] [Google Scholar]
- 19.Akbarzadeh A, Rezaei-Sadabady R, Davaran S, Joo SW, Zarghami N, Hanifehpour Y, Samiei M, Kouhi M, Nejati-Koshki K. Liposome: classification, preparation, and applications. Nanoscale Res Lett. 2013;8 doi: 10.1186/1556-276X-8-102. [DOI] [PMC free article] [PubMed] [Google Scholar]
- 20.Gao WW, Thamphiwatana S, Angsantikul P, Zhang LF. Nanoparticle approaches against bacterial infections WIREs. Nanomed Nanobiotechnol. 2014;6:532–547. doi: 10.1002/wnan.1282. [DOI] [PMC free article] [PubMed] [Google Scholar]
- 21.Mikhaylov G, Mikac U, Magaeva AA, Itin VI, Naiden EP, Psakhye I, Babes L, Reinheckel T, Peters C, Zeiser R, Bogyo M, Turk V, Psakhye SG, Turk B, Vasiljeva O. Ferri-liposomes as an MRI-visible drug-delivery system for targeting tumours and their microenvironment. Nat Nanotechnol. 2011;6:594–602. doi: 10.1038/nnano.2011.112. [DOI] [PubMed] [Google Scholar]
- 22.Wang LG, Tonggu LG. Membrane protein reconstitution for functional and structural studies. Sci China Life Sci. 2015;58:66–74. doi: 10.1007/s11427-014-4769-0. [DOI] [PubMed] [Google Scholar]
- 23.Vist MR, Davis JH. Phase-equilibria of cholesterol dipalmitoylphosphatidylcholine mixtures - H-2 nuclear magnetic-resonance and differential scanning calorimetry. Biochemistry. 1990;29:451–464. doi: 10.1021/bi00454a021. [DOI] [PubMed] [Google Scholar]
- 24.Bolean M, Simao AM, Favarin BZ, Millan JL, Ciancaglini P. Thermodynamic properties and characterization of proteoliposomes rich in microdomains carrying alkaline phosphatase. Biophys Chem. 2011;158:111–118. doi: 10.1016/j.bpc.2011.05.019. [DOI] [PMC free article] [PubMed] [Google Scholar]
- 25.Ruozi B, Belletti D, Tombesi A, Tosi G, Bondioli L, Forni F, Vandelli MA. AFM, ESEM, TEM, and CLSM in liposomal characterization: a comparative study. Int J Nanomedicine. 2011;6:557–563. doi: 10.2147/IJN.S14615. [DOI] [PMC free article] [PubMed] [Google Scholar]
- 26.Fodiadis D, Engel A. Imaging and manipulation of biological structures with the atomic force microscope. Abstr Pap Am Chem Soc. 2002;223:C31. [Google Scholar]
- 27.Langer MG, Koitschev A, Haase H, Rexhausen U, Horber JKH, Ruppersberg JP. Mechanical stimulation of individual stereocilia of living cochlear hair cells by atomic force microscopy. Ultramicroscopy. 2000;82:269–278. doi: 10.1016/s0304-3991(99)00136-9. [DOI] [PubMed] [Google Scholar]
- 28.Madl J, Rhode S, Stangl H, Stockinger H, Hinterdorfer P, Schutz GJ, Kada G. A combined optical and atomic force microscope for live cell investigations. Ultramicroscopy. 2006;106:645–651. doi: 10.1016/j.ultramic.2005.12.020. [DOI] [PubMed] [Google Scholar]
- 29.Tomankova K, Kolarova H, Vujtek M, Zapletalova H. Study of Cancer Cells Used Atomic Force Microscopy. 2007 [PubMed] [Google Scholar]
- 30.Fujita M, Mizutani W, Gad M, Shigekawa H, Tokumoto H. Patterning DNA on mu m scale on mica. Ultramicroscopy. 2002;91:281–285. doi: 10.1016/s0304-3991(02)00110-9. [DOI] [PubMed] [Google Scholar]
- 31.Yu M, Ivanisevic A. Encapsulated cells: an atomic force microscopy study. Biomaterials. 2004;25:3655–3662. doi: 10.1016/j.biomaterials.2003.10.061. [DOI] [PubMed] [Google Scholar]
- 32.Kienberger F, Stroh C, Kada G, Moser R, Baumgartner W, Pastushenko V, Rankl C, Schmidt U, Muller H, Orlova E, LeGrimellec C, Drenckhahn D, Blaas D, Hinterdorfer P. Dynamic force microscopy imaging of native membranes. Ultramicroscopy. 2003;97:229–237. doi: 10.1016/S0304-3991(03)00047-0. [DOI] [PubMed] [Google Scholar]
- 33.Kumar S, Chaudhury K, Sen P, Guha SK. Atomic force microscopy: a powerful tool for high-resolution imaging of spermatozoa. J Nanobiotechnol. 2005;3:9. doi: 10.1186/1477-3155-3-9. [DOI] [PMC free article] [PubMed] [Google Scholar]
- 34.Radmacher M, Cleveland JP, Fritz M, Hansma HG, Hansma PK. Mapping interaction forces with the atomic-force microscope. Biophys J. 1994;66:2159–2165. doi: 10.1016/S0006-3495(94)81011-2. [DOI] [PMC free article] [PubMed] [Google Scholar]
- 35.Radmacher M, Fritz M, Kacher CM, Cleveland JP, Hansma PK. Measuring the viscoelastic properties of human platelets with the atomic force microscope. Biophys J. 1996;70:556–567. doi: 10.1016/S0006-3495(96)79602-9. [DOI] [PMC free article] [PubMed] [Google Scholar]
- 36.Vinckier A, Semenza G. Measuring elasticity of biological materials by atomic force microscopy. FEBS Lett. 1998;430:12–16. doi: 10.1016/s0014-5793(98)00592-4. [DOI] [PubMed] [Google Scholar]
- 37.Chang KC, Chiang YW, Yang CH, Liou JW. Atomic force microscopy in biology and biomedicine. Tzu Chi Med J. 2012;24:162–169. [Google Scholar]
- 38.Logue SE, Elgendy M, Martin SJ. Expression, purification and use of recombinant annexin V for the detection of apoptotic cells. Nat Protoc. 2009;4:1383–1395. doi: 10.1038/nprot.2009.143. [DOI] [PubMed] [Google Scholar]
- 39.Simao AM, Beloti MM, Cezarino RM, Rosa AL, Pizauro JM, Ciancaglini P. Membrane-bound alkaline phosphatase from ectopic mineralization and rat bone marrow cell culture. Comp Biochem Physiol A Mol Integr Physiol. 2007;146:679–687. doi: 10.1016/j.cbpa.2006.05.008. [DOI] [PubMed] [Google Scholar]
- 40.Ciancaglini P, Simao AM, Camolezi FL, Millan JL, Pizauro JM. Contribution of matrix vesicles and alkaline phosphatase to ectopic bone formation. Braz J Med Biol Res [Revista brasileira de pesquisas medicas e biologicas] 2006;39:603–610. doi: 10.1590/s0100-879x2006000500006. [DOI] [PubMed] [Google Scholar]
- 41.Camolezi FL, Daghastanli KR, Magalhaes PP, Pizauro JM, Ciancaglini P. Construction of an alkaline phosphatase-liposome system: a tool for biomineralization study. Int J Biochem Cell Biol. 2002;34:1091–1101. doi: 10.1016/s1357-2725(02)00029-8. [DOI] [PubMed] [Google Scholar]
- 42.Hartree EF. Determination of protein: a modification of the Lowry method that gives a linear photometric response. Anal Biochem. 1972;48:422–427. doi: 10.1016/0003-2697(72)90094-2. [DOI] [PubMed] [Google Scholar]
- 43.Goksu EI, Vanegas JM, Blanchette CD, Lin WC, Longo ML. AFM for structure and dynamics of biomembranes. Biochim Biophys Acta. 2009;1788:254–266. doi: 10.1016/j.bbamem.2008.08.021. [DOI] [PubMed] [Google Scholar]
- 44.Morandat S, Azouzi S, Beauvais E, Mastouri A, El Kirat K. Atomic force microscopy of model lipid membranes. Anal Bioanal Chem. 2013;405:1445–1461. doi: 10.1007/s00216-012-6383-y. [DOI] [PubMed] [Google Scholar]
- 45.Variola F. Atomic force microscopy in biomaterials surface science. Phys Chem Chem Phys. 2015;17:2950–2959. doi: 10.1039/c4cp04427d. [DOI] [PubMed] [Google Scholar]
- 46.You HX, Lau JM, Zhang S, Yu L. Atomic force microscopy imaging of living cells: a preliminary study of the disruptive effect of the cantilever tip on cell morphology. Ultramicroscopy. 2000;82:297–305. doi: 10.1016/s0304-3991(99)00139-4. [DOI] [PubMed] [Google Scholar]
- 47.Lehenkari PP, Charras GT, Nykanen A, Horton MA. Adapting atomic force microscopy for cell biology. Ultramicroscopy. 2000;82:289–295. doi: 10.1016/s0304-3991(99)00138-2. [DOI] [PubMed] [Google Scholar]
- 48.Ruozi B, Tosi G, Leo E, Vandelli MA. Application of atomic force microscopy to characterize liposomes as drug and gene carriers. Talanta. 2007;73:12–22. doi: 10.1016/j.talanta.2007.03.031. [DOI] [PubMed] [Google Scholar]
- 49.Tamayo J, Garcia R. Deformation, contact time, and phase contrast in tapping mode scanning force microscopy. Langmuir. 1996;12:4430–4435. [Google Scholar]
- 50.James PJ, Antognozzi M, Tamayo J, McMaster TJ, Newton JM, Miles MJ. Interpretation of contrast in tapping mode AFM and shear force microscopy. A study of nafion. Langmuir. 2001;17:349–360. [Google Scholar]
- 51.Feigenson GW, Buboltz JT. Ternary phase diagram of dipalmitoyl-PC/dilauroyl-PC/cholesterol: nanoscopic domain formation driven by cholesterol. Biophys J. 2001;80:2775–2788. doi: 10.1016/S0006-3495(01)76245-5. [DOI] [PMC free article] [PubMed] [Google Scholar]
- 52.Tokumasu F, Jin AJ, Dvorak JA. Lipid membrane phase behaviour elucidated in real time by controlled environment atomic force microscopy. J Electron Microsc. 2002;51:1–9. doi: 10.1093/jmicro/51.1.1. [DOI] [PubMed] [Google Scholar]
- 53.Tokumasu F, Jin AJ, Feigenson GW, Dvorak JA. Atomic force microscopy of nanometric liposome adsorption and nanoscopic membrane domain formation. Ultramicroscopy. 2003;97:217–227. doi: 10.1016/S0304-3991(03)00046-9. [DOI] [PubMed] [Google Scholar]
- 54.Lord MS, Foss M, Besenbacher F. Influence of nanoscale surface topography on protein adsorption and cellular response. Nano Today. 2010;5:66–78. [Google Scholar]
- 55.Biggs MJP, Richards RG, Dalby MJ. Nanotopographical modification: a regulator of cellular function through focal adhesions. Nanomed Nanotechnol. 2010;6:619–633. doi: 10.1016/j.nano.2010.01.009. [DOI] [PMC free article] [PubMed] [Google Scholar]
- 56.Giocondi MC, Yamamoto D, Lesniewska E, Milhiet PE, Ando T, Le Grimellec C. Surface topography of membrane domains. Biochim Biophys Acta Biomembr. 2010;1798:703–718. doi: 10.1016/j.bbamem.2009.09.015. [DOI] [PubMed] [Google Scholar]
- 57.Giocondi MC, Besson F, Dosset P, Milhiet PE, Le Grimellec C. Temperature-dependent GPI-anchored intestinal in model rafts. J Mol Recognit. 2007;20:531–537. doi: 10.1002/jmr.835. [DOI] [PubMed] [Google Scholar]
- 58.Saslowsky DE, Lawrence J, Ren XY, Brown DA, Henderson RM, Edwardson JM. Placental alkaline phosphatase is efficiently targeted to rafts in supported lipid bilayers. J Biol Chem. 2002;277:26966–26970. doi: 10.1074/jbc.M204669200. [DOI] [PubMed] [Google Scholar]
- 59.Dapson RW. Macromolecular changes caused by formalin fixation and antigen retrieval. Biotech Histochem. 2007;82:133–140. doi: 10.1080/10520290701567916. [DOI] [PubMed] [Google Scholar]
- 60.Chao Y, Zhang T. Optimization of fixation methods for observation of bacterial cell morphology and surface ultrastructures by atomic force microscopy. Appl Microbiol Biotechnol. 2011;92:381–392. doi: 10.1007/s00253-011-3551-5. [DOI] [PMC free article] [PubMed] [Google Scholar]
- 61.Hollmann A, Delfederico L, Glikmann G, De Antoni G, Semorile L, Disalvo EA. Characterization of liposomes coated with S-layer proteins from lactobacilli. Biochim Biophys Acta. 2007;1768:393–400. doi: 10.1016/j.bbamem.2006.09.009. [DOI] [PubMed] [Google Scholar]
- 62.Jass J, Tjarnhage T, Puu G. From liposomes to supported, planar bilayer structures on hydrophilic and hydrophobic surfaces: an atomic force microscopy study. Biophys J. 2000;79:3153–3163. doi: 10.1016/S0006-3495(00)76549-0. [DOI] [PMC free article] [PubMed] [Google Scholar]
- 63.Ruozi B, Tosi G, Forni F, Fresta M, Vandelli MA. Atomic force microscopy and photon correlation spectroscopy: two techniques for rapid characterization of liposomes. Eur J Pharm Sci. 2005;25:81–89. doi: 10.1016/j.ejps.2005.01.020. [DOI] [PubMed] [Google Scholar]
- 64.Luna EJ, Mcconnell HM. Lateral phase separations in binary-mixtures of phospholipids having different charges and different crystalline-structures. Biochim Biophys Acta. 1977;470:303–316. doi: 10.1016/0005-2736(77)90108-0. [DOI] [PubMed] [Google Scholar]
- 65.Mao G, Liang X, Ng KYS. Direct force measurement of liposomes by atomic force microscopy. Dekker Enc Nanosci Nanotechnol. 2004;933 [Google Scholar]
- 66.Ruozi B, Tosi G, Tonelli M, Bondioli L, Mucci A, Forni F, Vandelli MA. AFM phase imaging of soft-hydrated samples: a versatile tool to complete the chemical-physical study of liposomes. J Liposome Res. 2009;19:59–67. doi: 10.1080/08982100802584071. [DOI] [PubMed] [Google Scholar]
- 67.Magonov SN, Elings V, Whangbo MH. Phase imaging and stiffness in tapping-mode atomic force microscopy. Surf Sci. 1997;375:L385–L391. [Google Scholar]
- 68.Aytun T, Mutaf OF, El-Atwani OJ, Ow-Yang CW. Nanoscale composition mapping of segregation in micelles with tapping-mode atomic force microscopy. Langmuir. 2008;24:14183–14187. doi: 10.1021/la802384x. [DOI] [PubMed] [Google Scholar]
- 69.Favarin BF, Andrade MAR, Bolean M, Simão AMS, Ramos AP, Hoylaerts MF, Millán JL, Ciancaglini P. Effect of the presence of cholesterol in the interfacial microenvironment on the modulation of the alkaline phosphatase activity during in vitro mineralization. Colloids Surf B: Biointerfaces. 2017;155:466–476. doi: 10.1016/j.colsurfb.2017.04.051. [DOI] [PubMed] [Google Scholar]
- 70.Wang B, Zhang LF, Bae SC, Granick S. Nanoparticle-induced surface reconstruction of phospholipid membranes. Proc Natl Acad Sci U S A. 2008;105:18171–18175. doi: 10.1073/pnas.0807296105. [DOI] [PMC free article] [PubMed] [Google Scholar]
- 71.Lee AG. Lipid-protein interactions in biological membranes: a structural perspective. Biochim Biophys Acta. 2003;1612:1–40. doi: 10.1016/s0005-2736(03)00056-7. [DOI] [PubMed] [Google Scholar]
- 72.Brown MF. Curvature forces in membrane lipid-protein interactions. Biochemistry. 2012;51:9782–9795. doi: 10.1021/bi301332v. [DOI] [PMC free article] [PubMed] [Google Scholar]
- 73.El Kirat K, Morandat S, Dufrene YF. Nanoscale analysis of supported lipid bilayers using atomic force microscopy. Biochim Biophys Acta Biomembr. 2010;1798:750–765. doi: 10.1016/j.bbamem.2009.07.026. [DOI] [PubMed] [Google Scholar]
- 74.Kirsch T. Biomineralization-an active or passive process? Connect Tissue Res. 2012;53:438–445. doi: 10.3109/03008207.2012.730081. [DOI] [PubMed] [Google Scholar]
Associated Data
This section collects any data citations, data availability statements, or supplementary materials included in this article.