

SUMMARY
Cell fate transitions involve rapid gene expression changes and global chromatin remodeling, yet the underlying regulatory pathways remain incompletely understood. Here, we identified the RNA-processing factor Nudt21 as a novel regulator of cell fate change using transcription factor induced reprogramming as a screening assay. Suppression of Nudt21 enhanced the generation of induced pluripotent stem cells, facilitated transdifferentiation into trophoblast stem cells, and impaired differentiation of myeloid precursors and embryonic stem cells, suggesting a broader role for Nudt21 in cell fate change. We show that Nudt21 directs differential polyadenylation of over 1,500 transcripts in cells acquiring pluripotency, although only a fraction changed protein levels. Remarkably, these proteins were strongly enriched for chromatin regulators and their suppression neutralized the effect of Nudt21 during reprogramming. Collectively, our data uncover Nudt21 as a novel post-transcriptional regulator of cell fate and establish a direct, previously unappreciated link between alternative polyadenylation and chromatin signaling.
In Brief
Alternative polyadenylation exerts post-transcriptional control over cell fate decisions and pluripotency
INTRODUCTION
A key property of stem and progenitor cells is the capacity to differentiate into committed cell types. These transitions prompt widespread changes in gene expression programs that require multiple levels of regulation to specify and ultimately restrict cell fate. Cell identity can be experimentally modulated through the ectopic expression of key transcription factors. For example, forced expression of Oct4, Klf4, Sox2 and c-Myc (OKSM) in somatic cells gives rise to induced pluripotent stem cells (iPSCs) within 1–3 weeks and at an efficiency of 1–3% (Takahashi and Yamanaka, 2006). The slow rate and low efficiency of this process have been attributed to somatic barriers that are established during development (Apostolou and Hochedlinger, 2013). Thus, iPSC generation represents a tractable system to identify these barriers and resolve general mechanisms that control cell fate. While several studies have focused on the role of direct chromatin and transcriptional regulators during induced or physiological cell fate transitions, post-transcriptional mechanisms of cell fate control remain relatively unexplored (Ye and Blelloch, 2014).
Recently, alternative polyadenylation (APA) has emerged as a fundamental mediator of gene expression. In mammals, approximately 70% of genes harbor multiple polyA sites, which yield distinct mRNA isoforms that differ in the length of their 3′ untranslated regions (UTRs) (Mayr, 2017; Shi, 2012; Tian and Manley, 2017). Transcripts with proximal polyA sites and therefore shorter 3′ UTRs are generally thought to produce increased protein levels due to the exclusion of regulatory sequences that mediate degradation, export to the cytoplasm, and translational efficiency of mRNAs (Mayr and Bartel, 2009; Sandberg et al., 2008). However, several studies have reported that the effect of APA on mRNA stability and ribosome loading is marginal and may depend on cell-type specific expression of microRNAs and RNA-binding proteins (Gruber et al., 2014; Gupta et al., 2014; Spies et al., 2013). Thus, the role of APA in different cell contexts and under different conditions remains to be determined.
The polyadenylation of mRNAs requires four distinct protein complexes, comprising the cleavage and polyadenylation specificity factor (CPSF), cleavage stimulation factor (CstF), cleavage factor I (CFIm) and cleavage factor II (CFIIm) (Tian and Manley, 2017). Perturbation of complex subunits leads to variable shifts of polyA site usage, implying a direct role for these factors in APA (Lackford et al., 2014; Li et al., 2015; Martin et al., 2012; Masamha et al., 2014). Interestingly, components of CPSF and CstF display increased expression during reprogramming to pluripotency, which is suggested to modulate polyadenylation site usage to match patterns observed in pluripotent cells (Ji et al., 2009). In general, undifferentiated and proliferative cells are enriched for mRNAs using proximal polyA sites, which may play a role in cell fate (Ji et al., 2009; Lackford et al., 2014). For example, the use of proximal polyA sites within the Pax3 3′UTR renders satellite cells insensitive to miR-206 dependent degradation, impacting muscle progenitor function and regenerative capabilities (Boutet et al., 2012). These studies suggest that APA patterns are dynamically regulated during development and cellular differentiation. However, the relevance of polyadenylation factors and their functions during cell fate transitions remain poorly defined.
In this study, we performed a genome-wide, unbiased shRNA screen during the induction of iPSCs from fibroblasts in order to identify novel regulators of cell fate change. This effort uncovered Nudt21, a component of the CFIm complex (Ruegsegger et al., 1998), as a potent barrier to reprogramming and a regulator of widespread APA patterns in somatic cells acquiring pluripotency.
RESULTS
A serial shRNA screen identifies Nudt21 as a potent barrier to reprogramming
To identify barriers to reprogramming, we conducted a non-saturated shRNA enrichment screen during the conversion of murine embryonic fibroblasts (MEFs) into iPSCs using a previously described approach (Borkent et al., 2016). Transgenic MEFs were derived that carried a doxycycline (dox)-inducible polycistronic transgene encoding Oct4, Klf4, Sox2 and c-Myc (OKSM) and an Oct4-EGFP reporter (Stadtfeld et al., 2010) (SFig. 1A). These cells were transduced with a lentiviral library containing 60,642 hairpins targeting 18,464 genes and treated with dox to induce reprogramming (Fig. 1A). Emerging OCT4-GFP+ cells were purified by fluorescence-activated cell sorting and hairpins enriched in reprogrammed cells were isolated from genomic DNA. The purified hairpins were then amplified and re-cloned into lentiviral backbones in order to perform additional rounds of infection, reprogramming, and hairpin enrichment. The complexity of the shRNA library decreased with each round of the screen and several hairpins became progressively enriched, suggesting that they confer a selective advantage for the generation of iPSCs (Fig. 1B). Among the top scoring hits, Nudt21 shRNAs emerged as the strongest and most consistent enhancers of reprogramming across replicates (SFig. 1B,C). Nudt21 (also called CFIm25 or Cpsf5) is a component of the pre-mRNA cleavage and polyadenylation complex and has been implicated in alternative polyadenylation (APA) of mRNA (Li et al., 2015; Martin et al., 2012; Masamha et al., 2014). However, Nudt21 has not previously been associated with cellular reprogramming or mammalian cell fate regulation. We therefore focused on this molecule for the remainder of this study.
Figure 1. A serial siRNA screen identifies Nudt21 as a potent barrier to reprogramming.

A) A schematic of the serial enrichment shRNA screen.
B) shRNA library complexity during hairpin enrichment.
C) AP staining of transgene-independent iPS colonies. Cells were induced with dox for 12 days, followed by 4 days of dox withdrawal.
D) Quantification of AP staining.
E) Western blot analysis showing Nudt21 knockdown with siRNA at day three of reprogramming.
F) Dox withdrawal assay. Cells were induced for the indicated time period after which dox was replaced with ES media until analysis at day 15.
G) A schematic of the markers used to determine the progression of reprogramming.
H) Flow cytometry analysis of intermediate reprogramming markers, SSEA1, EPCAM, and OCT4-GFP at day 12 of induction.
I) Time course quantification of flow cytometry analysis.
J) Time course qRT-PCR quantification of gene expression for select pluripotency genes. Statistical significance was determined using multiple t-test with 1% false discovery rate.
See also Figure S1. n=3 independent experiments, mean ± SD, * p<0.05; ** p<0.01; *** p<0.001; **** p<0.0001, unpaired Student’s t-test.
To confirm the effect of Nudt21 shRNAs on reprogramming, we transfected reprogrammable MEFs with pooled siRNAs targeting Nudt21 and observed a ~30-fold increase in the formation of alkaline phosphatase (AP) positive, transgene-independent iPSC colonies (Fig. 1C,D). We confirmed that Nudt21 protein levels were downregulated in Nudt21 siRNA treated cells, indicating specificity of the phenotype and efficiency of knockdown (Fig. 1E). Importantly, suppression of Nudt21 did not impact transgene expression (Fig. 1E), excluding the possibility that Nudt21 knockdown enhances reprogramming by increasing levels of exogenous OKSM. Nudt21 also dramatically increased iPSC colony numbers when exogenous c-Myc was omitted from the reprogramming cocktail, demonstrating that Nudt21 knockdown greatly enhances cell fate change in systems with an inherently low reprogramming efficiency (SFig. 1D,E). Finally, we ensured that transient Nudt21 suppression does not compromise pluripotency by generating well-differentiated teratomas from iPSCs derived from reprogrammable MEFs treated with Nudt21 siRNAs (SFig. 1F).
To determine whether Nudt21 suppression accelerates the rate of reprogramming, we exposed reprogrammable MEFs to dox for different lengths of time before withdrawing dox to quantify transgene-independent iPSC colonies at day 15 (Fig. 1F). While stable iPSC colonies first emerged after 7–8 days of OKSM expression in control siRNA treated cultures, consistent with a prior study (Stadtfeld et al., 2008), Nudt21 siRNA-treated cells gave rise to iPSC colonies after as little as 4–5 days of OKSM expression (Fig. 1F and SFig. 1G). To further refine the kinetics of reprogramming, we examined cell surface markers and a reporter allele, which identify early (SSEA1), mid (EpCAM) or late (OCT4-GFP) stages of reprogramming (Fig. 1G) (Polo et al., 2012; Stadtfeld et al., 2008). Strikingly, levels of SSEA1 were 4–5 fold higher in cultures treated with Nudt21 siRNAs relative to control siRNAs after just 3 days of dox induction and remained high throughout the course of reprogramming (Fig. 1H,I). Similarly, EPCAM and OCT4-GFP were expressed at earlier time points and at much higher levels compared to control. By day 12 of induction, up to 40% of cells in the Nudt21 knockdown condition had attained OCT4-GFP expression compared to only 1% in the control. Moreover, we noticed that transcription factors and epithelial proteins associated with pluripotency such as Nanog, Esrrb and Cdh1 were induced more rapidly in reprogramming cultures with Nudt21 siRNAs and reached the expression levels observed in iPSCs in just 9 days (Fig. 1J). We excluded that the observed acceleration of reprogramming and enhanced marker expression are due to an increase in proliferation with Nudt21 knockdown using both CFSE assays and cell counting (SFig. 1H,I). Nudt21 knockdown also did not appreciably change apoptosis rates as judged by AnnexinV staining (SFig. 1J). Moreover, suppression of Nudt21 in uninduced MEFs did not alter their growth rate or viability (SFig. 1H–J) and had no discernable impact on the expression of transcripts related to MEF and iPSC identity (SFig. 1K,L). Together, these results indicate that Nudt21 suppression aids the establishment of the pluripotency network and generates bona fide iPSCs with reduced latency but does not induce cell fate changes on its own.
Nudt21 suppression promotes alternative cell fate transitions
We next investigated whether Nudt21 acts as a barrier to cell fate transitions that do not involve a pluripotent state. We first focused on transdifferentiation of pre-B cells to macrophages using ectopic expression of the myeloid transcription factor C/EBPα (Bussmann et al., 2009) (Fig. 2A). By tracking downregulation of the B cell surface marker CD19 and reciprocal upregulation of the macrophage surface marker MAC1 (CD11b), we observed conversion of pre-B cells into macrophages with the expected increase in size and granularity (SFig. 2A) as well as frequency. However, we were unable to detect an enhancement of transdifferentiation efficiency after suppression of Nudt21 (Fig. 2B and SFig. 2A–C). Similarly, transdifferentiation of MEFs into TAU1-GFP+ induced neurons (iNs) (Vierbuchen et al., 2010) was unchanged with Nudt21 knockdown upon ectopic expression of the neuronal transcription factor Ascl1, alone or in combination with Brn2 and Myt1l (Fig. 2C,D and SFig. 2D,E).
Figure 2. Nudt21 suppression enhances the transdifferentiation of MEFs to iTSCs, yet delays ESC and myeloid differentiation.

A) A schematic of B cell to macrophage transdifferentiation.
B) Time course analysis for lineage markers during B cell to macrophage transdifferentiation.
C) A schematic of MEF to neuron transdifferentiation.
D) Quantification of neural transdifferentiation.
E) A schematic of MEF to trophoblast stem cell transdifferentiation.
F) Immunofluorescence images showing staining for SOX2-GFP and CDX2. Scale bar=100 μm. Arrowheads indicate trophoblast giant cells.
G) Quantification of iTSC colonies following transdifferentiation.
H) Brightfield images of EBs after 6 days of differentiation. Scale bar =200 μm.
I) Quantification of EB diameters for each condition in technical replicate from three independent experiments (Control shRNA, n=36; Nudt21 shRNA, n=58). The center bar and whiskers represent the mean and standard deviation of the mean, respectively.
(J) qRT-PCR for lineage markers at day 6 of induction.
K) A schematic of the Hoxb8 differentiation system.
L) Flow cytometry analysis showing lysozyme-GFP levels for cells under differentiation conditions.
M) Quantification for differentiation from progenitor cells to myeloid lineages.
See also Figure S2. n=3 independent experiments, mean ± SD, * p<0.05; ** p<0.01; *** p<0.001; **** p<0.0001, unpaired Student’s t-test.
Transdifferentiation into macrophages or iNs produces cells with fundamentally different cell cycle characteristics compared to iPSCs (post-mitotic vs. proliferative) and differentiation potentials (terminally differentiated vs. pluripotent). We therefore hypothesized that Nudt21 suppression may uniquely facilitate cell fate transitions that pass through a self-renewing stem cell state. To test this hypothesis, we performed Nudt21 knockdown during the conversion of MEFs into induced trophoblast stem cells (iTSCs) using a previously reported protocol (Benchetrit et al., 2015; Kubaczka et al., 2015) (Fig. 2E). Briefly, we infected SOX2-GFP MEFs with dox-inducible lentiviral vectors carrying open reading frames for the transcription factors Tfap2c, Eomes, and Gata3. After 20 days of transcription factor expression and 10 days of transgene-independent growth, we detected SOX2-GFP+ iTSC-like colonies that resembled bona fide trophoblast stem cells at the expected efficiency. These iTSC colonies exhibited a flat, cuboidal morphology, expressed CDX2 protein and were surrounded by differentiated progeny that appeared similar to trophoblast giant cells (Fig. 2F and SFig. 2F,G). Notably, suppression of Nudt21 by siRNAs enhanced the formation of SOX2-GFP+ iTSCs by 5-fold, indicating that Nudt21 resists transdifferentiation into this alternative, non-pluripotent stem cell type (Fig. 2G).
Based on the finding that Nudt21 suppression facilitates the acquisition of early embryonic stem cell states, we explored whether Nudt21 also plays a role during ESC differentiation. To this end, we introduced a lentiviral shRNA targeting Nudt21 in ESCs and evaluated their differentiation potential by generating embryoid bodies (EBs). Notably, after 6 days of differentiation, Nudt21-depleted cells gave rise to significantly smaller EBs compared to control ESCs despite equal numbers of input cells (p<0.001) (Fig. 2H,I). Moreover, Nudt21 knockdown EBs showed a dramatic reduction in the expression of neuronal marker genes (Pax6 and Sox1) but expressed mesoderm- and endoderm-specific genes at similar levels as control-infected EBs (Fig. 2J). Thus, Nudt21 suppression impairs the potential of ESCs to differentiate into the ectodermal lineage.
To test whether Nudt21 suppression also affects adult progenitor differentiation, we performed shRNA-mediated knockdown of Nudt21 in a myeloid progenitor cell line carrying a lysozyme-GFP reporter, which is silenced in progenitors and activated in derivative macrophages and neutrophils (Fig. 2K). This cell line is reversibly locked into a self-renewing, undifferentiated state using expression of an estradiol-dependent Hoxb8 transgene, providing a powerful in vitro assay to study progenitor cell maintenance and differentiation (Sykes et al., 2016). Withdrawal of estradiol in control shRNA transduced progenitors led to the activation of lysozyme-GFP and differentiation in the majority of cells (91%), as expected (Fig. 2L,M). By contrast, myeloid progenitors with Nudt21 knockdown activated the lysozyme-GFP reporter in a significantly smaller fraction of cells (61%), indicating that their differentiation is delayed (Fig. 2L,M). Altogether, these results demonstrate that Nudt21 suppression not only facilitates the acquisition of an embryonic pluripotent (iPSC) and multipotent (iTSC) stem cell state but also impairs the differentiation of ESCs and an adult hematopoietic progenitor cell type.
Nudt21 suppression triggers alternative polyA site usage of hundreds of targets
In order to identify potential targets of Nudt21 and thus gain insight into the mechanisms by which Nudt21 modulates cell fate change, we performed polyA site-sequencing (PAS-seq) (Shepard et al., 2011) of untreated MEFs, MEFs expressing OKSM in the presence of either Nudt21 or control siRNAs, SSEA1-enriched reprogramming intermediates, and transgene independent iPSCs. We found that in iPSCs, twice as many transcripts utilized proximal polyA sites (117) compared to MEFs (55), consistent with the notion that undifferentiated, proliferative cells preferentially use proximal polyA sites (Ji et al., 2009; Sandberg et al., 2008; Shepard et al., 2011) (Fig. 3A). Remarkably, however, suppression of Nudt21 in MEFs expressing OKSM for 3 days led to a massive shift of transcripts from distal to proximal polyA sites compared to the control (1,562 vs. 59) (Fig. 3B). Multi-dimensional scaling (MDS) analysis of PAS-seq data suggested a progressive reprogramming trajectory from MEFs, through day 3 and 6 control siRNA-treated cells, to SSEA1+ intermediates and ultimately iPSCs (Fig. 3C, gray line, Supplementary Table 1). Interestingly, cells depleted for Nudt21 were molecularly closer to iPSCs along the first dimension but distinct from both iPSCs and MEFs along the second dimension (Fig. 3C). This suggests that Nudt21 knockdown facilitates the acquisition of an iPSC-like polyadenylation pattern but often exceeds the iPSC phenotype or induces polyadenylation changes on transcripts that usually remain stable during reprogramming. Indeed, while some transcripts showed APA patterns that were more similar to SSEA1+ intermediates and iPSCs (e.g., Phc1), others showed enhanced or ectopic APA patterns (e.g., Atm, Mgea5) upon Nudt21 suppression (Fig. 3B,D and SFig. 3A). Further supporting the MDS results, gene ontology analysis of Nudt21-dependent APA changes revealed enrichment for several categories that have been implicated in reprogramming such as integrin and MAPK signaling pathways, but also highlighted cancer-associated signaling and protein ubiquitination, pointing to the complexity of biological functions influenced by Nudt21 (Fig. 3E).
Figure 3. Nudt21 suppression facilitates APA and gene expression changes.

A) A correlation plot comparing polyA site usage for iPSCs vs MEFs.
B) A correlation plot comparing polyA site usage at Day3 of reprogramming for Nudt21 siRNA vs control siRNA.
C) Multi-dimensional scaling analysis for APA.
D) Gene tracks showing alternative polyadenylation for Nudt21 targets. Control and Nudt21 knockdown samples were analyzed at day 3 of reprogramming.
E) Ingenuity pathway analysis of APA at day 3 of reprogramming for Nudt21 siRNA vs control siRNA.
F) UGUA distribution around polyA sites.
G) AP staining of transgene-independent iPS colonies following reprogramming. Cells were induced with dox for 12 days, followed by 4 days of dox withdrawal.
H) Quantification of AP staining of transgene-independent iPS colonies from panel E.
I) Multi-dimensional scaling analysis for gene expression.
J) Heat maps for select MEF and pluripotency genes.
See also Table S1 and Figure S3. n=3 independent experiments, mean ± SD, * p<0.05; **** p<0.0001, unpaired Student’s t-test.
To better understand the mechanisms by which Nudt21 modulates APA, we examined the distribution of the Nudt21 binding motif, UGUA, within the 3′ UTR of mRNAs (Brown and Gilmartin, 2003; Martin et al., 2012). Notably, we found significant enrichment for UGUA motifs near distal polyA sites compared to the proximal polyA sites within the 3′ UTR of genes that exhibit APA changes following Nudt21 knockdown (i.e., “target genes”) (Fig. 3F, left panel). By contrast, UGUA distribution was similar between proximal and distal polyA sites of genes whose APA profiles were not affected, termed “non-target genes” (Fig. 3F, right panel). To confirm that transcripts exhibiting APA changes upon Nudt21 knockdown are direct targets of the CFIm complex, we compared our dataset with published CLIP-seq data for NUDT21 (CFIm25) and its cofactor CFIm68 in human cells. Our results indicate that NUDT21 and CFIm68 show higher and more concentrated CLIP signals at distal polyA sites of target genes whereas CLIP signals showed similar distribution patterns at the proximal and distal polyA sites of non-target genes (SFig. 3B). This binding pattern is consistent with the observed distribution pattern of the UGUA motif (Fig. 3F) and supports a model whereby Nudt21 is directed to distal sites to facilitate polyadenylation.
Nudt21 functions in complex with other factors that impact APA (Shi, 2012; Tian and Manley, 2017). To corroborate the finding that Nudt21 enhances reprogramming through an APA-dependent function, we performed immunoprecipitation for Nudt21 followed by mass-spectrometry using HEK293T cells. Gene ontology analysis based on all detected Nudt21 associated proteins revealed “RNA processing”, “3′-end processing” and “pre-mRNA cleavage” among the top-enriched categories, supporting the conclusion that Nudt21 predominantly functions at the level of mRNA processing (SFig. 3C). Of note, our analysis confirmed direct interaction between Nudt21 and other components of the CFIm complex, including CFIm68 and CFIm59 (SFig. 3D).
To test whether suppression of additional components of the CFIm complex mirror the effect of Nudt21 deficiency, we depleted CFIm68 during the generation of iPSCs. Previous studies showed that suppression of CFIm68 also causes 3′ UTR shortening in different cell types, although fewer transcripts are affected compared to Nudt21 suppression (Li et al., 2015; Martin et al., 2012). Accordingly, CFIm68 knockdown led to a greater than 7-fold increase in reprogramming efficiency, as judged by transgene independent, AP-positive colonies (Fig. 3G,H and SFig. 3E). By contrast, knockdown of the CFIIm subunit Pcf11, which has previously been shown to cause 3′ UTR lengthening (Li et al., 2015), produced a reciprocal phenotype, decreasing reprogramming efficiency more than 2-fold (Fig. 3G,H and SFig. 3E). These data demonstrate that suppression of alternative factors that positively or negatively impact 3′UTR length have opposing effects on reprogramming, further strengthening our conclusion that Nudt21 influences cell fate through modulation of APA patterns.
Proteomics analysis reveals enrichment for chromatin regulators among upregulated Nudt21 targets
We next examined mRNA expression levels for the abovementioned PAS-seq samples. MDS analysis again showed a clear trajectory of reprogramming (Fig. 3I, gray line, Supplementary Table 1). Interestingly, Nudt21 knockdown samples fell along this trajectory and were more advanced than control samples, suggesting that Nudt21 knockdown accelerates acquisition of a transcriptional state resembling iPSCs (Fig. 3I). Consistent with this observation, we found that established pluripotency transcripts such as Nanog, Utf1 and Zfp296 were upregulated whereas MEF-associated transcripts such as Snai1, Pdgfrb and Fibin were downregulated in Nudt21 depleted cells relative to controls (Fig. 3J). We conclude that the transcriptome of Nudt21 depleted cultures is more similar to iPSCs even though the extent of distal to proximal polyA shifts is enhanced compared to unperturbed reprogramming intermediates and iPSCs (Fig. 3C).
Messenger RNAs that shift polyA site usage from distal to proximal sites are generally thought to yield increased mRNA or protein levels due to the inability of miRNA to bind to 3′UTRs and destabilize transcripts or block translation (Shi, 2012; Tian and Manley, 2017). However, it remains unclear how universal this observation is on a genome-wide scale and in different cellular contexts. To address these questions in our system, we first compared APA changes with mRNA levels in Nudt21 depleted cells undergoing reprogramming. We observed a positive, albeit modest, correlation between APA and mRNA levels, indicating that 3′UTR shortening increases corresponding transcript levels in Nudt21 depleted cells (SFig. 3F). To determine the effect of APA on protein levels, we performed large-scale quantitative proteomic analysis of MEFs expressing OKSM for 3 days in the presence of either Nudt21 or control siRNAs. In total, we quantified 8,187 proteins and selected the subset that demonstrated statistically significant changes of 1.2-fold or more for further analysis (n=3 replicates per sample) (Fig. 4A, Supplementary Table 2). We observed a good overall correlation between mRNA and protein changes in Nudt21 knockdown cells, suggesting that altered protein levels are generally due to increased or decreased mRNA levels (Fig. 4B). However, we noticed only a subtle, positive correlation (correlation coefficient=0.11) between APA and protein levels when comparing Nudt21 vs. control siRNA treated cells (Fig. 4C), which is consistent with recent literature (Gruber et al., 2014; Spies et al., 2013). Overall, only 208 transcripts undergoing APA led to increased protein levels (12.8%) whereas 74 transcripts led to decreased protein levels (4.5%) (Fig. 4D). We surmise that the regulatory effect of APA on the remaining transcripts may depend on additional, cell context-specific factors that are absent in our system (miRNAs, RNA binding proteins, etc.). Nevertheless, these data highlight that only a small fraction of Nudt21-dependent APA changes results in altered protein levels (17%) that ultimately enhance reprogramming. We therefore sought to characterize these proteins further.
Figure 4. Large-scale quantitative proteomics analysis reveals a subset of upregulated Nudt21 targets that are enriched for chromatin modifiers.

A) A heat map for differentially expressed proteins exhibiting a 1.2-fold or greater difference between Nudt21 and control siRNA at day 3 of reprogramming.
B) A correlation plot (p-value=0) comparing mRNA to protein expression at day 3 of reprogramming.
C) A correlation plot (p-value=8.84×10⁻⁵) comparing APA to protein expression at day 3 of reprogramming.
D) A pie chart showing the percent of Nudt21 targets that change protein levels 1.2-fold or greater by day 3 of reprogramming.
E) Gene Ontology analysis for Nudt21 target proteins that increase expression 1.2-fold or greater by day 3 of reprogramming.
F) A heatmap of chromatin modifiers that change both protein levels and polyadenylation site usage.
Strikingly, gene ontology analysis of Nudt21 targets that change protein levels (n=282) revealed that upregulated proteins were dramatically enriched for categories related to chromatin regulation while downregulated proteins were highly enriched for categories related to somatic cell function, including mesenchymal- and extracellular matrix-related categories (Fig. 4E and SFig. 4A). Among the upregulated chromatin factors, we found multiple components of the non-canonical PRC1 complex (BCOR, RYBP, SFMBT1, PHC1), chromatin remodelers (CHD1, SS18, CHD9) and chromatin readers (WDR5, NSD1) (Fig. 4F). We confirmed increased protein expression for several of these proteins via Western blot analysis (SFig. 4B). These results show that Nudt21 suppression affects APA of a large set of genes, yet only a subset of resultant transcripts lead to elevated expression of proteins, which are strongly associated with chromatin signaling.
Nudt21 suppression relieves miRNA mediated degradation
Analysis of Nudt21 targets that increase protein expression revealed that the 3′ UTRs of corresponding transcripts were enriched for binding sites of several miRNAs. This finding raises the intriguing possibility that relief from miRNA-mediated degradation is a contributing mechanism by which Nudt21 knockdown increases reprogramming (SFig. 4C). In agreement with this notion, we found that regions of the 3′UTR that are lost during the shift from distal to proximal polyA sites show enriched binding for the miRNA effector AGO2 in ESCs (Fig. 5A). Moreover, several miRNAs whose binding sites are lost within the 3′UTR of Nudt21 targets have previously been implicated in reprogramming and pluripotency. In particular, miR-29a and miR-34c were shown to lower reprogramming efficiency through interactions with p53 or p21 (Choi et al., 2011; Fraguas et al., 2017) and their expression gradually diminishes during iPSC generation (SFig. 4D, red line). Closer examination of Jmjdc1, Rybp, and Wdr5 transcripts revealed that miR34c and miR-29a target sequences were eliminated when transcripts shifted from distal to proximal polyA sites with Nudt21 knockdown (Fig. 5B and SFig. 4E). Of note, previous work demonstrated that Rybp is directly regulated by miR-29 (Zhou et al., 2012).
Figure 5. Nudt21 targets are regulated by miRNAs.

A) Ago2 CLIP-seq enrichment on transcripts that change polyadenylation following Nudt21 knockdown. The center bar, boxes, and whiskers represent the median, first to third quartile, and minimum/maximum values, respectively.
B) Gene tracks showing APA for Jmjdc1 and Rybp. The inset shows microRNA seed sequences in bold for each transcript. Control and Nudt21 knockdown samples were analyzed at day 3 of reprogramming.
C) A schematic of the luciferase assay to assess the effect of 3′ UTR length on protein expression. Arrows represent polyA sites and the red box represents a miRNA binding site.
D) Normalized luciferase assay for the indicated genes with or without miRNA mimicks.
E) AP staining of transgene-independent iPS colonies generated with miR-34c inhibitor or miR inhibitor control. Cells were induced with dox for 12 days, followed by 4 days of dox withdrawal.
F) AP staining of transgene-independent iPS colonies generated with miR-29a inhibitor or miR inhibitor control. Cells were induced with dox for 12 days, followed by 4 days of dox withdrawal.
See also Figures S4 and S5. n=3 independent experiments, mean ± SD, N.S., not significant, ** p<0.01; *** p<0.001; **** p<0.0001, unpaired Student’s t-test.
To determine whether APA of Jmjdc1, Rybp and Wdr5 mRNAs have a direct effect on protein expression, we cloned the corresponding short (polyadenylated at the proximal polyA site) and long (distal polyA site) 3′ UTR isoforms for each gene into a luciferase reporter construct (Fig. 5C). Luciferase activity diminished significantly for Jmjdc1 and Rybp distal constructs compared to the proximal constructs but was not significantly different for Wdr5 (Fig. 5D). Notably, co-transfection with miRNA mimics led to a pronounced reduction in luciferase activity for Jmjdc1 and Rybp distal constructs (~40% and 30%, respectively) and a highly significant decrease for the Wdr5 distal construct (46%) relative to proximal constructs (Fig. 5D). These findings confirm that APA eliminates miRNA seed sequences that directly regulate key targets of Nudt21.
To assess whether miR-34c and miR-29a have a functional effect in our system, we transfected miRNA inhibitors into MEFs and induced reprogramming. These inhibitors reduced the expression of each miRNA to less than 20% of the levels observed in control samples (SFig. 4F). Consistent with previous reports, we observed a 2–3 fold increase in reprogramming efficiency with miRNA inhibition (Choi et al., 2011; Fraguas et al., 2017) (Fig. 5E,F). Collectively, these observations provide a direct, mechanistic link between APA, the elimination of miRNA-mediated regulation, and cell fate changes that occur with Nudt21 knockdown.
Chromatin regulators targeted by Nudt21 are key mediators of reprogramming
To determine whether candidate chromatin regulators contribute to enhanced reprogramming in Nudt21-depleted cells, we performed co-suppression experiments using siRNAs targeting Nudt21 and individual chromatin factors. We initially focused on the H3K4me3 reader WDR5 and the PRC1 component RYBP, as they have previously been implicated in pluripotency and reprogramming (Ang et al., 2011; Li et al., 2017b). Western blot analysis or qRT-PCR confirmed that WDR5 and RYBP were upregulated in Nudt21-depleted cells (SFig. 5A,E). Notably, while suppression of Nudt21 alone led to the expected increase in AP+ colonies, co-suppression of Nudt21 and either Wdr5 or Rybp neutralized this effect, suggesting that upregulation of these factors is involved in Nudt21’s effect on reprogramming (SFig. 5B–F). In further support of the molecular connection between Nudt21 and Rybp, we found that genes directly suppressed by RYBP (Li et al., 2017a) including Bmp4, Tril and Jun were transcriptionally downregulated upon Nudt21 suppression (SFig. 5G). Importantly, co-suppression of Nudt21 with Rybp or Wdr5 did not increase cell death or alter proliferation (SFig. 5H,I), thus excluding the possibility that knockdown of these factors decreased reprogramming efficiency by impairing cell viability or growth.
We next examined Nudt21-dependent chromatin factors with no previous association to induced pluripotency. We chose two chromatin remodelers, CHD9 and ANP32E, one component of the Polycomb Repressive Complex 1 (PRC1), PHC1, and the chromatin readers, RTF1 and SPIN1. To determine their contribution to the enhanced reprogramming observed with Nudt21 knockdown, we performed double transfection with each of the respective siRNAs (SFig. 6A,B). Remarkably, co-suppression of Nudt21 and any of these 4 chromatin factors led to a significant decrease in the fraction of OCT4-GFP+ cells, abrogating the positive effect of Nudt21 suppression on reprogramming (Fig. 6A, SFig. 6C). We also observed a significant decrease in the number of transgene-independent iPSC colonies as judged by AP staining, and decreased expression of pluripotency-related genes (Nanog, Sall4, Esrrb and Pou5f1) after 9 days of reprogramming (Fig. 6B and SFig. 6D,E). Cell viability and proliferation were once again unchanged by co-transfection with siRNAs targeting Nudt21 and the chromatin modifiers (SFig. 6F,G). We therefore conclude that a select set of chromatin readers, writers and remodelers are important for reprogramming and likely contribute to enhanced iPSC generation in cells with Nudt21 knockdown.
Figure 6. Chromatin modifiers targeted by Nudt21 mediate cell fate change.

A) Flow cytometry analysis showing OCT4-GFP levels at day 9 of reprogramming, following double knockdown of Nudt21 and the indicated chromatin factors.
B) Quantification of transgene-independent iPS colonies, following double knockdown of Nudt21 and the indicated chromatin factors.
C) Heatmaps of ATAC-seq read density for peaks at MEF-specific enhancers (left) and ESC-specific enhancers (right), colored by the ratio to the highest coverage for each enhancer.
D) H3K27me3 and H3K4me3 coverage at TSS of genes proximal to the indicated enhancers. The center bar, boxes, and whiskers represent the median, first to third quartile, and minimum/maximum values, respectively.
E) Pathway enrichment analysis for genes associated with the MEF- and ESC-specific enhancer.
See also Figure S6. n=3 independent experiments, mean ± SD, * p<0.05; ** p<0.01; *** p<0.001; **** p<0.0001, unpaired Student’s t-test.
The observation that APA regulates multiple chromatin factors raises the question of whether Nudt21 depletion alters the chromatin landscape during reprogramming. To explore this possibility, we performed Assay for Transposase-Accessible Chromatin combined with deep sequencing (ATAC-seq; (Buenrostro et al., 2013)) at various time points during iPSC induction. In total, we identified 16,661 accessible regions in MEFs, which progressively closed during the reprogramming time course, and 13,672 loci that were open specifically in iPSCs when compared to MEFs. The majority of regions that changed chromatin accessibility mapped to enhancer regions (79%), suggesting that chromatin remodeling preferentially occurs at enhancers during the initial phases of reprogramming. Strikingly, Nudt21 knockdown prompted rapid closure of chromatin at MEF enhancers after as little as 3 days of reprogramming, while the same regions remained accessible in control cells (Fig. 6C, SFig. 6H). Concomitantly, pluripotency-associated enhancers exhibited increased chromatin accessibility in cells depleted for Nudt21 compared to control cells at days 3 and 6 of reprogramming (Fig. 6C, SFig. 6H).
Many of the chromatin modifiers targeted by APA are components of the Polycomb and Trithorax complexes. We therefore hypothesized that these complexes are involved in the observed changes in chromatin accessibility. To examine this prospect, we identified closest proximal transcription start sites (TSSs) for each ATAC-seq peak and overlapped them with published ChIP-seq data for the Trithorax mark, H3K4me3, and the Polycomb repressive mark, H3K27me3 (Kundu et al., 2017). Indeed, we observed high levels of H3K27me3 and H3K4me3 at TSSs associated with MEF and ESC associated enhancer regions, respectively (Fig. 6D). Pathway enrichment analysis for genes adjacent to ATAC-seq regions that close during reprogramming revealed enrichment for “TGFβ pathway” and “senescence”, while genes associated with loci that progressively open during reprogramming were enriched for “histone modification”, “cytosine methylation” and “pluripotency” (Fig. 6E). Together, these results reinforce the link between APA-mediated regulation of chromatin factors and the increased reprogramming efficiency observed with Nudt21 knockdown.
DISCUSSION
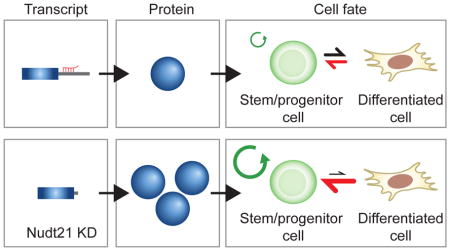
Proper establishment and maintenance of cell fate relies on key regulatory factors. To date, our understanding of these processes has focused largely on the direct transcriptional regulators; yet, post-transcriptional and translational mechanisms of cell fate control remain underappreciated. Our results suggest that post-transcriptional regulation plays a key role in reprogramming, transdifferentiation and stem/progenitor cell differentiation. Specifically, we have identified the RNA binding protein Nudt21 as a novel regulator of cell fate using induced pluripotency as a discovery tool. Expanding upon this finding, we dissected mechanism of action for Nudt21 and extended its role to alternative cell fate transitions, including the generation of iTSCs and the differentiation of ESCs and myeloid progenitors. Thus, our results reveal that Nudt21 suppression facilitates both the acquisition and maintenance of distinct stem or progenitor cell states (Fig. 7A).
Figure 7. Nudt21 alters polyadenylation site usage and modulates cell fate transitions.

A) A model showing the effect of Nudt21 knockdown.
B) A model showing the molecular mechanism of Nudt21 knockdown.
Mechanistically, Nudt21 suppression exerts its effect on cell fate by inducing a widespread switch of APA patterns in over 1,500 transcripts. This, in turn, relieves miRNA-mediated degradation, revealing a simple yet effective post-transcriptional mechanism to influence gene expression. Our finding that only a fraction of Nudt21-dependent APA changes lead to altered protein levels underscores the importance of measuring protein levels in parallel with APA patterns to identify meaningful targets. This result is in good accordance with several recent studies that reported only modest differences in transcript stability, translational efficiency and corresponding protein abundance for mRNAs with proximal polyadenylation and shorter 3′ UTRs (Gruber et al., 2014; Spies et al., 2013). Despite the low correlation between proximal polyadenylation and protein abundance, it has been suggested that tissue or cell type-specific APA patterns are critical for establishing requisite gene expression programs (Neve et al., 2016).
Here we demonstrate for the first time that APA indeed regulates a pivotal subset of genes that potently influence cell fate transitions. Interestingly, this subset was strongly enriched for chromatin-related genes (Fig. 7B). Some of these genes (Wdr5, Jmjd1c, Chd1, and Rybp) have previously been implicated in iPSC reprogramming (Ang et al., 2011; Gaspar-Maia et al., 2009; Li et al., 2017b; Shakya et al., 2015), hematopoietic progenitor maintenance, leukemia (Grebien et al., 2015; Zhu et al., 2016) and TSC formation (Pirity et al., 2005) while other factors such as Anp32e, Chd9, Phc1, Rtf1, and Spin1 are novel regulators of cell fate. Importantly, simultaneous knockdown of each of these genes with Nudt21 abrogated its effect on reprogramming, suggesting that these are critical downstream targets of Nudt21 responsible for safeguarding cell identity. The extensive closing of MEF-enhancers and the accelerated opening of ESC-specific regions in Nudt21 depleted cells undergoing reprogramming support a model in which APA regulates the expression of chromatin factors which in turn alter the epigenomic landscape favoring cell fate transition. However, it remains to be tested whether the same or different sets of Nudt21 targets are involved in alternative cell fate transitions such as ESC and myeloid differentiation and iTSC generation. We also recognize that some of the ~1,500 Nudt21 targets that do not change at the protein level may contribute to cell fate change by alternative mechanisms that remain to be elucidated (Mayr, 2017).
Based on the finding that Nudt21 suppression delays progenitor cell differentiation, it will also be interesting to test whether its perturbation contributes to tumorigenesis by modulating cell proliferation and/or rewiring cell identity. Indeed, Nudt21 suppression was previously shown to promote the growth of a glioblastoma cell line, although possible changes to cell fate were not examined (Masamha et al., 2014). Interestingly, reanalysis of this study reveals that Anp32e, Wdr5 and Rybp are also targets of Nudt21 in the glioblastoma model, suggesting that reprogramming to pluripotency and malignant transformation may utilize common pathways (Apostolou and Hochedlinger, 2013) (SFig. 6I). Our observation that cancer-associated pathways are generally enriched among the Nudt21-repsonsive transcripts further supports a possible role of APA in driving tumorigenesis. Finally, our findings may have relevance in potential therapeutic settings as the modulation of Nudt21 levels could be exploited to expand desired progenitor cell populations or drive cancer cells into differentiation.
STAR METHODS
CONTACT FOR REAGENT AND RESOURCE SHARING
Further information and requests for resources and reagents should be directed to and will be fulfilled by the Lead Contact, Konrad Hochedlinger (khochedlinger@mgh.harvard.edu).
EXPERIMENTAL MODEL AND SUBJECT DETAILS
Derivation of mouse embryonic fibroblasts
Mouse embryonic fibroblasts (MEFs) were generated essentially as described (Bar-Nur et al., 2014). Following timed mating, embryos were dissected from pregnant females at E13.5. The head, limbs, spinal cord, gonads, and internal organs were removed and the remaining tissue was minced in 200 μl of Trypsin-EDTA (Life Technologies). Following a 5 minutes incubation at 37°C, the Trypsin-EDTA was quenched in 10 ml of MEF growth media (500 ml DMEM (Life Technologies) 10% fetal bovine serum (Hyclone), 1X non-essential amino acids (Life Technologies), 1X Glutamax (Life Technologies), 55 μM beta-mercaptoethanol (Sigma)) and cultured at 37°C at 4% oxygen. For reprogramming experiments, MEFs were derived from mice carrying an inducible, polycistronic OKSM cassette in the 3′ UTR of Col1a1, the M2-rtTA transactivator at the Rosa26 locus, and an EGFP reporter construct under control of Pou5f1 regulatory elements(Lengner et al., 2007). For transdifferentiation experiments to neurons, MEFs derived from mice carrying a TAU-GFP reporter were used (Tucker et al., 2001) and MEFs established from mice harboring a SOX2-GFP reporter were used for transdifferentiation to induced trophoblast stem cells (Arnold et al., 2011).
Induction of pluripotency
To induce expression of the pluripotency factors, reprogrammable MEFs were seeded at a density of 15,000 cells per well of a 12 well plate coated with 0.2% gelatin (Sigma). Induction media contained ES culture media (500 ml KO-DMEM (Life Technologies) 15% fetal bovine serum (Hyclone), 1X non-essential amino acids (Life Technologies), 1X Glutamax (Life Technologies), 1000 U/ml leukemia inhibitory factor, 55 μM beta-mercaptoethanol (Sigma)) supplemented with 50 μg/ml ascorbic acid (Sigma) and 2 μg/ml doxycycline hyclate (Sigma). Unless otherwise indicated, reprogrammable MEFs were induced for 12 days, followed by 4 days of doxycycline withdrawal to ensure transgene independence. Alkaline phosphatase staining was performed using a Vector Red kit (Vector Labs) according to the manufacturer’s recommendation.
Transdifferentiation assays
For direct conversion of fibroblasts into neurons, Nudt21 and control siRNAs were transfected into TAU-GFP/rtTA MEFs using Lipofectamine-2000 per the manufacturer’s recommendation. The cells were infected with doxycycline-inducible lentiviral vectors (FUW-TetO-Ascl1, FUW-TetO-Myt1l and FUW-TetO-Brn2) in MEF growth media. Two days after infection, the medium was changed to neuron induction medium (DMEM-F12, 1X N2 supplement, 1X Glutamax, 25 μg/ml insulin (Sigma)) supplemented with 2 μg/ml of doxycycline (Sigma). Media was changed every two days. Cultures were analyzed for TAU-GFP expression by flow cytometry after 7 days of conversion.
For direct conversion of B cells into macrophages, pre-B cells (C10 line(Bussmann et al., 2009)) were infected with lentiviral vectors carrying shRNA for Nudt21 or shRNA Renilla as a control. The cells were cultured in RPMI Medium, 10% charcoal stripped FBS, 1X glutamax, 1X penicillin/streptomycin, 55 μM beta-mercaptoethanol. To induce macrophage transdifferentiation, C10 cells were plated at 50,000 cells/cm2 in media supplemented with β-estradiol (Sigma, E2758) and macrophage cytokines (10 ng/ml IL3 and 10 ng/ml CSF, both from Peprotech). The indicated time points were analyzed for CD19 and MAC-1 expression by flow cytometry.
For direct conversion of MEFs into trophoblast stem cells, Sox2-GFP/rtTA MEFs were infected with doxycycline-inducible lentiviral vectors (pLV-TetO-Gata3, pLV-TetO-Eomes and pLV-TetO-Tfap2c) in MEF media. Eighteen hours later, media was changed to TSC reprogramming medium (RPMI supplemented with 20% FBS, 0.1 mM β-mercaptoethanol, 1X glutamax, 25 ng/ml human recombinant FGF4 (PeproTech), 1 μg/ml heparin (Stemcell Technologies), and 2 μg/ml doxycycline (Sigma)). TSC reprogramming medium was changed every other day for 20 days, followed by 10 days in TSC culture medium. TSC culture medium contained 30% RPMI supplemented with 20% FBS, 1% non-essential amino acids, 2 mM L-glutamine, 25 ng/ml human recombinant FGF4 (PeproTech) and 1 μg/ml heparin (Sigma-Aldrich), and 70% MEF conditioned media with the same supplements. Ten days after doxycycline removal, plates were screened for Sox2-GFP+/Cdx2+ primary iTSC colonies.
Lyz-GFP/ER-HoxB8 cells (Wang et al., 2006) were maintained in RPMI medium supplemented with 10% FBS, 1X glutamax, 1X penicillin/streptomycin and SCF. The source of SCF was conditioned media generated from a Chinese hamster ovary (CHO) cell line that stably secretes SCF. Conditioned medium was added at a final concentration of 2%. β-estradiol (Sigma, E2758) was added to a final concentration of 0.5 μM from a 10-mM stock dissolved in 100% ethanol. To induce differentiation, Lyz-GFP/ER-HoxB8 cells were plated at 50,000 cells/cm2 in RPMI medium supplemented with 10% FBS, 1X glutamax, 1X penicillin/streptomycin and SCF without β-estradiol. Lyz-GFP expression was analyzed by flow cytometry after 3 days of differentiation.
All the products for cells culture were obtained from Thermo Fisher Scientific unless otherwise specified.
Teratoma assays
For teratoma generation, iPS cell lines were harvested and resuspended in 600 μl of ES culture media per confluent 6-well dish. Recipient mice were anesthetized with Avertin (1.61 g/ml 2,2,2-tribromoethanol (Sigma Aldrich) in tert-amyl alcohol (Sigma Aldrich)) and injected with 150 μl of cell suspension subcutaneously. Tumors were harvested 3 to 4 weeks after injection and analyzed histologically.
Embryoid body generation
Embryoid bodies were derived using the hanging drop method. Briefly, iPS cells were trypsinized and pre-plated directly onto plastic tissue culture dishes for one hour in ES growth media to remove fibroblasts. Following centrifugation, the cells were resuspended at a density of 13,000 cells/ml in EB media (15% fetal bovine serum (Hyclone), 1X non-essential amino acids (Life Technologies), 1X Glutamax (Life Technologies), 0.4% 1-thioglycerol (Sigma-Aldrich), 1 mM Sodium Pyruvate (Life Technologies), 10 μg/ml Iron-saturated transferrin (Sigma-Aldrich), 50 μg/ml ascorbic acid (Sigma-Aldrich)) supplemented with 2 μg/ml doxycycline (Sigma-Aldrich). The cells were then cultured in 30 μl hanging drops for three days. At that time, EBs were collected and seeded into non-adherent plates and incubated with constant agitation for an additional 3 days.
METHOD DETAILS
Serial enrichment shRNA screen
Reprogrammable MEFs were infected with a pooled shRNA library (621,000 shRNAs) in MEF growth media supplemented with 10 μg/ml polybrene (EMD-Millipore). Following a 48-hour recovery period, the infected cells were passaged onto gelatinized 15 cm2 cell culture dishes in induction media for 10 days, followed by 4 days of doxycycline withdrawal. The cells were then harvested, pooled, and purified using SSEA1-linked magnetic beads and an AutoMACS sorter according to the manufacturer’s recommendations (Miltenyi). SSEA1-enriched cells were FACS-sorted for OCT4-GFP and lysed in 10 mM Tris-HCl pH 8.0, 10 mM EDTA, 10 mM NaCl, 0.5% SDS. To obtain genomic DNA, the lysates were treated with 0.1 mg/ml RnaseA at 37°C for 30 minutes, 0.5 mg/ml Proteinase K at 55°C for 2 hours, and then subjected to phenol-chloroform extraction with ethanol precipitation. The resulting genomic DNA was used as template to amplify the resident shRNA vectors via PCR. Each 50 μl PCR reaction contained 2.5 μg genomic DNA template, 200 μM dNTPs, 400 nM of each PCR primer (pHAGE-Mir-PCR: 5′-GCAAACTGGGGCACAGATGATGCGG; BC1R-L: 5′-CGCCTCCCCTACCCGGTAGA), 1X Q5 high GC buffer, and 0.5 μl Q5 polymerase (New England Biolabs). PCR was performed with the following program: 94°C for 4 minutes (1 cycle), 94°C for 30 seconds, 60°C for 30 seconds, 72°C for 45 seconds (35 cycles), 72°C for 10 minutes (1 cycle). PCR products for each sample were pooled, ethanol precipitated, resuspended, and gel-purified using the QIAquick Gel Extraction Kit (Qiagen). The purified shRNA PCR products were used to generate sub-libraries for the next round of shRNA library screens and also to generate sequencing libraries for Solexa sequencing.
For sub-library generation, the purified PCR product was digested with NotI and MluI, and then gel-purified using the QIAquick Gel Extraction Kit (Qiagen). Approximately 50 ng of the purified shRNA fragment and 125–250 ng of NotI/MluI pHAGE-Mir vector backbone were ligated in 5 ul ligation reaction using T4 ligase (New England Biolabs). Then, 1 μl ligation reaction was used to transform 20 μl Electromax competent cells DH10b (Life Technology) via electroporation. To maintain the representation of the library, we required at least 100X coverage (i.e., the number of transformed colonies must be at least 100-fold greater than the number of shRNAs in the library). Transformed colonies were pooled and cultured in 300 ml LB-Carbenicillin (100 μg/ml) and grown at 30°C for 2–3 hrs. The bacteria were collected and the DNA library was extracted using a Genelute Maxiprep kit per the manufacturer’s recommendations (Sigma).
For Solexa sequencing, purified shRNA PCR product was used as template for further PCR that included 500 ng of purified shRNA PCR product, 200 μM dNTPs, 2 μM of PCR primer (p5 and p7-see below), 1x Q5 high GC buffer, and 1 μl Q5 polymerase (New England Biolabs). PCR was performed with the following program: 94°C for 4 minutes (1 cycle), 94°C for 30 seconds, 50°C for 20 seconds, 72°C for 30 seconds (2 cycles), 94° C for 30 seconds, 60°C for 20 seconds, 72°C for 30 seconds (20 cycles), 72°C 10 minutes (1 cycle). PCR products were gel-purified using the QIAquick Gel Extraction Kit (Qiagen) and submitted for Solexa sequencing using a custom sequencing primer, mir30-EcoRI.
mir30-EcoRI: 5′-TAGCCCCTTGAATTCCGAGGCAGTAGGCA
p5-miSeq: 5′-ATGATACGGCGACCACCGAGATCTACACCTAAAGTAGCCCCTTGAATTC
p7-miSeq-1: 5′-CAAGCAGAAGACGGCATACGAGACGATAGTGAAGCCACAGATGTA
p7-miSeq-2: 5′-CAAGCAGAAGACGGCATACGAGACACTAGTGAAGCCACAGATGTA
p7-miSeq-3: 5′-CAAGCAGAAGACGGCATACGAGACTATAGTGAAGCCACAGATGTA
p7-miSeq-4: 5′-CAAGCAGAAGACGGCATACGAGACCTTAGTGAAGCCACAGATGTA
Single-end 51 bp reads were obtained using the Illumina HiSeq or MiSeq instrument. Successful sequencing yielded 22 nucleotides that identify the shRNA, followed by a constant region and a 2 nucleotide barcode to identify the sample. Successful reads were extracted from the sequencing data and matched to the shRNA library annotation file and 2-nucleotide sample bar code. The total number of reads that were identified for each shRNA, sample, and round, were counted. The counts were normalized against the total number of counts for that sample and round and then multiplied by the total number of shRNAs in the initial library. A pseudocount of 1 was added to each normalized count to downweight enrichment derived from low read counts and to avoid division by zero in calculating fold-changes. The enrichment for individual shRNAs in each round was calculated as the log2 fold change of the Oct4-GFP+ normalized counts over the maximum of the normalized counts of the controls (T0, No-Dox, and Oct4-GFP-). The cumulative enrichment for each shRNA in each round was calculated as the sum of the log2 fold changes for that round and all previous rounds. The overall enrichment of each shRNA was defined as the maximum of the cumulative enrichment scores among all rounds.
Cell cycle analysis
To determine cell cycle dynamics, reprogrammable MEFs were treated with doxycycline for 48h and subsequently exposed to 20uM BrdU (Sigma) for 30 minutes in ES culture media. The cells were then trypsinized and kept on ice in 100 μl of PBS (Life Technologies). Next, two milliliters of cold ethanol were added dropwise to cells, which were then incubated for 30 minutes on ice. Two milliliters 4N HCl were added for an additional 30 minutes. Cells were then centrifuged at 500 RPM for 5 minutes at 4°C and res uspended in 1ml of 0.1N Sodium tetraborate decahydrate (Sigma), pH 8.5 and washed with staining buffer (2% FBS and 0.5% Tween-20 in PBS). Anti-BrdU antibody (mouse, Agilent M074401–8) was added to cells for 30 minutes at 23°C at a concentration of 5 μg/ml. The cells were then washed three times in PBS incubated with anti-mouse FITC secondary antibody (BD Biosciences, 55434) for 30 minutes at 23°C at a dilution of 1:100. After 3 additional washes with PBS, the cells were resuspended for analysis in PBS containing 2% FBS and 5ug/ml propidium iodide. The samples were then analyzed immediately on a MACSQuant cytometer.
Cell Trace experiments were conducted according to the manufacturer’s recommendation (Thermo Fisher Scientific).
RNA preparation
Total RNA isolation was performed using the miRNeasy mini kit (Qiagen). RNA was eluted from the columns using RNase-free water and quantified using a Nanodrop ND-1000. cDNA was produced with the High Capacity RNA-to-cDNA kit (Applied Biosystems). For detection of mature miRNAs, RNA was retrotranscribed using the TaqMan™ MicroRNA Reverse Transcription Kit (Applied Biosystems) following the manufacturer instructions.
qRT-PCR analyses
For gene expression analysis, qRT-PCR reactions were set up in triplicate with the Brilliant III SYBR Master Mix (Agilent Genomics) with primers listed in Supplementary Table 3. Reactions were run on LightCycler 480 (Roche) PCR machine with 40 cycles of 30 seconds at 95°C, 30 se conds at 60°C and 30 seconds at 72°C. For mature miRNA detection, qRT-PC R reactions were set up in triplicate with the TaqMan™ Universal PCR Master Mix (no AmpErase™ UNG, Applied Biosystems) and the miRNA specific TaqMan™ MicroRNA assays (hsa-miR-34c assay ID 000428 (4427975), mmu-miR-34c* assay ID 002584 (4427975), hsa-miR-29a assay ID: 002112 (4427975) hsa-miR-29a* assay ID: 002447 (4427975)). Reactions were run on LightCycler 480 (Roche) PCR machine with 40 cycles of 15 seconds at 95°C, and 1 minute at 60°.
Vectors and virus production and infection
FUW-TetO-Ascl1, FUW-TetO-Myt1l, FUW-TetO-Brn2, pLV-TetO-Gata3, pLV-TetO-Eomes, and pLV-TetO-Tfap2c lentiviral vectors have been described previously (Vierbuchen et al., 2010). For virus production, HEK293T cells were co-transfected with vector plasmid and packaging plasmids (pVSVG and pΔ8.9) using calcium phosphate transfection. Viral supernatants were harvested 48 hours later and concentrated by ultracentrifugation at 20,000 X g for 2 hours at 20°C. Viral concentrates were re-suspended in PBS a nd stored at −80°C.
siRNA and miRNA transfection
For knockdown experiments, cells were transfected with pooled siRNA at a final concentration of 15–20 nM, using Lipofectamine-2000 per the manufacturer’s recommendation (Thermo Fisher Scientific). Briefly, Lipofectamine-2000 and siRNA were added to separate aliquots of OptiMEM and incubated for 5 minutes at 23°C. The siRNA and transfection reagent were then combined and incubated for an additional 15 minutes at 23°C. Trypsinized cells were seeded in 750 μl of media at a density of 20,000 cells per one well of a 12-well dish and the transfection mixture was added immediately. Cell culture media was replaced 6 hours after transfection. Nudt21 and Wdr5 pooled esiRNAs were purchased from Sigma-Aldrich. All other pooled siRNAs were purchased from GE-Dharmacon.
For miRNA knockdown experiments, cells were transfected as described above except that miR-29a and miR-34c were added to a final concentration of 4 nM and 2 nM, respectively. Control miRNA inhibitors were added to the same final concentration for each corresponding experiment. All miRNA inhibitors were purchased from GE-Dharmacon.
Immunofluorescence assays
Cells were fixed with 4% paraformaldehyde, blocked in PBS containing 10% goat serum and 0.1% triton and incubated with primary antibodies overnight at 4°C. On the next day, the cells were exposed to secondary antibodies (all Alexa Fluor from Thermo Fisher Scientific) at 23°C for one hour. The primary antibodies used were CDX2 (clone C-20, Santa Cruz biotechnology) and GFP (NB600-308). Nuclear staining was performed using DAPI solution (564907, BD Biosciences).
Western blot
The following antibodies were used for Western blot: Nudt21 (Santa Cruz Biotechnology, 2203C3); ACTIN (Cell Signaling Technology, 13E5); WDR5 (Bethyl Labs, A302–430A); RTF1 (Cell Signaling Technology, D7V3W); PHC1 (Cell Signaling Technology, 1F3F3); and c-MYC (Cell Signaling Technology, D84C12).
Poly(A) site mapping
Poly(A) site mapping was carried out as previously described (Spies et al., 2013). Total RNA was extracted with Trizol as per the manufacturer’s recommendations (Life Technologies). Then, 10 μg of total RNA was fragmented with fragmentation reagent (Ambion) at 70°C for 10 minutes followed by precipitation with ethanol. After centrifugation, RNA was dissolved and reverse transcription was performed using Superscript III (Thermo Fisher Scientific) using a custom primer, PASSEQ7-2 RT oligo: [phos]NNNNAGATCGGAAGAGCGTCGTGTTCGGATCCATTAGGATCCGAGAC GTGTGCTCTTCCGATCTTTTTTTTTTTTTTTTTTTT[V-Q]. cDNA was recovered by ethanol precipitation and centrifugation. cDNA ranging from 120–200 basepairs was gel-purified and eluted from 8% Urea-PAGE. Recovered cDNA was circularized with Circligase™ II (Epicentre) at 60 °C overnight. Buffer E (Promega) was added to cDNA and heated at 95°C for 2 minutes, and then slowly cooled to 37°C. Circularized cDNA was linear ized by adding BamHI (Promega). cDNA was centrifuged after ethanol precipitation. PCR was carried out with primers PE1.0 and PE2.0 containing index. Around 200 basepair of PCR product was gel-purified and submitted for sequencing (single end, 100 nucleotides).
ATAC-seq
ATAC-seq was performed as previously described (Buenrostro et al., 2013). 60,000 cells were washed once with 100μl PBS and resuspended in 50μl lysis buffer (10mM Tris-HCl pH 7.4, 10mM NaCl, 3mM MgCl2, 0.2% IGEPAL CA-630). The suspension of nuclei was then centrifuged for 10min at 500g at 4°C, followed by the addition of 50μl transposition reaction mix (25μl TD buffer, 2.5μl Tn5 Transposase and 22.5μl Nuclease Free H2O) and incubation at 37°C for 30min. DNA was isolated using MinElute Kit (Qiagen). Libraries were amplified by PCR (13 cycles). After the PCR reaction, the library was selected for fragments between 100 and 1000bp with AmpureXP beads (Beckman Coulter). Libraries were purified with Qiaquick PCR (Qiagen) and integrity checked on a Bioanalyzer before sequencing.
Flow cytometry
GFP and cell surface marker expression was analyzed with an LSR II FACS (BD Biosciences) using Diva v6.1.2 (BD Biosciences) and FlowJo software v10.2 (TreeStar). Primary antibodies used were CD19 (clone 1D3, BD Biosciences), MAC-1 (clone M1/70, BD Biosciences), SSEA1 (clone eBioMC-480, eBiosciences), THY1 (clone 53–2.1, eBiosciences), and EPCAM (clone G8.8, eBiosciences).
Cell lysis and protein digestion
Cells were suspended in buffer containing 8M urea, 200 mM EPPS pH 8.5 (Sigma Aldrich), and protease inhibitors (Sigma Aldrich) and syringe lysed 10 times. After centrifugation, clarified lysates were transferred to new tubes. Bicinchoninic acid (BCA) protein assay (Thermo Fischer Scientific) was performed to determine protein concentration. Proteins were then subjected to disulfide reduction with 5mM tris (2 carboxyethyl) phosphine (TCEP; Sigma Aldrich) at 23°C for 30 minutes, followed by alkylation with 10 mM iodoacetamide (Sigma Aldrich) at 23°C for 30 minutes in the dark, and 15 mM dithiotreitol (Sigma Aldrich) was used to quench excess iodoacetamide 23°C for 15 minutes in the dark. Proteins (200 μg) were then chloroform/methanol precipitated and washed with methanol prior to air drying. Samples were resuspended in 8 M urea (Sigma Aldrich), 50 mM EPPS, pH 8.5, and then diluted to <1M urea with 50mM EPPS, pH 8.5.
Protein digestion and peptide labeling
Proteins were digested for 16 hours with LysC (1:100 enzyme:protein ratio) at 23°C, followed by trypsin (1:100 enzyme:protein ratio) for 6 hours at 37°C. Peptides were quantified using Pierce Quantitative Colorimetric Peptide Assay. TMT reagents (0.8 mg; Thermo Fisher Scientific) were dissolved in 40 μL anhydrous acetonitrile (Sigma Aldrich), and 7 μL was used to label 70 μg peptides in 30% (v/v) acetonitrile. Labeling continued for 1 hour at 23°C, until reaction was quenched using 7 μL 5% hydroxylamine (Sigma Aldrich). TMT-labeled peptides were pooled, vacuum centrifuged, and cleaned using 50 mg Sep-Pak cartridges (Waters).
Offline basic pH reversed-phase (BPRP) fractionation
The pooled TMT-labeled peptide sample was fractionated using BPRP HPLC. We used an Agilent 1260 Infinity pump equipped with a degasser and a single wavelength detector (set at 220 nm). Peptides were subjected to a 50 minute linear gradient from 8% to 40% acetonitrile in 10 mM ammonium bicarbonate pH 8 at a flow rate of 0.6 mL/min over an Agilent 300Extend C18 column (3.5 μm particles, 4.6 mm ID and 250 mm in length). We fractionated into a total of 96 fractions, then consolidated samples into 24 fractions and vacuum centrifuged to near dryness. Twelve fractions were acidified to 1% formic acid (Sigma Aldrich), desalted via StageTip, dried via vacuum centrifugation, and reconstituted in 5% acetonitrile, 5% formic acid for LC-MS/MS processing.
Liquid chromatography and tandem mass spectrometry
Mass spectrometry data were collected using an Orbitrap Fusion mass spectrometer (Thermo Fischer Scientific) equipped with a Proxeon EASY-nLC 1000 liquid chromatography (LC) system (Thermo Fisher Scientific). Peptides were separated on a 100 μm inner diameter microcapillary column packed with ~35 cm of Accucore C18 resin (2.6 μm, 150 Å, Thermo Fisher Scientific). We loaded ~2 μg sample onto the column. Peptides were separated using a 3 hour gradient of acidic acetonitrile. We used the multinotch MS3-based TMT method (McAlister et al., 2014). The scan sequence began with a MS1 spectrum (Orbitrap analysis; resolution 120,000; mass range 400–1400 Th). MS2 analysis followed collision-induced dissociation (CID, CE = 35) with a maximum ion injection time of 150 ms and an isolation window of 0.7 Da. The 10 most abundant MS1 ions of charge states 2–6 were selected for MS2/MS3 analysis. To obtain quantitative information, MS3 precursors were fragmented by high-energy collision-induced dissociation (HCD, CE = 65) and analyzed in the Orbitrap (resolution was 60,000 at 200 Th) with a maximum ion injection time of 2 ms and a charge state-dependent variable isolation window of 0.7 to 1.2 Da(Paulo et al., 2016).
IP mass spectrometry analysis
The Flag-CFIm25-pCDNA3.1 plasmid was transfected into HEK293 cells with Lipofectamine 2000 per manufacturer’s instruction (Invitrogen) and single colonies of stable transfectants were selected with G418. Nuclear extracts from control HEK293 cells or a Flag-CFIm25 cell line were used for immunoprecipitation with anti-Flag antibodies (M2, Sigma). Immunoprecipitated proteins were eluted from the beads with 3xFlag peptides and eluted proteins were analyzed by mass spectrometry.
Luciferase assays
HEK293 cells were transfected at 50% confluency using Lipofectamine-2000 per the manufacturer’s recommendation. Briefly, 0.25 μg of luciferase constructs and 0.025 μg of renilla control plasmid were added to OptiMEM and incubated for 5 minutes at 23°C. The plasmids and transfection reagent were then combined and incubated for an additional 15 minutes at 23°C, after which the solution was added dropwise to the cells. Assays including miRNA mimics were transfected similarly, except that mimics were mixed with the luciferase constructs at a final concentration of 10 nM prior to the addition of Lipofectamine-2000. The miRNA mimics for miR-29a and miR34c were purchased from GE-Dharmacon. Luciferase activity was detected using a Dual-Glo Luciferase Assay Kit according to the manufactuer’s protocol (Promega Corporation).
Oligos for cloning 3′ UTRs for reporter assays (Supplemental Table S3):
| Rybp-F | ACATCTAGAGATTGCACATGGAATTGTGAAAC |
| Rybp-dist-rev | ACACTCGAGAAATTTTACTATTTTATTTGTGAAAAAACTAC |
| Rybp-prox-rev | ACACTCGAGATGTACATGGAAAATTGTGCAC |
| Jmjd1c-F | ACATCTAGATGCGGTTGGAACTGGGATGC |
| Jmjd1c-dist-rev | ACACTCGAGTCCAGCTTCTTGATAAAGTCTTTTAATG |
| Jmjd1c-prox-rev | ACACTCGAGAGAATTTCTTGGCACTGATGG |
| Wdr5-F | gagctcGTCCTGGCTCCATGGGAGAC |
| Wdr5-dist-rev | aagcttTACAACTTACAACCTTTCTG |
| Wdr5-prox-rev | aagcttTTACAAGGCATGAAAATCTT |
QUANTIFICATION AND STATISTICAL ANALYSIS
Statistical Analysis
Statistical analyses were performed using Prism software (GraphPad). Details for statistical analyses, including replicate numbers, are included in figure legends.
Bioninformatics analysis
For the proteomic, scaling and statistical analysis were performed using the Rpackage DESeq2 (1.6.3). Differential expressed proteins between siCtrl and siNudt21 samples were selected based on the nbinomWaldTest (FDR < 0.01) and 1.2-fold change cut-off. Heatmaps were generated using RStudio (Version 1.0.14). Gene ontology, miRNA enrichment analysis and pathway enrichment analysis were performed using EnrichR(Chen et al., 2013).
For PAS-seq analyses, raw reads (single end, 100 nucleotides) were scanned for consecutive adenine nucleotides (at least 15) and then the polyA and downstream sequences were trimmed. The remaining sequences were mapped to the mouse genome (construct mm9), using TopHat (v2.1.0) with -g 1 parameter(Kim et al., 2013). Alignment with the possibility of internal priming was removed if a read had 6 or more consecutive adenine nucleotides or more than 7 adenine nucleotides in the 10 nucleotide downstream of the polyA site. From the remaining reads, those with the 3′ end in the interval of −40nt to +40nt of potential polyA sites were used to generate the count table. To find the polyA sites which were differentially used, we adapted diffSpliceDGE and topSpliceDGE from edgeR package(v3.8.5)(Robinson et al., 2010). These functions, primarily used to find differential exon usage, generated a list of sites with significant difference between samples after modeling the polyA sites read counts and comparing the log fold change of each polyA site to the log fold change of the entire gene. This set was then filtered based on FDR (<0.05) and the observed shift in the ratio of polyA site read counts to gene read counts (>15%). Finally, from the remaining sites, the top two were chosen based on P-value and marked distal or proximal based on their relative location within the gene.
For the analysis of ATAC-seq data, sequencing reads were first mapped to mm10 reference genome using BWA-MEM (Li, 2012) with default parameters, followed by calling peaks using HOTSPOT2 (John et al., 2011). As a result, at each time point we identified 30,000–50,000 peaks, which showed high consistency between biological duplicates. The union of these peak sets at all time points (82309 peaks total) was used to calculate the ATAC-seq coverage over each peak region across all samples. We identified 16661 MEF-specific peaks with the strongest coverage in MEFs and >5-fold lower coverage in iPSC, and 13672 iPSC-specific peaks with the strongest coverage in iPSCs and >5-fold lower coverage in MEFs. Only a minority (2.5%) of MEF-specific peaks overlapped with TSS, whereas the majority (79%) of these peaks overlapped with annotated enhancer regions (Shen et al., 2012), defined as the 1Kb-vicinity of the reported center coordinate. The ATAC-seq read densities over enhancer regions were compared across all samples to identify MEF- and iPSC-specific enhancers.
For UGUA distributions analysis, the sequence around distal and proximal poly(A) sites were extracted using BEDTools (v2.25.0) (Quinlan and Hall, 2010) for alternatively polyadenylated sites and the same number of sites with no significant changes between control and experiment chosen randomly. UGUA distributions were extracted from these sequences in the format of a histogram with 20bps bin size. The smooth underlying function of the normalized histogram was then generated using interp1d class in SciPy library (http://www.scipy.org/) and then visualized.
For CLIP-seq data analysis, PAR-CLIP signals from GSE37401 (Martin et al., 2012) were normalized at proximal and distal PASs for target and non-target genes to count the binding frequency per transcript. For proximal PAS, CLIP read counts were divided by the PAS-seq read counts of that PAS plus all downstream PASs, and for distal PAS the CLIP read counts were divided by the PAS-seq read counts of the distal PAS. Wig files were converted to bigwigs, and the CLIP signals on -100nt to 100nt region around poly(A) sites were extracted by deepTools (v2.4) (Ramirez et al., 2016) using those bigwig files, separately for each strand. Signals were combined, normalized as described above, and averaged in Python. The generated curves for each set of 200nt intervals (proximal and distal sites in “target” and “nontarget” genes) were then scaled by their own total coverage, to make the comparison of distributions easier.
AGO2 CLIP-Seq was downloaded from GSE25310 (Leung et al., 2011). Mapping was done after 3’s linker was removed. The reads aligned to the same exact region were counted as one. The number of reads mapped on the region between proximal and distal polyA sites of alternatively polyadenylated genes were normalized by the number of mapped reads in each sample. To have a per transcript coverage, this value was divided by PAS-Seq read counts at distal site. The distribution of this value for alternatively polyadenylated and differentially expressed genes was illustrated as separate box plots for genes with repressed and enhanced expressions in Fig. 5A.
For Multidimensional Scaling (MDS) analyses were done in R. Correlation between observed pairwise distances and pairwise distances after dimension reduction was calculated and the two dimensions that lead to the highest correlation were chosen.
The computational analyses and visualization if not specified otherwise, were done in Python 2.7. Where necessary, conversion between BAM and BED files were done using BEDTools (v2.25.0) (Quinlan and Hall, 2010) and BAM files were sorted or indexed via SAMtools (v1.1) (Li et al., 2009). Kolmogorov–Smirnov test, implemented in Scipy library, was used in multiple cases to determine if two samples are from the same distribution. The generated p-value quantifies the significance of the observations coming from different distributions. To calculate the correlation coefficient for scatterplots, the stats.pearsonr method from Scipy library was used.
Large-scale Proteomic Data Analysis
Mass spectra were processed using a SEQUEST-based in-house software pipeline (McAlister et al., 2014). Spectra were converted to mzXML using a modified version of ReAdW.exe. Database searching used the mouse proteome downloaded from Uniprot (http://www.uniprot.org/downloads) in both forward and reverse directions. Common contaminating protein sequences were included as well. Searches were performed using peptide mass tolerance of 20 ppm, and a fragment ion tolerance of 0.9 Da. These wide mass tolerance windows were chosen to maximize sensitivity in conjunction with SEQUEST searches and linear discriminant analysis (Beausoleil et al., 2006). TMT tags on lysine residues and peptide N termini (+229.163 Da) and carbamidomethylation of cysteine residues (+57.021 Da) were set as static modifications, while oxidation of methionine residues (+15.995 Da) was set as a variable modification.
Peptide-spectrum matches (PSMs) were adjusted to a 1% false discovery rate (FDR) (Elias and Gygi, 2010). Linear discriminant analysis was used to filter PSMs, as described previously (Elias and Gygi, 2010), while considering the following parameters: XCorr, ΔCn, missed cleavages, adjusted PPM, peptide length, fraction of ions matched, charge state, and precursor mass accuracy. PSMs were identified, quantified, and collapsed to a 1% peptide false discovery rate (FDR) and then collapsed further to a final protein-level FDR of 1%. PSMs were quantified from MS3 scans; those with poor quality, MS3 spectra with total TMT reporter signal-to-noise ratio that is <200, or no MS3 spectra were excluded from quantitation. Protein quantitation was performed by summing the signal-to-noise for all peptides for a given protein. Each TMT channel was summed across all quantified proteins and normalized assuming equal protein loading of all 10 channels.
DATA AND SOFTWARE AVAILABILITY
Deposition of sequencing data
Genome-wide sequencing data have been deposited in GEO under the following accession number: GSE104529 (ATAC-Seq); GSE99922 (PAS-Seq). The mass spectrometry proteomics data have been deposited to the ProteomeXchange Consortium via the PRIDE partner repository with the dataset identifiers PXD008078 and PXD008108.
Supplementary Material
A) A schematic representation of the secondary system used for reprogramming.
B) Reprogramming efficiency validation for individual candidate genes. Error bars represent standard deviation of the mean for three independent experiments.
C) Reprogramming efficiency for MEFs treated with independent shRNAs targeting Nudt21. Cells were induced with dox for 12 days, followed by 4 days of dox withdrawal.
D) Alkaline phosphatase staining of transgene-independent iPS colonies following reprogramming with OKS. Cells were induced with dox for 14 days, followed by 4 days of dox withdrawal.
E) Quantification of alkaline phosphatase staining of transgene-independent iPS colonies following reprogramming with OKS. Error bars represent standard deviation of the mean for three independent experiments. Statistical significance was determined using a two-tailed unpaired Student’s t-test (**** p<0.0001).
F) Teratomas derived from iPS cells generated with Nudt21 knockdown.
G) Quantification of the dox withdrawal assay with Nudt21 knockdown.
H) A cell trace time course for proliferation with Nudt21 knockdown at the indicated time points.
I) Cell proliferation analysis with Nudt21 knockdown.
J) AnnexinV staining for cells treated with Nudt21 or control siRNAs.
K) Bright field images showing uninduced MEF with Nudt21 siRNA or control siRNA. Scale bar = 10 μm
L) qRT-PCR quantification for MEF and pluripotency related genes in uninduced MEFs with Nudt21 siRNA or control siRNA.
A) Flow cytometry analysis showing size and granularity differences for pre-B cell to macrophage transdifferentiation.
B) qRT-PCR quantification of Nudt21 knockdown in pre-B cells.
C) Flow cytometry analysis showing lineage marker transitions for pre-B cell to macrophage transdifferentiation.
D) A Western blot at day 3 of transdifferentiation showing Nudt21 knockdown in MEFs undergoing transifferentiation to iNs.
E) Flow cytometry analysis of TAU-GFP for iN transdifferentiation.
F) A Western blot showing Nudt21 knockdown at day 3 during iTSC transdifferentiation.
G) Immunofluorescence for iTSC markers. Scale bar=100 μm.
A) Gene tracks showing PAS-seq for Nudt21 targets.
B) CLIP-seq signal around polyA sites for Nudt21 (left panels) and CFIm68 (right panels).
C) Gene ontology analysis for Nudt21 interacting proteins.
D) Volcano plot representation of Nudt21 immunoprecipitation mass-spectrometry data. Grey dots: non-significantly enriched proteins (FDR > 0.05). Black dots: significantly enriched proteins (FDR < 0.05). Nudt21, CFIm68 and CFIm58 are highlighted in color.
E) qRT-PCR analysis for CFIm68 and Pcf11 knockdown at day 3 of reprogramming.
F) Correlation plot for APA versus mRNA at day3 and day6 of reprogramming.
A) Gene Ontology analysis for Nudt21 target proteins that decrease expression 1.2-fold or greater by day 3 of reprogramming.
B) Western blot analysis for RTF1, PHC1, and NUDT21.
C) “TargetScan microRNA” enrichment analysis for miRNA binding within Nudt21 targets that change protein level.
D) miR-29a and miR-34c expression during reprogramming(Polo et al., 2012).
E) Gene tracks showing PAS-seq for chromatin factors targeted by Nudt21.
F) qRT-PCR for miR-34c and miR-29a in MEFs transfected with miR-34c, miR-29a inhibitor, or miR inhibitor control at day 3 of reprogramming.
A) A Western blot showing WDR5 levels with Nudt21 knockdown at day 3 of reprogramming.
B) A Western blot showing WDR5 knockdown with and without Nudt21 knockdown at day 3 of reprogramming.
C) Alkaline phosphatase staining for transgene independent iPS colonies with simultaneous knockdown of Wdr5 and Nudt21. Cells were induced with dox for 12 days, followed by 4 days of dox withdrawal.
D) Quantification of alkaline phosphatase staining for transgene independent iPS colonies with simultaneous knockdown of Wdr5 and Nudt21. Error bars represent standard deviation of the mean for three independent experiments. Statistical significance was determined using a two-tailed unpaired Student’s t-test (**** p<0.0001).
E) qRT-PCR analysis with the indicated knockdown conditions.
F) Reprogramming efficiency based on OCT4-GFP for double knockdown of Nudt21 and RYBP at day 6 of reprogramming. Error bars represent standard deviation of the mean for three independent experiments. Statistical significance was determined using a two-tailed unpaired Student’s t-test (** p<0.01).
G) mRNA levels for three targets of RYBP with Nudt21 knockdown at day 3 of reprogramming.
H) AnnexinV staining for cells co-transfected with the indicated siRNAs.
I) A cell trace time course for proliferation with co-knockdown of Nudt21 with Rybp or Wdr5 at the indicated time points.
A) qRT-PCR analysis at day 3 of reprogramming showing the efficiency of knockdown for chromatin factors with simultaneous knockdown of Nudt21.
B) qRT-PCR analysis at day 3 of reprogramming showing the efficiency of knockdown for Nudt21 with simultaneous knockdown of chromatin factors.
C) Quantification of OCT4-GFP+ cells at nine days of reprogramming, following double knockdown of Nudt21 and the indicated chromatin factors. Error bars represent standard deviation of the mean for three independent experiments. Statistical significance was determined using two-tailed unpaired Student’s t-test (*** p<0.001; **** p<0.0001).
D) Representative images of alkaline phosphatase staining following double knockdown of Nudt21 and the indicated chromatin factors. Cells were induced with dox for 12 days, followed by 4 days of dox withdrawal.
E) Gene expression analysis by qRT-PCR of pluripotency factors at day 9 of reprogramming, following double knockdown of Nudt21 and the indicated chromatin factors.
F) A cell trace time course for proliferation with co-knockdown of Nudt21 with chromatin factors at the indicated time points.
G) AnnexinV staining for cells co-transfected with the indicated siRNAs.
H) Genome browser screenshots showing ATAC-seq data for the Thy-1 and Zfp42 loci.
I) Gene ontology analysis of APA changes identified in a previous study(Masamha et al., 2014).
Supplemental Table 1. MDS parameters. Related to Figure 3.
Supplemental Table 2. Differentially expressed proteins between MEFs treated with Nudt21 siRNA or control siRNA at day 3 of reprogramming. Related to Figure 4.
Supplemental Table 3. Table of Primers used for qRT-PCR. Related to STAR Methods.
Manuscript highlights.
shRNA screen identifies mRNA processing factor Nudt21 as a regulator of cell fate
Nudt21 knockdown enhances reprogramming but disrupts ESC/myeloid differentiation
Nudt21 suppression induces alternative polyadenylation for hundreds of transcripts
Chromatin regulators are enriched among Nudt21 targets important for reprogramming
Acknowledgments
We thank Maris Handley, Amy Galvin, Marianne Gesner, and Eric Surette of the Harvard Stem Cell Institute flow cytometry core. We are grateful to David Sykes for sharing ER-HoxB8/Lyz-GFP cells. We thank Aaron Goldstrohm and members of the Hochedlinger lab for discussions. K.H. was supported by funds from the MGH, NIH (R01 HD058013-06) and the Gerald and Darlene Jordan Chair in Regenerative Medicine. J.B. is grateful for support from the NIH (1F32HD078029-01A1), B.D.S. was supported by an EMBO long-term Fellowship (#ALTF 1143-2015). Y.S. was supported by NIH grants GM090056 and CA17488. G.H. was supported by the NIH Intramural Research Program, Z01ES102745. This work was supported by an NIH grant AG11085 to S.J.E. The authors declare no competing interests.
Footnotes
Author contributions
J.B, B.D.S., Y.S. and K.H. conceived the study and wrote the manuscript. J.B., B.D.S., E.F., M.B., S.Z., and B.A.S. performed the experiments and analyzed the data. G.H. and S.E. constructed the shRNA library and G.H. and M.B. conducted the shRNA screen. K.J.C., M.K., and S.P.G. performed proteomic analysis. Y.C performed mass spectrometry to identify Nudt21 binding partners. F.J. and R.I.S. contributed bioinformatics analysis.
Publisher's Disclaimer: This is a PDF file of an unedited manuscript that has been accepted for publication. As a service to our customers we are providing this early version of the manuscript. The manuscript will undergo copyediting, typesetting, and review of the resulting proof before it is published in its final citable form. Please note that during the production process errors may be discovered which could affect the content, and all legal disclaimers that apply to the journal pertain.
References
- Ang YS, Tsai SY, Lee DF, Monk J, Su J, Ratnakumar K, Ding J, Ge Y, Darr H, Chang B, et al. Wdr5 mediates self-renewal and reprogramming via the embryonic stem cell core transcriptional network. Cell. 2011;145:183–197. doi: 10.1016/j.cell.2011.03.003. [DOI] [PMC free article] [PubMed] [Google Scholar]
- Apostolou E, Hochedlinger K. Chromatin dynamics during cellular reprogramming. Nature. 2013;502:462–471. doi: 10.1038/nature12749. [DOI] [PMC free article] [PubMed] [Google Scholar]
- Arnold K, Sarkar A, Yram MA, Polo JM, Bronson R, Sengupta S, Seandel M, Geijsen N, Hochedlinger K. Sox2(+) adult stem and progenitor cells are important for tissue regeneration and survival of mice. Cell stem cell. 2011;9:317–329. doi: 10.1016/j.stem.2011.09.001. [DOI] [PMC free article] [PubMed] [Google Scholar]
- Bar-Nur O, Brumbaugh J, Verheul C, Apostolou E, Pruteanu-Malinici I, Walsh RM, Ramaswamy S, Hochedlinger K. Small molecules facilitate rapid and synchronous iPSC generation. Nature methods. 2014;11:1170–1176. doi: 10.1038/nmeth.3142. [DOI] [PMC free article] [PubMed] [Google Scholar]
- Beausoleil SA, Villen J, Gerber SA, Rush J, Gygi SP. A probability-based approach for high-throughput protein phosphorylation analysis and site localization. Nature biotechnology. 2006;24:1285–1292. doi: 10.1038/nbt1240. [DOI] [PubMed] [Google Scholar]
- Benchetrit H, Herman S, van Wietmarschen N, Wu T, Makedonski K, Maoz N, Yom Tov N, Stave D, Lasry R, Zayat V, et al. Extensive Nuclear Reprogramming Underlies Lineage Conversion into Functional Trophoblast Stem-like Cells. Cell Stem Cell. 2015;17:543–556. doi: 10.1016/j.stem.2015.08.006. [DOI] [PubMed] [Google Scholar]
- Borkent M, Bennett BD, Lackford B, Bar-Nur O, Brumbaugh J, Wang L, Du Y, Fargo DC, Apostolou E, Cheloufi S, et al. A Serial shRNA Screen for Roadblocks to Reprogramming Identifies the Protein Modifier SUMO2. Stem cell reports. 2016;6:704–716. doi: 10.1016/j.stemcr.2016.02.004. [DOI] [PMC free article] [PubMed] [Google Scholar]
- Boutet SC, Cheung TH, Quach NL, Liu L, Prescott SL, Edalati A, Iori K, Rando TA. Alternative polyadenylation mediates microRNA regulation of muscle stem cell function. Cell stem cell. 2012;10:327–336. doi: 10.1016/j.stem.2012.01.017. [DOI] [PMC free article] [PubMed] [Google Scholar]
- Brown KM, Gilmartin GM. A mechanism for the regulation of pre-mRNA 3′ processing by human cleavage factor Im. Molecular cell. 2003;12:1467–1476. doi: 10.1016/s1097-2765(03)00453-2. [DOI] [PubMed] [Google Scholar]
- Buenrostro JD, Giresi PG, Zaba LC, Chang HY, Greenleaf WJ. Transposition of native chromatin for fast and sensitive epigenomic profiling of open chromatin, DNA-binding proteins and nucleosome position. Nature methods. 2013;10:1213–1218. doi: 10.1038/nmeth.2688. [DOI] [PMC free article] [PubMed] [Google Scholar]
- Bussmann LH, Schubert A, Vu Manh TP, De Andres L, Desbordes SC, Parra M, Zimmermann T, Rapino F, Rodriguez-Ubreva J, Ballestar E, et al. A robust and highly efficient immune cell reprogramming system. Cell stem cell. 2009;5:554–566. doi: 10.1016/j.stem.2009.10.004. [DOI] [PubMed] [Google Scholar]
- Chen EY, Tan CM, Kou Y, Duan Q, Wang Z, Meirelles GV, Clark NR, Ma’ayan A. Enrichr: interactive and collaborative HTML5 gene list enrichment analysis tool. BMC bioinformatics. 2013;14:128. doi: 10.1186/1471-2105-14-128. [DOI] [PMC free article] [PubMed] [Google Scholar]
- Choi YJ, Lin CP, Ho JJ, He X, Okada N, Bu P, Zhong Y, Kim SY, Bennett MJ, Chen C, et al. miR-34 miRNAs provide a barrier for somatic cell reprogramming. Nature cell biology. 2011;13:1353–1360. doi: 10.1038/ncb2366. [DOI] [PMC free article] [PubMed] [Google Scholar]
- Elias JE, Gygi SP. Target-decoy search strategy for mass spectrometry-based proteomics. Methods Mol Biol. 2010;604:55–71. doi: 10.1007/978-1-60761-444-9_5. [DOI] [PMC free article] [PubMed] [Google Scholar]
- Fraguas MS, Eggenschwiler R, Hoepfner J, Schiavinato JL, Haddad R, Oliveira LH, Araujo AG, Zago MA, Panepucci RA, Cantz T. MicroRNA-29 impairs the early phase of reprogramming process by targeting active DNA demethylation enzymes and Wnt signaling. Stem cell research. 2017;19:21–30. doi: 10.1016/j.scr.2016.12.020. [DOI] [PubMed] [Google Scholar]
- Gaspar-Maia A, Alajem A, Polesso F, Sridharan R, Mason MJ, Heidersbach A, Ramalho-Santos J, McManus MT, Plath K, Meshorer E, et al. Chd1 regulates open chromatin and pluripotency of embryonic stem cells. Nature. 2009;460:863–868. doi: 10.1038/nature08212. [DOI] [PMC free article] [PubMed] [Google Scholar]
- Grebien F, Vedadi M, Getlik M, Giambruno R, Grover A, Avellino R, Skucha A, Vittori S, Kuznetsova E, Smil D, et al. Pharmacological targeting of the Wdr5-MLL interaction in C/EBPalpha N-terminal leukemia. Nat Chem Biol. 2015;11:571–578. doi: 10.1038/nchembio.1859. [DOI] [PMC free article] [PubMed] [Google Scholar]
- Gruber AR, Martin G, Muller P, Schmidt A, Gruber AJ, Gumienny R, Mittal N, Jayachandran R, Pieters J, Keller W, et al. Global 3′ UTR shortening has a limited effect on protein abundance in proliferating T cells. Nat Commun. 2014;5:5465. doi: 10.1038/ncomms6465. [DOI] [PubMed] [Google Scholar]
- Gupta I, Clauder-Munster S, Klaus B, Jarvelin AI, Aiyar RS, Benes V, Wilkening S, Huber W, Pelechano V, Steinmetz LM. Alternative polyadenylation diversifies post-transcriptional regulation by selective RNA-protein interactions. Molecular systems biology. 2014;10:719. doi: 10.1002/msb.135068. [DOI] [PMC free article] [PubMed] [Google Scholar]
- Ji Z, Lee JY, Pan Z, Jiang B, Tian B. Progressive lengthening of 3′ untranslated regions of mRNAs by alternative polyadenylation during mouse embryonic development. Proceedings of the National Academy of Sciences of the United States of America. 2009;106:7028–7033. doi: 10.1073/pnas.0900028106. [DOI] [PMC free article] [PubMed] [Google Scholar]
- John S, Sabo PJ, Thurman RE, Sung MH, Biddie SC, Johnson TA, Hager GL, Stamatoyannopoulos JA. Chromatin accessibility predetermines glucocorticoid receptor binding patterns. Nature genetics. 2011;43:264–268. doi: 10.1038/ng.759. [DOI] [PMC free article] [PubMed] [Google Scholar]
- Kim D, Pertea G, Trapnell C, Pimentel H, Kelley R, Salzberg SL. TopHat2: accurate alignment of transcriptomes in the presence of insertions, deletions and gene fusions. Genome biology. 2013;14:R36. doi: 10.1186/gb-2013-14-4-r36. [DOI] [PMC free article] [PubMed] [Google Scholar]
- Kubaczka C, Senner CE, Cierlitza M, Arauzo-Bravo MJ, Kuckenberg P, Peitz M, Hemberger M, Schorle H. Direct Induction of Trophoblast Stem Cells from Murine Fibroblasts. Cell stem cell. 2015;17:557–568. doi: 10.1016/j.stem.2015.08.005. [DOI] [PubMed] [Google Scholar]
- Kundu S, Ji F, Sunwoo H, Jain G, Lee JT, Sadreyev RI, Dekker J, Kingston RE. Polycomb Repressive Complex 1 Generates Discrete Compacted Domains that Change during Differentiation. Molecular cell. 2017;65:432–446. e435. doi: 10.1016/j.molcel.2017.01.009. [DOI] [PMC free article] [PubMed] [Google Scholar]
- Lackford B, Yao C, Charles GM, Weng L, Zheng X, Choi EA, Xie X, Wan J, Xing Y, Freudenberg JM, et al. Fip1 regulates mRNA alternative polyadenylation to promote stem cell self-renewal. The EMBO journal. 2014;33:878–889. doi: 10.1002/embj.201386537. [DOI] [PMC free article] [PubMed] [Google Scholar]
- Lengner CJ, Camargo FD, Hochedlinger K, Welstead GG, Zaidi S, Gokhale S, Scholer HR, Tomilin A, Jaenisch R. Oct4 expression is not required for mouse somatic stem cell self-renewal. Cell stem cell. 2007;1:403–415. doi: 10.1016/j.stem.2007.07.020. [DOI] [PMC free article] [PubMed] [Google Scholar]
- Leung AK, Young AG, Bhutkar A, Zheng GX, Bosson AD, Nielsen CB, Sharp PA. Genome-wide identification of Ago2 binding sites from mouse embryonic stem cells with and without mature microRNAs. Nature structural & molecular biology. 2011;18:237–244. doi: 10.1038/nsmb.1991. [DOI] [PMC free article] [PubMed] [Google Scholar]
- Li H. Exploring single-sample SNP and INDEL calling with whole-genome de novo assembly. Bioinformatics. 2012;28:1838–1844. doi: 10.1093/bioinformatics/bts280. [DOI] [PMC free article] [PubMed] [Google Scholar]
- Li H, Handsaker B, Wysoker A, Fennell T, Ruan J, Homer N, Marth G, Abecasis G, Durbin R Genome Project Data Processing S. The Sequence Alignment/Map format and SAMtools. Bioinformatics. 2009;25:2078–2079. doi: 10.1093/bioinformatics/btp352. [DOI] [PMC free article] [PubMed] [Google Scholar]
- Li H, Lai P, Jia J, Song Y, Xia Q, Huang K, He N, Ping W, Chen J, Yang Z, et al. RNA Helicase DDX5 Inhibits Reprogramming to Pluripotency by miRNA-Based Repression of RYBP and its PRC1-Dependent and -Independent Functions. Cell Stem Cell. 2017a;20:462–477. e466. doi: 10.1016/j.stem.2016.12.002. [DOI] [PubMed] [Google Scholar]
- Li H, Lai P, Jia J, Song Y, Xia Q, Huang K, He N, Ping W, Chen J, Yang Z, et al. RNA Helicase DDX5 Inhibits Reprogramming to Pluripotency by miRNA-Based Repression of RYBP and its PRC1-Dependent and -Independent Functions. Cell stem cell. 2017b;20:571. doi: 10.1016/j.stem.2017.03.014. [DOI] [PubMed] [Google Scholar]
- Li W, You B, Hoque M, Zheng D, Luo W, Ji Z, Park JY, Gunderson SI, Kalsotra A, Manley JL, et al. Systematic profiling of poly(a)+ transcripts modulated by core 3′ end processing and splicing factors reveals regulatory rules of alternative cleavage and polyadenylation. PLoS genetics. 2015;11:e1005166. doi: 10.1371/journal.pgen.1005166. [DOI] [PMC free article] [PubMed] [Google Scholar]
- Martin G, Gruber AR, Keller W, Zavolan M. Genome-wide analysis of pre-mRNA 3′ end processing reveals a decisive role of human cleavage factor I in the regulation of 3′ UTR length. Cell reports. 2012;1:753–763. doi: 10.1016/j.celrep.2012.05.003. [DOI] [PubMed] [Google Scholar]
- Masamha CP, Xia Z, Yang J, Albrecht TR, Li M, Shyu AB, Li W, Wagner EJ. CFIm25 links alternative polyadenylation to glioblastoma tumour suppression. Nature. 2014;510:412–416. doi: 10.1038/nature13261. [DOI] [PMC free article] [PubMed] [Google Scholar]
- Mayr C. Regulation by 3′-Untranslated Regions. Annu Rev Genet. 2017 doi: 10.1146/annurev-genet-120116-024704. [DOI] [PubMed] [Google Scholar]
- Mayr C, Bartel DP. Widespread shortening of 3′UTRs by alternative cleavage and polyadenylation activates oncogenes in cancer cells. Cell. 2009;138:673–684. doi: 10.1016/j.cell.2009.06.016. [DOI] [PMC free article] [PubMed] [Google Scholar]
- McAlister GC, Nusinow DP, Jedrychowski MP, Wuhr M, Huttlin EL, Erickson BK, Rad R, Haas W, Gygi SP. MultiNotch MS3 enables accurate, sensitive, and multiplexed detection of differential expression across cancer cell line proteomes. Anal Chem. 2014;86:7150–7158. doi: 10.1021/ac502040v. [DOI] [PMC free article] [PubMed] [Google Scholar]
- Neve J, Burger K, Li W, Hoque M, Patel R, Tian B, Gullerova M, Furger A. Subcellular RNA profiling links splicing and nuclear DICER1 to alternative cleavage and polyadenylation. Genome research. 2016;26:24–35. doi: 10.1101/gr.193995.115. [DOI] [PMC free article] [PubMed] [Google Scholar]
- Paulo JA, O’Connell JD, Everley RA, O’Brien J, Gygi MA, Gygi SP. Quantitative mass spectrometry-based multiplexing compares the abundance of 5000 S. cerevisiae proteins across 10 carbon sources. J Proteomics. 2016;148:85–93. doi: 10.1016/j.jprot.2016.07.005. [DOI] [PMC free article] [PubMed] [Google Scholar]
- Pirity MK, Locker J, Schreiber-Agus N. Rybp/DEDAF is required for early postimplantation and for central nervous system development. Molecular and cellular biology. 2005;25:7193–7202. doi: 10.1128/MCB.25.16.7193-7202.2005. [DOI] [PMC free article] [PubMed] [Google Scholar]
- Polo JM, Anderssen E, Walsh RM, Schwarz BA, Nefzger CM, Lim SM, Borkent M, Apostolou E, Alaei S, Cloutier J, et al. A molecular roadmap of reprogramming somatic cells into iPS cells. Cell. 2012;151:1617–1632. doi: 10.1016/j.cell.2012.11.039. [DOI] [PMC free article] [PubMed] [Google Scholar]
- Quinlan AR, Hall IM. BEDTools: a flexible suite of utilities for comparing genomic features. Bioinformatics. 2010;26:841–842. doi: 10.1093/bioinformatics/btq033. [DOI] [PMC free article] [PubMed] [Google Scholar]
- Ramirez F, Ryan DP, Gruning B, Bhardwaj V, Kilpert F, Richter AS, Heyne S, Dundar F, Manke T. deepTools2: a next generation web server for deep-sequencing data analysis. Nucleic Acids Res. 2016;44:W160–165. doi: 10.1093/nar/gkw257. [DOI] [PMC free article] [PubMed] [Google Scholar]
- Robinson MD, McCarthy DJ, Smyth GK. edgeR: a Bioconductor package for differential expression analysis of digital gene expression data. Bioinformatics. 2010;26:139–140. doi: 10.1093/bioinformatics/btp616. [DOI] [PMC free article] [PubMed] [Google Scholar]
- Ruegsegger U, Blank D, Keller W. Human pre-mRNA cleavage factor Im is related to spliceosomal SR proteins and can be reconstituted in vitro from recombinant subunits. Molecular cell. 1998;1:243–253. doi: 10.1016/s1097-2765(00)80025-8. [DOI] [PubMed] [Google Scholar]
- Sandberg R, Neilson JR, Sarma A, Sharp PA, Burge CB. Proliferating cells express mRNAs with shortened 3′ untranslated regions and fewer microRNA target sites. Science. 2008;320:1643–1647. doi: 10.1126/science.1155390. [DOI] [PMC free article] [PubMed] [Google Scholar]
- Shakya A, Callister C, Goren A, Yosef N, Garg N, Khoddami V, Nix D, Regev A, Tantin D. Pluripotency transcription factor Oct4 mediates stepwise nucleosome demethylation and depletion. Molecular and cellular biology. 2015;35:1014–1025. doi: 10.1128/MCB.01105-14. [DOI] [PMC free article] [PubMed] [Google Scholar]
- Shen Y, Yue F, McCleary DF, Ye Z, Edsall L, Kuan S, Wagner U, Dixon J, Lee L, Lobanenkov VV, et al. A map of the cis-regulatory sequences in the mouse genome. Nature. 2012;488:116–120. doi: 10.1038/nature11243. [DOI] [PMC free article] [PubMed] [Google Scholar]
- Shepard PJ, Choi EA, Lu J, Flanagan LA, Hertel KJ, Shi Y. Complex and dynamic landscape of RNA polyadenylation revealed by PAS-Seq. RNA. 2011;17:761–772. doi: 10.1261/rna.2581711. [DOI] [PMC free article] [PubMed] [Google Scholar]
- Shi Y. Alternative polyadenylation: new insights from global analyses. RNA. 2012;18:2105–2117. doi: 10.1261/rna.035899.112. [DOI] [PMC free article] [PubMed] [Google Scholar]
- Spies N, Burge CB, Bartel DP. 3′ UTR-isoform choice has limited influence on the stability and translational efficiency of most mRNAs in mouse fibroblasts. Genome research. 2013;23:2078–2090. doi: 10.1101/gr.156919.113. [DOI] [PMC free article] [PubMed] [Google Scholar]
- Stadtfeld M, Maherali N, Borkent M, Hochedlinger K. A reprogrammable mouse strain from gene-targeted embryonic stem cells. Nature methods. 2010;7:53–55. doi: 10.1038/nmeth.1409. [DOI] [PMC free article] [PubMed] [Google Scholar]
- Stadtfeld M, Maherali N, Breault DT, Hochedlinger K. Defining molecular cornerstones during fibroblast to iPS cell reprogramming in mouse. Cell stem cell. 2008;2:230–240. doi: 10.1016/j.stem.2008.02.001. [DOI] [PMC free article] [PubMed] [Google Scholar]
- Sykes DB, Kfoury YS, Mercier FE, Wawer MJ, Law JM, Haynes MK, Lewis TA, Schajnovitz A, Jain E, Lee D, et al. Inhibition of Dihydroorotate Dehydrogenase Overcomes Differentiation Blockade in Acute Myeloid Leukemia. Cell. 2016;167:171–186. e115. doi: 10.1016/j.cell.2016.08.057. [DOI] [PMC free article] [PubMed] [Google Scholar]
- Takahashi K, Yamanaka S. Induction of pluripotent stem cells from mouse embryonic and adult fibroblast cultures by defined factors. Cell. 2006;126:663–676. doi: 10.1016/j.cell.2006.07.024. [DOI] [PubMed] [Google Scholar]
- Tian B, Manley JL. Alternative polyadenylation of mRNA precursors. Nature reviews Molecular cell biology. 2017;18:18–30. doi: 10.1038/nrm.2016.116. [DOI] [PMC free article] [PubMed] [Google Scholar]
- Tucker KL, Meyer M, Barde YA. Neurotrophins are required for nerve growth during development. Nat Neurosci. 2001;4:29–37. doi: 10.1038/82868. [DOI] [PubMed] [Google Scholar]
- Vierbuchen T, Ostermeier A, Pang ZP, Kokubu Y, Sudhof TC, Wernig M. Direct conversion of fibroblasts to functional neurons by defined factors. Nature. 2010;463:1035–1041. doi: 10.1038/nature08797. [DOI] [PMC free article] [PubMed] [Google Scholar]
- Wang GG, Calvo KR, Pasillas MP, Sykes DB, Hacker H, Kamps MP. Quantitative production of macrophages or neutrophils ex vivo using conditional Hoxb8. Nature methods. 2006;3:287–293. doi: 10.1038/nmeth865. [DOI] [PubMed] [Google Scholar]
- Ye J, Blelloch R. Regulation of pluripotency by RNA binding proteins. Cell stem cell. 2014;15:271–280. doi: 10.1016/j.stem.2014.08.010. [DOI] [PMC free article] [PubMed] [Google Scholar]
- Zhou L, Wang L, Lu L, Jiang P, Sun H, Wang H. A novel target of microRNA-29, Ring1 and YY1-binding protein (Rybp), negatively regulates skeletal myogenesis. The Journal of biological chemistry. 2012;287:25255–25265. doi: 10.1074/jbc.M112.357053. [DOI] [PMC free article] [PubMed] [Google Scholar]
- Zhu N, Chen M, Eng R, DeJong J, Sinha AU, Rahnamay NF, Koche R, Al-Shahrour F, Minehart JC, Chen CW, et al. MLL-AF9- and HOXA9-mediated acute myeloid leukemia stem cell self-renewal requires JMJD1C. The Journal of clinical investigation. 2016;126:997–1011. doi: 10.1172/JCI82978. [DOI] [PMC free article] [PubMed] [Google Scholar]
Associated Data
This section collects any data citations, data availability statements, or supplementary materials included in this article.
Supplementary Materials
A) A schematic representation of the secondary system used for reprogramming.
B) Reprogramming efficiency validation for individual candidate genes. Error bars represent standard deviation of the mean for three independent experiments.
C) Reprogramming efficiency for MEFs treated with independent shRNAs targeting Nudt21. Cells were induced with dox for 12 days, followed by 4 days of dox withdrawal.
D) Alkaline phosphatase staining of transgene-independent iPS colonies following reprogramming with OKS. Cells were induced with dox for 14 days, followed by 4 days of dox withdrawal.
E) Quantification of alkaline phosphatase staining of transgene-independent iPS colonies following reprogramming with OKS. Error bars represent standard deviation of the mean for three independent experiments. Statistical significance was determined using a two-tailed unpaired Student’s t-test (**** p<0.0001).
F) Teratomas derived from iPS cells generated with Nudt21 knockdown.
G) Quantification of the dox withdrawal assay with Nudt21 knockdown.
H) A cell trace time course for proliferation with Nudt21 knockdown at the indicated time points.
I) Cell proliferation analysis with Nudt21 knockdown.
J) AnnexinV staining for cells treated with Nudt21 or control siRNAs.
K) Bright field images showing uninduced MEF with Nudt21 siRNA or control siRNA. Scale bar = 10 μm
L) qRT-PCR quantification for MEF and pluripotency related genes in uninduced MEFs with Nudt21 siRNA or control siRNA.
A) Flow cytometry analysis showing size and granularity differences for pre-B cell to macrophage transdifferentiation.
B) qRT-PCR quantification of Nudt21 knockdown in pre-B cells.
C) Flow cytometry analysis showing lineage marker transitions for pre-B cell to macrophage transdifferentiation.
D) A Western blot at day 3 of transdifferentiation showing Nudt21 knockdown in MEFs undergoing transifferentiation to iNs.
E) Flow cytometry analysis of TAU-GFP for iN transdifferentiation.
F) A Western blot showing Nudt21 knockdown at day 3 during iTSC transdifferentiation.
G) Immunofluorescence for iTSC markers. Scale bar=100 μm.
A) Gene tracks showing PAS-seq for Nudt21 targets.
B) CLIP-seq signal around polyA sites for Nudt21 (left panels) and CFIm68 (right panels).
C) Gene ontology analysis for Nudt21 interacting proteins.
D) Volcano plot representation of Nudt21 immunoprecipitation mass-spectrometry data. Grey dots: non-significantly enriched proteins (FDR > 0.05). Black dots: significantly enriched proteins (FDR < 0.05). Nudt21, CFIm68 and CFIm58 are highlighted in color.
E) qRT-PCR analysis for CFIm68 and Pcf11 knockdown at day 3 of reprogramming.
F) Correlation plot for APA versus mRNA at day3 and day6 of reprogramming.
A) Gene Ontology analysis for Nudt21 target proteins that decrease expression 1.2-fold or greater by day 3 of reprogramming.
B) Western blot analysis for RTF1, PHC1, and NUDT21.
C) “TargetScan microRNA” enrichment analysis for miRNA binding within Nudt21 targets that change protein level.
D) miR-29a and miR-34c expression during reprogramming(Polo et al., 2012).
E) Gene tracks showing PAS-seq for chromatin factors targeted by Nudt21.
F) qRT-PCR for miR-34c and miR-29a in MEFs transfected with miR-34c, miR-29a inhibitor, or miR inhibitor control at day 3 of reprogramming.
A) A Western blot showing WDR5 levels with Nudt21 knockdown at day 3 of reprogramming.
B) A Western blot showing WDR5 knockdown with and without Nudt21 knockdown at day 3 of reprogramming.
C) Alkaline phosphatase staining for transgene independent iPS colonies with simultaneous knockdown of Wdr5 and Nudt21. Cells were induced with dox for 12 days, followed by 4 days of dox withdrawal.
D) Quantification of alkaline phosphatase staining for transgene independent iPS colonies with simultaneous knockdown of Wdr5 and Nudt21. Error bars represent standard deviation of the mean for three independent experiments. Statistical significance was determined using a two-tailed unpaired Student’s t-test (**** p<0.0001).
E) qRT-PCR analysis with the indicated knockdown conditions.
F) Reprogramming efficiency based on OCT4-GFP for double knockdown of Nudt21 and RYBP at day 6 of reprogramming. Error bars represent standard deviation of the mean for three independent experiments. Statistical significance was determined using a two-tailed unpaired Student’s t-test (** p<0.01).
G) mRNA levels for three targets of RYBP with Nudt21 knockdown at day 3 of reprogramming.
H) AnnexinV staining for cells co-transfected with the indicated siRNAs.
I) A cell trace time course for proliferation with co-knockdown of Nudt21 with Rybp or Wdr5 at the indicated time points.
A) qRT-PCR analysis at day 3 of reprogramming showing the efficiency of knockdown for chromatin factors with simultaneous knockdown of Nudt21.
B) qRT-PCR analysis at day 3 of reprogramming showing the efficiency of knockdown for Nudt21 with simultaneous knockdown of chromatin factors.
C) Quantification of OCT4-GFP+ cells at nine days of reprogramming, following double knockdown of Nudt21 and the indicated chromatin factors. Error bars represent standard deviation of the mean for three independent experiments. Statistical significance was determined using two-tailed unpaired Student’s t-test (*** p<0.001; **** p<0.0001).
D) Representative images of alkaline phosphatase staining following double knockdown of Nudt21 and the indicated chromatin factors. Cells were induced with dox for 12 days, followed by 4 days of dox withdrawal.
E) Gene expression analysis by qRT-PCR of pluripotency factors at day 9 of reprogramming, following double knockdown of Nudt21 and the indicated chromatin factors.
F) A cell trace time course for proliferation with co-knockdown of Nudt21 with chromatin factors at the indicated time points.
G) AnnexinV staining for cells co-transfected with the indicated siRNAs.
H) Genome browser screenshots showing ATAC-seq data for the Thy-1 and Zfp42 loci.
I) Gene ontology analysis of APA changes identified in a previous study(Masamha et al., 2014).
Supplemental Table 1. MDS parameters. Related to Figure 3.
Supplemental Table 2. Differentially expressed proteins between MEFs treated with Nudt21 siRNA or control siRNA at day 3 of reprogramming. Related to Figure 4.
Supplemental Table 3. Table of Primers used for qRT-PCR. Related to STAR Methods.