Abstract
Lipopolysaccharide (LPS) in the outer membrane of Gram-negative bacteria is critical for their cell envelope assembly. LPS synthesized in the cytoplasmic leaflet of the inner membrane is flipped to the periplasmic leaflet by MsbA, an ATP-binding cassette transporter. Despite substantial efforts, the structural mechanisms underlying MsbA-driven LPS flipping remain elusive. Here, we use single-particle cryo-EM to elucidate the structures of lipid nanodisc-embedded MsbA in three functional states. The 4.2 Å-resolution structure of the transmembrane domains of nucleotide-free MsbA reveals that LPS binds deeply inside MsbA at the height of the periplasmic leaflet, establishing extensive hydrophilic and hydrophobic interactions with MsbA. Two subnanometer-resolution structures of MsbA with ADP-vanadate and ADP reveal an unprecedented closed and an inward-facing conformation, respectively. Our study uncovers the long-sought-after structural basis for LPS recognition, delineates the conformational transitions of MsbA to flip LPS, and paves the way for structural characterization of other lipid flippases.
In cells, lipid compositions differ between different membranes, and between the two leaflets of the same membrane1–3. Changes in lipid composition affect fundamental processes, including membrane biogenesis, membrane trafficking, signaling and apoptosis4. The transbilayer movement of most lipids is energetically unfavorable and often requires facilitation by specific flippases5–7. The mechanisms used by flippases have remained elusive.
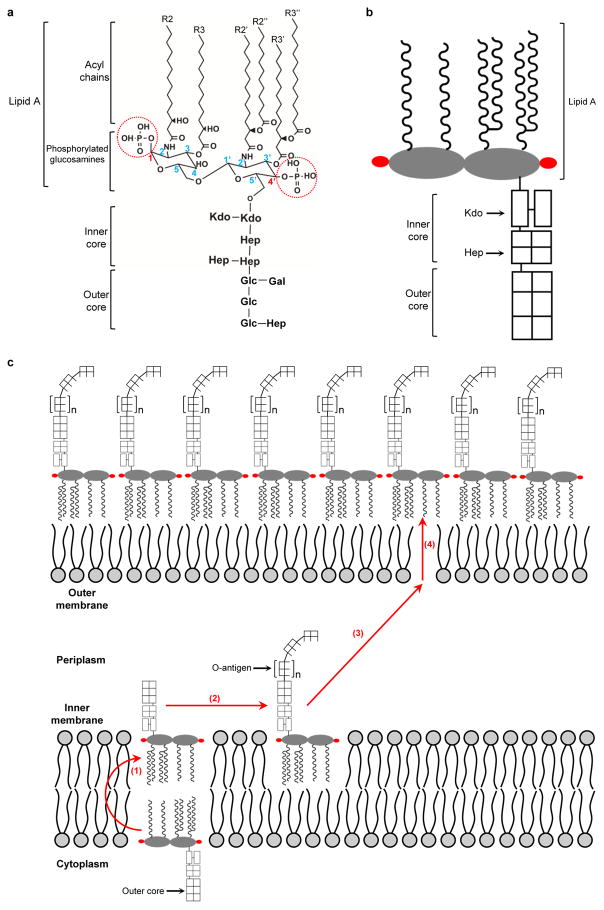
The bacterial ATP-binding cassette (ABC) transporter MsbA flips lipopolysaccharide (LPS)8, a glycolipid composed of a lipid A moiety, core oligosaccharide and a long-chain O-antigenic polysaccharide9 (Extended Data Fig. 1a, b). Lipid A is the conserved portion of LPS and responsible for inducing a potent innate immune response during bacterial infection10. In Gram-negative bacteria, LPS is the major component of the outer leaflet of the outer membrane, and plays a key role in constructing a proper envelope necessary for bacteria to survive in harsh environments9,11. The LPS biosynthesis and transport pathway is an attractive target for developing novel antibiotics12,13. In Escherichia coli, rough LPS (lipid A-inner core-outer core) is synthesized in the inner leaflet of the inner membrane, flipped by MsbA, further modified and then transported to the outer membrane (Extended Data Fig. 1c).
MsbA functions as a homodimer, with each subunit containing one transmembrane domain (TMD) and one nucleotide-binding domain (NBD). The two TMDs form the LPS translocation pathway, and the two NBDs bind and hydrolyze ATP. Previous studies suggested an alternating-access model, with MsbA alternating between an inward (cytoplasm)-facing conformation and an outward (periplasm)-facing conformation14–16. However, the mechanisms underlying MsbA-mediated LPS transport remain under debate. Many ABC family members translocate lipids or lipid-related compounds, including twenty of the 48 human ABC transporters17. Despite the growing number of ABC transporter structures determined by crystallography18,19 and cryo-electron microscopy (cryo-EM)20–25, none of these structures revealed a lipid substrate.
We reconstituted MsbA into lipid nanodiscs26 and determined the cryo-EM structure of nucleotide-free MsbA to 4.2 Å resolution for the TMDs. The structure demonstrates that LPS binds deeply inside MsbA through extensive hydrophilic and hydrophobic interactions, and reaches the level of the target leaflet without flipping. With two additional structures of nucleotide-bound MsbA, our findings reveal the structural rearrangements that facilitate LPS translocation.
General architecture of MsbA in lipid bilayers
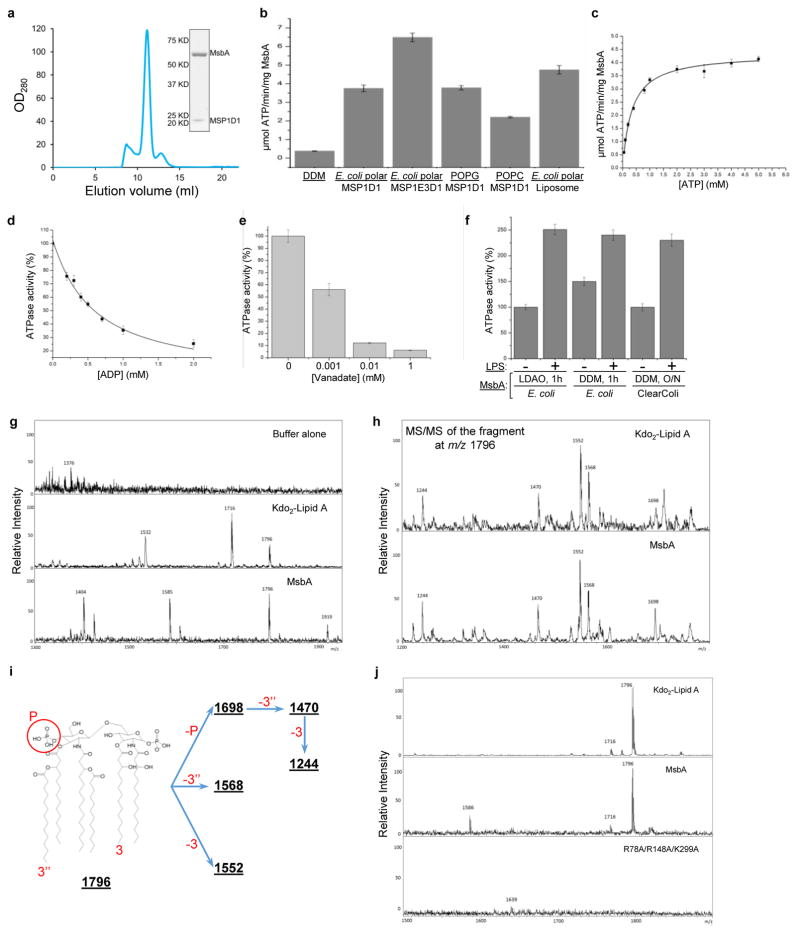
We purified E. coli MsbA in dodecyl maltoside (DDM) and reconstituted it into lipid nanodiscs (Extended Data Fig. 2a). MsbA in nanodiscs with E. coli polar lipids, POPG or POPC displayed substantially higher ATPase activity than MsbA in DDM (Extended Data Fig. 2b, c), consistent with previous studies27–29. Nanodisc-embedded MsbA is thus capable of undergoing the large conformational changes required for ATP hydrolysis.
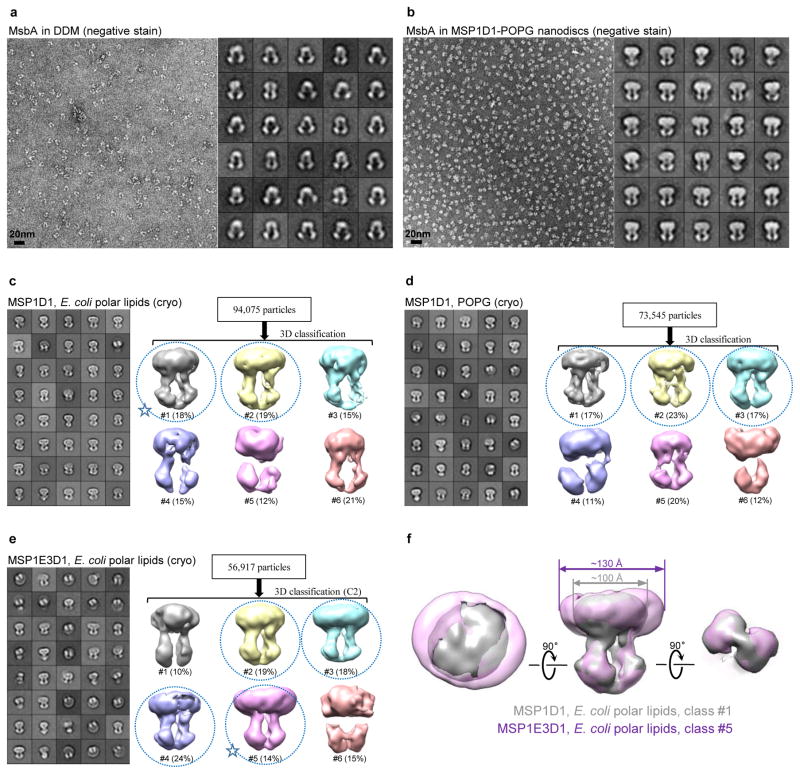
Negative-stain EM analysis of MsbA in DDM revealed a wide range of distances between the two NBDs (Extended Data Fig. 3a), reminiscent of the two different inward-facing conformations seen in the crystal structures of MsbA in detergent14. In contrast, negative-stain EM and cryo-EM images of MsbA in E. coli polar lipids or POPG nanodiscs showed one predominant conformation, with the two TMDs extending parallel from the membrane and the two NBDs in close proximity to each other (Extended Data Fig. 3b–e). This conformation did not change when the nanodisc diameter was increased from ~100 Å to ~130 Å by using a longer membrane scaffold protein (MSP) (Extended Data Fig. 3f), suggesting that the nanodisc did not constrain the MsbA conformation. The inward-facing conformation, as observed in our EM analysis, likely represents the nucleotide-free state of MsbA in a native lipid membrane.
Cryo-EM structure of MsbA in nanodiscs
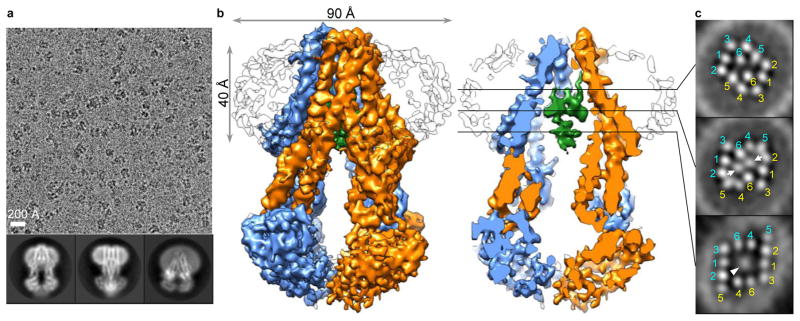
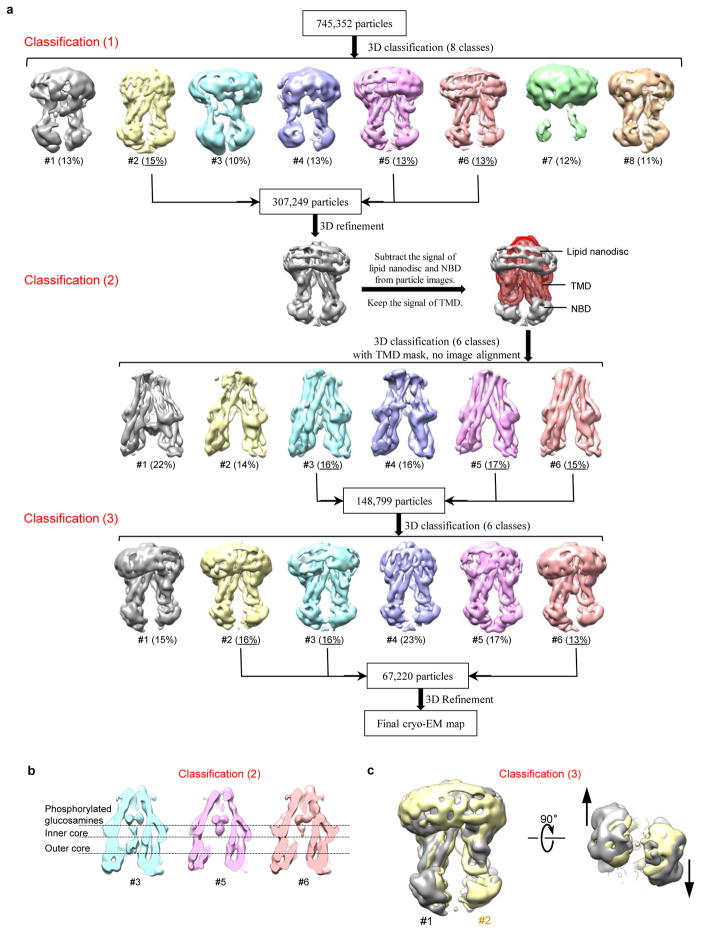
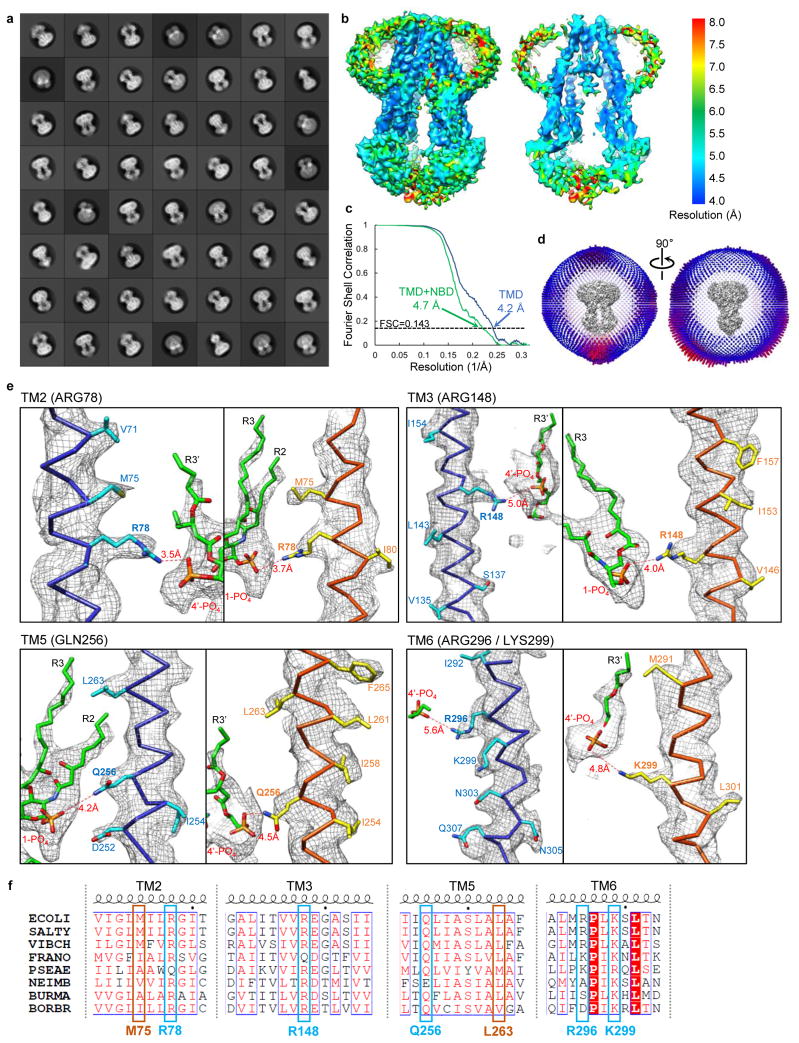
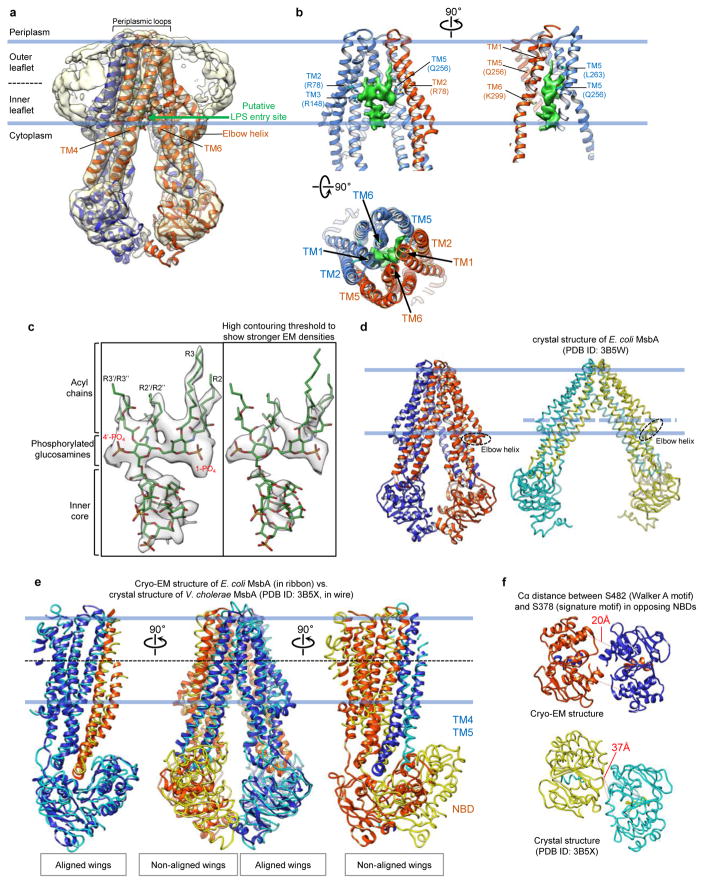
Based on cryo-EM screening for MsbA in nanodiscs with different MSPs and lipids (Extended Data Fig. 3c–e), we chose E. coli polar lipids and MSP1D1 for further studies (Fig. 1a). To overcome the flexibility of MsbA and the strong nanodisc signal, we performed three rounds of three-dimensional (3D) classification to select a homogenous set of cryo-EM particle images for the final 3D refinement (Extended Data Fig. 4a). The resolution of the final map is 4.7 Å for the entire MsbA molecule, and 4.2 Å for the TMDs (Fig. 1b and Extended Data Fig. 5b, c). The lower resolution of the NBDs is likely due to their greater mobility. All transmembrane (TM) helices and connecting loops in the TMDs and most secondary structural elements in the NBDs are well resolved, and side-chain densities are visible for many residues in the TMDs (Extended Data Fig. 5e). Using this map, we built an atomic model of MsbA, and kept the side chains of ~100 residues in each TMD that showed well-defined EM densities (Extended Data Table 1). The structure shows that the TMDs are formed by TMs 1, 2, 3 and 6 from one subunit and TMs 4 and 5 from the other subunit (Fig. 2a). The nanodisc density indicates that the membrane-embedded region ranges from the small periplasmic loops to the elbow helices on the cytoplasmic side (Extended Data Fig. 6a).
Figure 1. Cryo-EM of nanodisc-embedded MsbA.
a, Representative cryo-EM image and selected 2D averages of nanodisc-embedded MsbA. Box dimension of averages: 157 Å. b, Surface and cross-sectional views of the MsbA 3D reconstruction, filtered to 4.2 Å resolution. MsbA subunits are colored in blue and orange, LPS in green. Nanodisc is shown as outline. c, Slices through the 3D reconstruction at locations indicated in b. TM helices of both MsbA subunits are labeled. Arrows and arrowhead indicate densities of the two phosphorylated glucosamines and the inner core of LPS, respectively.
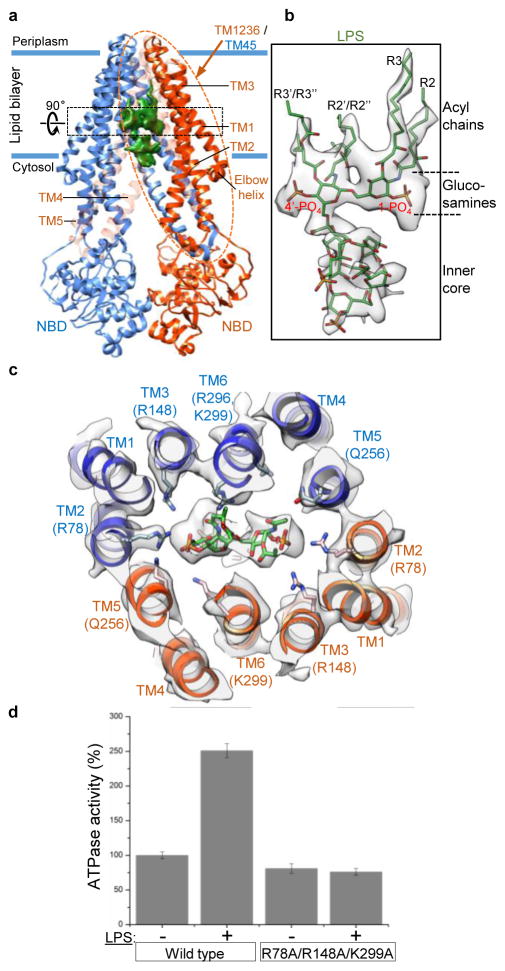
Figure 2. LPS binding to MsbA.
a, Ribbon diagram of nanodisc-embedded MsbA, with subunits colored in blue and orange. Blue lines indicate membrane. Helices TM4, TM5 and TM6 of the orange subunit are made transparent to show LPS density (green). Black dotted rectangle indicates section rotated by 90° and shown in c. Orange dotted oval indicates one TMD, formed by TM1, TM2, TM3 and TM6 from one MsbA subunit, and TM4 and TM5 from the other subunit. The inner surface of this TMD is shown in Fig. 3. b, LPS model fit into the cryo-EM map (gray). c, Cross-section at the level of the LPS glucosamines. Cryo-EM map in gray. Only hydrophilic side chains represented by well-defined density are shown. d, ATPase activity of liposome-reconstituted wild-type MsbA and the R78A/R148A/K299A mutant in the absence (−) and presence (+) of 100 μM Kdo2-lipid A. Each point represents mean±s.d. of three separate measurements.
An LPS molecule inside the TMDs of MsbA
A robust palm-shaped density between the two TMDs was clearly resolved, and its size and shape are consistent with an LPS (Fig. 1b). The strongest parts of this LPS density correspond to the two glucosamines, each of which carries one phosphate group (1-PO4 and 4′-PO4), and the inner core, which contains multiple phosphorylations30 (Extended Data Fig. 6c). The negative charge in these areas likely causes stronger electron scattering, generating densities readily seen in slices parallel to the membrane plane through the 3D reconstruction (Fig. 1c). The density representing the 1-PO4 and 4′-PO4 groups and the LPS orientation parallel to the membrane plane could be unambiguously assigned based on the clear density connecting the inner core to the 5′ position of the glucosamine backbone (Fig. 2b). The outer core is not seen in the final map, but visible in the reconstruction of one 3D class (Extended Data Fig. 4b, left panel), demonstrating how MsbA can accommodate an entire rough LPS without drastically opening its TMDs.
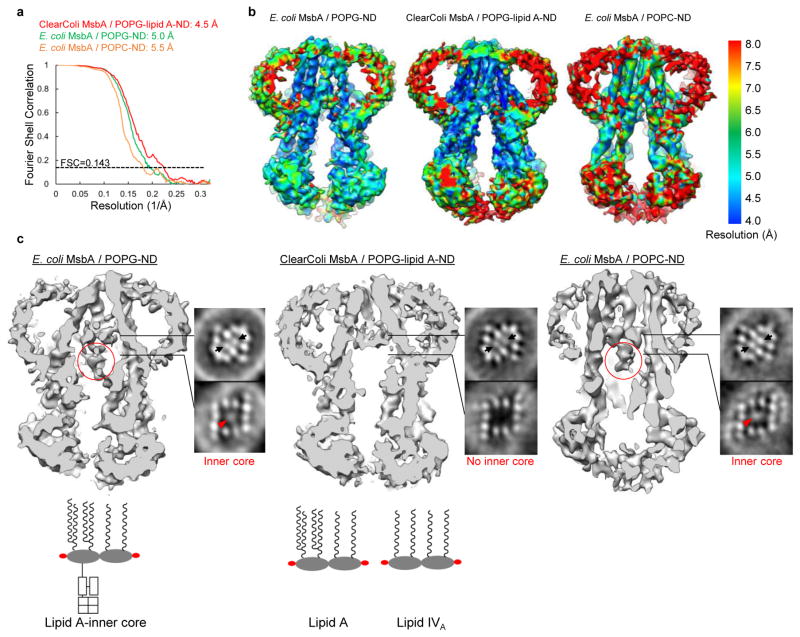
The LPS molecule in our structure likely co-purified with MsbA, because LPS was detected in purified MsbA in DDM by mass spectrometry (Extended Data Fig. 2g–i), and similar LPS densities were observed in cryo-EM maps of MsbA in pure POPG or POPC nanodiscs (Extended Data Fig. 7). This is consistent with a previous finding that LPS co-purifies with MsbA when E. coli membranes are solubilized in DDM for only 1 hour31, similar to what we did. To confirm the identity of the assigned LPS density, we purified MsbA from a genetically modified E. coli strain, ClearColi™, which only produces lipid IVA, a precursor of LPS with four acyl chains and no glycosylation. MsbA purified from ClearColi™ was reconstituted into nanodiscs using POPG supplemented with lipid A, and while the resulting cryo-EM map showed strong densities for the glucosamines, density for the inner core was completely absent (Extended Data Fig. 7c, middle panel). This proves that the strong densities inside the TMDs is generated by LPS.
Structural basis of MsbA-mediated LPS translocation
Our cryo-EM structures revealed that the bound LPS has its acyl chains reaching the level of periplasmic leaflet (Fig. 1b), and has almost completed its transbilayer movement, albeit without flipping.
Side chain densities are visible for several residues surrounding the glucosamines, including Arg78 (TM2), Arg148 (TM3), Gln256 (TM5), and Arg296 and Lys299 (TM6) (Fig. 2c, Extended Data Fig. 5e). These residues form a ring of hydrophilic interactions with 1-PO4 and 4′-PO4, the glucosamines, and the ester and amide groups connecting the acyl chains. Since Arg78, Arg148 and Lys299 are highly conserved (Extended Data Fig. 5f), we tested their potential importance for LPS binding. Mass spectrometry analysis of purified wild-type MsbA identified co-purifying LPS, which was not detected for purified R78A/R148A/K299A mutant (Extended Data Fig. 2j), indicating that mutation of these residues compromises LPS binding. We also compared LPS-dependent stimulation of ATPase activity of MsbA in proteoliposomes27. While wild-type MsbA showed a ~2.5-fold stimulation by Kdo2-lipid A (Extended Data Fig. 2f), mutation of the three residues to alanine abolished stimulation (Fig. 2d). The LPS-interacting residues surrounding the glucosamines fall into two groups, each forming a cluster of positive charges that interacts with 1-PO4 or 4′-PO4. Each group of residues is localized within one TMD, except for Arg296 and Lys299 on the same TM6 but interacting with different phosphate groups (Extended Data Fig. 8h, left panel). Thus, bound LPS bridges the two TMDs, likely restricting the TMD opening and stabilizing a more closed inward-facing conformation.
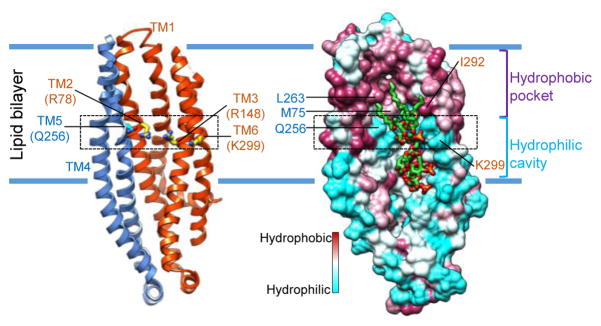
The ring of hydrophilic interactions surrounding the glucosamines divides the inner space of MsbA into a hydrophobic pocket and a hydrophilic cavity (Fig. 3). The hydrophobic pocket accommodates the acyl chains of LPS. Although the distal parts of the acyl chains were not well resolved, the R2 and R3 acyl chains show more complete densities. On the periplasmic side, the ends of TM1 and TM6 come together to seal the hydrophobic pocket, separating the hydrophobic acyl chains of LPS from the hydrophilic periplasm (Extended Data Fig. 6b, bottom panel). Opposite of the hydrophobic pocket, the hydrophilic cavity, where the inner core is located, is exposed to the cytoplasm. The less well-defined EM density for the inner core suggests few, if any, stabilizing interactions between the core oligosaccharide and MsbA (Extended Data Fig. 6c). The positively charged clusters that interact with the phosphorylated glucosamines and the large hydrophobic pocket that accommodates the acyl chains are reminiscent of similar features seen in the structure of the TLR4-MD-2-LPS complex32. It is conceivable that these features contribute to the affinity and specificity for LPS binding.
Figure 3. Inner surface of the MsbA TMD.
Ribbon diagram (left) and hydrophobicity surface (right) of one TMD, as seen from the other subunit, with important residues indicated. A ring of interactions (black dotted box) between hydrophilic protein residues with the glucosamines divides the lumen in between the two TMDs into a hydrophobic pocket on the periplasmic side and a hydrophilic cavity on the cytoplasmic side of the membrane.
Structural plasticity of MsbA in the inward-facing conformation
Our cryo-EM structure of MsbA in nanodiscs differs from the crystal structure of E. coli MsbA in detergent14 (Extended Data Fig. 6d). It appears more similar to the crystal structure of Vibrio cholerae MsbA14, in which the NBDs are positioned closer together (Extended Data Fig. 6e), but important differences exist. In ABC transporters, the Walker A motif and the signature motif (or LSGGQ motif) from opposing NBDs have to come together to sandwich and hydrolyze ATP33. The two NBDs in our structure are arranged in an almost perfectly antiparallel head-to-tail fashion, positioning the Walker A and signature motifs to face each other at a distance of 20 Å (Extended Data Fig. 6f). This distance is almost twice as long in the crystal structure of Vibrio cholerae MsbA, due to a movement of the two NBDs and their interacting TM4 and TM5 helices in opposite directions. Thus, the MsbA conformation in our structure appears more primed for ATP binding. Indeed, the ATPase activity of MsbA in nanodiscs is substantially higher than that of MsbA in DDM (Extended Data Fig. 2b).
MsbA has been studied by various spectroscopic techniques15,34–39, providing inconsistent results for the degree of TMD opening in the inward-facing conformation. 3D classification of the cryo-EM particle images identified one class representing a more open conformation (Extended Data Fig. 4c), caused by the same movement observed in the crystal structure (Extended Data Fig. 6e), albeit to a lesser extent. The resulting opening between TM4 and TM6 likely allows LPS to enter the inner cavity of MsbA (Extended Data Fig. 6a).
Structures of MsbA in different states of the ATP hydrolysis cycle
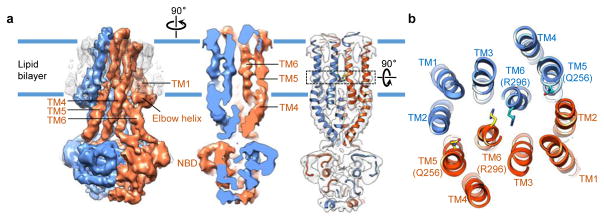
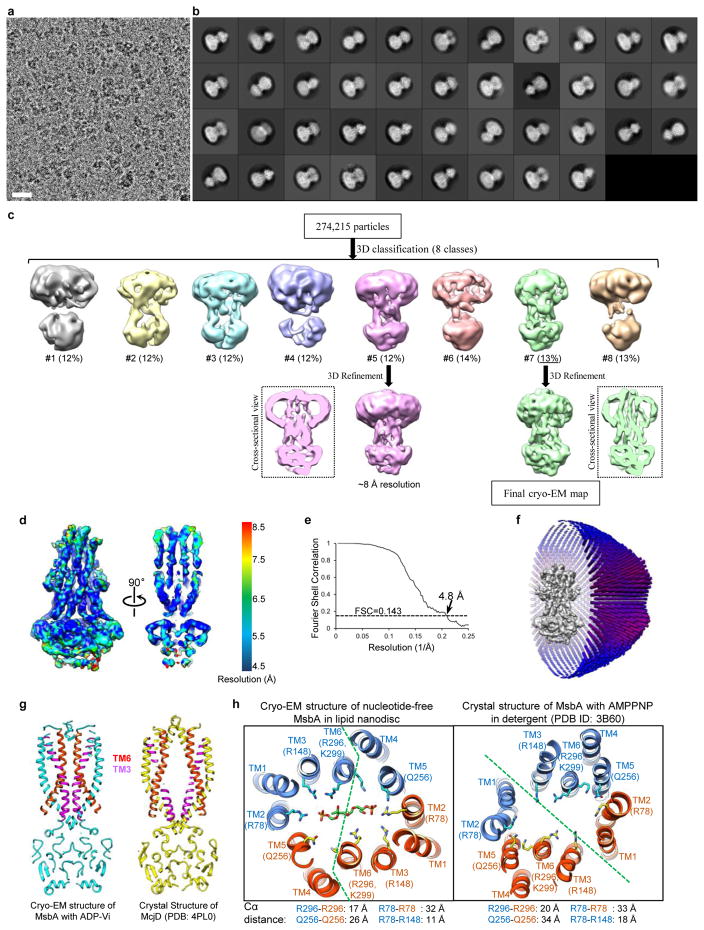
The transition state after ATP hydrolysis but before γ-phosphate release can be mimicked by using orthovanadate to trap the Mg2+-ADP-vanadate complex in the catalytic sites. The crystal structures of MsbA and other ABC transporters with ADP-vanadate show an outward-facing conformation with tightly dimerized NBDs14,40,41. We analyzed nanodisc-embedded MsbA in the presence of 1 mM vanadate, a concentration sufficient to block the ATPase activity of MsbA by more than 90% (Extended Data Fig. 2e). Classification of the cryo-EM particle images demonstrated that most NBDs are closely associated (Extended Data Fig. 8a–c). The two best 3D classes were independently refined to 8 Å and 4.8 Å resolution (Extended Data Fig. 8c–e). Despite different nanodisc sizes, both cryo-EM maps show tightly packed TM helices at the center of the nanodiscs. The cryo-EM structure at 4.8 Å resolution resolved all TM helices, which are oriented perpendicular to the membrane plane (Fig. 4). The LPS-binding site seen in our nucleotide-free MsbA structure is completely blocked by the two TM6 helices that move toward the center. Thus, this cryo-EM structure with vanadate represents an unprecedented closed conformation of MsbA, and presumably a functional state occurring after LPS has flipped and dissociated from MsbA.
Figure 4. Cryo-EM structure of nanodisc-embedded MsbA with ADP-vanadate.
a, Cryo-EM map of vanadate-trapped MsbA in nanodiscs, filtered to 4.8 Å resolution. Subunits colored in blue and orange. Map shown as solid surface (left), as cross-section rotated by 90° (middle), and as cross-section with main-chain model built into the map (right). Black dotted box indicates region in which hydrophilic MsbA residues form interactions with LPS glucosamines in the nucleotide-free state. This section is rotated by 90° and shown in b. b, Cross-section of atomic model with TM helices numbered.
Our structure resembles the occluded conformations seen in crystal structures of other ABC transporters such as McjD41 and PCAT142. The most notable difference lies in the conformation of TM3 and TM6, which bend towards the center of the TMDs in our MsbA structure and eliminate the central cavity seen in the McjD structure (Extended Data Fig. 8g). In contrast, the crystal structures of MsbA with ADP-vanadate or 5′-adenylyl-β-γ-imidodiphosphate (AMPPNP) exhibit an outward-facing open conformation14, with the TM helices tilting away from the center of the dimer. Distinct from MsbA in the inward-facing conformation, each TMD in the outward-facing conformation consists of TMs 3, 4, 5 and 6 from one MsbA subunit and TMs 1 and 2 from the other subunit (Extended Data Fig. 8h, right panel). This reorganization of the TM helices, if it occurs in lipid bilayers, likely promotes the flipping of bound LPS, by generating a crevice between TM1 and TM3, breaking the positively charged clusters surrounding the glucosamines of LPS, and opening up the hydrophobic pocket to expose the acyl chains of LPS to the hydrophilic periplasm. However, the potential outward-facing conformation and the degree of TMD opening during LPS release remain to be defined. A dynamics simulation study on McjD suggested that a relatively small opening suffices for the release of a 21-residue peptide43.
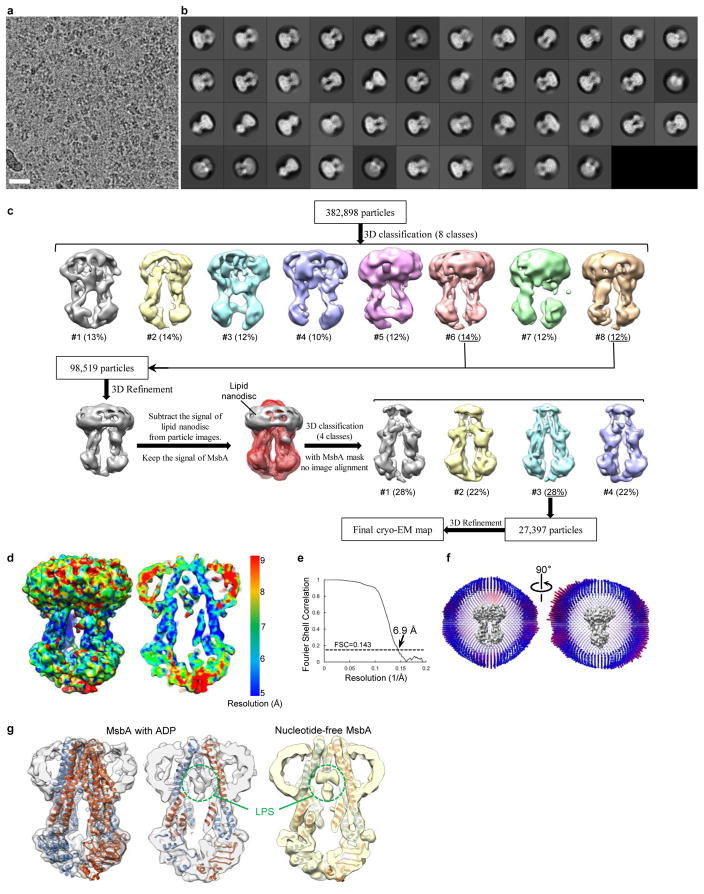
Since the structure of MsbA in the ADP state has not yet been determined, we exposed nanodisc-embedded MsbA to 5 mM ADP, which is ~10 times the KI of 0.54 ± 0.05 mM (Extended Data Fig. 2d). Cryo-EM analysis showed that MsbA with ADP adopts predominantly an inward-facing conformation (Extended Data Fig. 9a–c), consistent with previous cross-linking44, EPR45, fluorescence spectroscopy46 and negative-stain EM47 studies, all demonstrating that ADP cannot induce closure of the NBDs. The final map at 6.9 Å resolution resolved all TM helices, and can be superimposed with our atomic model of nucleotide-free MsbA (Extended Data Fig. 9d–g). A robust density representing LPS was resolved in the inner cavity of MsbA (Extended Data Fig. 9g), indicating that, after ATP hydrolysis and γ-phosphate release, MsbA resets to its inward-facing conformation, captures a new LPS, and is ready for the next transport cycle.
Mechanism of MsbA-mediated LPS flipping
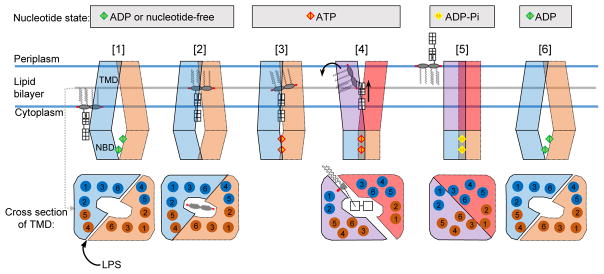
We propose a “trap-and-flip” model for MsbA-mediated LPS transport in six steps (Fig. 5 and Supplementary Video 1). Our cryo-EM structures of nucleotide-free and ADP-bound MsbA represent step 2, and that of vanadate-trapped MsbA represents step 5. Step 4 may resemble the crystal structures of MsbA with AMPPNP or ADP-vanadate14. These steps are grouped into three nucleotide states.
Figure 5. Model for MsbA-mediated LPS flipping.
Nucleotide states indicated at top. MsbA subunits in inward-facing conformation shown in blue and orange. ATP binding induces rearrangement in TMDs, colored in purple and red. ADP, ATP and ADP with γ-phosphate shown as diamonds in green, red and yellow, respectively. LPS depicted as in Extended Data Figure 1b, and black arrows indicate proposed movements of its hydrophilic and hydrophobic moieties. Bottom panels show cross-sections through TMD in region surrounding the LPS glucosamines in the nucleotide-free state. Individual TM helices shown as numbered circles, colored in blue and orange according to corresponding MsbA subunit. See text for description of proposed LPS-transport cycle.
ADP or nucleotide-free state. MsbA in inward-facing conformation opens TMDs to allow LPS entry (step 1). Stably bound LPS restricts TMDs opening and aligns NBDs for ATP binding (step 2).
ATP state. Conformational changes in MsbA abolish LPS binding (step 3) and facilitate the acyl chains to enter the periplasmic leaflet (step 4). MsbA rearrangement and LPS translocation occur as a concerted process, leading to ATP hydrolysis.
ATP transition state. All TM helices form a compact bundle after LPS release (step 5). Upon γ-phosphate release, MsbA returns to the inward-facing conformation (step 6).
This model is distinct from the mechanism proposed for PglK, in which only the outward-facing conformations are relevant for substrate transport48. Our model also differs from the “credit card model” proposed for P4-ATPase flippases6 and the TMEM16 scramblase49, in which the hydrophobic acyl chains stay in the membrane during flipping. Further studies of different types of flippases in complex with their lipid substrates are essential to establish whether a universal flipping mechanism exists.
METHODS
MsbA expression and purification
N-terminally His-tagged MsbA in pET-19b vector was transformed into E. coli strain BL21 Star™ (DE3) pLysS. Cells were grown at 37°C in lysogeny broth (LB) medium with 100 μg/ml ampicillin and 30 μg/ml chloramphenicol. After induction of protein expression with 0.5 mM isopropyl β-D-1-thiogalactopyranoside (IPTG), cells were grown for another 3 hours, harvested by centrifugation, and stored at −80°C. Frozen cell pellets were resuspended in buffer containing 50 mM Tris, pH 7.8, 300 mM NaCl and 10% (v/v) glycerol and broken using a high-pressure microfluidizer (Emulsiflex-C5, Avestin). Cell membranes were isolated by centrifugation at 100,000×g for 1 hour at 4°C and solubilized with 1% (w/v) n-dodecyl-β-D-maltopyranoside (DDM, Anatrace) for 1–2 hours at 4°C. MsbA was purified by TALON metal affinity resin (Clontech) followed by size-exclusion chromatography on a Superdex 200 column in buffer containing 25 mM Tris, pH7.8, 150 mM NaCl, 1 mM Tris(2-carboxyethyl)phosphine (TCEP), 5% glycerol and 1 mM DDM. The purity of MsbA was judged by SDS-PAGE, and purified MsbA was concentrated to 10–15 mg/ml and stored at −80°C. The expression of MsbA in ClearColi™ BL21(DE3) cells (Lucigen) and subsequent purification of the protein were essentially the same as described above, except that cell membranes were solubilized with 1% DDM overnight at 4°C.
Mass Spectrometry
Measurements were carried out with 50-μl aliquots of purified MsbA (12 μg/μl, 9 nmol) in 25 mM Tris, pH 7.8, 150 mM NaCl, 1 mM TCEP, 5% glycerol, 1 mM DDM and, for comparison, with buffer alone and Kdo2-Lipid A (0.4 nmol) in the same buffer. The lipids in these samples were purified by acid hydrolysis and Bligh-Dyer isolation. To cleave the glycosidic linkage between the Kdo and lipid A in LPS, the samples were resuspended in 180 μl of 12.5 mM sodium acetate, pH 4.5, and heated at 100°C for 60 min. After being cooled to room temperature, the suspension was converted into a two-phase Bligh-Dyer system by addition of 200 μl chloroform and 200 μl methanol. After mixing thoroughly and centrifugation at 3,000 g for 5 min, the lower phase was pooled and dried under a stream of nitrogen. The dried lipids were solubilized in 20 μl chloroform/methanol (2:1, v/v), and 1 μl of solubilized lipids was spotted onto the matrix-assisted laser desorption/ionization (MALDI) sample plate, followed by spotting with 1 μl of 20 mg/ml norharmane MALDI matrix (Sigma-Aldrich, St. Louis, MO, USA) dissolved in chloroform/methanol (2:1, v/v). MALDI-TOF (time-of-flight) and MALDI-TOF/TOF spectra were acquired using a Bruker Autoflex Speed mass spectrometer (Bruker Daltonics Inc., Billerica, MA, USA) in the negative ion mode. Each spectrum was acquired by an average of 5000 shots at 75% laser power using a reflectron mode. For tandem MS analysis, a collision induced dissociation (CID) and a LIFT mode were used. The collision cell is located after the MALDI ion source. All ions generated at the source collide with added air (80% N2 and 20% O2) during a passage through the collision cell. The LIFT device that raises the potential energy of the precursor and fragment ions is located between the collision cell and the reflectron. For all experiments using the LIFT mode, the ion acceleration voltage was set at 6.0 kV and the precursor ion selection mass window was set at 15 Da. Precursor and fragment ions after passing the collision cell were re-accelerated with an additional 19.0 kV in the LIFT cell, and the resulting ions were detected in the reflectron mode. The reflector voltage was set at 27.0 kV. Spectra were acquired using a laser frequency of 1000 Hz over a defined mass range (m/z 50–2000).
Reconstitution of MsbA into nanodiscs and proteoliposomes
E. coli polar lipid extract, 1-palmitoyl-2-oleoyl-sn-glycero-3-phospho-(1′-rac-glycerol) (POPG) or 1-palmitoyl-2-oleoyl-sn-glycero-3-phosphocholine (POPC) (Avanti Polar Lipids) was solubilized in chloroform, dried under argon gas to form a lipid film, and stored under vacuum overnight. The lipid film was resuspended at a concentration of 25 mM in buffer containing 20 mM Tris, pH 7.5, 100 mM NaCl and 100 mM sodium cholate. MsbA, the MSP1D1 membrane scaffold protein and lipids were mixed at a molar ratio of 1:1.2:40 in buffer containing 20 mM Tris, pH 7.5, 100 mM NaCl and 20 mM sodium cholate and incubated for 2 hours at 4°C. For reconstitution into larger nanodiscs, the MSP1E3D1 membrane scaffold protein and lipids were mixed at a molar ratio of 1:120. Detergents were removed by incubation with 60 mg Bio-Beads SM2 (Bio-Rad) overnight at 4°C. Nanodisc-embedded MsbA was purified using a Superdex 200 column in a buffer containing 20 mM Tris, pH 7.5, and 100 mM NaCl. For reconstitution of MsbA into nanodiscs with POPG and lipid A, MsbA purified from ClearColi™ was first incubated with lipid A (Sigma) at a molar ratio of 2:1 on ice for 1 hour, then reconstituted into POPG nanodiscs as described above. Reconstitution of MsbA into proteoliposomes was modified from a previously described procedure27. An E. coli polar lipid film was resuspended at 4 mg/ml in 25 mM HEPES, pH 7.5, and 100 mM NaCl, subjected to two freeze-thawing cycles, and then passed through a polycarbonate membrane with 0.2 μm pore size to generate liposomes. Liposomes were destabilized by adding 1 μmol DDM per mg lipid, followed by incubation with MsbA at a ratio of 100:1 (w/w) for 30 min at room temperature. To remove the DDM and to incorporate MsbA into the liposomes, the solution was incubated three times for two hours with 80 mg Bio-Beads. After a final overnight incubation with Bio-Beads, proteoliposomes were collected by centrifugation for 30 min at 52,000 rpm in a TLA-55 rotor, and resuspended at 0.4 mg/ml in 25 mM HEPES, pH 7.5, and 100 mM NaCl.
ATPase assay
All ATPase activity assays, including inhibition by ADP or vanadate, and stimulation by LPS, were modified from a previously described procedure27. One microgram of purified MsbA in detergent or 0.2 μg MsbA in lipid nanodiscs was incubated with 50 μl reaction solution containing 50 mM HEPES, pH 7.5, 10% glycerol, 100 mM NaCl, 2 mM ATP and 4 mM MgCl2 for 30 min at 37°C. The reaction was stopped by adding 50 μl 12% (w/v) SDS. 100 μl solution containing equal volumes of 12% (w/v) ascorbic acid in 1 M HCl and 2% (w/v) ammonium molybdate in 1 M HCl was added and incubated for 5 min at room temperature. Addition of 150 μl solution containing 25 mM sodium citrate, 2% (w/v) sodium metaarsenite and 2% (v/v) acetic acid was followed by incubation for 20 min at room temperature. Absorbance at 850 nm was measured using a SpectraMax M5 spectrophotometer (Molecular Devices), and potassium phosphate in a concentration range from 0.05 mM to 0.6 mM was used as standard for determining the concentration of released phosphate. ADP inhibition assays were carried out in the presence of 0.5 mM ATP, with the ADP concentration varying from 0 to 2 mM. Vanadate inhibition assays were carried out in the presence of 2 mM ATP and 4 mM MgCl2. For the substrate-stimulated ATPase activity assay shown in Fig. 2d, Kdo2-lipid A (Avanti Polar Lipids) in 25 mM HEPES, pH 7.5, 100 mM NaCl was vortexed and sonicated until the solution was transparent. Wild-type and mutant MsbA expressed in E. coli strain BL21 Star™ (DE3) pLysS were solubilized with 2% LDAO for 1 hour, and then purified in DDM as described above. The purified MsbA was reconstituted into proteoliposomes with E. coli polar lipids, and incubated with 100 μM Kdo2-lipid A for 1–2 hours on ice before performing the ATPase assay. The same assay was also carried out with wild-type MsbA purified from E. coli strain BL21 Star™ (DE3) pLysS after solubilization with DDM for 1 hour, and purified from ClearColi™ cells after solubilization with DDM overnight (Extended Data Fig. 2f).
Electron microscopy data acquisition
EM data were acquired as previously described50. Negatively stained specimens were prepared following an established protocol with minor modifications51. Specifically, 2.5 μl of purified MsbA was applied to glow-discharged copper EM grids covered with a thin layer of continuous carbon film, and the grids were stained with 2% (w/v) uranyl formate. These grids were imaged on a Tecnai T12 electron microscope (FEI) operated at 120 kV at a nominal magnification of 67,000x using a 4k x 4k CCD camera (UltraScan 4000, Gatan), corresponding to a calibrated pixel size of 1.68 Å on the specimen level.
For cryo-EM, 2.5 μl of purified nanodisc-embedded MsbA at a concentration of 0.8 to 1 mg/ml were applied to a glow-discharged Quantifoil holey carbon grid (1.2/1.3, 400 mesh). Grids were blotted for 2.5 s with ~90% humidity and plunge-frozen in liquid ethane using a Cryoplunge 3 System (Gatan). Cryo-EM data were collected at liquid nitrogen temperature on a Polara electron microscope (FEI), operated at 300 kV and equipped with a K2 Summit direct electron detector (Gatan). All cryo-EM movies were recorded in super-resolution counting mode using the semi-automated data collection program UCSFImage452. Specifically, images were acquired at a nominal magnification of 31,000x, corresponding to a calibrated pixel size of 1.23 Å on the specimen level and 0.615 Å for super-resolution images. The dose rate was set to be 8.2 counts (corresponding to 9.9 electrons) per physical pixel per second. The total exposure time of each movie was 7.2 s, leading to a total accumulated dose of 47 electrons per Å2, fractionated into 36 frames (200 ms per frame). Movies were recorded with an underfocus ranging from 1.2 to 3.0 μm.
EM image processing
The EM data were processed as previously described with minor modifications50. Negative-stain EM images were binned over 2 × 2 pixels for further processing, yielding a pixel size of 3.36 Å. Dose-fractionated super-resolution movies collected using the K2 Summit direct electron detector were binned over 2 × 2 pixels, yielding a pixel size of 1.23 Å, and then subjected to motion correction using the program MotionCor253. A sum of all 36 frames of each image stack was calculated following a dose-weighting scheme, and used for all image-processing steps except for defocus determination. The program CTFFIND354 was used to calculate defocus values of the summed images from all movie frames without dose weighting. Particle picking was performed using a semi-automated procedure50. 2D classification of selected particle images were carried out either by ‘samclasscas.py’, which uses SPIDER operations to run 10 cycles of correspondence analysis, K-means classification and multi-reference alignment, or by RELION 2D classification55,56. Initial 3D models were generated with 2D class averages by SPIDER 3D projection matching refinement (‘samrefine.py’), starting from a cylindrical density mimicking the general shape and size of nanodisc-embedded MsbA. 3D classification and refinement were carried out in RELION. The masked 3D classification focusing on the TMDs with residual signal subtraction was done following a previously described procedure57. The orientation parameters of the homogenous set of particle images in the selected 3D classes were iteratively refined to yield higher resolution maps using the ‘auto-refine’ procedure. All 3D classification and refinement steps were carried out without applying symmetry, except for the ‘auto-refine’ step used for vanadate-trapped MsbA, in which case C2 symmetry was applied. All refinements followed the gold-standard procedure, in which two half data sets are refined independently. The overall resolutions were estimated based on the gold-standard Fourier shell correlation (FSC) = 0.143 criterion. Local resolution variations were estimated from two half data maps using ResMap58. The amplitude information of the final maps was corrected by applying a negative B-factor using the program bfactor.exe59. The number of particles in each data set and other details related to data processing are summarized in Extended Data Table 1.
Model building and refinement
The crystal structures of nucleotide-free MsbA (PDB IDs: 3B5W and 3B5X) were not used as templates for our model building, due to their relatively low resolutions (>5 Å). Our initial model of nucleotide-free MsbA in the inward-facing conformation was generated based on the crystal structure of TM287/28860 (PDB ID: 3QF4, chain B, 35% identity and 57% similarity with the E. coli MsbA sequence) using the SWISS MODEL server61, and then fitted into the cryo-EM map in UCSF Chimera62. The model with side chains was manually adjusted in Coot63 and refined in phenix.real_space_refine64 with secondary structure restraints enabled. 216 residues in the TMDs of MsbA with well-defined side-chain densities were kept in the final model, including 108 residues in chain A and 98 residues in chain B, while all other residues were mutated to alanine with CHAINSAW. The LPS model from the crystal structure of the TLR4-MD-2-LPS complex32 (PDB ID: 3FXI) was fitted into the EM density in Chimera, and then manually refined in Coot with restrains generated by the PRODRG sever65. The EM densities are too short to accommodate the full length of the acyl chains of LPS, perhaps due to flexibility in their distal ends. In the final model, the number of carbon atom modeled for the acyl chains are: 9 in R2, 14 in R3, 5 in R2′, 7 in R2″, 6 in R3′ and 5 in R3″. The strong EM densities inside the MsbA cavity define the positions of two phosphorylated glucosamine rings and the inner core. The clear connection of the inner core to the 5′ position of the glucosamine backbone allowed for unambiguous assignment of the positions of the 1- and 4′-phorsphate groups and the LPS orientation parallel to the membrane plane. Due to the limited resolution of the map and the potential heterogeneity in the LPS species in E. coli polar lipid extract, the precise positions of individual atoms in LPS could not be determined.
Since our vanadate-trapped MsbA adopts a closed conformation, the crystal structure of MsbA with ADP-vanadate (PDB ID: 3B60), which shows an outward-facing conformation, was not used as template for model building. Instead, we used MODELLER to create a model of our vanadate-trapped MsbA based on the crystal structure of McjD (PDB ID: 4PL0) and fitted it into the cryo-EM map. After one round of refinement using phenix.real_space_refine with secondary structure restraints enabled, this initial model, which contained side chains, was further improved by several rounds of manual adjustment in Coot and refinement using phenix.real_space_refine. The final poly-alanine model was generated by removing all side chains with CHAINSAW.
Figures and the movie were prepared using UCSF Chimera62, and the hydrophobicity surface was drawn according to the scale of Kyte and Doolittle66.
Extended Data
Extended Data Figure 1. LPS and its cross-membrane transport in Gram-negative bacteria.
a, b, Chemical structure (a) and cartoon representation (b) of E. coli rough LPS (lipid A with inner and outer core oligosaccharides). The carbon atoms of the glucosamines are numbered, and the lipid acyl chains attached to the glucosamines are labeled as R2 to R3″. Abbreviations: Kdo: 3-deoxy-D-manno-oct-2-ulosonic acid; Hep: L-glycero-D-manno-heptose; Glc: Glucose; Gal: Galactose. c, The LPS-transport pathway in E. coli consists of four steps: 1) MsbA-driven flipping of rough LPS from the cytoplasmic to the periplasmic leaflet of the inner membrane; 2) WaaL-mediated ligation of O-antigen onto rough LPS to form mature, smooth LPS; 3) cross-periplasm transport of LPS, mediated by proteins Lpt F, G, B, C and A; and 4) LPS insertion into the outer leaflet of the outer membrane, mediated by proteins Lpt D and E.
Extended Data Figure 2. Purification and characterization of MsbA in DDM, nanodiscs and proteoliposomes.
a, Gel-filtration profile (Superdex-200) of purified MsbA in nanodiscs formed with MSP1D1 and E. coli polar lipids. Inset shows that the peak material contains His-tagged MsbA (67.2 kDa) and MSP1D1 (22 kDa), and that these migrate as single, homogeneous bands on a Coomassie-stained SDS-PAGE gel. For gel source data, see Supplementary Figure 1. b, ATPase activities of MsbA in DDM, in nanodiscs formed with different MSPs and lipid compositions or in proteoliposomes. c, Assay of the ATP concentration-dependent ATPase activity of MsbA in nanodiscs formed with MSP1D1 and E. coli polar lipids yielded a Km of 0.34 ± 0.02 mM and a Vmax of 4.34 ± 0.08 μmol ATP/min/mg MsbA. d, Assay of the ADP concentration-dependent inhibition of the ATPase activity of MsbA in nanodiscs formed with MSP1D1 and E. coli polar lipids, in the presence of 0.5 mM ATP yielded a KI(ADP) of 0.54 ± 0.05 mM. e, Assay of the vanadate concentration-dependent inhibition of the ATPase activity of MsbA in nanodiscs formed with MSP1D1 and E. coli polar lipids, in the presence of 2 mM ATP. With 0.01 mM vanadate, the ATPase activity was inhibited by 90%. f, ATPase activity of wild-type MsbA in proteoliposomes in the absence (−) and presence (+) of 100 μM Kdo2-lipid A. The first two MsbA samples were purified from E. coli strain BL21 (DE3) after membrane solubilization with LDAO or DDM for 1 hour, and the third MsbA sample was purified from the ClearColi™ strain after solubilization with DDM overnight. Each point represents the mean ± s.d. of three separate measurements. The 100% activity is 4.7 ± 0.3 μmol ATP/min/mg MsbA. g, MALDI-TOF/TOF mass spectra of buffer alone, Kdo2-lipid A and purified MsbA in DDM. The fragment at m/z 1796 is consistent with a diphosphorylated hexa-acyl form of lipid A, which is generated by acid hydrolysis to remove the glycosylation on E. coli LPS. h, Tandem MS spectra of the fragments at m/z 1796 from Kdo2-lipid A and purified MsbA. i, Chemical structures and m/z values of the potential break-down products of E. coli lipid A (m/z = 1796). j, MALDI-TOF/TOF mass spectra of Kdo2-lipid A, wild-type MsbA, and the R78A/R148A/K299A mutant purified in DDM. Samples were prepared as in g.
Extended Data Figure 3. Single-particle EM analysis of the overall architecture of nucleotide-free MsbA in DDM and in nanodiscs formed with different MSPs and lipids.
a, Representative negative-stain EM image and 2D averages of MsbA in DDM. b, Representative negative-stain EM image and 2D averages of MsbA in nanodiscs formed with MSP1D1 and POPG. The box dimension of the 2D averages shown in a and b is 215 Å. c, 2D averages and 3D classification of cryo-EM particles of MsbA reconstituted into nanodiscs with MSP1D1 and E. coli polar lipids. d, 2D averages and 3D classification of cryo-EM particles of MsbA reconstituted into nanodiscs with MSP1D1 and POPG. e, 2D averages and 3D classification of cryo-EM particles of MsbA reconstituted into nanodiscs with MSP1E3D1 and E. coli polar lipids. The box dimension of the 2D averages shown in c to e is 236 Å. Good cryo-EM reconstructions are indicated with blue dotted circles, while other classes yielded distorted 3D reconstructions. f, The superimposition of the 3D reconstructions of class #1 in panel c (gray, indicated by a star) and class #5 in panel e (purple, indicated by a star) shows essentially identical overall architectures of MsbA, despite the very different nanodisc sizes.
Extended Data Figure 4. Image processing workflow for nucleotide-free MsbA in nanodiscs.
a, Three subsequent 3D classifications were used to remove bad particles (classification 1), to select particles with homogeneous TMDs (classification 2), and to exclude particles with very small nanodiscs (classification 3). b, Central cross sections through the three good cryo-EM reconstructions from the second 3D classification step. Class #3 shows the outer core oligosaccharide. c, Views perpendicular and parallel to the membrane plane of the superimposed cryo-EM reconstructions of class #1 (gray) and class #2 (yellow) from the third 3D classification. Compared to the density map of class #2, the density map of class #1 shows a more open conformation, with its two NBDs moving apart in a shearing motion (black arrows).
Extended Data Figure 5. Single-particle cryo-EM analysis of nucleotide-free MsbA in nanodiscs.
a, 2D averages of cryo-EM particles of MsbA reconstituted into nanodiscs with MSP1D1 and E. coli polar lipids. The particle box dimension is 236 Å. b, Final 3D reconstruction filtered to 4.2 Å (left) and a central cross section (right), colored according to the local resolution. c, Gold-standard Fourier shell correlation curves calculated with a soft mask to include only the TMDs (blue curve) or the whole MsbA molecule without the nanodisc (green curve). d, Angular distribution of the cryo-EM particles included in the final reconstruction. e, Selected cryo-EM densities (gray mesh) with the atomic model, showing amino acids that form a ring of hydrophilic interactions surrounding the glucosamines of LPS. Only side chains with well-defined EM density are shown. The main chains are colored in blue and orange to indicate the two MsbA subunits, and LPS is shown in green. The numbers associated with the red dotted lines denote the distances between hydrophilic side chains and the phosphate groups of LPS. f, Protein sequence alignment of TM2, TM3, TM5 and TM6 from Escherichia coli (ECOLI), Salmonella typhimurium (SALTY), Vibrio cholera (VIBCH), Francisella novicida (FRANO), Pseudomonas aeruginosa (PSEAE), Neisseria meningitides (NEIMB), Burkholderia mallei (BURMA) and Bordetella bronchiseptica (BORBR). Only selected regions of the sequences are shown. Important residues with side chains that are represented by clear density in the cryo-EM map are highlighted and labeled according to the residue numbers in E. coli MsbA.
Extended Data Figure 6. Analysis of the cryo-EM structure of nucleotide-free MsbA in nanodiscs.
a, The final cryo-EM reconstruction filtered to 4.2 Å without applying a B-factor with the atomic model of MsbA in the nucleotide-free state. The nanodisc density indicates that the membrane bilayer embeds MsbA in the region between the periplasmic loops and the elbow helices. The green arrow indicates the putative LPS entry site between TM4 and TM6. b, Three perpendicular views of the atomic model of the MsbA TMDs with the cryo-EM density for the LPS molecules. In the top two panels, some helices are omitted for clarity. c, LPS density shown using a normal (left) and a high (right) contouring threshold, together with its atomic model. d, Comparison of the cryo-EM structure of MsbA in nanodiscs (subunits shown in blue and orange) and the crystal structure of E. coli MsbA in detergent (subunits shown in cyan and yellow). The thick blue lines indicate the boundaries of the lipid bilayer for nanodisc-embedded MsbA, and the dashed blue line indicates the level just above the elbow helix in the crystal structure. e, Superimposition of the cryo-EM structure of MsbA in nanodiscs (subunits shown in blue and orange ribbon representation) and the crystal structure of detergent-solubilized Vibrio cholerae MsbA (subunits shown in cyan and yellow wire representation), which was obtained by aligning one TMD/NBD wing from each structure (left panel). Comparison of the non-aligned TMD/NBD wings (right panel) shows that TM4, TM5 and NBD in the crystal structure have moved forward compared to the cryo-EM structure. f, View from the cytoplasm of the cryo-EM structure of MsbA in nanodiscs and the crystal structure of detergent-solubilized Vibrio cholerae MsbA. The numbers associated with the red dotted lines indicate the Cα distances between Ser378 and Ser482 in the opposing NBDs.
Extended Data Figure 7. Comparison of 3D reconstructions obtained for E. coli MsbA in POPG nanodiscs, MsbA purified from ClearColi™ in POPG-lipid A nanodiscs and E. coli MsbA in POPC nanodisc.
a, Gold-standard Fourier shell correlation curves calculated with a soft mask to include only the TMDs of MsbA. The indicated resolutions were estimated based on the FSC=0.143 criterion. b, 3D reconstructions filtered to the resolutions of their TMDs, colored according to the local resolution. c, Cross-sectional views and selected slices through the 3D reconstructions. Below, cartoon representations of E. coli lipid A with inner core, lipid A and lipid IVA are shown. In the slices, the densities representing the phosphorylated glucosamines are indicated by black arrows. The inner core is indicated with red circles in the cross-sectional views and red arrowhead in the slices. Note that the inner core density is completely absent from the cryo-EM map of MsbA purified from ClearColi™ and reconstituted into nanodiscs with POPG and lipid A. Due to the low resolution of the acyl chains of lipid A, which is likely caused by their flexibility, it is not clear whether the density inside MsbA purified from ClearColi™ represents lipid IVA that was possibly co-purified with MsbA or the lipid A that was added during nanodisc reconstitution or a mixture of both.
Extended Data Figure 8. Single-particle cryo-EM analysis of nanodisc-embedded MsbA with ADP-vanadate.
a, Selected area of a representative cryo-EM image. Scale bar indicates 200 Å. b, 2D averages of cryo-EM particles. The particle box dimension is 236 Å. c, Image processing workflow. By applying C2 symmetry, the two best 3D classes were independently refined to 8 and 4.8 Å. The central cross sections of these two refined EM maps are shown. d, Final 3D reconstruction filtered to 4.8 Å. The map is colored according to its local resolution. Front view and a central cross section are shown. e, Gold-standard Fourier shell correlation curve calculated with a soft mask to include only MsbA but not the nanodisc. f, Angular distribution of the cryo-EM particles included in the final 3D reconstruction. g, Comparison of the central cross sections of the atomic model of nanodisc-reconstituted MsbA with ADP-vanadate and the crystal structure of McjD (PDB ID: 4PL0) in the occluded conformation. TM6 and TM3 are colored in red and magenta, respectively. h, Comparison of the cryo-EM structure of nucleotide-free MsbA in the inward-facing conformation and the crystal structure of MsbA with AMPPNP in the outward-facing conformation. Cross sections perpendicular to the membrane plane are shown at the level of the LPS glucosamines in nucleotide-free MsbA, with the TM helices numbered and important residues indicated. The green dashed lines indicate the boundaries between the two TMDs. The organization of the TM helices is different in different functional states. Listed below are the Cα atom distances between the indicated pairs of amino acids.
Extended Data Figure 9. Single-particle cryo-EM analysis of nanodisc-embedded MsbA with ADP.
a, Selected area of a representative cryo-EM image. Scale bar indicates 200 Å. b, 2D averages of cryo-EM particles. The particle box dimension is 236 Å. c, Image processing workflow. d, Views of the final 3D reconstruction filtered to 6.9 Å (left) and its central cross section (right), colored according to the local resolution. e, Gold-standard Fourier shell correlation curve calculated with a soft mask to include only MsbA but not the nanodisc. f, Angular distribution of the cryo-EM particles included in the final reconstruction. g, Surface view of the cryo-EM reconstruction of nanodisc-embedded MsbA in the presence of ADP (gray), and central cross sections through the cryo-EM reconstructions of MsbA in the ADP-bound (middle) and nucleotide-free states (right). Both cryo-EM maps were filtered to 6.9 Å resolution and are shown with the atomic model of nanodisc-embedded MsbA in the nucleotide-free state. The green dashed circles indicate LPS densities inside MsbA.
Extended Data Table 1.
Statistics of the cryo-EM structures presented in this study
| Cryo-EM data collection and processing | Nucleotide-free E. coli MsbA | E. coli MsbA with ADP-Vanadate | E. coli MsbA with ADP |
|---|---|---|---|
|
| |||
| Voltage (kV) | 300 | 300 | 300 |
| Electron dose (e−/Å2) | 47 | 47 | 47 |
| Number of collected movies | 6,700 | 3,557 | 2,476 |
| Particle defocus range (average) (μm) | 1.2–2.8 (1.97) | 1.3–2.8 (2.05) | 1.2–2.5 (1.87) |
| Number of particles for 3D classification | 745,352 | 274,215 | 382,898 |
| Number of particles for final map | 67,220 | 36,732 | 27,397 |
| Symmetry for final map | C1 | C2 | C1 |
| Resolution (Å) | 4.7 (4.2 for TMD) | 4.8 | 6.9 |
| Map sharpening B-factor (Å2) | −200 | −200 | −400 |
|
| |||
| Atomic model refinement | |||
|
| |||
| Number of protein residues | 1,140 | 1,138 | |
| Number of side chains in TMDs (A, B) | 206 (108, 98) | 0 | |
| Number of lipids | 1 | 0 | |
| Number of atoms | 6,548 | 5,616 | |
| Geometric parameters (r.m.s.d.) | |||
| Bond length (Å) | 0.006 | 0.006 | |
| Bond angle (°) | 1.170 | 1.358 | |
| Ramachandran statistics | |||
| Residues in favoured regions (%) | 87.7 | 89.4 | |
| Residues in allowed regions (%) | 11.6 | 9.7 | |
| Residues in disallowed regions (%) | 0.7 | 1 | |
| Rotamer outliers (%) | 0.5 | ||
| Cryo-EM data collection and processing | E. coli MsbA/POPG-ND | ClearColi™ MsbA/POPG-lipid A-ND | E. coli MsbA/POPC-ND |
|---|---|---|---|
|
| |||
| Voltage (kV) | 300 | 300 | 300 |
| Electron dose (e−/Å2) | 47 | 47 | 47 |
| Number of collected movies | 1,774 | 4,212 | 2,505 |
| Particle defocus range (average) (μm) | 1.4–2.8 (2.05) | 1.2–2.8 (1.86) | 1.3–2.8 (2.00) |
| Number of particles for 3D classification | 276,712 | 554,677 | 540,913 |
| Number of particles for final map | 55,199 | 85,496 | 24,588 |
| Symmetry used for final map | C1 | C1 | C1 |
| Resolution of TMD (Å) | 5.0 | 4.5 | 5.5 |
| Map sharpening B-factor (Å2) | −280 | −220 | −280 |
Supplementary Material
Acknowledgments
We thank G. Chang for providing the MsbA expression plasmid. We are grateful to Z. Li and M. Chambers for EM technical support. We thank D. Kahne for making us aware of ClearColi™. We thank W. Harper, T. Rapoport, and T. Walther for critical reading of the manuscript. We thank members of the Liao group for helpful discussions and comments on the manuscript, and members of the Walz group for help in the initial phases of the project.
Footnotes
Author Contribution
M.L. conceived the project. T.W. advised on experimental design. W.M. purified MsbA, performed nanodisc and proteoliposome reconstitution, generated MsbA mutants, measured ATPase activities, carried out EM data collection and image processing, and built the atomic models. Y.L., S.H.Y. and R.K.E. performed the mass spectrometry measurement and analysis presented in Extended Data Fig. 2g–j. W.M. and M.L. analyzed the data and wrote the manuscript with contributions from T.W.
DATA AVAILABILITY STATEMENT:
The three-dimensional cryo-EM density maps of E. coli MsbA in nanodiscs formed with E. coli polar lipids have been deposited in the Electron Microscopy Data Bank under accession numbers EMD-8469 (nucleotide-free MsbA in nanodiscs), EMD-8467 (MsbA in nanodiscs with ADP-vanadate) and EMD-8465 (MsbA in nanodiscs with ADP). Atomic coordinates for the atomic models have been deposited in the Protein Data Bank under accession numbers 5TV4 (nucleotide-free MsbA in nanodiscs) and 5TTP (MsbA in nanodiscs with ADP-vanadate). The additional cryo-EM maps of nucleotide-free MsbA in POPG nanodiscs, MsbA purified from ClearColi™ in nanodiscs formed with POPG and lipid A, and MsbA in POPC nanodiscs have been deposited in the Electron Microscopy Data Bank with the accession codes EMD-8669, EMD-8670 and EMD-8671, respectively.
The authors declare no competing financial interests.
References
- 1.Dowhan W. Molecular basis for membrane phospholipid diversity: why are there so many lipids? Annu Rev Biochem. 1997;66:199–232. doi: 10.1146/annurev.biochem.66.1.199. [DOI] [PubMed] [Google Scholar]
- 2.Holthuis JC, Menon AK. Lipid landscapes and pipelines in membrane homeostasis. Nature. 2014;510:48–57. doi: 10.1038/nature13474. [DOI] [PubMed] [Google Scholar]
- 3.van Meer G. Dynamic transbilayer lipid asymmetry. Cold Spring Harb Perspect Biol. 2011;3 doi: 10.1101/cshperspect.a004671. [DOI] [PMC free article] [PubMed] [Google Scholar]
- 4.Sharom FJ. Flipping and flopping--lipids on the move. IUBMB Life. 2011;63:736–46. doi: 10.1002/iub.515. [DOI] [PubMed] [Google Scholar]
- 5.Sebastian TT, Baldridge RD, Xu P, Graham TR. Phospholipid flippases: building asymmetric membranes and transport vesicles. Biochim Biophys Acta. 2012;1821:1068–77. doi: 10.1016/j.bbalip.2011.12.007. [DOI] [PMC free article] [PubMed] [Google Scholar]
- 6.Andersen JP, et al. P4-ATPases as Phospholipid Flippases-Structure, Function, and Enigmas. Front Physiol. 2016;7:275. doi: 10.3389/fphys.2016.00275. [DOI] [PMC free article] [PubMed] [Google Scholar]
- 7.Montigny C, Lyons J, Champeil P, Nissen P, Lenoir G. On the molecular mechanism of flippase- and scramblase-mediated phospholipid transport. Biochim Biophys Acta. 2016;1861:767–83. doi: 10.1016/j.bbalip.2015.12.020. [DOI] [PubMed] [Google Scholar]
- 8.Ruiz N, Kahne D, Silhavy TJ. Transport of lipopolysaccharide across the cell envelope: the long road of discovery. Nat Rev Microbiol. 2009;7:677–83. doi: 10.1038/nrmicro2184. [DOI] [PMC free article] [PubMed] [Google Scholar]
- 9.Raetz CR, Reynolds CM, Trent MS, Bishop RE. Lipid A modification systems in gram-negative bacteria. Annu Rev Biochem. 2007;76:295–329. doi: 10.1146/annurev.biochem.76.010307.145803. [DOI] [PMC free article] [PubMed] [Google Scholar]
- 10.Beutler B, Rietschel ET. Innate immune sensing and its roots: the story of endotoxin. Nat Rev Immunol. 2003;3:169–76. doi: 10.1038/nri1004. [DOI] [PubMed] [Google Scholar]
- 11.Whitfield C, Trent MS. Biosynthesis and export of bacterial lipopolysaccharides. Annu Rev Biochem. 2014;83:99–128. doi: 10.1146/annurev-biochem-060713-035600. [DOI] [PubMed] [Google Scholar]
- 12.May JM, Sherman DJ, Simpson BW, Ruiz N, Kahne D. Lipopolysaccharide transport to the cell surface: periplasmic transport and assembly into the outer membrane. Philos Trans R Soc Lond B Biol Sci. 2015;370 doi: 10.1098/rstb.2015.0027. [DOI] [PMC free article] [PubMed] [Google Scholar]
- 13.Simpson BW, May JM, Sherman DJ, Kahne D, Ruiz N. Lipopolysaccharide transport to the cell surface: biosynthesis and extraction from the inner membrane. Philos Trans R Soc Lond B Biol Sci. 2015;370 doi: 10.1098/rstb.2015.0029. [DOI] [PMC free article] [PubMed] [Google Scholar]
- 14.Ward A, Reyes CL, Yu J, Roth CB, Chang G. Flexibility in the ABC transporter MsbA: Alternating access with a twist. Proc Natl Acad Sci U S A. 2007;104:19005–10. doi: 10.1073/pnas.0709388104. [DOI] [PMC free article] [PubMed] [Google Scholar]
- 15.Dong J, Yang G, McHaourab HS. Structural basis of energy transduction in the transport cycle of MsbA. Science. 2005;308:1023–8. doi: 10.1126/science.1106592. [DOI] [PubMed] [Google Scholar]
- 16.Zou P, McHaourab HS. Alternating access of the putative substrate-binding chamber in the ABC transporter MsbA. J Mol Biol. 2009;393:574–85. doi: 10.1016/j.jmb.2009.08.051. [DOI] [PMC free article] [PubMed] [Google Scholar]
- 17.Tarling EJ, de Aguiar Vallim TQ, Edwards PA. Role of ABC transporters in lipid transport and human disease. Trends Endocrinol Metab. 2013;24:342–50. doi: 10.1016/j.tem.2013.01.006. [DOI] [PMC free article] [PubMed] [Google Scholar]
- 18.Lopez-Marques RL, et al. Structure and mechanism of ATP-dependent phospholipid transporters. Biochim Biophys Acta. 2015;1850:461–75. doi: 10.1016/j.bbagen.2014.04.008. [DOI] [PubMed] [Google Scholar]
- 19.Locher KP. Mechanistic diversity in ATP-binding cassette (ABC) transporters. Nat Struct Mol Biol. 2016;23:487–93. doi: 10.1038/nsmb.3216. [DOI] [PubMed] [Google Scholar]
- 20.Kim J, et al. Subnanometre-resolution electron cryomicroscopy structure of a heterodimeric ABC exporter. Nature. 2015;517:396–400. doi: 10.1038/nature13872. [DOI] [PMC free article] [PubMed] [Google Scholar]
- 21.Oldham ML, et al. A mechanism of viral immune evasion revealed by cryo-EM analysis of the TAP transporter. Nature. 2016;529:537–40. doi: 10.1038/nature16506. [DOI] [PMC free article] [PubMed] [Google Scholar]
- 22.Zhang Z, Chen J. Atomic Structure of the Cystic Fibrosis Transmembrane Conductance Regulator. Cell. 2016;167:1586–1597 e9. doi: 10.1016/j.cell.2016.11.014. [DOI] [PubMed] [Google Scholar]
- 23.Johnson ZL, Chen J. Structural Basis of Substrate Recognition by the Multidrug Resistance Protein MRP1. Cell. 2017;168:1075–1085 e9. doi: 10.1016/j.cell.2017.01.041. [DOI] [PubMed] [Google Scholar]
- 24.Liu F, Zhang Z, Csanady L, Gadsby DC, Chen J. Molecular Structure of the Human CFTR Ion Channel. Cell. 2017;169:85–95 e8. doi: 10.1016/j.cell.2017.02.024. [DOI] [PubMed] [Google Scholar]
- 25.Li N, et al. Structure of a Pancreatic ATP-Sensitive Potassium Channel. Cell. 2017;168:101–110 e10. doi: 10.1016/j.cell.2016.12.028. [DOI] [PubMed] [Google Scholar]
- 26.Bayburt TH, Sligar SG. Membrane protein assembly into Nanodiscs. FEBS Lett. 2010;584:1721–7. doi: 10.1016/j.febslet.2009.10.024. [DOI] [PMC free article] [PubMed] [Google Scholar]
- 27.Doerrler WT, Raetz CR. ATPase activity of the MsbA lipid flippase of Escherichia coli. J Biol Chem. 2002;277:36697–705. doi: 10.1074/jbc.M205857200. [DOI] [PubMed] [Google Scholar]
- 28.Siarheyeva A, Sharom FJ. The ABC transporter MsbA interacts with lipid A and amphipathic drugs at different sites. Biochem J. 2009;419:317–28. doi: 10.1042/BJ20081364. [DOI] [PMC free article] [PubMed] [Google Scholar]
- 29.Kawai T, Caaveiro JM, Abe R, Katagiri T, Tsumoto K. Catalytic activity of MsbA reconstituted in nanodisc particles is modulated by remote interactions with the bilayer. FEBS Lett. 2011;585:3533–7. doi: 10.1016/j.febslet.2011.10.015. [DOI] [PubMed] [Google Scholar]
- 30.Hasin M, Kennedy EP. Role of phosphatidylethanolamine in the biosynthesis of pyrophosphoethanolamine residues in the lipopolysaccharide of Escherichia coli. J Biol Chem. 1982;257:12475–7. [PubMed] [Google Scholar]
- 31.Kaur H, et al. The ABC exporter MsbA probed by solid state NMR - challenges and opportunities. Biol Chem. 2015;396:1135–49. doi: 10.1515/hsz-2015-0119. [DOI] [PMC free article] [PubMed] [Google Scholar]
- 32.Park BS, et al. The structural basis of lipopolysaccharide recognition by the TLR4-MD-2 complex. Nature. 2009;458:1191–5. doi: 10.1038/nature07830. [DOI] [PubMed] [Google Scholar]
- 33.Chen J. Molecular mechanism of the Escherichia coli maltose transporter. Curr Opin Struct Biol. 2013;23:492–8. doi: 10.1016/j.sbi.2013.03.011. [DOI] [PMC free article] [PubMed] [Google Scholar]
- 34.Buchaklian AH, Klug CS. Characterization of the Walker A motif of MsbA using site-directed spin labeling electron paramagnetic resonance spectroscopy. Biochemistry. 2005;44:5503–9. doi: 10.1021/bi047568v. [DOI] [PubMed] [Google Scholar]
- 35.Zou P, McHaourab HS. Increased sensitivity and extended range of distance measurements in spin-labeled membrane proteins: Q-band double electron-electron resonance and nanoscale bilayers. Biophys J. 2010;98:L18–20. doi: 10.1016/j.bpj.2009.12.4193. [DOI] [PMC free article] [PubMed] [Google Scholar]
- 36.Schultz KM, Merten JA, Klug CS. Characterization of the E506Q and H537A dysfunctional mutants in the E. coli ABC transporter MsbA. Biochemistry. 2011;50:3599–608. doi: 10.1021/bi101666p. [DOI] [PMC free article] [PubMed] [Google Scholar]
- 37.Eckford PD, Sharom FJ. Functional characterization of Escherichia coli MsbA: interaction with nucleotides and substrates. J Biol Chem. 2008;283:12840–50. doi: 10.1074/jbc.M708274200. [DOI] [PubMed] [Google Scholar]
- 38.Cooper RS, Altenberg GA. Association/dissociation of the nucleotide-binding domains of the ATP-binding cassette protein MsbA measured during continuous hydrolysis. J Biol Chem. 2013;288:20785–96. doi: 10.1074/jbc.M113.477976. [DOI] [PMC free article] [PubMed] [Google Scholar]
- 39.Zoghbi ME, Cooper RS, Altenberg GA. The Lipid Bilayer Modulates the Structure and Function of an ATP-binding Cassette Exporter. J Biol Chem. 2016;291:4453–61. doi: 10.1074/jbc.M115.698498. [DOI] [PMC free article] [PubMed] [Google Scholar]
- 40.Dawson RJ, Locher KP. Structure of the multidrug ABC transporter Sav1866 from Staphylococcus aureus in complex with AMP-PNP. FEBS Lett. 2007;581:935–8. doi: 10.1016/j.febslet.2007.01.073. [DOI] [PubMed] [Google Scholar]
- 41.Choudhury HG, et al. Structure of an antibacterial peptide ATP-binding cassette transporter in a novel outward occluded state. Proc Natl Acad Sci U S A. 2014;111:9145–50. doi: 10.1073/pnas.1320506111. [DOI] [PMC free article] [PubMed] [Google Scholar]
- 42.Lin DY, Huang S, Chen J. Crystal structures of a polypeptide processing and secretion transporter. Nature. 2015;523:425–30. doi: 10.1038/nature14623. [DOI] [PubMed] [Google Scholar]
- 43.Gu RX, et al. Conformational Changes of the Antibacterial Peptide ATP Binding Cassette Transporter McjD Revealed by Molecular Dynamics Simulations. Biochemistry. 2015;54:5989–98. doi: 10.1021/acs.biochem.5b00753. [DOI] [PubMed] [Google Scholar]
- 44.Doshi R, et al. Molecular disruption of the power stroke in the ATP-binding cassette transport protein MsbA. J Biol Chem. 2013;288:6801–13. doi: 10.1074/jbc.M112.430074. [DOI] [PMC free article] [PubMed] [Google Scholar]
- 45.Borbat PP, et al. Conformational motion of the ABC transporter MsbA induced by ATP hydrolysis. PLoS Biol. 2007;5:e271. doi: 10.1371/journal.pbio.0050271. [DOI] [PMC free article] [PubMed] [Google Scholar]
- 46.Doshi R, van Veen HW. Substrate binding stabilizes a pre-translocation intermediate in the ATP-binding cassette transport protein MsbA. J Biol Chem. 2013;288:21638–47. doi: 10.1074/jbc.M113.485714. [DOI] [PMC free article] [PubMed] [Google Scholar]
- 47.Moeller A, et al. Distinct conformational spectrum of homologous multidrug ABC transporters. Structure. 2015;23:450–60. doi: 10.1016/j.str.2014.12.013. [DOI] [PMC free article] [PubMed] [Google Scholar]
- 48.Perez C, et al. Structure and mechanism of an active lipid-linked oligosaccharide flippase. Nature. 2015;524:433–8. doi: 10.1038/nature14953. [DOI] [PubMed] [Google Scholar]
- 49.Brunner JD, Lim NK, Schenck S, Duerst A, Dutzler R. X-ray structure of a calcium-activated TMEM16 lipid scramblase. Nature. 2014;516:207–12. doi: 10.1038/nature13984. [DOI] [PubMed] [Google Scholar]
- 50.Ru H, et al. Molecular Mechanism of V(D)J Recombination from Synaptic RAG1-RAG2 Complex Structures. Cell. 2015;163:1138–52. doi: 10.1016/j.cell.2015.10.055. [DOI] [PMC free article] [PubMed] [Google Scholar]
- 51.Booth DS, Avila-Sakar A, Cheng Y. Visualizing proteins and macromolecular complexes by negative stain EM: from grid preparation to image acquisition. J Vis Exp. 2011 doi: 10.3791/3227. [DOI] [PMC free article] [PubMed] [Google Scholar]
- 52.Li X, Zheng S, Agard DA, Cheng Y. Asynchronous data acquisition and on-the-fly analysis of dose fractionated cryoEM images by UCSFImage. J Struct Biol. 2015;192:174–8. doi: 10.1016/j.jsb.2015.09.003. [DOI] [PMC free article] [PubMed] [Google Scholar]
- 53.Zheng S, Palovcak E, Armache J-P, Cheng Y, Agard D. Anisotropic Correction of Beam-induced Motion for Improved Single-particle Electron Cryo-microscopy. BioArxiv. 2016 doi: 10.1038/nmeth.4193. http://biorxiv.org/content/early/2016/07/04/061960. [DOI] [PMC free article] [PubMed]
- 54.Mindell JA, Grigorieff N. Accurate determination of local defocus and specimen tilt in electron microscopy. J Struct Biol. 2003;142:334–47. doi: 10.1016/s1047-8477(03)00069-8. [DOI] [PubMed] [Google Scholar]
- 55.Scheres SH. RELION: implementation of a Bayesian approach to cryo-EM structure determination. J Struct Biol. 2012;180:519–30. doi: 10.1016/j.jsb.2012.09.006. [DOI] [PMC free article] [PubMed] [Google Scholar]
- 56.Scheres SH. A Bayesian view on cryo-EM structure determination. J Mol Biol. 2012;415:406–18. doi: 10.1016/j.jmb.2011.11.010. [DOI] [PMC free article] [PubMed] [Google Scholar]
- 57.Bai XC, Rajendra E, Yang G, Shi Y, Scheres SH. Sampling the conformational space of the catalytic subunit of human gamma-secretase. Elife. 2015;4 doi: 10.7554/eLife.11182. [DOI] [PMC free article] [PubMed] [Google Scholar]
- 58.Kucukelbir A, Sigworth FJ, Tagare HD. Quantifying the local resolution of cryo-EM density maps. Nat Methods. 2014;11:63–5. doi: 10.1038/nmeth.2727. [DOI] [PMC free article] [PubMed] [Google Scholar]
- 59.Lyumkis D, Brilot AF, Theobald DL, Grigorieff N. Likelihood-based classification of cryo-EM images using FREALIGN. J Struct Biol. 2013;183:377–88. doi: 10.1016/j.jsb.2013.07.005. [DOI] [PMC free article] [PubMed] [Google Scholar]
- 60.Hohl M, Briand C, Grutter MG, Seeger MA. Crystal structure of a heterodimeric ABC transporter in its inward-facing conformation. Nat Struct Mol Biol. 2012;19:395–402. doi: 10.1038/nsmb.2267. [DOI] [PubMed] [Google Scholar]
- 61.Guex N, Peitsch MC, Schwede T. Automated comparative protein structure modeling with SWISS-MODEL and Swiss-PdbViewer: a historical perspective. Electrophoresis. 2009;30(Suppl 1):S162–73. doi: 10.1002/elps.200900140. [DOI] [PubMed] [Google Scholar]
- 62.Pettersen EF, et al. UCSF Chimera--a visualization system for exploratory research and analysis. J Comput Chem. 2004;25:1605–12. doi: 10.1002/jcc.20084. [DOI] [PubMed] [Google Scholar]
- 63.Emsley P, Lohkamp B, Scott WG, Cowtan K. Features and development of Coot. Acta Crystallogr D Biol Crystallogr. 2010;66:486–501. doi: 10.1107/S0907444910007493. [DOI] [PMC free article] [PubMed] [Google Scholar]
- 64.Adams PD, et al. PHENIX: a comprehensive Python-based system for macromolecular structure solution. Acta Crystallogr D Biol Crystallogr. 2010;66:213–21. doi: 10.1107/S0907444909052925. [DOI] [PMC free article] [PubMed] [Google Scholar]
- 65.van Aalten DM, et al. PRODRG, a program for generating molecular topologies and unique molecular descriptors from coordinates of small molecules. J Comput Aided Mol Des. 1996;10:255–62. doi: 10.1007/BF00355047. [DOI] [PubMed] [Google Scholar]
- 66.Kyte J, Doolittle RF. A simple method for displaying the hydropathic character of a protein. J Mol Biol. 1982;157:105–32. doi: 10.1016/0022-2836(82)90515-0. [DOI] [PubMed] [Google Scholar]
Associated Data
This section collects any data citations, data availability statements, or supplementary materials included in this article.


