Abstract
Catecholamine-induced lipolysis, the first step in generation of energy substrates through hydrolysis of triglycerides (TGs) 1, declines with age 2,3. The defect in mobilization of free fatty acids (FFA) in elderly is accompanied with increased visceral adiposity, lower exercise capacity, failure to maintain core body temperature during cold stress, and reduced ability to survive starvation. While catecholamine signaling in adipocytes is normal in elderly, how lipolysis is impaired in aging remains unknown 2,4. Here we uncover that the adipose tissue macrophages (ATMs) regulate age-related reduction in adipocyte lipolysis by lowering the bioavailability of norepinephrine (NE). Unexpectedly, unbiased whole transcriptome analyses of adipose macrophages revealed that aging upregulates genes controlling catecholamine degradation in an NLRP3 inflammasome-dependent manner. Deletion of NLRP3 in aging restored catecholamine-induced lipolysis through downregulation of growth differentiation factor-3 (GDF3) and monoamine oxidase-a (MAOA) that is known to degrade NE. Consistent with this, deletion of GDF3 in inflammasome-activated macrophages improved lipolysis by decreasing MAOA and caspase-1. Furthermore, inhibition of MAOA reversed age-related reduction in adipose tissue NE concentration and restored lipolysis with increased levels of key lipolytic enzymes, adipose triglyceride lipase (ATGL) and hormone sensitive lipase (HSL). Our study reveals that targeting neuro-innate signaling between sympathetic nervous system and macrophages may offer new approaches to mitigate chronic inflammation-induced metabolic impairment and functional decline.
Main Text
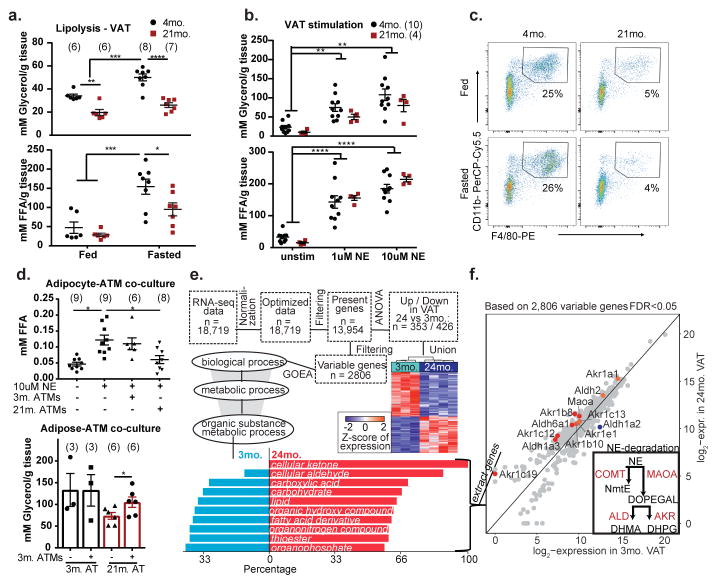
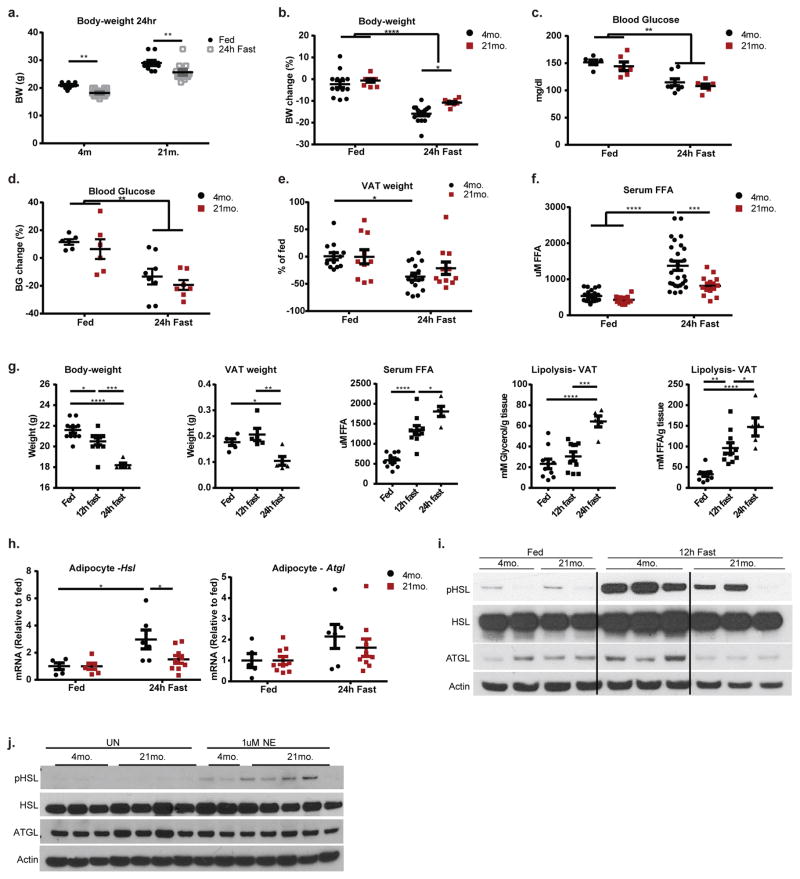
High levels of inflammatory cytokines released during acute inflammation increase lipolysis to support immune response5, however, paradoxically, chronic metabolic inflammation reduces catecholamine-induced lipolysis6. To address the mechanism of chronic age-related inflammation and lipolysis, we fasted young and aged mice, which increases sympathetic nerve (SN)-derived catecholamines. Fasting in young mice increased lipolysis, while aged animals displayed reduced serum FFA, without significant changes in body weight and blood glucose (Extended Data 1a–g). Consistent with prior studies 2,7, compared to young, fasting-induced glycerol and FFA release in VAT was significantly reduced in aged mice (Fig. 1a). Furthermore, adipocytes from aged fasted mice failed to induce Hsl and Atgl expression (Extended Data 1h, i), which together control 90% of TG hydrolysis in adipose tissue 8. Interestingly, stimulation of VAT from young and aged mice with NE caused similar induction of Hsl, Atgl and lipolysis (Extended data 1j and Fig. 1b), suggesting that when sufficient amounts of NE are present, aged VAT explants have normal catecholamine signaling to induce lipolysis.
Figure 1. Adipose tissue macrophages drive lipolysis resistance during aging.
a,b, Glycerol (top) and FFA (bottom) release from VAT of 4- and 21- month WT mice that were a, fed or fasted for 24 hours (Exact Ns (biological replicates) are listed in the figure; Tukey’s Test; P value **<0.01, ***<0.001, ****<0.0001 or b, stimulated with 1 or 10uM of NE (Exact Ns (biological replicates) are listed in the figure; Tukey’s Test; P value **<0.01, ***<0.001, ****<0.0001). c, Representative dot plots of F4/80+ CD11b+ ATMs gated through CD45+ live cells (Values represent means combined from 2 independent experiments). d, (Top) FFAs released from in vitro-derived adipocytes from 3-month old mice after stimulation with NE ± ATMs isolated from 3- or 24-month mice. (Exact Ns (biological replicates); Tukey’s Test; P value *<0.05) (Bottom) Glycerol released from VAT of fasted 3- or 21- month mice that were co-cultured with ATMs from 3-month mice. (Exact Ns (biological replicates); Student’s T-Test; P value *<0.05). e, Workflow of RNA-Seq data analysis of 3- and 24-month ATMs with heatmap of differentially expressed genes. Barplot displays (in %) 2,806 variable genes, which are part of the corresponding GO term, and have higher expression in 24-month or 3-month ATMs (bottom). f, Scatterplot of catecholamine degradation enzymes, comparing the log2-expression values of 3- and 24-month in ATMs. (Inset) Schematic depicting NE degradation by enzymes. Graphs show mean±s.e.m. Exact Ns (biological replicates) are listed within the figure (a, b, d), and listed in table 1 for pooled values (c, e, f).
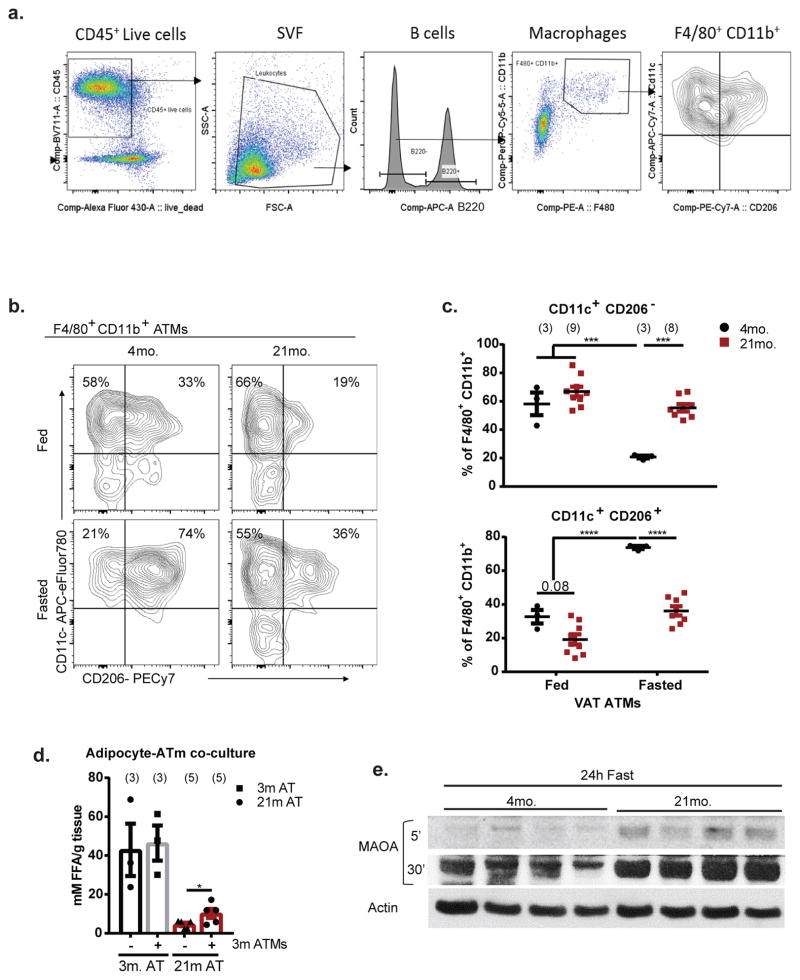
Macrophages drive inflammation and influence lipid homeostasis 9,10, we therefore investigated if ATMs control fasting-induced lipolysis defect in aging. Surprisingly, unlike obesity, where macrophage numbers increase in VAT 11–13, aged mice had reduced frequency of F4/80+ CD11b+ AT macrophages (ATMs) (Fig. 1c, Extended Data 2a). Compared to fed, the young fasted mice show greater reduction in CD11c+ CD206− ATMs with corresponding increases in CD11c+CD206+ ATMs, a response that is impaired in aged mice (Extended Data Fig. 2b, c), suggesting altered functionality of aged ATMs.
To determine the functional role of aged macrophages in lipolysis, adipocytes generated from progenitor cells (Lin−CD29+CD34+Sca1+) of young mice were stimulated with NE and co-cultured with F4/80+CD11b+ macrophages sorted from VAT of aged mice. We found that only the aged ATMs inhibited FFA release from NE-stimulated young adipocytes (Fig. 1d, top panel). Conversely, addition of ATMs sorted from young mice partially restored lipolysis in VAT explants obtained from fasted aged mice (Fig. 1d, lower panel and Extended Data 2d), suggesting that aging induces specific defects in ATMs to inhibit NE-induced lipolysis in VAT.
To determine how aged ATMs impair adipocyte lipolysis, we performed whole transcriptome gene expression analysis (Fig. 1e workflow). Aged ATMs showed an enrichment of metabolic Gene Ontology (GO) terms (Fig. 1e), including all classes of carbon-metabolism (GO term: “organic substance metabolic process”) (Fig. 1e barplot). Interestingly, aged ATMs expressed higher percentage of genes that regulate the metabolism of catecholamines (Fig. 1e, f). Notably, monoamine oxidase A (Maoa) and downstream enzymes, aldehyde dehydrogenases (Alds) and Aldo-keto reductases (Akrs) are known to convert the primary amines such as catecholamines into aldehydes, ammonia, and hydrogen peroxide (Fig. 1f inset) 14. In agreement, aging upregulates MAOA protein (Extended Data 2e) 15. Collectively, these data suggested a link between reduced adipocyte lipolysis and elevated catecholamine catabolism machinery in ATMs during aging.
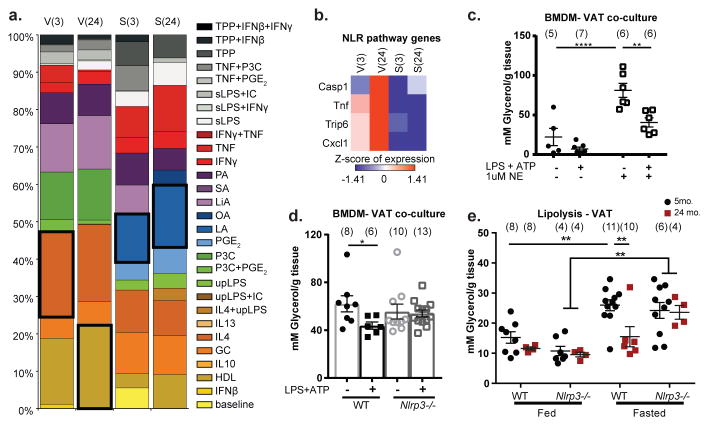
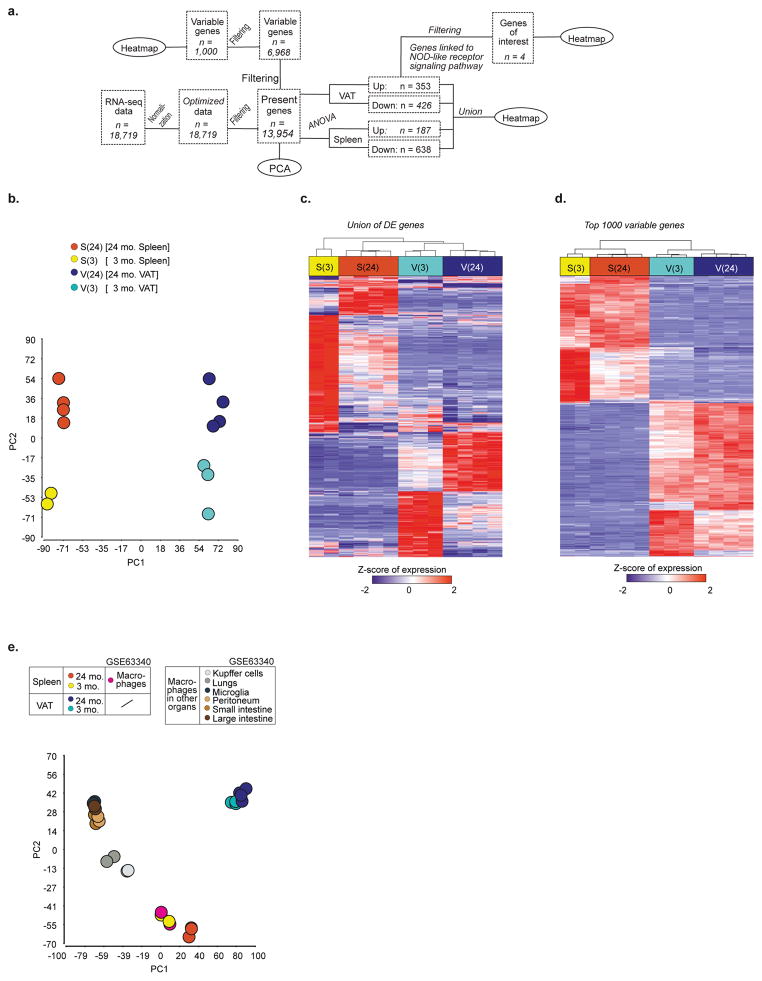
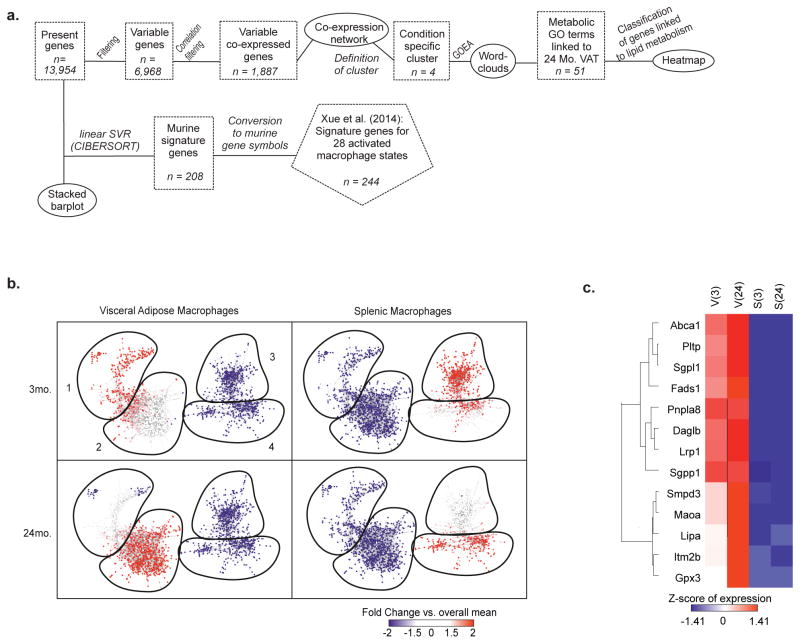
We next investigated the nature and specificity of metabolic defects in aged ATMs. Principal component analysis (PCA) revealed tissue and aging-induced clustering of VAT and splenic macrophages (SMs) (Extended Data 3a–d) with distinct transcriptional signatures (Extended Data 3c, d). Moreover, ATMs failed to show clustering with macrophages from liver, lung, brain, peritoneum or intestines (Extended Data. 3e), consistent with specialized function of ATMs16. Furthermore, co-expression analysis identified 1,887 highly connected genes with age, which were visualized as a network (Extended Data 4a, b). Again, tissue differences comprise the largest functional separation (left versus right panels); and gene filtering identified specific enrichment of lipid and metabolic genes in ATMs and not in SMs (Extended Data 4c). Linear support vector regression (SVR) to map multi-dimensional model of in vitro macrophages activated by 29 different stimuli, failed to show enrichment within aged VAT and SM transcriptome (Fig. 2a). These results demonstrated that aged SMs and ATMs lack “M1 or M2” polarization state and share similarities to a multitude of macrophage activation states.
Figure 2. Nlrp3 inflammasome activation is required for lipolysis resistance.
a, Relative fractions of 29 different human in vitro-activated macrophage gene signatures in the 3- and 24-month macrophages from VAT and spleen. Black box indicates the largest enrichment signature for that condition. b, Heatmaps of differentially expressed genes associated with NOD-like receptor signaling pathway in 3- and 24-month ATMs (V(3), V(24)) and splenic macrophages (S(3), S(24)). Expression values were z-transformed and scaled as indicated. c, Glycerol release from 3-month VAT explants co-cultured with NLRP3-activated BMDMs (Exact Ns (biological replicates) are listed in the figure; Student’s T-Test; P value *<0.05). d, Glycerol release from 3-month VAT explants co-cultured with WT (filled) or Nlrp3−/− (open) BMDMs that were left untreated (circles) or treated (squares) with LPS and ATP to activate the inflammasome (Exact Ns (biological replicates) are listed in the figure; Tukey’s Test; P value **<0.01, ****<0.0001). All conditions received 1uM NE to stimulate lipolysis. e, Glycerol release from VAT of WT or Nlrp3−/− mice at 5- or 24-months after 24hour feeding or fasting. (Exact Ns (biological replicates) are listed in the figure; Tukey’s Test; P value **<0.01). Graphs are presented as mean±SEM. Exact Ns are listed within the figure (c,d,e), and listed in table 1 for pooled values (a,b).
Consistent with previous reports 17,18, RNA sequencing analysis of ATMs also revealed that aging is associated with activation of the Nod-like receptor (NLR) pathway and caspase-1 (Fig. 2b). To determine if NLRP3 inflammasome activation directly influences lipolysis, the bone marrow derived macrophages (BMDMs) were stimulated with LPS+ATP and subsequently washed and co-cultured with young VAT explants stimulated by NE. Interestingly, inflammasome-activated macrophages significantly inhibited glycerol release from VAT (Fig. 2c) in an Nlrp3-dependent manner (Fig. 2d). Importantly, 2-year-old Nlrp3−/− mice were protected from impaired fasting-induced lipolysis seen in aging (Fig. 2e). Collectively, these data demonstrate that NLRP3 inflammasome controls reduced catecholamine driven lipolysis in aging.
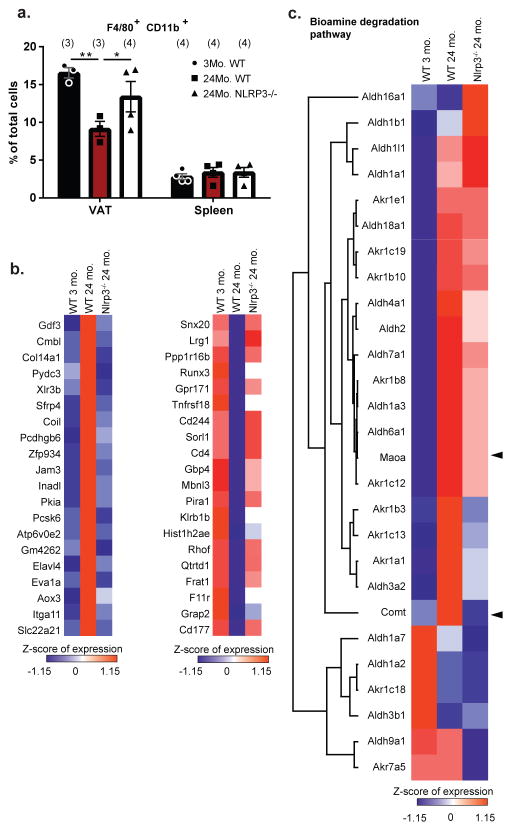
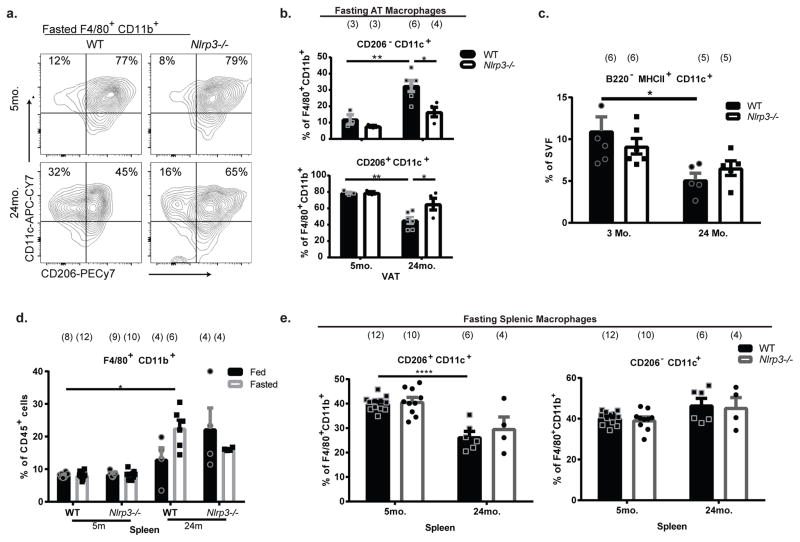
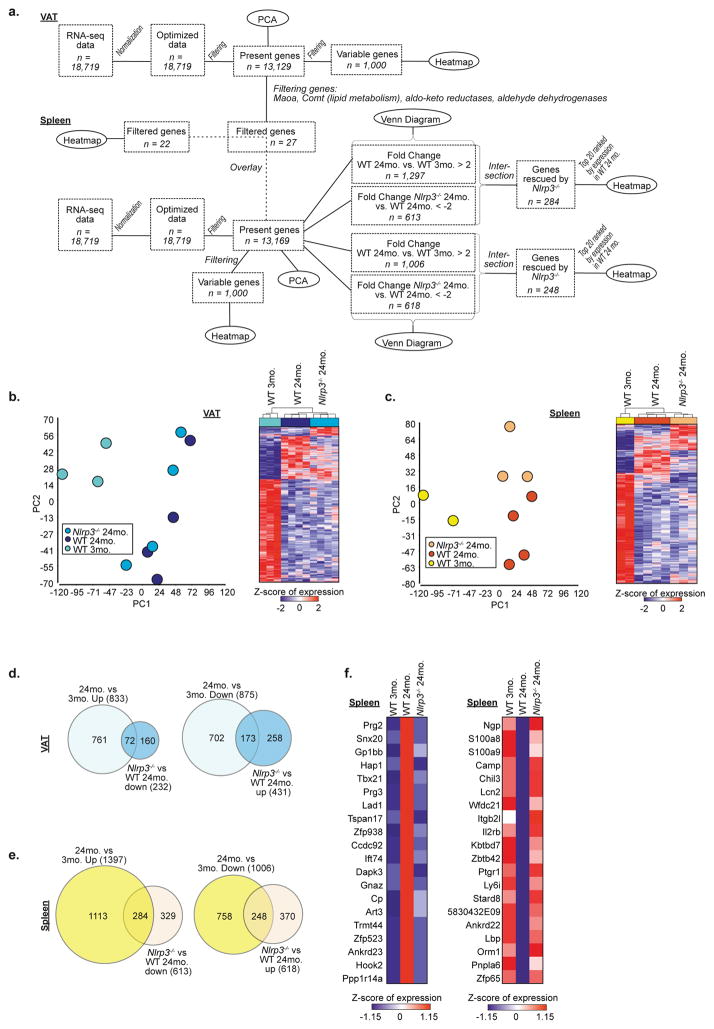
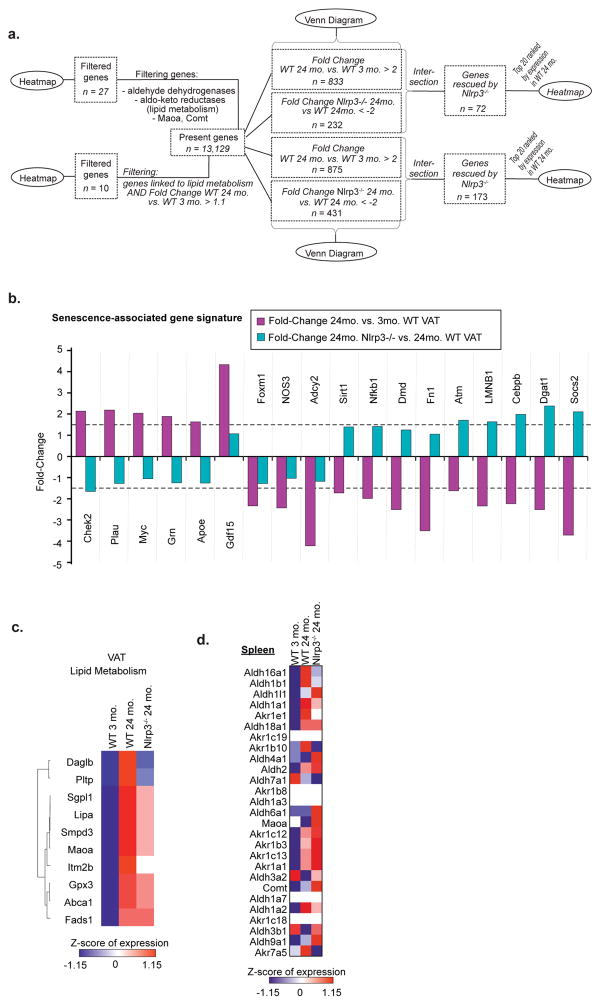
We next studied how NLRP3 inflammasome activation in macrophages controls fasting-induced lipolysis in aging. Interestingly, the ablation of Nlrp3 protected against the age-related loss of F4/80+ CD11b+ ATMs in VAT (Fig. 3a) and alteration of CD206 and CD11c expression on ATMs (Extended Data 5a, b) without affecting VAT dendritic cells or splenic macrophages (Extended Data 5c–e). RNA sequencing revealed that select set of genes regulated by age in ATMs (Extended Data 6a–c) and SMs, were dependent on Nlrp3 (Extended Data 6d,e,f) including an enrichment of genes implicated in cell-senescence in aged ATMs that were reciprocally regulated by Nlrp3 (Extended Data 7a, b) 19. Given that ATMs are maintained by proliferation 20, reduction in macrophage frequency in aged VAT may reflect an exhausted senescent-like ATM profile driven by sustained NLRP3 inflammasome activation. The most highly upregulated gene with age, growth differentiation factor-3 (Gdf3), that controls adiposity 21,22 was downregulated upon ablation of Nlrp3 to the levels on par in young mice (Fig. 3b). Nlrp3 deficiency in aging also restored lipid metabolism genes (Extended Data 7c) and catecholamine-catabolism genes such as, Maoa, Comt and Ald and Akr family members (Fig. 3c). Again, compared to aged ATMs, the SMs exhibited distinct transcriptional signatures and catecholamine catabolism gene regulation by age and Nlrp3 (Extended Data 6c,e,f and 7d). These results suggest that activation of NLRP3 inflammasome in aged ATMs upregulates biogenic-amine degradation machinery.
Figure 3. Nlrp3 inflammasome regulates catecholamine degradation genes in aged ATMs.
a, Percentage of macrophages from VAT or spleen of WT or Nlrp3−/− mice, expressed as mean±SEM. (Tukey’s Test; P value *<0.05, **<0.005) b, Heatmaps showing the expression patterns of the top 20 genes upregulated (left) or downregulated (right) with age and rescued by Nlrp3-deficiency in ATMs. c, Heatmap of catecholamine degradation enzymes, Maoa, Comt and genes belonging to the aldo-keto reductases or aldehyde dehydrogenases gene families in ATMs. Genes were ranked according to decreasing expression in 24-month WT ATMs. Arrowheads indicate NE-catabolizing genes: Maoa and Comt. Expression values were z-transformed and scaled. Exact Ns (biological replicates) are listed within the figure and further described in table 1; data are from one independent experiment.
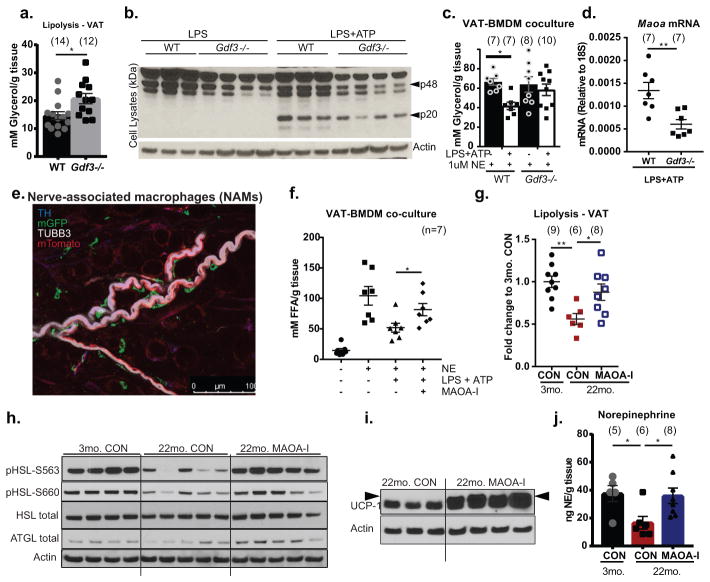
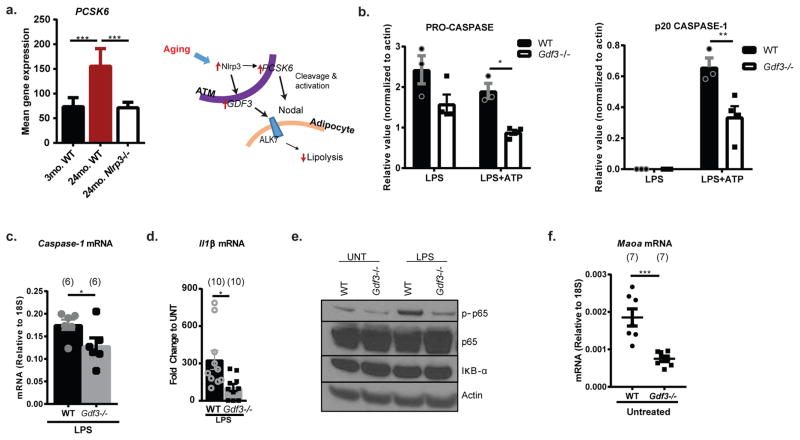
Based on our finding that Gdf3 is top regulated gene by age and Nlrp3 (Fig. 3b), we next investigated the mechanism of Nlrp3 inflammasome-induced impaired lipolysis. GDF3, a TGFβ family member, is secreted by macrophages and ligates multiple receptors, including nodal or activin-like kinase-7 (ALK7) on adipocytes to inhibit catecholamine-induced lipolysis23,24. In agreement, VAT from Gdf3−/− mice show increased glycerol release (Fig. 4a), suggesting that high levels of GDF3 inhibits lipolysis. Interestingly, age-induced increase of Pcsk6, which cleaves and activates nodal/ALK7 to promote GDF3 signaling 22, is also regulated by Nlrp3 (Extended Data 8a). Furthermore, ablation of Gdf3 inhibited the NLRP3 inflammasome activation in BMDMs (Fig. 4b, Extended Data 8b, c) by downregulating the transcriptional priming ‘signal-1’, as evidenced by reduced caspase-1 and Il1b gene expression (Extended Data 8c, d), and decreased NFkB activation (Extended Data 8e). In line with these data, Gdf3-deficient BMDMs failed to impair the inflammasome-induced VAT lipolysis (from WT explants) (Fig. 4c). Moreover, ablation of Gdf3 inhibited the inflammasome-induced Maoa expression (Fig. 4d and Extended Data 8f), implicating NLRP3 inflammasome activation-induced Gdf3 in upregulation of macrophage catecholamine-degradation machinery and resultant downstream reduction in VAT lipolysis.
Figure 4. GDF3 dependent increased Maoa expression impairs lipolysis in aging.
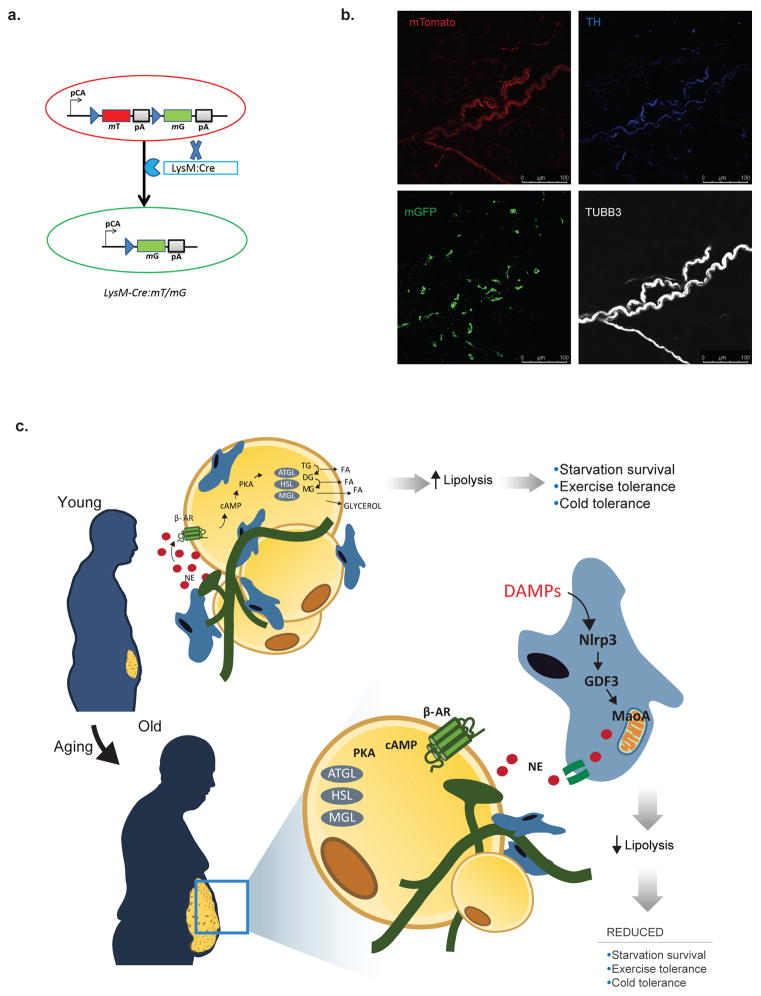
a, Glycerol release from unstimulated VAT from WT or Gdf3−/− mice at 3-months (Exact Ns (biological replicates) are listed in the figure; Student’s T-Test; P value *<0.05). b, Immunoblot showing caspase-1 expression in WT or Gdf3−/− BMDMs treated with LPS or LPS+ATP, with actin as a loading control. Representative of one independent experiment. c, Glycerol release from 3-month old VAT explants exposed to NE and co-cultured with WT (black) or Gdf3−/− (white) BMDMs treated to induce NLRP3 activation (Exact Ns (biological replicates) are listed in the figure; Student’s T-Test; P value *<0.05). d, RT-PCR of Maoa gene in NLRP3 activated- WT or Gdf3−/− BMDMs (Exact Ns (biological replicates) are listed in the figure; Student’s T-Test; P value **<0.01). e, Nerve-associated macrophages visualized by whole-mount confocal microscopy of VAT. LysM-Cre: mT/mG reporter mouse plus antibody staining visualizes all cells (mTomato-red), myeloid cells (mGFP-green), TH- (blue) and TUBB3- (white) expressing nerves. Representative of 6 independent experiments. f, FFA release from 3-month WT VAT co-cultured with BMDMs that were left untreated or pre-activated with LPS+ATP with or without 10uM clorgyline (MAOA-inhibitor). NE (1uM) was used to stimulate lipolysis, (Exact Ns (biological replicates) are listed in the figure; Student’s T-Test; P value *<0.05). g, Glycerol (mM/g tissue) release, expressed as fold change to 3-month VAT(Exact Ns (biological replicates) are listed in the figure; Tukey’s Test; P value *<0.05, **<0.01), h, western blot of pHSL-S563, pHSL-S660, HSL, ATGL (representative of two independent experiments) i, or UCP1 (representative of one experiment) and j, HPLC quantification of NE (ng/g VAT) from 3-or 22-month old mice given i.p. injection of 2mg/kg clorgyline and fasted for 24h (Exact Ns (biological replicates) are listed in the figure; Tukey’s Test; P value *<0.05). Each lane or symbol represents an individual animal; graphs are presented as mean±SEM. Exact Ns are listed within the figure (a,c,d,f,g,j).
Given a critical role of MAOA in NE degradation 25, we next investigated whether ATMs have direct access to catecholamines produced by the SN. VAT of transgenic mice wherein the myeloid-lineage cells are indelibly marked by membrane GFP (Extended Data 9a,b), revealed a population of nerve-associated macrophages (NAMs) that are in close association with the tyrosine hydroxylase (TH)-expressing SN fibers (Fig. 4e). Indeed prior studies suggest that macrophages can express MAOA and also uptake NE 26,27. Thus, the interaction of macrophages with SN, and the gene expression of catecholamine-catabolic machinery in aged mice, support a model in which NAMs have direct access to catecholamines produced by SN to regulate adipocyte access to NE.
To understand the relevance of increased MAOA in macrophages, we treated BMDMs with clorgyline, an irreversible inhibitor of MAOA activity that is clinically used to elevate catecholamine levels and to treat depression 28. Inhibition of MAOA in inflammasome-activated macrophages by clorgyline restored NE-induced lipolysis (Fig. 4f). To determine the therapeutic potential of MAOA-inhibitors, aged mice were treated with clorygyline (2mg/kg BW) and fasted for 24hours. In vivo, the clorgyline treatment of aged mice restored fasting-induced lipolysis (Fig. 4g) and rescued age-related reduction in the phosphorylation of HSL, expression of ATGL (Fig. 4h), increased the UCP-1 protein (Fig. 4i) and restored NE levels in VAT of old mice (Fig. 4j). These data are consistent with the hypothesis that in aging, increased NE degradation drives reduced lipolysis and not catecholamine-signaling resistance. (Extended Data 9c).
Collectively, our findings offer new insights into the role of age-related chronic inflammation driven by NLRP3 inflammasome as a driver of macrophage-SNS interactions that control catecholamine catabolism to regulate lipolysis. How NAMs sense ‘stranger or danger’ signals and convey information to SNS to regulate behavior, metabolism, inflammation and defense against neurotropic viruses warrants further study. Future studies to regulate macrophage activity and catecholamine bioavailability in tissues may reveal new approaches to improve healthspan through mobilization of ectopic lipid.
Methods
Animal Care
All mice were housed in specific pathogen-free facilities in ventilated cage racks that deliver HEPA-filtered air to each cage with free access to sterile water through a Hydropac system at Yale School of Medicine. Sentinel mice in our animal rooms were negative for currently tested standard murine pathogens (Ectromelia, EDIM, LCMV, Mycoplasma pulmonis, MHV, MNV, MPV, MVM, PVM, REO3, TMEV and Sendai virus) at various times while the studies were performed (Research Animal Diagnostic Laboratory, Columbia, MO). C57Bl6/J (wild-type) mice were bred from our colony, purchased from Jackson Laboratories or received from the National Institute of Aging Rodent colony. Nlrp3−/− have been previously described and were bred in our facility, along with their wild-type controls 29. LysM-Cre and mT/mG mice were bred in our facility. Gdf3−/− mice have been described previously 21 and were bred in our colony. All knockout mice were compared to littermate controls raised in the same facility. All experiments and animal use were conducted in compliance with the National Institute of Health Guide for the Care and Use of Laboratory Animals and were approved by the Institutional Animal Care and Use Committee at Yale University.
Experimental design and statistical analysis
Blinding of investigators was not possible during experiments. Control and experimental groups were randomly assigned by cage. All experiments contained littermates and non-littermates, which were both randomly assigned to control and experimental group. Young control mice were raised or obtained from the same facility as the aged mice. An ‘N’ for each experiment was used based on preliminary and published experiments, which identified Ns needed for statistical analysis. Statistical significance was calculated by a two-tailed Student’s T test or ANOVA using a post-hoc test to correct for multiple hypotheses. *<0.05; **p<0.005; ***<0.001; ****<0.0001. GraphPad Prism was used to define statistical outliers, which were then excluded from data analysis. A confidence interval of 95% was used for all statistical tests. All data was assumed to be normally distributed, unless the standard deviation was identified as significantly different between groups. In this case a non-parametric test was used. All statistical tests were performed using GraphPad Prism v7 for Windows (GraphPad Software). Data are expressed as mean±SEM. Biological replicates and the number of independent experiment repetition are described in the figure legends. All biological replicates and pooled values for experiments requiring AT digestion and SVF analysis are described in the next chapter. Biological variation was maintained during pooling, therefore all numeric data and statistical analyses are derived from biological replicates.
Numbers of mice and biological replicates used in mouse experiments requiring adipose pooling
Biological variation was maintained when pooling tissue; only tissue needed to reach desired tissue amount (eg. 0.5g, typically from 2–3 mice to generate one biological replicate) were pooled for analyses. The descriptions below list the figure and letter along with the individual mouse number and biological replicates that were used to generate the data.
Figure 1c; ED2bc, contains (13) four-month fed WT; (10) twenty-one month fed WT; (16) four-month fasted WT and (11) twenty-one month fasted WT individual mice. These samples were pooled to make (n=3, 4m fed WT), (n=9, 21m fed WT), (n=3, 4m fasted WT) and (n=8, 21m fasted WT) independent samples.
Figure 1e,f; ED3a–e; ED4a–c contains (15) three-month fed WT and (11) twenty-four month fed WT individual mice. These samples were pooled to make (n=3) and (n=4) independent samples.
Figure 3a–c; ED6a–f; ED7a–d contains (15) three-month fed WT; (11) twenty-four month fed WT; and (8) twenty-four month fed Nlrp3−/− individual mice. These samples were pooled to make (n=3), (n=4) and (n=4) independent samples.
Figure ED5a–c contains (8) 5m WT fed; (9) 5m Nlrp3−/− fed; (5) 24m WT fed; (4) 24m Nlrp3−/− fed; (12) 5m WT fast; (10) 5m Nlrp3−/− fast; (6) 24m WT fast; and (4) 24m Nlrp3−/− fast individual mice. These samples were pooled to make (n=3), (n=4), (n=5), (n=4), (n=3), (n=3), (n=6) and (n=4) independent samples.
Adipose digestion and stromavascular staining
Visceral adipose was harvested at sacrifice and weighed. Tissue was enzymatically digested in 0.1% collagenase I (Worthington Biochemicals) in Hanks Buffered Salt Solution (Life Technologies, Inc.) for 45min at 37°. Tissue from control and experimental groups was digested and stained on the same day to eliminate minor procedure differences. The stromavascular fraction (SVF) was pelleted by centrifugation at 1500rpm for 10min, then washed and filtered. Red blood cells are lysed using ACK lysis buffer. Cells were resuspended in 1ml for counting prior to staining. For staining, the SVF was incubated with FcBlock, surface antibodies for 30min on ice, in the dark, then washed and stained with Fixable Viability Dye (eBioscience) and intracellular antibodies using cytofix (BD Bioscience). Analysis was performed on a BD LSRII and using FlowJo vX. For sorting ATMs: CD3− B220− F4/80+ CD11b+ cells were sorted on a BD FACS Aria into RPMI + 20% FBS. Cells were pelleted and resuspended in trizol for RNA isolation or media for co-culture with adipocytes or whole VAT.
Lipolysis assay
For ex vivo lipolysis assay, AT was harvested and 15mg was cultured in 100ul lipolysis buffer (KRBS buffer + 0.1%glucose + 3.5% fatty acid free BSA; Sigma) in a 96-well plate for 2 hours at 37degrees at 450RPMs. For adipose co-culture with young ATMs, AT was collected from aged fasted mice and aliquoted into a 96-well plate. Sorted young F4/80+CD11b+ cells were spiked in and glycerol or FFA were measured after overnight culture. For adipocyte co-culture with old ATMs, sorted old F4/80+CD11b+ cells (from N=8 aged mice), were spiked into adipocytes at 10,000 cells/well. 10uM NE was added after one hour to induce lipolysis, glycerol or FFA were measured after 1 hour stimulation. Glycerol assay (Sigma) or NEFA assay (Wako Diagnostics) were used to measure lipolysis as according to manufactures instructions.
Adipocyte generation
Adipocyte precursors were harvested from subcutaneous adipose tissue as previously described 30,31. Briefly, fluorescence activated cell sorting-isolated precursors were cultured in DMEM (ATCC), 10% FBS (Gibco), and 1% penicillin/streptomycin (Sigma-Aldrich). Once at confluence, cells were maintained without changing the media for 2 days. Cells were then differentiated for 7–9 days in adipogenic differentiation media (growth media supplemented with 0.1 ug/mL insulin (Sigma-Aldrich)) that was changed every 2 days.
Generation of BMDMs and co-culture design
All steps were performed using sterile techniques. Femurs were collected in RPMI (Life Technologies, Inc.). Using a needle and syringe, marrow was flushed into RPMI containing 10% FBS (Omega Scientific, Inc.) and 5% antibacterial/antimycotics (Life Technologies, Inc.). Red blood cells were lysed using ACK lyses buffer (Quality Biological) and lysis was neutralized with complete RPMI. Bone marrow cells were differentiated into macrophages using MCSF (10ng/ml; R&D) and L929 conditioned media. Non-adherent cells were collected on day 7, counted and replated. BMDMs were treated on day 8. Cells were primed by four hour treatment with ultrapure LPS (1ug/ml;Sigma) alone; inflammasome stimulation was provided by treatment with ATP (5mM; 1hr). For co-culture with adipose, BMDMs were treated as described, media removed, cells washed and weighed VAT added to culture. VAT was stimulated with 1uM NE after 1 hour, and glycerol or FFA was measured at assay end.
Maoa-Inhibition
For cell culture experiments, BMDMs were treated with clorgyline (10uM) 12 hours prior to LPS stimulation. For in vivo treatment, mice received an intra-peritoneal injection of clorgyline (2mg/kg) or vehicle control at 12 hour prior to fast start and at the start of the fast. Fasting lasted 24 hours.
Western blot
Immunoblots were performed as described previously18, 19. Samples were left on ice for one hour with vortexing every 10 min to disrupt membranes. Samples were centrifuged at 14,000g for 15 minutes, supernatant was collected and protein concentration was quantified using the DC protein assay (Bio-Rad).
Norepinephrine Quantification
NE concentration in VAT was measured using reverse-phase high performance liquid chromatography (HPLC)32. Briefly, each frozen VAT sample was sonicated in acid, then centrifuged, with the supernatant adsorbed on an alumina column at pH 8.6. After washing the column, catechols were eluted in acid, then separated by HPLC employing electrochemical detection; quantification was achieved by reference to internal and external standards.
Whole Mount Staining
Staining was performed similar to those previously published 33. Briefly, AT was harvested, fixed in 1% PFA and blocked with 5% BSA. Permeabilization was done using 0.1% triton-x 100 in 5% BSA. The AT was then stained in primary antibodies over 1–2 days and secondary antibody for 2.5 hours in goat blocking serum. Samples were visualized by confocal microscopy using Leica SP8 and analyzed using Leica Application Suite AF.
Antibodies
For flow cytometry analysis, the following antibodies were used: Fixable Viability Dye Aqua; CD45-BV711 (30F11: cat#563709) (BDBioscience); F4/80-eFlour450; F4/80-PE (BM8; cat#48-4801-82 & 12-4801-82); CD11b-PerCPCy5.5 (M1/70; cat#45-0112-82); CD11c-APC-eFluor780 (N418; cat#47-0114-82); B220-APC (RA3-6B2; cat#17-0452-82); MHCII-Alexa Fluor 700 (M5/114.15.2; cat#56-5321-82) (eBioscience) and CD3-BV605 (17A2; cat#100237); CD206-PECy7 (C068C2; cat#141709) (Biolegend). For western blot analysis, the following antibodies were used: pHSL (Ser660; cat#4126), pHSL (Ser563; cat#4139), HSL (cat#4107), ATGL (cat#2439), Actin (cat#4967), UCP-1 (cat#14670), pNFkB (cat#3033), NFkB (cat#8242), (Cell Signaling), Caspase-1 (Genentech). For whole mount staining: F4/80-PE (BM8; 12-4801-82; eBioscience), TUBB3-AlexaFluor488 (TUJ1; cat#801203; Biolegend), Tyrosine hydroxylase (cat#2792; Cell Signaling), B220-APC (RA3-6B2; cat#17-0452-82; eBioscience), anti-rabbit IgG-APC (Jackson; cat# 111-136-144), anti-rabbit IgG-AlexaFluor 488 (cat#A11008; Life Technologies).
RNA extraction and gene expression analysis
RNA extraction and purification was performed using RNeasy kits (Qiagen) according to manufacturer’s instructions. For qPCR, synthesis of cDNA and qPCR was performed as previously described 34. Primer sequences used for qPCR: Maoa (F: GTATGGAAGGGTGATTCGGCA; R: ACTGCACCTTCCATGTAGCC), 18S (F: AACCCGTTGAACCCCATT; R: CCATCCAATCGGTAGTAGCG), Caspase-1 (F: GGACCCTCAAGTTTTGCCCT; R: AGACGTGTACGAGTGGTTGT), Il1β (F: GGTCAAAGGTTTGGAAGCAG; R: TGTGAAATGCCACCTTTTGA), Hsl (F: AGGGAGGGCCTCAGCG; R: TTGGCTGGTGTCTCTGTGTC), Atgl (F: GAGGAATGGCCTACTGAACCA; R: GGCTGCAATTGATCCTCCTCT),
RNA Sequencing
Quality Control
Total RNA quality is determined by estimating the A260/A280 and A260/A230 ratios by nanodrop. RNA integrity is determined by running an Agilent Bioanalyzer gel, which measures the ratio of the ribosomal peaks.
Library Prep
mRNA is purified from approximately 500ng of total RNA with oligo-dT beads and sheared by incubation at 94C. Following first-strand synthesis with random primers, second strand synthesis is performed with dUTP for generating strand-specific sequencing libraries. The cDNA library is then end-repaired, and A-tailed, adapters are ligated and second-strand digestion is performed by Uricil-DNA-Glycosylase. Indexed libraries that meet appropriate cut-offs for both are quantified by qRT-PCR using a commercially available kit (KAPA Biosystems). Insert size distribution was determined with the LabChip GX or Agilent Bioanalyzer. Samples with a yield of ≥0.5 ng/ul are used for sequencing.
Flow Cell Preparation and Sequencing
Sample concentrations are normalized to 10 nM and loaded onto Illumina High-output flow cells at a concentration that yields 150–250 million passing filter clusters per lane. Samples are sequenced using 75 bp single end sequencing on an Illumina HiSeq 2000 according to Illumina protocols. Each sample has a 6bp index that is incorporated during the library prep. The index sequence is read using a different sequencing primer than the 75bp sequencing read. The index read happens immediately after the 75bp read. Data generated during sequencing runs are simultaneously transferred to the YCGA high-performance computing cluster. A positive control (prepared bacteriophage Phi X library) provided by Illumina is spiked into every lane at a concentration of 0.3% to monitor sequencing quality in real time.
Data Analysis and Storage
Signal intensities are converted to individual base calls during a run using the system’s Real Time Analysis (RTA) software. Sample de-multiplexing was performed using Illumina’s CASAVA 1.8.2 software suite. The data are returned to the user if the sample error rate is less than 2% and the distribution of reads per sample in a lane is within reasonable tolerance.
Bioinformatics
Alignment and mRNA quantification
Raw fastq-files were aligned against the murine genome version mm10 using TopHat version v2.0.13 35 with all default options. BAM files containing the alignment results were sorted according to the mapping position and then imported into Partek® Genomics Suite® software, version 6.6 Copyright©; 2016 (PGS). mRNA quantification was performed against the mm10-RefSeq Transcripts database version 2015-05-07 to obtain read counts for each individual RefSeq gene, ending up in a total of 18,719 genes.
Data set composition and normalization
Three data sets containing different combinations of samples were assembled. Dataset I was composed of macrophages from 3- and 24-months old wild type (WT) mice, isolated from whether visceral adipose tissue (VAT) or from spleen. Dataset II contained macrophages from 3- and 24-months old WT mice as well as from 24-months old Nlrp3−/− mice, isolated from VAT. Dataset III included the same combination of macrophages as dataset II, but isolated from spleen. The read count table of each dataset was normalized separately using DESeq2 36 and then imported back into PGS.
Data preprocessing
Each dataset was filtered down to keep expressed genes only. The filtering was achieved by excluding genes, which did not have a mean normalized read count of 20 in at least one of the investigated groups for the corresponding dataset. This resulted in 13,954 (I), 13,129 (II) and 13,169 (III) present genes. Furthermore, all normalized count values smaller than 1 were set to 1 to avoid spurious Fold-Changes later on.
Multiple test corrections
Whenever stated in relation to differential expression analyses, FDR-adjusted p-values were obtained using the Benjamini and Hochberg procedure to account for multiple testing 37.
Global characterization of datasets
The overall structure of each dataset was investigated and visualized using principal component analysis (PCA) and a heatmap of the top 1,000 genes with the highest variance within the dataset. In addition, a heatmap of the union of differentially expressed genes (between 24-month and 3-month old macrophages in VAT and spleen, respectively, according to a Fold-Change < -1.5 or > 1.5 and an FDR-adjusted p-value < 0.05) was generated for dataset I to further demonstrate the age and tissue induced differences.
Functional characterization of changes induced by age in VAT macrophages
To evaluate the overall differences between 24-months and 3-months old VAT macrophages, differentially expressed genes were determined requiring a Fold-Change larger than 1.5 or lower than -1.5 and an FDR-adjusted p-value lower than 0.05. The resulting 779 genes were displayed in the form of a heatmap. To further characterize those differences on the functional level, Gene Ontology 38,39 Enrichment Analysis (GOEA) was performed within PGS based on genes with high variance (2,806) between both conditions according to a p-value < 0.05. In the Gene Ontology branch of biological processes, the GO term “metabolic process” was the highest enriched child term accordi ng to the normalized enrichment score (NES). Going down this branch, the child term “organic substance metabolic process” appeared to be the highest enriched one. For each child term of this branch, genes were collected, which were part of the corresponding GO term and which were variable across the 3- and 24-months old macrophages (among the 2,806 variable genes). Those genes were split into two groups, dependent on whether their expression was higher in 24-months (red) or 3-months (blue) old macrophages. The child terms were then sorted according to the percentages of genes being higher expressed in 24-month macrophages, and the top ten were visualized in the form of a bar plot. Additionally, a scatterplot for the union of all those genes was created to display the differences between the log2-expression in 3- and 24-months macrophages. In this plot, genes were highlighted being linked to lipid metabolism or belonging to the aldo-keto reductases or aldehyde dehydrogenase gene families.
Relating VAT and spleen macrophages to other tissue-resident macrophages
To put the 3- and 24-months old VAT and spleen macrophages into context to other tissue-resident macrophages, the raw data published by Lavin et al. was downloaded from GEO database (accession number GSE63340), considering macrophages from spleen, lung, small intestine, large intestine and peritoneum, as well as microglia and Kupffer cells 16. The fastq-files were aligned against the murine genome version mm10 using TopHat version v2.0.13 with default options. The aligned BAM files were then imported into PGS together with the BAM files of dataset I. The mRNA quantification was performed against the mm10-RefSeq Transcripts database version 2015-05-07, resulting in 19,764 detected genes. The two datasets were normalized together using DESeq2 and imported back into PGS. Since both datasets contained macrophages isolated from the spleen, the 3-months spleen macrophages and the spleen macrophages from GSE63340 were defined as bridging samples. The two datasets were considered as two different batches and the bridging samples allowed to remove the impact, which was introduced by the two different runs. The batch corrected dataset was then reduced to present genes only (again, at least one of the group means of normalized read counts had to be larger than 20), and the minimal normalized count value was set to 1. The remaining 13,855 genes were displayed within a PCA, showing principal component (PC) 1 versus PC2.
Comparison of VAT and spleen macrophages to human in vitro activated monocyte-derived cells
To link the signatures of VAT and spleen tissue macrophages to signatures derived from in vitro activated macrophages, the list of present genes of dataset I were used as input for CIBERSORT 40. As signature matrix, 29 macrophage subsets including inactivated human macrophages were used 41. Based on linear support vector regression (SVR) using all default options, the relative fractions of the 29 macrophage subsets were determined for the VAT and spleen macrophages. Human and murine symbols were translated based on one-to-one orthologs.
Co-expression network of VAT and spleen macrophages
Using an FDR-adjusted p-value lower than 0.05, 6,968 variable genes (genes of high variance) were determined across the four groups (3-months and 24-months old macrophages isolated from both VAT and spleen) of dataset I. Those genes were imported into BioLayout Express 3D version 3.3 42. Requiring a correlation of at least 0.98 between the expression profiles of two genes, a co-expression network was generated. After excluding smaller network subclusters containing less than 20 genes, two separate networks composed of 1,887 genes in total remained. For each of the four conditions, the Fold-Change of the respective condition compared to the overall mean was mapped onto the networks using Cytoscape version 3.2.0 43. The Fold-Changes were displayed in colors ranging from blue (negative Fold-Change) over white to red (positive Fold-Change). Finally, the networks were divided into four main clusters based on the patterns revealed by the Fold-Change mappings. Clusters 1 to 4 were composed of 334, 818, 406 and 329 genes, respectively.
Functional characterization based on clusters defined by the co-expression network
Based on the genes of the four clusters defined by the co-expression network, GOEA was performed within PGS separately for each cluster. Genes associated with lipid metabolism were identified based on literature search using PubMed. Genes were included in our “lipid metabolism” list, if publications were found that provided association between “gene X” and “lipid”, “fat” or “adipose” and macrophage”.
Age-dependent gene expression differences for members of the NOD-like receptor signaling pathway
Based on genes being significantly upregulated (Fold-Change > 1.5 and FDR-adjusted p-value < 0.05) between 24-months and 3-months old VAT macrophages, Pathway Enrichment Analysis was performed within PGS. Among other KEGG pathways, the “NOD-like receptor signaling pathway” (mmu04621) was significantly enriched in 24-months old VAT macrophages (p-value = 0.0361706). To highlight the expression pattern of all individual members being present in the dataset, the Fold-Changes between 24- and 3-months were mapped onto the gene symbols, ranging from blue (negative Fold-Change) over white (no change) to red (positive Fold-Change) using PGS.
Identification of genes being rescued by Nlrp3−/−
To identify genes having expression patterns, which are similar in 3-month wild type (WT) and 24-month Nlrp3−/− macrophages, but are different in 24-month WT ones, two different types of genes lists were created. On the one hand, genes were identified being upregulated in the 24-month WT compared to the 3-month WT macrophages with a Fold-Change > 2. On the other hand, genes were collected being downregulated in 24-month Nlrp3−/− compared to 24-month WT macrophages with a Fold-Change < -2. Taking the intersection of these two lists revealed genes, which had a high expression in 24-month WT macrophages, but whose expression was decreased in 24-month Nlrp3−/− macrophages to a comparable level as in the 3-month WT macrophages. The same analysis was also performed into the other direction (Fold-Change for 24-month WT versus 3-month WT macrophages < -2 and Fold-Change for 24-month Nlrp3−/− versus 24-month WT macrophages > 2) to obtain genes being rescued in the sense of downregulation. The whole approach was performed separately for datasets II and III to identify genes being rescued in VAT and spleen macrophages independently. The resulting numbers behind the approach were visualized in the form of Venn Diagrams. Finally, the top 20 genes, determined and sorted according to the highest expression in 24-month WT macrophages, were plotted in heatmaps for all four resulting lists of rescued genes.
Behavior of genes linked to senescence on transcriptional level in VAT macrophages
Based on previous publications 44,45, a list of genes being linked to senescence was curated. Of those, only the ones were kept having a fold-change > 1.5 or < -1.5 between 24-months old WT and 3-months old WT VAT macrophages, together with a corresponding p-value < 0.05 in dataset II. For the remaining genes, a bar plot displaying the fold-change between 24-months old WT and 3-months old WT VAT macrophages (in pink) and between 24-months old Nlrp3−/− and 24-months old WT VAT macrophages (in turquoise) was created.
Highlighting functional differences between VAT and spleen macrophages
Using the curated list of genes associated with lipid metabolism as well as an assembly of genes being linked to lipid metabolism or belonging to the aldo-keto reductases or aldehyde dehydrogenases gene families, heatmaps were generated for those genes being expressed in VAT (dataset II) macrophages. The genes were ordered based on hierarchical clustering. The same genes were then displayed within a heatmap based on the spleen macrophage data (dataset III), using the same order as for the VAT macrophages. Genes being not expressed in the spleen dataset were left blank within the heatmaps.
Extended Data
Extended data Figure 1. Age-related AT defects in response to fasting, related to Figure 1.
a, Body-weight after 24h feeding or fasting. Each symbol represents an individual mouse. Data are represented as mean±SEM. N= (13) 4-month fed; (10) 21-month fed; (16) 21-month fast; (11) 21-month fast pooled from 2 independent experiments. b, Percent body-weight change after 24 hour fasting. Each symbol represents an individual mouse. Data are represented as mean±SEM. N= (13) 4-month fed; (10) 21-month fed; (16) 21-month fast; (11) 21-month fast pooled from 2 independent experiments. c, Blood glucose, each symbol represents an individual mouse. Data are represented as mean±SEM. N= (6) 4-month fed; (6) 21-month fed; (8) 21-month fast; (7) 21-month fast. d, Percentage change in blood glucose after feeding or fasting. Each symbol represents an individual mouse. Data are are represented as mean±SEM. N= (6) 4-month fed; (6) 21-month fed; (8) 21-month fast; (7) 21-month fast. e, VAT weight, displayed as a percentage of fed. Each symbol represents an individual mouse. Data are represented as mean±SEM. N= (13) 4-month fed; (10) 21-month fed; (16) 21-month fast; (11) 21-month fast pooled from 2 independent experiments. f, Serum FFA in fed and fasted mice. Each symbol represents an individual mouse. Data are pooled from 4 independent experiment and are represented as mean±SEM. n= (23) 4-month fed; (13) 21-month fed; (26) 4-month fasted; (13) 21-month fasted; each symbol represents an individual mouse. g, Body-weight, VAT weight, serum FFA, glycerol and FFA release from VAT explants in 4-month old fed, 12h fast or 24h fasted animals. Data are pooled from 2 independent experiments and are represented as mean±SEM. n= (10) fed, (10) 12h fast and (5) 24h fast; each symbol represents an individual mouse. h, Hsl and Atgl gene expression in floating adipocytes isolated from VAT of 4- (black) or 21-month old (red) mice that were fed or fasted for 24h. Data are represented as mean±SEM. N= (5) 4-month fed; (6) 21-month fed; (6) 4-month fast; (9) 21-month fast pooled from 2 independent experiments. i, Western blot of lipolytic signaling pathway (pHSL, HSL, ATGL) in VAT from 4- or 21-month old mice fed or fasted for 12h. Each lane is an individual animal that received indicated treatment. Actin was probed for as a loading control. Representative of one experiment. j, Western blot of lipolytic signaling pathway (pHSL, HSL, ATGL) in VAT explants from 4- or 21-month old fed mice that were left unstimulated or stimulated with 1uM NE. Each lane represents a biological replicate. Representative of two individual experiments. Actin was probed for as a loading control. In all graphs (a–h), Tukey’s Test was used to identify statistical differences; P value *<0.05, **<0.01, ***<0.001, ****<0.0001
Extended Data Figure 2. Age-related changes in ATMs in response to fasting, related to Figure 1.
a, Representative gating strategy for ATM analyses. b, Representative contour plots of CD206 and CD11c expression within F4/80+CD11b+ ATMs from VAT of fed or fasted mice. Values represent mean for each condition from 2 individual experiments. Exact Ns are displayed in table 1. c, Quantification of CD11c+CD206− (top) and CD11c+CD206+ (bottom) populations from panel b, expressed as a percentage of total F4/80+ CD11b+ cells. Data are represented as mean±SEM and pooled from two independent experiments. Each symbol represents an independent biological sample pooled from 1–4 mice; exact Ns are displayed in figure and on table 1. Tukey’s Test; P value ***<0.001, ****<0.0001 d, FFA release from 3- or 21- month old fasted VAT explants that were co-cultured with sorted ATMs from 3-month old adipose. Data are represented as mean±SEM. Exact N’s, which are biological replicates, are described in figure and are combined from three individual experiments. Student’s T-Test; P value *<0.05 e, Western blot of MAOA in VAT from 4- or 21-month old mice that were fasted for 24h. Each lane represents an individual animal. A short (5’; top panel) and long (30’; middle panel) exposure are shown for clarity. Actin was probed for as a loading control. Representative of one independent experiment.
Extended data Figure 3. ATMs are unique tissue-resident macrophage cell type, related to Figure 2.
a, Workflow related to Figure 2 and extended data 3. b, PCA based on 13,954 present genes revealing the distribution of samples according to tissue origin and age. c, Heatmap of differentially expressed genes between 24- and 3-month macrophages in whether VAT or spleen using a fold-change <- 1.5 or > 1.5 and an FDR-adjusted p-value < 0.05. Expression values were z-transformed and scaled to a minimum of -2 and a maximum of 2. Rows and columns were ordered based on hierarchical clustering. d, Heatmap of 1000 most variable genes. Expression values were z-transformed and scaled to a minimum of -2 and a maximum of 2. Rows and columns were ordered based on hierarchical clustering. e, PCA based on 13,846 present genes of a combined dataset containing the four murine macrophage populations defined by origin and age and a compendium of murine tissue-resident macrophages of seven different organs (GSE63340).
Extended data Figure 4. Aged ATMs express distinct transcriptome, related to Figure 2.
a, Workflow related to Figure 2 and extended data 4. b, Co-expression networks based on 1,887 variable genes having a correlation of at least 0.98 to at least one other gene. For each condition, the fold-change compared to the overall mean was mapped onto the networks, ranging from blue representing a negative fold-change to red representing a positive fold-change. Circles indicate the sub-clusters, which were identified for each condition. c, Heatmap of lipid metabolism-related genes in VAT and splenic macrophages. Expression values were z-transformed and scaled to a minimum of -1.41 and a maximum of 1.41. Genes were ordered by hierarchical clustering.
Extended data Figure 5. Myeloid cell changes in aged Nlrp3−/− mice, related to Figure 3.
a, Representative contour plots showing CD206 and CD11c expression, gated through F4/80+ CD11b+ cells, from VAT of fasted WT and Nlrp3−/− mice. Values represent mean percentage in that quadrant. Ns are displayed on table 1. b, Quantification of CD11c+CD206− (top) and CD11c+CD206+ (bottom) cells gated through F4/80+ CD11b+ cells from VAT of fasted WT (filled) and Nlrp3−/− (open) mice. Data are expressed as mean±SEM. c, B220−MHCII+CD11c+ frequency as percentages of the stromal vascular fraction of WT (filled) and Nlrp3−/− (open) mice at 3- or 24-months of age. Data are expressed as mean±SEM. Ns are displayed in the figure and on table 1. d, Percentages of F4/80+ CD11b+cells in the spleen of WT and Nlrp3−/− mice at 5- or 24-months of age, which were fed (filled) or fasted (fasted) for 24 hours. Data are expressed as mean±SEM. Ns are displayed in the figure and represent individual mice. e, Quantification of CD206 and CD11c expression, based on percentages of F4/80+ CD11b+cells, from spleen of fasted WT (filled) or Nlrp3−/− (open) mice. Data are expressed as mean±SEM. Exact Ns are described with the figure. Tukey’s Test was used to identify significance in all panels. P value *<0.05, **<0.01, ****<0.0001.
Extended data Figure 6. Nlrp3 regulation of age-induced genes in ATMs, related to Figure 3.
a, Workflow for RNA sequencing data analysis in Figure S6. b, (Left) PCA based on 13,129 present genes revealing the distribution of VAT macrophage populations from three different age/genotype groups. (Right) Heatmap of 1000 most variable genes in VAT macrophage populations compared between all three groups. Expression values were z-transformed and scaled to a minimum of -2 and a maximum of 2. Rows and columns were ordered based on hierarchical clustering. c, (Left) PCA based on 13,169 present genes revealing the distribution of splenic macrophage populations from three different age/genotype groups. (Right) Heatmap of 1000 most variable genes in splenic macrophage populations compared between all three groups. Expression values were z-transformed and scaled to a minimum of -2 and a maximum of 2. Rows and columns were ordered based on hierarchical clustering. d,e, Venn Diagrams comparing genes being up- (fold-change > 2, left) or downregulated (fold-change < -2, right) in 24-month compared to 3-month WT macrophages with genes being down- (fold-change <-2, left) or upregulated (fold-change > 2, right) in 24-month Nlrp3−/− compared to 24-month WT macrophages in whether (d) VAT or (e) spleen. f, Heatmaps showing the expression patterns of the top 20- upregulated (left) or downregulated (right) genes (extended data 6e) to be rescued by Nlrp3-deficiency in splenic macrophages. Expression values were z-transformed and scaled to a minimum of -1.15 and a maximum of 1.15. Genes were ranked according to expression in 24-month WT splenic macrophages.
Extended data Figure 7. Nlrp3 regulation of senescence and lipid associated genes in ATMs and splenic macrophages, related to Figure 3.
a, Workflow for Figure 3 and extended data 7. b, Barplot displaying the fold-change between 24- and 3- month WT VAT macrophages (pink) and 24-month Nlrp3−/− and 24-month WT VAT macrophages (turquoise) for senescence-associated genes. Horizontal dashed lines indicate fold-changes of 1.5 and -1.5 respectively. c, Heatmap of lipid metabolism-related genes in VAT macrophages. Expression values were z-transformed and scaled to a minimum of -1.15 and a maximum of 1.15. Genes were ranked according to hierarchical clustering. d, Heatmap of present genes of the spleen macrophage dataset linked to Maoa, Comt, Ald- or Akr- families in splenic macrophages. Expression values were z-transformed and scaled to a minimum of -1.15 and a maximum of 1.15. Rows are in the same order as in Figure 3c and genes which are not present in the spleen dataset are left blank.
Extended data Figure 8. Mechanism for Gdf3 inhibition of NLRP3 inflammasome activation, related to Figure 4.
a, (Left) Pcsk6 mean expression, from RNA seq analysis, from sorted ATMs in 3-month WT, 24-month WT or 24-month Nlrp3−/− VAT. Data are expressed as mean±SEM. Ns are displayed on table 1. (Right) Schematic depicting the interaction between macrophage-PCSK6 and GDF3 and action on adipocyte lipolysis. b, Quantification of pro-caspase-1 (left) and active p20 caspase-1 (right) from panel 4B, normalized to actin, in WT (filled) or Gdf3−/− (empty) BMDMs treated with LPS or LPS+ATP. Data are represented as mean±SEM and show n=3 (WT), 4 (Gdf3−/−) biological replicates. c, Caspase-1 gene expression in LPS-treated BMDMs generated from WT (black) or Gdf3−/− (grey) mice. Data are pooled from 2 independent experiments, each with n=(3) and (2) biological replicates and expressed as mean±SEM. d, Il1β gene expression in LPS-treated BMDMs generated from WT (black) or Gdf3−/− (grey) mice and displayed as fold change to untreated BMDMs. Data are pooled from 3 independent experiments, each with n= (3), (4) and (3) biological replicates and expressed as mean±SEM. e, Immunoblot showing phopho-p65, total p65, and IκB-α expression in LPS-treated WT or Gdf3−/− BMDMs. Representative of one independent experiment. f, Maoa gene expression in WT or Gdf3−/− BMDMs that have left untreated. Data are expressed as mean±SEM and pooled from 2 individual experiments. Each symbol represents a biological replicate. Tukey’s Test (a, b) or Student’s T-Test (c,d,f) was used to test for significance; P value *<0.05, **<0.01, ***<0.0001.
Extended Data Figure 9. Schematic to show nerve associated macrophages and role in aged adipose, related to Figure 4.
a, Schematic of the mTmG construct before (top) and after (bottom) Cre-mediated recombination in the LysMCre+ myeloid cells. The LysMCre+ mT/mG+ traces the myeloid cells with membrane green fluorescence protein (mG- green), whereas LysMCre− mT/mG+ cells lacking cre recombination indelibly express tomato (mT- red). b, Single-color images of merged image from Figure 4e. Use of LysM-Cre: mT/mG reporter mouse plus antibody staining, allowed for visualization of all cells (mTomato-red), myeloid cells (mGFP-green), TH- (blue) and TUBB3- (white) expressing nerves. Representative of 6 independent experiments. c, Schematic representing the model. In young adipose, fasting initiates catecholamine release from sympathetic nerves. Binding of catecholamines on beta-adrenergic receptors (β-AR) causes intracellular cAMP increases, activation of PKA and downstream signaling lipases (ATGL, HSL, MGL) resulting in the hydrolysis of triglyceride and release of fatty acid (FA) and glycerol. Lipolysis and FFA release are necessary fuel elements for survival during starvation, and promoting cold and exercise tolerance. During aging, there is an increase in inflammatory danger-associated-molecular patters (DAMPs), leading to the activation of the NLRP3 inflammasome in adipose tissue macrophages. NLRP3-dependent increases in GDF3 and MAOA result in degradation of norepinephrine (NE), prevent NE-activation of lipolytic signaling in adipocytes and cause reduced FA and glycerol release. Inset: The pathway for MAOA-driven degradation of NE into DOPEGAL, and subsequent breakdown into DHMA and DHPG by ALDs and AKRs is displayed. TG: triglyceride; DG: diglyceride; MG: monoglyceride; ALD: Aldehyde dehydrogenases; AKR: aldo-keto reductases; DOPEGAL: dihydroxyphenylglycolaldehyde; DHPG: dihydroxyphenyl glycol; DHMA: dihydroxymandelic acid
Supplementary Material
Acknowledgments
We thank Ruslan Medzhitov and Tamas Horvath at Yale School of Medicine for presubmission review of the manuscript and Vishva M. Dixit at Genentech Inc. for providing the anti-caspase-1 antibody and the Nlrp3-deficient mice. We also thank Sunil Baindur for graphics, Sviatoslav Sidorov, Santiago Valle Torres, Patrick Günther, Kathrin Klee and Thomas Ulas for support in bioinformatics analyses, The Yale Center on Genomic Analysis (YCGA) for RNA sequencing studies and Peter Cresswell lab for confocal microscopy support. J.L.S. was funded by the German Research Foundation (SFB704, SFB645) and by the ImmunoSensation Cluster of Excellence Bonn. C.C. was supported by NIA postdoctoral training fellowship under AG043608. E.L.G was supported by AFAR (American Federation of Aging Research). Dixit lab is supported in part by NIH grants P01AG051459, AI105097, AG051459, AR070811, the Glenn Foundation on Aging Research and Cure Alzheimer’s Fund.
Footnotes
The authors declare no competing financial interests.
Data Availability Statement:
Sequencing data is available at the Gene Expression Omnibus: GSE # GSE93202. Full scans for all western blots (Figure 4b,h,i; ED1i,j; ED2e; ED8e) have been provided in the supplemental figures. Source data for all mouse experiments have been provided (1a–d; 2c–e; 3a; 4a,c,d,f,g,j; ED1a–h; ED2b–d; ED5a–e; EDa,-d, f) All data are available from authors on reasonable request.
Author Contributions
C.C. and V.D.D. designed experiments. C.C., O.S., E.G., K.N. and Y.Y. harvested tissue and performed flow cytometry experiments. C.C. treated animals, generated BMDMs, performed lipolysis and PCR analysis. O.S. performed western blot analysis. A.W. and M.S.R. generated adipocytes from sorted pre-adipocytes. A.L. and O.S. performed whole-mount confocal microscopy. J.E. measured norepinephrine using HPLC. J.S. and J.L.S. performed the bioinformatics analysis and interpretation. All authors participated in manuscript preparation. C.C. and V.D.D. interpreted data and wrote the manuscript.
Supplementary Information is linked to the online version of the paper at www.nature.com/nature.
References
- 1.Young SG, Zechner R. Biochemistry and pathophysiology of intravascular and intracellular lipolysis. Genes Dev. 2013;27:459–484. doi: 10.1101/gad.209296.112. [DOI] [PMC free article] [PubMed] [Google Scholar]
- 2.Lonnqvist F, Nyberg B, Wahrenberg H, Arner P. Catecholamine-induced lipolysis in adipose tissue of the elderly. The Journal of clinical investigation. 1990;85:1614–1621. doi: 10.1172/JCI114612. [DOI] [PMC free article] [PubMed] [Google Scholar]
- 3.James RC, Burns TW, Chase GR. Lipolysis of human adipose tissue cells: influence of donor factors. J Lab Clin Med. 1971;77:254–266. [PubMed] [Google Scholar]
- 4.Gerber JG, Detmar-Hanna D, Zahniser NR. Lack of an effect of age on beta-adrenoceptor-mediated lipolysis in isolated human adipocytes. The journals of gerontology. Series A, Biological sciences and medical sciences. 1999;54:B71–77. doi: 10.1093/gerona/54.2.b71. [DOI] [PubMed] [Google Scholar]
- 5.Feingold KR, Doerrler W, Dinarello CA, Fiers W, Grunfeld C. Stimulation of lipolysis in cultured fat cells by tumor necrosis factor, interleukin-1, and the interferons is blocked by inhibition of prostaglandin synthesis. Endocrinology. 1992;130:10–16. doi: 10.1210/endo.130.1.1370149. [DOI] [PubMed] [Google Scholar]
- 6.Mowers J, et al. Inflammation produces catecholamine resistance in obesity via activation of PDE3B by the protein kinases IKKepsilon and TBK1. eLife. 2013;2:e01119. doi: 10.7554/eLife.01119. [DOI] [PMC free article] [PubMed] [Google Scholar]
- 7.Bertrand HA, Anderson WR, Masoro EJ, Yu BP. Action of food restriction on age-related changes in adipocyte lipolysis. J Gerontol. 1987;42:666–673. doi: 10.1093/geronj/42.6.666. [DOI] [PubMed] [Google Scholar]
- 8.Schweiger M, et al. Adipose triglyceride lipase and hormone-sensitive lipase are the major enzymes in adipose tissue triacylglycerol catabolism. The Journal of biological chemistry. 2006;281:40236–40241. doi: 10.1074/jbc.M608048200. [DOI] [PubMed] [Google Scholar]
- 9.Xu X, et al. Obesity activates a program of lysosomal-dependent lipid metabolism in adipose tissue macrophages independently of classic activation. Cell metabolism. 2013;18:816–830. doi: 10.1016/j.cmet.2013.11.001. [DOI] [PMC free article] [PubMed] [Google Scholar]
- 10.Hotamisligil GS. Inflammation and metabolic disorders. Nature. 2006;444:860–867. doi: 10.1038/nature05485. [DOI] [PubMed] [Google Scholar]
- 11.Ferrante AW., Jr The immune cells in adipose tissue. Diabetes, obesity & metabolism. 2013;15(Suppl 3):34–38. doi: 10.1111/dom.12154. [DOI] [PMC free article] [PubMed] [Google Scholar]
- 12.Lumeng CN, Saltiel AR. Inflammatory links between obesity and metabolic disease. The Journal of clinical investigation. 2011;121:2111–2117. doi: 10.1172/JCI57132. [DOI] [PMC free article] [PubMed] [Google Scholar]
- 13.Shoelson SE, Lee J, Goldfine AB. Inflammation and insulin resistance. The Journal of clinical investigation. 2006;116:1793–1801. doi: 10.1172/JCI29069. [DOI] [PMC free article] [PubMed] [Google Scholar]
- 14.Vega A, et al. A new role for monoamine oxidases in the modulation of macrophage-inducible nitric oxide synthase gene expression. Journal of leukocyte biology. 2004;75:1093–1101. doi: 10.1189/jlb.1003459. [DOI] [PubMed] [Google Scholar]
- 15.Rogers NH, Landa A, Park S, Smith RG. Aging leads to a programmed loss of brown adipocytes in murine subcutaneous white adipose tissue. Aging cell. 2012;11:1074–1083. doi: 10.1111/acel.12010. [DOI] [PMC free article] [PubMed] [Google Scholar]
- 16.Lavin Y, et al. Tissue-resident macrophage enhancer landscapes are shaped by the local microenvironment. Cell. 2014;159:1312–1326. doi: 10.1016/j.cell.2014.11.018. [DOI] [PMC free article] [PubMed] [Google Scholar]
- 17.Spadaro O, et al. Growth Hormone Receptor Deficiency Protects against Age-Related NLRP3 Inflammasome Activation and Immune Senescence. Cell reports. 2016;14:1571–1580. doi: 10.1016/j.celrep.2016.01.044. [DOI] [PMC free article] [PubMed] [Google Scholar]
- 18.Youm YH, et al. Canonical Nlrp3 inflammasome links systemic low-grade inflammation to functional decline in aging. Cell metabolism. 2013;18:519–532. doi: 10.1016/j.cmet.2013.09.010. [DOI] [PMC free article] [PubMed] [Google Scholar]
- 19.Campisi J, d’Adda di Fagagna F. Cellular senescence: when bad things happen to good cells. Nature reviews. Molecular cell biology. 2007;8:729–740. doi: 10.1038/nrm2233. [DOI] [PubMed] [Google Scholar]
- 20.Amano SU, et al. Local proliferation of macrophages contributes to obesity-associated adipose tissue inflammation. Cell metabolism. 2014;19:162–171. doi: 10.1016/j.cmet.2013.11.017. [DOI] [PMC free article] [PubMed] [Google Scholar]
- 21.Shen JJ, et al. Deficiency of growth differentiation factor 3 protects against diet-induced obesity by selectively acting on white adipose. Molecular endocrinology. 2009;23:113–123. doi: 10.1210/me.2007-0322. [DOI] [PMC free article] [PubMed] [Google Scholar]
- 22.Andersson O, Korach-Andre M, Reissmann E, Ibanez CF, Bertolino P. Growth/differentiation factor 3 signals through ALK7 and regulates accumulation of adipose tissue and diet-induced obesity. Proceedings of the National Academy of Sciences of the United States of America. 2008;105:7252–7256. doi: 10.1073/pnas.0800272105. [DOI] [PMC free article] [PubMed] [Google Scholar]
- 23.Guo T, et al. Adipocyte ALK7 links nutrient overload to catecholamine resistance in obesity. eLife. 2014;3:e03245. doi: 10.7554/eLife.03245. [DOI] [PMC free article] [PubMed] [Google Scholar]
- 24.Yogosawa S, Mizutani S, Ogawa Y, Izumi T. Activin receptor-like kinase 7 suppresses lipolysis to accumulate fat in obesity through downregulation of peroxisome proliferator-activated receptor gamma and C/EBPalpha. Diabetes. 2013;62:115–123. doi: 10.2337/db12-0295. [DOI] [PMC free article] [PubMed] [Google Scholar]
- 25.Shih JC, Chen K, Ridd MJ. Monoamine oxidase: from genes to behavior. Annu Rev Neurosci. 1999;22:197–217. doi: 10.1146/annurev.neuro.22.1.197. [DOI] [PMC free article] [PubMed] [Google Scholar]
- 26.Czimmerer Z, et al. Identification of novel markers of alternative activation and potential endogenous PPARgamma ligand production mechanisms in human IL-4 stimulated differentiating macrophages. Immunobiology. 2012;217:1301–1314. doi: 10.1016/j.imbio.2012.08.270. [DOI] [PubMed] [Google Scholar]
- 27.Balter NJ, Schwartz SL. Accumulation of norepinephrine by macrophages and relationships to known uptake processes. The Journal of pharmacology and experimental therapeutics. 1977;201:636–643. [PubMed] [Google Scholar]
- 28.Youdim MB, Edmondson D, Tipton KF. The therapeutic potential of monoamine oxidase inhibitors. Nat Rev Neurosci. 2006;7:295–309. doi: 10.1038/nrn1883. [DOI] [PubMed] [Google Scholar]
- 29.Mariathasan S, et al. Cryopyrin activates the inflammasome in response to toxins and ATP. Nature. 2006;440:228–232. doi: 10.1038/nature04515. [DOI] [PubMed] [Google Scholar]
- 30.Berry R, Rodeheffer MS. Characterization of the adipocyte cellular lineage in vivo. Nat Cell Biol. 2013;15:302–308. doi: 10.1038/ncb2696. [DOI] [PMC free article] [PubMed] [Google Scholar]
- 31.Rodeheffer MS, Birsoy K, Friedman JM. Identification of white adipocyte progenitor cells in vivo. Cell. 2008;135:240–249. doi: 10.1016/j.cell.2008.09.036. [DOI] [PubMed] [Google Scholar]
- 32.Elsworth JD, et al. Symptomatic and asymptomatic 1-methyl-4-phenyl-1,2,3,6-tetrahydropyridine-treated primates: biochemical changes in striatal regions. Neuroscience. 1989;33:323–331. doi: 10.1016/0306-4522(89)90212-1. [DOI] [PubMed] [Google Scholar]
- 33.Berry R, et al. Imaging of adipose tissue. Methods in enzymology. 2014;537:47–73. doi: 10.1016/B978-0-12-411619-1.00004-5. [DOI] [PMC free article] [PubMed] [Google Scholar]
- 34.Nolan T, Hands RE, Bustin SA. Quantification of mRNA using real-time RT-PCR. Nature protocols. 2006;1:1559–1582. doi: 10.1038/nprot.2006.236. [DOI] [PubMed] [Google Scholar]
- 35.Kim D, et al. TopHat2: accurate alignment of transcriptomes in the presence of insertions, deletions and gene fusions. Genome biology. 2013;14:R36. doi: 10.1186/gb-2013-14-4-r36. [DOI] [PMC free article] [PubMed] [Google Scholar]
- 36.Love MI, Huber W, Anders S. Moderated estimation of fold change and dispersion for RNA-seq data with DESeq2. Genome biology. 2014;15:550. doi: 10.1186/s13059-014-0550-8. [DOI] [PMC free article] [PubMed] [Google Scholar]
- 37.Benjamini Y, Hochberg Y. Controlling the false discovery rate: a practical and powerful approach to multiple testing. Journal of the Royal Statistical Society Series B (Methodological) 1995;57:289–300. [Google Scholar]
- 38.Gene Ontology C. Gene Ontology Consortium: going forward. Nucleic acids research. 2015;43:D1049–1056. doi: 10.1093/nar/gku1179. [DOI] [PMC free article] [PubMed] [Google Scholar]
- 39.Ashburner M, et al. Gene ontology: tool for the unification of biology. The Gene Ontology Consortium. Nature genetics. 2000;25:25–29. doi: 10.1038/75556. [DOI] [PMC free article] [PubMed] [Google Scholar]
- 40.Newman AM, et al. Robust enumeration of cell subsets from tissue expression profiles. Nat Methods. 2015;12:453–457. doi: 10.1038/nmeth.3337. [DOI] [PMC free article] [PubMed] [Google Scholar]
- 41.Xue J, et al. Transcriptome-based network analysis reveals a spectrum model of human macrophage activation. Immunity. 2014;40:274–288. doi: 10.1016/j.immuni.2014.01.006. [DOI] [PMC free article] [PubMed] [Google Scholar]
- 42.Theocharidis A, van Dongen S, Enright AJ, Freeman TC. Network visualization and analysis of gene expression data using BioLayout Express(3D) Nature protocols. 2009;4:1535–1550. doi: 10.1038/nprot.2009.177. [DOI] [PubMed] [Google Scholar]
- 43.Shannon P, et al. Cytoscape: a software environment for integrated models of biomolecular interaction networks. Genome Res. 2003;13:2498–2504. doi: 10.1101/gr.1239303. [DOI] [PMC free article] [PubMed] [Google Scholar]
- 44.Chen H, Zheng X, Zheng Y. Age-associated loss of lamin-B leads to systemic inflammation and gut hyperplasia. Cell. 2014;159:829–843. doi: 10.1016/j.cell.2014.10.028. [DOI] [PMC free article] [PubMed] [Google Scholar]
- 45.Tacutu R, Craig T, Budovsky A, Wuttke D, Lehmann G, Taranukha D, Costa J, Fraifeld VE, de Magalhaes JP. Human Ageing Genomic Resources: Integrated databases and tools for the biology and genetics of ageing. Nucleic acids research. 2013;41:D1027–D1033. doi: 10.1093/nar/gks1155. [DOI] [PMC free article] [PubMed] [Google Scholar]
Associated Data
This section collects any data citations, data availability statements, or supplementary materials included in this article.


