

Abstract
The Hsp70 chaperone system plays a critical role in cellular homeostasis by binding to client protein molecules. We have recently shown by methyl‐TROSY NMR methods that the Escherichia coli Hsp70, DnaK, can form multiple bound complexes with a small client protein, hTRF1. In an effort to characterize the interactions further we report here the results of an NMR‐based titration study of hTRF1 and DnaK, where both molecular components are monitored simultaneously, leading to a binding model. A central finding is the formation of a previously undetected 3:1 hTRF1‐DnaK complex, suggesting that under heat shock conditions, DnaK might be able to protect cytosolic proteins whose net concentrations would exceed that of the chaperone. Moreover, these results provide new insight into the heterogeneous ensemble of complexes formed by DnaK chaperones and further emphasize the unique role of NMR spectroscopy in obtaining information about individual events in a complex binding scheme by exploiting a large number of probes that report uniquely on distinct binding processes.
Keywords: Hsp70, conformational heterogeneity, methyl‐TROSY NMR, molecular chaperones, NMR titrations
Introduction
The Hsp70 family of molecular chaperones participate in a highly conserved quality control process that maintains cellular proteostasis.1 Hsp70 interacts with client substrates in an ATP‐dependent manner to influence a variety of cellular activities that occur during normal cell function as well as during periods of stress such as heat shock.2 The constitutive role of Hsp70 in de novo protein folding and protein maturation, as well as its heat inducible function in preventing aggregation and promoting protein refolding, ensure the integrity of the cellular proteome.3
Of the many Hsp70 chaperones, the best studied is Escherichia coli DnaK. DnaK is a 70 kDa protein that consists of a 45 kDa N‐terminal ATPase domain (NTD) and a 25 kDa C‐terminal substrate binding domain (SBD).2 Substrate binding occurs in a pocket located in the β‐sandwich subdomain of the SBD, with the substrate enclosed by an α‐helical lid in the bound ADP form.4 Crystal5, 6 and NMR structures7 of the SBD in complex with peptide substrates [Fig. 1(A)] have shown that peptides bind in an extended conformation that is stabilized by backbone hydrogen bonds as well as by hydrophobic interactions between peptide core residues and amino acids of DnaK that line the substrate binding cavity. The preference of DnaK for binding large aliphatic residues of client proteins such as Ile, Leu, and Val arises from the hydrophobic contacts made by these residues when localized to the central position of the DnaK binding pocket.4, 5, 6, 7 The interactions predominantly involve contacts with a number of large aliphatic sidechains in DnaK, Ile 401, Val 436, and Ile 438. High‐resolution studies of Hsp70‐substrate complexes have largely been limited to peptide substrates and, consequently, the details of the interactions of Hsp70 with folding‐competent client proteins remain only poorly understood.
Figure 1.
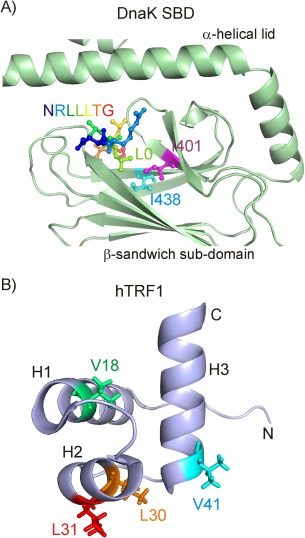
(A) Zoomed view of the DnaK substrate binding domain (SBD) (PDB ID:1DKZ),5 comprising the β‐sandwich domain and the α‐helical lid. The bound NRLLLTG peptide, as well as Ile 401 and Ile 438 of the DnaK binding pocket, that in turn are proximal to the central client residue in the binding pocket (denoted by L0), are shown in ball and stick representation. (B) Cartoon representation of the structure of the three‐helix bundle protein hTRF1 (PDB ID: 1BA5).8 Sidechains in hTRF1 occupying the central position of the DnaK binding groove in different complexes are indicated by sticks11
We have previously used the three‐helix bundle human telomeric repeat factor (hTRF1) as a model substrate for characterizing the molecular details of DnaK‐substrate complexes [Fig. 1(B)].9, 10, 11 In a recent solution based NMR study we showed that DnaK recognizes and binds to at least four different sites on this small 53‐residue client, resulting in multiple slowly interconverting conformations and, hence, conformational heterogeneity in the bound ensemble.11 In addition, regions of the client protein far from the DnaK binding site are disordered with elements of local secondary structure, resulting in a highly dynamic chaperone‐substrate complex. NMR spectroscopy is well‐suited for studying complexes such as the DnaK‐hTRF1 system, because a large number of probes are available for quantification and the multiple modes of interaction can be investigated independently using specific peaks in spectra that are sensitive to distinct binding events. Further, the development of novel NMR labeling strategies in which highly deuterated proteins are prepared with 13CH3 methyl labeling at specific sidechains12, 13 in concert with methyl‐TROSY based methods14, 15 provides an avenue to investigate large protein complexes with high resolution, as has been illustrated in a large number of publications,16, 17 and in what follows below.
Here, we present NMR‐derived titration profiles, obtained from the addition of DnaK to a solution of hTRF1, where each molecular component is labeled uniquely, so that the intensities of peaks can be quantified from both substrate and chaperone during the course of the titration. A global fit of the resulting titration curves has allowed the development of a model that describes hTRF1‐DnaK interactions that further emphasizes the heterogeneity of the substrate‐chaperone ensemble and suggests a mechanism for how DnaK may be able to influence the conformation of substrate molecules to which it is not directly bound.
Results
Classification of the observed titration profiles
In order the quantify the interactions between hTRF1 and DnaK we performed a titration experiment using highly deuterated proteins, labeled as Ileδ1‐13CH3, Met‐13CH3 (IM‐13CH3) and Ileγ2‐13CH3, Leu,Val‐13CH3/12CD3 (Iγ‐LV‐13CH3) for DnaK and hTRF1, respectively. A 1H‐13C HMQC spectrum of 440 μM Iγ‐LV‐13CH3 hTRF1, 570 μM IM‐13CH3 DnaK is shown in Figure 2 and the intensities of (A) correlations arising from free hTRFI and DnaK‐bound hTRF1 in the LV and Iγ regions and (B) hTRF1‐bound DnaK peaks derived from Ile 401 and Ile 438, can all be quantified independently in such spectra. While the intensities of a number of other DnaK peaks can also be measured reliably, these derive from both unbound and hTRF1‐bound DnaK molecules (degenerate shifts in free and bound states) and hence provide less useful information because they report only on the total concentration of DnaK. As described previously,11 there are at least four very slowly exchanging conformations of the hTRF1‐DnaK complex, referred to as states “a,” “b,” “c,” and “d,” which arise because of the recognition of four distinct sites of hTRF1 by DnaK, centred at Leu 31, Leu 30, Val 41, and Val 18 respectively. These four amino acids occupy the central position in the binding groove of DnaK in each of the respective states “a”–“d” and have distinct chemical shifts because of their proximity to hydrophobic residues lining the binding groove such as Ile 401 and Ile 438. Cross peak intensities derived from states “a,” “b,” and “c,” but not “d,” can be robustly obtained from 1H‐13C HMQC spectra and have been used to formulate the binding model presented below.
Figure 2.
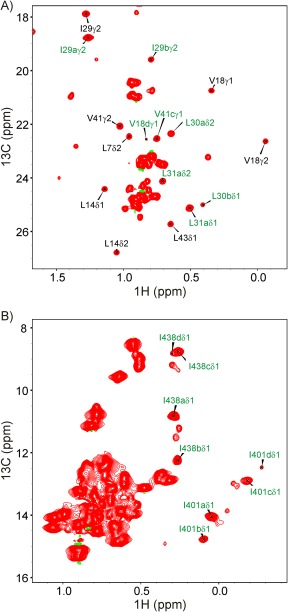
(A) Leu/Val and (B) Ile regions of a 1H‐13C HMQC spectrum recorded on a sample of 440 μM Iγ‐LV‐13CH3 hTRF1, 570 μM IM‐13CH3 DnaK/ADP, 35°C, 18.8T. Resonance assignments indicated in black are for native (unbound) hTRF1 while assignments in green highlight DnaK (I401,I438) or hTRF1 correlations from hTRF1‐DnaK complexes, as described in the text. Note that state “d,” corresponding to hTRF1 residue V18 at the central position in the binding pocket, was not included in the analysis of the data, as the intensities of key resonances from this conformer are weak or overlapped
Figure 3(A) outlines the approach used to generate the titration profiles, whereby a sample for titration point j was prepared by removing a calculated volume (V 1) from sample j‐1 and adding an equivalent volume of a stock DnaK solution of concentration L 0 [Fig. 3(A)] so that the total volume of the solution, V o, remains constant. Thus, starting from an initial sample with an hTRF1 concentration of P 0 (600 μM) without any DnaK, the total concentration of hTRF1 (P T) in subsequent samples decreases linearly with increasing total DnaK concentration (L T) [Fig. 3(B)], as shown in Supporting Information, since the total concentrations of hTRF1 and DnaK at the n th titration point are given by and respectively, where . At each titration point, a 1H‐13C HMQC spectrum of the sample was acquired and peak intensities measured. Titration profiles were then quantified as peak intensities as a function of the L T/P T (=[DnaK]T/[hTRF1]T) ratio. Although we have assumed for the purpose of illustration in Figure 3 that equivalent volumes of sample are removed in successive titration points (V 1), this is not a requirement and indeed the results discussed below hold even when different volumes are removed, so long as the total sample volume remains constant (see Supporting Information). In fact, in practice, we have not used constant volumes V 1 during the titration. Instead, L T/P T ratios were chosen to adequately sample the titration profile and the volume removed from a given sample to obtain a particular L T/P T ratio in the successive sample was calculated based on L 0 as well as L T and P T values from the current sample. We have adopted this particular mode of titration whereby V o is kept constant instead of keeping the hTRF1 concentration constant during the titration, because this method results in maxima for peak intensities [Fig. 3(C)] which are easier to detect than plateaus that arise when the hTRF1 concentration is kept constant.
Figure 3.
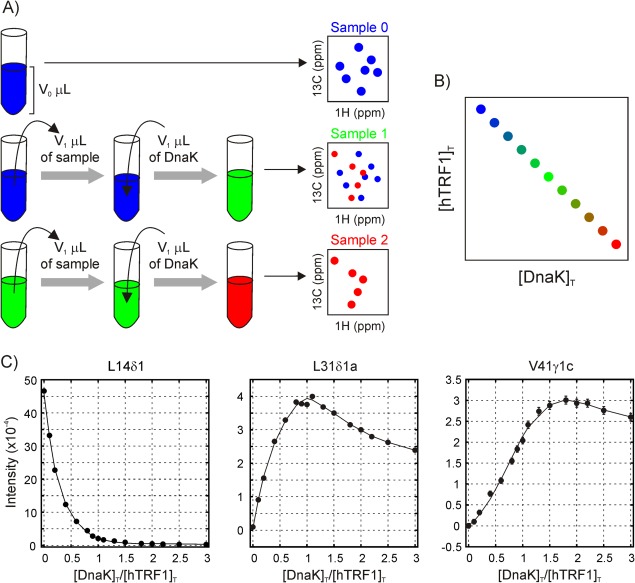
(A) Schematic illustrating the approach used to measure titration profiles. A calculated volume of solution is removed from the original hTRF1 sample, with the same volume of a stock DnaK solution added to generate a sample for the first titration point (Sample 1). Spectra are then acquired for each titration point; exchange between free and bound peaks is slow so that separate resonances are observed.11 Correlations reporting on the free hTRF1 substrate (blue) decrease in intensity, while peaks from bound states (red) increase in intensity. Although the volumes removed/added to the solution are fixed at V1 in the schematic, the mathematical descriptions in the text hold even when different volumes are used for each titration, so long as the total sample volume is fixed, as described in Supporting Information. (B) The total concentrations of hTRF1 and DnaK are related in a linear fashion with a y‐intercept of P 0 and a slope of ‐P 0/L 0 (see Supporting Information). (C) Representative titration profiles for resonances reporting on the native (unbound) state of hTRF1 (left), 1:1 hTRF1‐DnaK complexes (center, corresponding to states “a” or “b”) and 1:2 hTRF1‐DnaK complex (right, state “c”). The solid curves are intended to guide the eye and do not have any physical significance
An examination of the 21 profiles that could be reliably measured shows that they can be broadly classified into three types, representative examples of which are depicted in Figure 3(C). For the eight native state resonances of hTRF1 (i.e., in what follows, we refer to native as being folded and unbound), intensities decrease with [DnaK]T/[hTRF1]T, consistent with DnaK binding to hTRF1 and shifting the equilibrium away from the native state. Conversely, bound state resonances from states “a” (6 peaks), “b” (4 peaks) and “c” (3 peaks) increase initially with L T/P T because of an increase in the population of the bound state, and subsequently decrease because the overall concentration of hTRF1 decreases during the titration. Profiles from states “a” and “b” appear identical except for a scaling factor and have a maximum when [DnaK]T/[hTRF1]T = 1, while profiles from state “c” maximize at a [DnaK]T/[hTRF1]T value of 2. It is worth emphasizing that in a system comprising multiple simultaneous binding equilibria, the equilibrium populations of species with the same stoichiometry are directly related by their equilibrium constants at all titration points. Consequently, the resulting titration profiles will be related by a scaling factor and hence must maximize at the same value of [DnaK]T/[hTRF1]T. For example, consider two species of the type , , and , where U and K refer to hTRF1 and DnaK, and n and m are the respective stoichiometries of U and K in the complex. The association constants are given by
| (1) |
for states “p” and “q,” respectively, so that
| (2) |
Conversely, the titration profiles of species with different stoichiometries will not be related by a simple constant factor, as the ratios of concentrations of these species at every titration point will depend on at least one of or . It follows, then, that the distinct titration profiles for states “a”/“b” vs “c” which maximize at different [DnaK]T/[hTRF1]T ratios indicate a different stoichiometry of DnaK and hTRF1 for state “c” compared to states “a” or “b” (see below).
Fitting native state titration profiles
As a first step towards modeling the titration data, we fit the eight native state profiles to a 1:1 binding model. The resulting fits were very poor and the underlying reason is illustrated in Figure 4 showing normalized peak intensity ratios as a function of [DnaK]T/[hTRF1]T for a number of residues in hTRF1. The solid curve in Figure 4 is the result of fitting the data to a single exponential function and does not derive from a specific binding model (see below). Notably, the initial rate of decrease of the native state population is much greater than expected from the amount of DnaK added, even assuming all the DnaK has bound to hTRF1 to form a 1:1 complex. More native hTRF1 is consumed than the amount of added DnaK, suggesting that a species of the form U n K m (n/m > 1) forms during the initial stages of the titration.
Figure 4.
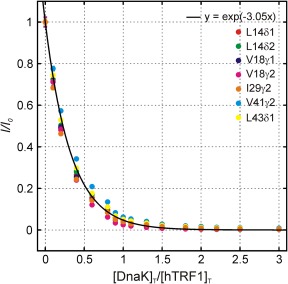
Overlay of titration profiles from seven peaks belonging to the native (unbound) state of hTRF1. The normalized intensity, I/Io, is plotted on the y‐axis where I and Io are intensities of a peak during the course of the titration (I) and prior to the addition of DnaK (Io). Note that the native state population decreases more than the amount of added DnaK, showing that the binding reaction cannot be 1:1. The solid curve is derived from a global fit of the seven profiles to a single exponential decay function indicated in the legend, with a fit value of the initial decay rate of 3.05
To obtain the value of n/m, we performed an analysis of the initial slopes of the native state profiles. The titration profile of each residue was normalized by its peak intensity in the absence of DnaK, which is proportional to the total hTRF1 concentration in the sample lacking DnaK (P 0). After the addition of the first aliquot of DnaK the concentrations of hTRF1 and DnaK are given by and , respectively, and if all the added DnaK binds to form a complex of the form U n K m, the amount of free hTRF1 will be
| (3) |
so that the decrease in free hTRF1, ΔP, is given by
| (4) |
The initial slope (S) in the normalized titration profile of the native state is thus
| (5) |
where L T(0) = 0 and P T(0) = P 0 are the concentrations of DnaK and hTRF1 in the starting sample, respectively, before addition of DnaK. Substituting from above gives,
| (6) |
As the initial slope is measured in the limit of we obtain that . In the titration analyzed here P 0 = 0.6 mM and L 0 = 2.1 mM, so that P 0/L 0 = 0.28. If DnaK is only partly bound, ΔP p < ΔP, and consequently, the initial slope, S p, measured will be smaller than the slope expected for the case of a fully bound species of the same stoichiometry. If there are a number of species with varying stoichiometries and concentrations at equilibrium, the value of the initial slope will be dictated by the species with the largest n/m ratio.
An initial slope, B, was calculated by fitting the profiles globally to a single exponential function of the form (Fig. 4). The numerical value of B from the global fit, and hence the experimental initial slope, is 3.05. The expected slope for n/m = 3 is 3.28, strongly suggesting that an hTRF1‐DnaK complex with 3:1 stoichiometry forms in solution; the slightly smaller than expected value (3.05 vs 3.28) likely reflects incomplete binding of the added DnaK. Assuming that there is one molecule of DnaK in the complex, our results indicate that a species of the type U 3 K is formed in solution, though the existence of species of the form U 6 K 2 or U 9 K 3 cannot be ruled out.
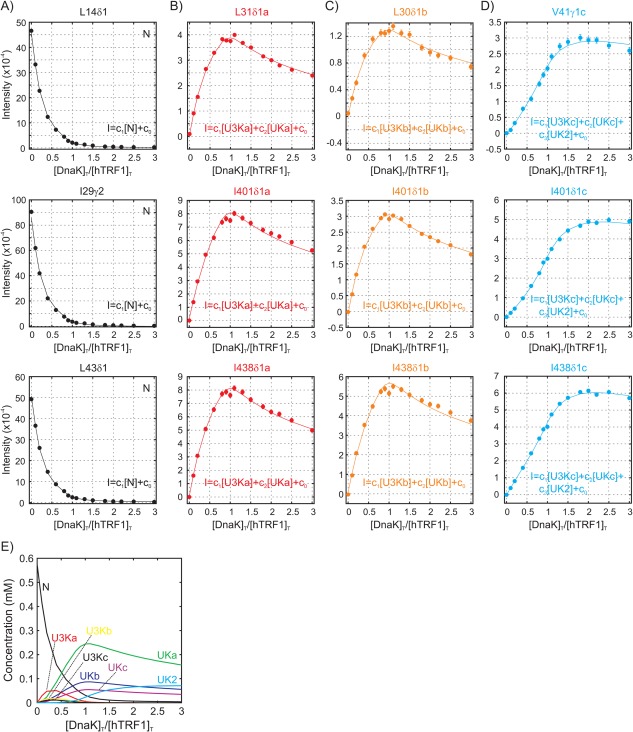
To further probe the stoichiometry of the hTRF1‐DnaK complex formed during the initial stages of the titration, we fit residue specific titration profiles to models assuming that species of the type U n K are formed, with n ranging from one through five. The quality of the fits and the magnitude of the residuals, as well as a prominent minimum in the metric as a function of n at n = 3 (Fig. 5), demonstrate that hTRF13‐DnaK (U 3 K) is the most probable species initially detected in the titration profiles of native state hTRF1 peaks, consistent with the fitted initial slopes of the native state titration profiles.
Figure 5.
Titration profiles of L43δ1 in native (unbound) hTRF1 with the solid curve derived from fitting all 21 titration profiles to the model of Figure 6 in which hTRF1‐DnaK complexes of the form U3Ki were removed n = 1 (A) or replaced by UnK, with n = 2 (B), 3 (C), 4 (D) and 5 (E). Residuals for each fit are plotted above each panel. F) χ2 red values obtained from fitting profiles to each of the five models above, indicating a clear minimum in the χ2 red profile at a value of n = 3. Errors in intensity are typically smaller than the size of the data points
Fitting the titration profiles from DnaK‐bound peaks
Having elucidated the stoichiometry of one of the chaperone‐substrate complexes that evolves during the titration, through modeling of native state profiles, we next examined the titration profiles from hTRF1 and DnaK peaks reporting on complexes “a” and “b” which have a maximum at a [DnaK]T/[hTRF1]T ratio of 1, as well as profiles from state “c” which maximize at a ratio of 2. We have shown earlier using numerical simulations11 that hTRF1‐DnaK complexes of 1:1 and 1:2 stoichiometry are maximally populated at [DnaK]T/[hTRF1]T values of 1 and 2, respectively, under conditions of tight binding. In Supporting Information, we derive analytical expressions for the maximal populations of 1:1 and 1:2 complexes in the strong binding limit (see Supporting Information) as a function of L T/P T that support the simulations. Titration profiles of states “a” and “b” thus report on 1:1 complexes, while state “c” reports on a 1:2 complex.
Assembling the final model for global analysis of the titration profiles
As discussed above, the titration data demonstrate a mixture of hTRF1‐DnaK complexes with stoichiometries of 3:1, 1:1 and 1:2 at equilibrium and, accordingly, all these complexes were included in the binding model of Figure 6. The model includes 1:1 complexes UKa, UKb and UKc corresponding to binding of DnaK at hTRF1 residues L31 (state “a”), L30 (state “b”) and V41 (state “c”), one 1:2 complex resulting from binding to V41 (UK2) and three 3:1 complexes U3Ka, U3Kb and U3Kc whose generation is contingent upon previous formation of UKa, UKb and UKc. The equilibrium constants for the formation of U3Ka, U3Kb and U3Kc from UKa, UKb and UKc, respectively, were set to be identical. In the model of Figure 6 DnaK is assumed to bind the unfolded and not the native state, though we do not have direct evidence for such a conformational‐selection mode of binding presently. However, this assumption is not required to obtain high quality fits of the data. E.coli DnaK is known to oligomerize18 through the binding of the linker of one monomer to the SBD of a second;19, 20 we have included this process in a simplistic manner by the DnaK dimerization scheme of Figure 6 (right) where the dimer is assumed not to bind client. It is possible that one of the monomers in a DnaK dimer (or several monomers in a DnaK oligomer) retains the ability to bind client protein. However, we do not have NMR spectral probes that can distinguish DnaK molecules based on their oligomerization status. To account for a fraction of DnaK molecules that are incapable of client binding in the oligomeric form of DnaK, we have employed an approximate model of DnaK dimerization where neither DnaK molecule in the dimer can interact with substrate.
Figure 6.
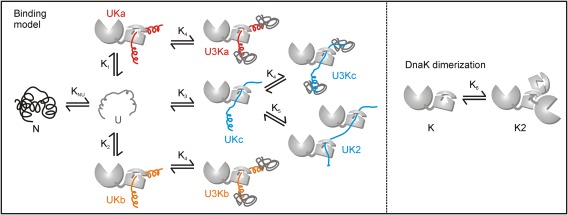
hTRF1‐DnaK binding model used to fit titration profiles, with association constants, Ki, listed. The value of KNU = [N]/[U] is kept constant at 22.7 9 during the fits. DnaK oligomerization is treated using a simple dimer model (right) where only the monomer is binding‐competent
Having constructed a binding model, we postulated that the intensities of correlations in the titration profiles are related to concentrations via
where i ∈ (a,b) and c 0, c 1, c 2, and c 3 are residue‐specific parameters accounting for noise in NMR spectra (c 0) and the proportionality between intensity and protein concentration (c 1,c 2,c 3), that additionally takes into account spin relaxation. Note that I 1i (states “a” and “b”) and I 2 (state “c”) include contributions from both UKi and U3Ki. Additionally, because the chemical shifts of V41c, I401c and I438c are assumed to be unchanged in monomeric (UKc) and dimeric (UK2) forms of the complex where V41 is centered at the DnaK binding site, the intensities of the peaks derived from state “c” (I 2) include a contribution from UK2. Note also that the concentration of the unbound, unfolded state is not relevant for the calculation of Ii values, above, because only the intensities of hTRF1 peaks far removed from the random coil region of the HMQC are included in the analysis. Finally, it is expected that the chemical shifts of methyl groups in any of the complexes will be different from those of N and thus IN values were calculated from a dependence on the concentration of N only.
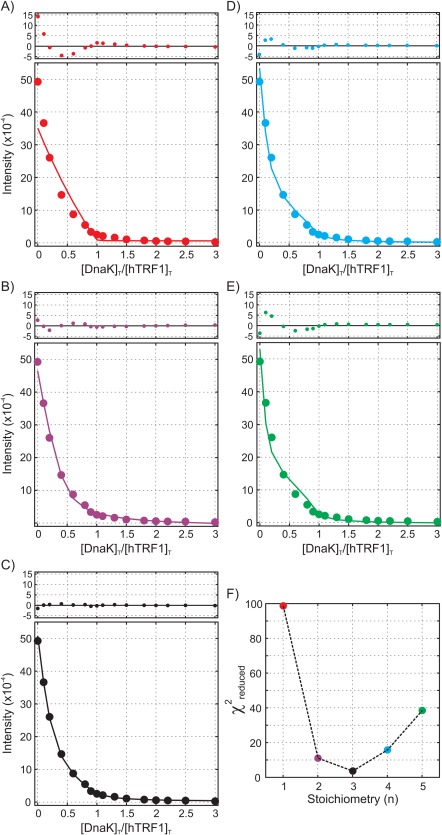
Global analysis of titration profiles
Using the model depicted in Figure 6, the titration profiles were analyzed globally with fits shown in Figure 7(A–D) and the changes in concentrations of key molecular species during the course of the titration are illustrated in Figure 7(E). The model reproduces the data well; the best fit χ2 red value of 3.6 likely reflects underestimates in the errors associated with measurement of the intensities. To estimate the reliability of the parameters resulting from the fit we constructed 1D χ2 red plots generated by keeping one of the six equilibrium constants fixed at a particular value during the fitting procedure (Fig. 8). Because of the difficulties with minimization of such a high dimensional target function a 6D χ2 red surface was initially constructed comprising 106 points by evaluating the χ2 red value at each point of a grid consisting of 10 values for each equilibrium constant (see Materials and Methods). Then in each 1D plot for which Ki was varied the remaining {Kj} j ≠ i values were minimized starting from initial values that produced the minimum in the 6D χ2 red surface for the chosen Ki value.
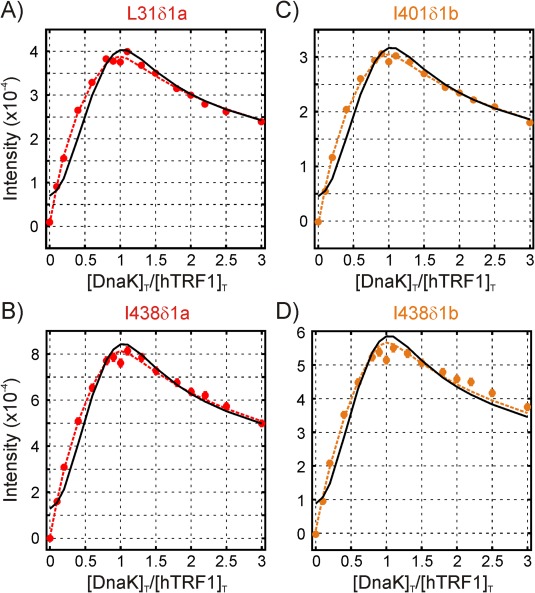
Figure 7.
A‐D) Titration profiles from residues in hTRF1 and DnaK (circles) along with fits (solid curves) to the model in Figure 6. Profiles in black are derived from native (unbound) hTRF1 peaks, while those in red/orange/blue are obtained from correlations originating from complexes (corresponding to states “a,” “b,” and “c”). The molecular species contributing to the intensities of each profile, I, are indicated in the equations in each panel. E) Concentrations of important molecular species as a function of [DnaK]T/[hTRF1]T obtained by numerical simulations using the model in Figure 6, and the equilibrium constants K1‐K6 obtained by fitting the 21 titration profiles to this model (K1 = 8.9 × 10⁴ mM−1, K2 = 3.2 × 10⁴ mM−1, K3 = 2.0 × 10⁴ mM−1, K4 = 1.2 × 10⁴ mM−2, K5 = 2.1 × 10² mM−1 and K6 = 3.1 × 10³ mM−1; note that only the value of K4 among the equilibrium constants K1‐K6 is robust, see Fig. 8)
Figure 8.
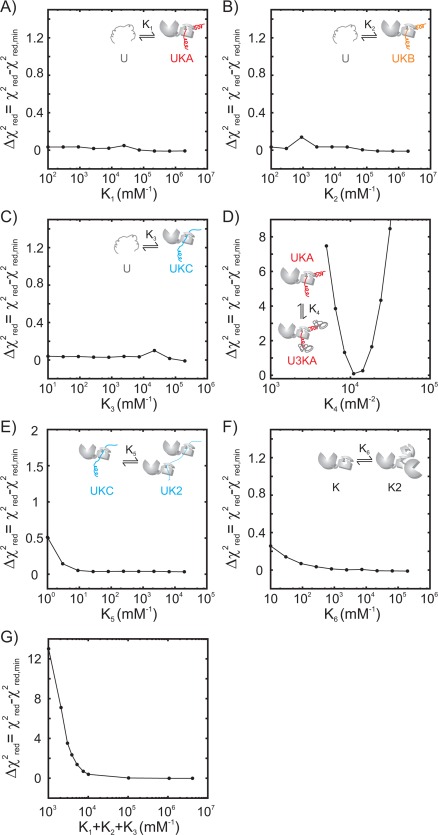
1D χ2 red surfaces for the six fitted equilibrium constants using the model of Figure 6 (A‐F) as well as for (K1+K2+K3) (G). Each surface is plotted as the difference between the χ2 red value at a particular fixed value of the equilibrium constant of interest and the χ2 red value for the fit where all equilibrium constants are floated, χ2 red,min
The χ2 red plots are flat for most of the equilibrium constants, implying that the values from the fit are not robust. However, a pronounced minimum in the χ2 red surface at a value of ∼10,000 mM−2 can be observed for K 4, the equilibrium constant for the formation of U3Ki from UKi. A lower bound can also be obtained for the sum of the association constants, K 1 + K 2 + K 3 (panel G of Fig. 8), ∼7000 mM−1. Assuming naively that K 1 K 2 K 3, the equilibrium constants for the dissociation of hTRF1 from DnaK are smaller than ∼0.5 μM. Given that the NMR titrations are performed at concentrations of hTRF1 and DnaK that are much larger than the involved dissociation constants, it is reasonable to expect that only a lower bound can be recovered for the affinity (Ki).
Although it is not possible to obtain individual Ki values from fits of the titration profiles, qualitative estimates for the ratio K 1/K 2 can nevertheless be obtained from inspection of the curves, under the assumption that the reporter spins in question have similar relaxation rates.11 From Eq. (2) above it follows that an estimate for K 1/K 2 ranges between ∼ 1.5 to ∼ 3, obtained by comparing maxima for profiles L31δ1a and L30δ1b; I401δ1a and I401δ1b; and I438δ1a and I438δ1b in Figure 7.
One of the important results from this study is the presence of additional structures beyond UKi and UK2, namely the 3:1 hTRF1‐DnaK complexes, as described above in the context of fits of the initial decay of hTRF1 N state peaks (Fig. 4). To assess whether the goodness of fit of the titration data (Fig. 7) is consistent with this interpretation we reanalyzed titration profiles from peaks reporting on states “a” and “b,” neglecting contributions from U3Ki,
As can be seen in Figure 9 the fits underestimate the experimental intensities at small [DnaK]T/[hTRF1]T ratios (black solid curves) suggesting the presence of other molecular species that are reporting on binding to states “a” and “b.” Notably, when the U3Ki species is included the fits become noticeably improved (red and orange solid curves).
Figure 9.
Fits of titration profiles for selected residues reporting on state “a” (A,B) or state “b” (C,D). The solid black curves are fits assuming that the intensity at each point depends only on the population of UKa or UKb, while the dashed red/orange curves include contributions from the populations of both UKa and U3Ka (A,B) or UKb and U3Kb (C,D)
In addition to the titration data obtained using hTRF1 as a DnaK substrate we have also recorded similar experiments with a small peptide, hTRF123–38, that includes Leu 30 and Leu 31 that are positioned centrally in the DnaK binding site (Fig. 10, Supporting Information Fig. S2). Notably, the decay of free peptide peaks with added DnaK is more gradual and in a manner that is now consistent with 1:1 binding (Fig. 10). Normalized intensity ratios for a pair of peaks derived from the unbound state as a function of [DnaK]T/[hTRF1]T, one for each of hTRF1 (blue) and hTRF123–38 (red), are shown (circles), along with curves based on fits using the model of Figure 6 (hTFR1) and a simplified model where N, UK2 and U3Ki are not included (hTRF123–38,), described in the legend to Figure 10. The excellent fits for data involving hTRF1 (blue) and hTRF123–38 (red), as well as the difference in the response of hTRF1 and hTRF123–38 to added DnaK, that is expected (see below), provide confidence in the model used for analysis and indicate that the peptide is incapable of forming complexes of the type U3Ki.
Figure 10.
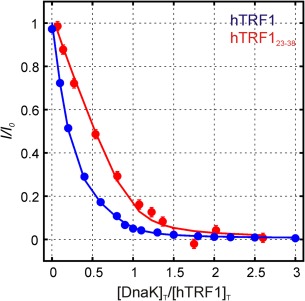
Normalized intensities, I/Io, vs [DnaK]T/[hTRF1]T for L43δ1 of native (unbound) hTRF1 (blue) and an unassigned resonance belonging to unbound hTRF123–38 peptide (red). Solid curves are derived from global fits of 21 titration profiles to the model in Figure 6 for hTRF1 and fits of 8 titration profiles to a reduced model that does not include 3:1 and 1:2 complexes (hTRF1:DnaK) or the native state for hTRF123–38 (the peptide is unfolded). For hTRF123–38 the decrease in peak intensity occurs at a rate equal to the rate of change of [DnaK]T/[hTRF1]T, while for hTRF1 the intensity drops much faster than the rate of change of [DnaK]T/[hTRF1]T
Discussion
A series of studies, using a variety of different approaches, has shown that DnaK chaperone‐substrate complexes can be heterogeneous,11, 21 due to the presence of several DnaK binding sites on a typical substrate22 as well as the ability of multiple DnaK molecules to associate with a single substrate chain.11, 23, 24, 25 Using NMR spectroscopy, we have previously established that DnaK binds a small 53 residue client, hTRF1, at multiple sites and with hTRF1:DnaK stoichiometries of either 1:1 or 1:2.11 In order to obtain a model that describes the binding of hTRF1 by DnaK we have recorded a titration profile whereby increasing amounts of DnaK are added to a solution of hTRF1, as described in Figure 3(A). Because molecular components were labeled distinctly it is possible to probe the binding interactions via both client and chaperone, using a large number of probes that report on different binding reactions. In this regard the NMR technique is extremely powerful because individual microscopic binding events can be followed independently, in the present case by focusing on peak intensities of residues that report on separate binding events (forming states “a,” “b,” and “c”).
A key result obtained from the combined analysis of the NMR‐based titration profiles is the formation of a substrate‐chaperone complex with 3:1 stoichiometry (Figs. 4 and 7), adding yet another layer to the heterogeneity of the hTRF1‐DnaK interaction. The model of Figure 6 shows 3:1 hTRF1‐DnaK complexes with DnaK bound to one of the three hTRF1 molecules in each complex at positions L30, L31 and V41. The other two hTRF1 molecules are assumed to interact with the bound hTRF1, as depicted in Figure 6 and described below. Since there are only 12 residues in hTRF1 downstream of the V41 binding site, it is conceivable that the U3Kc complex, as depicted in Figure 6, does not form because of steric constraints. However, excluding U3Kc from the model results in a poorer fitting of the first few points of the titration profiles for I438c, I401c and V41c (Supporting Information Fig. S1), suggesting that the 3:1 complex forms even when DnaK binds to V41. Thus, it is likely that the two hTRF1 molecules that are not directly bound to the substrate binding pocket in the U3Kc complex must either both interact with the N‐terminus of the bound hTRF1 molecule (see below), or, alternatively, that the 12 residues at the C‐terminus are sufficient for binding at least one hTRF1 as indicated in the cartoon in Figure 6.
Although analysis of the titration profiles does lead to a working model of the multiple binding reactions in solution, it does not reveal any of the structural features of the newly established 3:1 hTRF1‐DnaK complex. Some insight is obtained via a titration of DnaK with the hTRF123–38 peptide that includes the strongest DnaK binding site from the full‐length substrate. Notably, the initial rate of decrease of normalized unbound peaks is ∼1, as expected for a 1:1 complex, demonstrating that hTRF123–38 does not organize into a 3:1 substrate‐DnaK complex. The inability of hTRF123–38 to form a 3:1 complex indicates that the full‐length substrate is required (or at least a longer construct than the 16 residue peptide) and, further, that formation of the 3:1 structure for hTRF1 is not due to the availability of three substrate binding sites on DnaK.26 Rather the binding of the first molecule of DnaK to hTRF1 likely generates additional interaction motifs on hTRF1 by disrupting transient long‐range interactions in the globally unfolded state, resulting in the exposure of hydrophobic segments of the client that can then nucleate its association with other like‐molecules in solution. The possibility that binding of the first equivalent of hTRF1 to DnaK leads to changes in the conformation of the chaperone so that additional substrate molecules can then bind to it is unlikely, as there is little difference between DnaK spectra, free and hTRF1 bound, suggesting little change in DnaK structure.
The presence of a 3:1 substrate‐Hsp70 complex at equilibrium in solution suggests that Hsp70 has the ability to indirectly influence the conformation of substrate molecules to which it is not directly bound. This may be advantageous under conditions of heat shock where Hsp70 binds substrates stably because of the reversible unfolding of the nucleotide exchange factor GrpE and the inefficient conversion of DnaK from an ADP‐bound to an ATP‐bound state.27, 28 Retention of substrates by Hsp70 in a folding‐competent state thereby prevents their aggregation and enables them to refold once the stress is alleviated.29, 30, 31 However, the Hsp70 concentration in cells even under heat stress is expected to be considerably smaller than the total cytosolic protein concentration,32 and the formation of substoichiometric chaperone‐substrate complexes may be a mechanism that is used by Hsp70 to cope with an overload of unfolded proteins in the cell.
Materials and Methods
Sample preparation
Protein samples of hTRF1 and of E. coli DnaK were prepared as detailed previously.9 Overexpression was performed in BL21(DE3) cells grown in M9 D2O‐based minimal media supplemented with 1 g/L 15NH4Cl and 3 g/L [2H,12C]‐glucose as the only sources of nitrogen and carbon respectively. U‐2H, Ileδ1‐13CH3, Leu/Val‐13CH3/12CD3, Met‐13CH3‐ (ILVM‐13CH3‐) labeling was achieved following the procedures of Tugarinov et al.12 and Gelis et al.33 13CH3‐labeling at the Ileγ2 position was obtained following the protocol of Ruschak et al.34 NMR samples were 100% (vol/vol) D2O buffer (pH 8) containing 50 mM HEPES, 50 mM KCl, 5 mM MgCl2, 1 mM TCEP, 1 mM EDTA, 0.03% NaN3, and 5 mM ADP.
NMR spectroscopy and data analysis
All NMR spectra were acquired at 35°C using a Bruker Avance III HD 18.8 T (800 MHz 1H Larmor frequency) spectrometer equipped with a cryogenically cooled triple‐resonance probe. Spectra were processed using the NMRPipe35 software suite and visualized with Sparky.36 NMR titrations were performed as described in Results and intensities at each titration point were obtained by fitting peak lineshapes globally across all titration points using the software package FuDA (http://www.biochem.ucl.ac.uk/hansen/programs.html). Titration profiles were fit globally to various models of binding using an in‐house written software program (available upon request) that numerically solves the equilibrium and mass‐balance equations for a given model to arrive at concentrations of various molecular species at each titration point based on total DnaK ([DnaK]T) and hTRF1 ([hTRF1]T) concentrations. The folding equilibrium constant KUN = [N]/[U] was fixed at a value of 22.7 for all the fits based on previous measurements at 35°C.
Constructing a six‐dimensional χ2 red surface
A 6D χ2 red surface was constructed based on the final model shown in Figure 6. The grid for generating the surface comprised 106 points with 10 values for each of the six equilibrium association constants in the model, logarithmically spaced between the following ranges: K 1: (100–1,968,300) mM−1, K 2: (100–1,968,300) mM−1, K 3: (10–196,830) mM−1, K 4: (5000–53,022.5) mM−2, K 5: (1–19,683) mM−1, and K 6: (10–196,830) mM−1. At each point in the grid, titration profiles were fit to the model keeping all 6 equilibrium constants fixed to values at that grid point and floating only the residue‐specific parameters to obtain a χ2 red value.
Supporting information
Supporting Information
Acknowledgments
We thank Algirdas Velyvis for useful discussions. LEK hold a Canada Research Chair in Biochemistry. Computations necessary for generating the 6D χ2 red surface were performed on the GPC supercomputer at the SciNet HPC Consortium. SciNet37 is funded by: the Canada Foundation for Innovation under the auspices of Compute Canada; the Government of Ontario; Ontario Research Fund—Research Excellence; and the University of Toronto.
Lewis E. Kay is the winner of the 2017 Christian B. Anfinsen Award.
Contributor Information
Ashok Sekhar, Email: ashok.sekhar@utoronto.ca.
Lewis E. Kay, Email: kay@pound.med.utoronto.ca
References
- 1. Balchin D, Hayer‐Hartl M, Hartl FU (2016) In vivo aspects of protein folding and quality control. Science 353:aac4354. [DOI] [PubMed] [Google Scholar]
- 2. Mayer M, Bukau B (2005) Hsp70 chaperones: cellular functions and molecular mechanism. Cell Mol Life Sci 62:670–684. [DOI] [PMC free article] [PubMed] [Google Scholar]
- 3. Mayer MP (2013) Hsp70 chaperone dynamics and molecular mechanism. Trends Biochem Sci 38:507–514. [DOI] [PubMed] [Google Scholar]
- 4. Mayer MP, Rüdiger S, Bukau B (2000) Molecular basis for interactions of the DnaK chaperone with substrates. Biol Chem 381:877–885. [DOI] [PubMed] [Google Scholar]
- 5. Zhu X, Zhao X, Burkholder WF, Gragerov A, Ogata CM, Gottesman ME, Hendrickson WA. (1996) Structural analysis of substrate binding by the molecular chaperone DnaK. Science 272:1606–1614. [DOI] [PMC free article] [PubMed] [Google Scholar]
- 6. Zahn M, Berthold N, Kieslich B, Knappe D, Hoffmann R, Sträter N. (2013) Structural studies on the forward and reverse binding modes of peptides to the chaperone DnaK. J Mol Biol 425:2463–2479. [DOI] [PubMed] [Google Scholar]
- 7. Stevens SY, Cai S, Pellecchia M, Zuiderweg ER (2003) The solution structure of the bacterial HSP70 chaperone protein domain DnaK (393–507) in complex with the peptide NRLLLTG. Protein Sci 12:2588–2596. [DOI] [PMC free article] [PubMed] [Google Scholar]
- 8. Nishikawa T, Nagadoi A, Yoshimura S, Aimoto S, Nishimura Y (1998) Solution structure of the DNA‐binding domain of human telomeric protein, hTRF1. Structure 6:1057–1065. [DOI] [PubMed] [Google Scholar]
- 9. Sekhar A, Rosenzweig R, Bouvignies G, Kay LE (2015) Mapping the conformation of a client protein through the Hsp70 functional cycle. Proc Natl Acad Sci USA 112:10395–10400. [DOI] [PMC free article] [PubMed] [Google Scholar]
- 10. Sekhar A, Rosenzweig R, Bouvignies G, Kay LE (2016) Hsp70 biases the folding pathways of client proteins. Proc Natl Acad Sci USA 113:E2794–E2801. [DOI] [PMC free article] [PubMed] [Google Scholar]
- 11. Rosenzweig R, Sekhar A, Nagesh J, Kay LE (2017) Promiscuous binding by Hsp70 results in conformational heterogeneity and fuzzy chaperone‐substrate ensembles. eLife 6:e28030. [DOI] [PMC free article] [PubMed] [Google Scholar]
- 12. Tugarinov V, Kanelis V, Kay LE (2006) Isotope labeling strategies for the study of high‐molecular‐weight proteins by solution NMR spectroscopy. Nat Protoc 1:749–754. [DOI] [PubMed] [Google Scholar]
- 13. Kerfah R, Plevin MJ, Sounier R, Gans P, Boisbouvier J (2015) Methyl‐specific isotopic labeling: a molecular tool box for solution NMR studies of large proteins. Curr Opin Struct Biol 32:113–122. [DOI] [PubMed] [Google Scholar]
- 14. Tugarinov V, Hwang PM, Ollerenshaw JE, Kay LE (2003) Cross‐correlated relaxation enhanced 1H− 13C NMR spectroscopy of methyl groups in very high molecular weight proteins and protein complexes. J Am Chem Soc 125:10420–10428. [DOI] [PubMed] [Google Scholar]
- 15. Ollerenshaw JE, Tugarinov V, Kay LE (2003) Methyl TROSY: explanation and experimental verification. Magn Reson Chem 41:843–852. [Google Scholar]
- 16. Wiesner S, Sprangers R (2015) Methyl groups as NMR probes for biomolecular interactions. Curr Opin Struct Biol 35:60–67. [DOI] [PubMed] [Google Scholar]
- 17. Huang C, Kalodimos CG (2017) Structures of large protein complexes determined by nuclear magnetic resonance spectroscopy. Ann Rev Biophys 46:317–336. [DOI] [PubMed] [Google Scholar]
- 18. Schönfeld H‐J, Schmidt D, Schröder H, Bukau B (1995) The DnaK chaperone system of Escherichia coli: quaternary structures and interactions of the DnaK and GrpE components. J Biol Chem 270:2183–2189. [DOI] [PubMed] [Google Scholar]
- 19. Chang Y‐W, Sun Y‐J, Wang C, Hsiao C‐D (2008) Crystal structures of the 70‐kDa heat shock proteins in domain disjoining conformation. J Biol Chem 283:15502–15511. [DOI] [PMC free article] [PubMed] [Google Scholar]
- 20. Aprile FA, Dhulesia A, Stengel F, Roodveldt C, Benesch JL, Tortora P, Robinson CV, Salvatella X, Dobson CM, Cremades N. (2013) Hsp70 oligomerization is mediated by an interaction between the interdomain linker and the substrate‐binding domain. PloS One 8:e67961. [DOI] [PMC free article] [PubMed] [Google Scholar]
- 21. Lee JH, Zhang D, Hughes C, Okuno Y, Sekhar A, Cavagnero S. (2015) Heterogeneous binding of the SH3 client protein to the DnaK molecular chaperone. Proc Natl Acad Sci USA 112:E4206–E4215. [DOI] [PMC free article] [PubMed] [Google Scholar]
- 22. Rüdiger S, Germeroth L, Schneider‐Mergener J, Bukau B (1997) Substrate specificity of the DnaK chaperone determined by screening cellulose‐bound peptide libraries. EMBO J 16:1501–1507. [DOI] [PMC free article] [PubMed] [Google Scholar]
- 23. Szabo A, Langer T, Schröder H, Flanagan J, Bukau B, Hartl FU. (1994) The ATP hydrolysis‐dependent reaction cycle of the Escherichia coli Hsp70 system DnaK, DnaJ, and GrpE. Proc Natl Acad Sci USA 91:10345–10349. [DOI] [PMC free article] [PubMed] [Google Scholar]
- 24. Han W, Christen P (2003) Mechanism of the targeting action of DnaJ in the DnaK molecular chaperone system. J Biol Chem 278:19038–19043. [DOI] [PubMed] [Google Scholar]
- 25. Kellner R, Hofmann H, Barducci A, Wunderlich B, Nettels D, Schuler B. (2014) Single‐molecule spectroscopy reveals chaperone‐mediated expansion of substrate protein. Proc Natl Acad Sci USA 111:13355–13360. [DOI] [PMC free article] [PubMed] [Google Scholar]
- 26. Smock RG, Blackburn ME, Gierasch LM (2011) Conserved, disordered C terminus of DnaK enhances cellular survival upon stress and DnaK in vitro chaperone activity. J Biol Chem 268:31821–31829. [DOI] [PMC free article] [PubMed] [Google Scholar]
- 27. Grimshaw JP, Jelesarov I, Schönfeld H‐J, Christen P (2001) Reversible thermal transition in GrpE, the nucleotide exchange factor of the DnaK heat‐shock system. J Biol Chem 276:6098–6104. [DOI] [PubMed] [Google Scholar]
- 28. Grimshaw JP, Jelesarov I, Siegenthaler RK, Christen P (2003) Thermosensor action of GrpE: The DnaK chaperone system at heat shock temperatures. J Biol Chem 278:19048–19053. [DOI] [PubMed] [Google Scholar]
- 29. Schröder H, Langer T, Hartl F, Bukau B (1993) DnaK, DnaJ and GrpE form a cellular chaperone machinery capable of repairing heat‐induced protein damage. EMBO J 12:4137. [DOI] [PMC free article] [PubMed] [Google Scholar]
- 30. Diamant S, Goloubinoff P (1998) Temperature‐controlled activity of DnaK− DnaJ− GrpE chaperones: Protein‐folding arrest and recovery during and after heat shock depends on the substrate protein and the GrpE concentration. Biochemistry 37:9688–9694. [DOI] [PubMed] [Google Scholar]
- 31. Manukhov IV, Eroshnikov GE, Vyssokikh MY, Zavilgelsky GB (1999) Folding and refolding of thermolabile and thermostable bacterial luciferases: the role of DnaKJ heat‐shock proteins. FEBS Lett 448:265–268. [DOI] [PubMed] [Google Scholar]
- 32. Mogk A, Tomoyasu T, Goloubinoff P, Rüdiger S, Röder D, Langen H, Bukau B. (1999) Identification of thermolabile Escherichia coli proteins: prevention and reversion of aggregation by DnaK and ClpB. EMBO J 18:6934–6949. [DOI] [PMC free article] [PubMed] [Google Scholar]
- 33. Gelis I, Bonvin AM, Keramisanou D, Koukaki M, Gouridis G, Karamanou S, Economou A, Kalodimos CG. (2007) Structural basis for signal‐sequence recognition by the translocase motor SecA as determined by NMR. Cell 131:756–769. [DOI] [PMC free article] [PubMed] [Google Scholar]
- 34. Ruschak AM, Velyvis A, Kay LE (2010) A simple strategy for 13C, 1H labeling at the Ile‐γ2 methyl position in highly deuterated proteins. J Biomol NMR 48:129–135. [DOI] [PubMed] [Google Scholar]
- 35. Delaglio F, Grzesiek S, Vuister GW, Zhu G, Pfeifer J, Bax A. (1995) NMRPipe: a multidimensional spectral processing system based on UNIX pipes. J Biomol NMR 6:277–293. [DOI] [PubMed] [Google Scholar]
- 36. Goddard T, Kneller D (2006) Sparky—NMR assignment and integration software. San Francisco: University of California. [Google Scholar]
- 37. Loken C, Gruner D, Groer L, Peltier R, Bunn N, Craig M, Henriques T, Dempsey J, Yu C‐H, Chen J, Dursi LJ, Chong J, Northrup S, Pinto J, Knecht N, Zon RV (2010) SciNet: lessons learned from building a power‐efficient top‐20 system and data centre. J Phys: Conference Series 012026 (IOP Publishing). [Google Scholar]
Associated Data
This section collects any data citations, data availability statements, or supplementary materials included in this article.
Supplementary Materials
Supporting Information