

Abstract
BRCA1-associated protein 1 (BAP1) is a potent tumor suppressor gene that modulates environmental carcinogenesis1-3. All carriers of inherited heterozygous germline BAP1 inactivating mutations (BAP1+/-) developed one and often several BAP1-/- malignancies in their lifetime4, mostly malignant mesothelioma (MM), uveal melanoma (UVM)2,5, etc6-10. Moreover, BAP1 acquired biallelic mutations are frequent in human cancers8,11-14. BAP1 tumor suppressor activity has been attributed to its nuclear localization where BAP1 helps maintaining genome integrity15-17. The possible activity of BAP1 in the cytoplasm was unknown. Cells with reduced levels of BAP1 exhibit chromosomal abnormalities and decreased DNA repair by homologous recombination18, indicating that BAP1 dosage is critical. Cells with extensive DNA damage should die and not grow into malignancies. We discovered that BAP1 localizes at the endoplasmic reticulum (ER). Here BAP1 binds, deubiquitylates and stabilizes type-3 inositol-1,4,5-trisphosphate-receptor (IP3R3), modulating calcium (Ca2+) release from the ER into the cytosol and mitochondria, promoting apoptosis. Reduced levels of BAP1 in BAP1+/- carriers caused reduction of both IP3R3 levels and Ca2+ flux, preventing BAP1+/- cells that had accumulated DNA damage from executing apoptosis. A higher fraction of cells exposed to either ionizing or ultraviolet radiation, or to asbestos, survived genotoxic stress resulting in a higher rate of cellular transformation. We propose that the high incidence of cancers in BAP1+/- carriers results from the combined reduced nuclear and cytoplasmic BAP1 activities. Our data provide a mechanistic rationale for the powerful ability of BAP1 to regulate gene-environment interaction.
BAP1 is a member of the ubiquitin C-terminal hydrolase (UCH) subfamily of deubiquitylating enzymes2. The ubiquitin-conjugating enzyme UBE2O induces BAP1 sequestration in the cytoplasm by multi-monoubiquitylation of its nuclear localization signal (NLS). BAP1 counteracts this mechanism and regulates its own nuclear translocation by intra-molecular auto-deubiquitylation of the same sites19. Since there is a well-established mechanism to keep BAP1 in the cytoplasm, BAP1 may exert also some cytoplasmic activity. We tested this hypothesis in primary fibroblasts we derived from skin punch biopsies from members of the W and L families, in which we originally discovered that BAP1 mutations caused a novel cancer syndrome, the “BAP1 cancer syndrome”2,5.
About 50% of the W and L family members inherited BAP1 mutations2,5. We established fibroblast cell cultures from 7 BAP1+/- carriers and from 7 age and gender-matched wild-type BAP1 (BAP1WT) control family members (Supplementary Fig. 1a, b). Therefore, one of the main strengths of our data is that they are specific to the human condition and cannot be influenced by factors other than the reduced levels of BAP1 such as, for example, the many genetic mutations that are found in all tumor derived cell lines. Cells from BAP1+/- carriers contained ∼50% of BAP1 protein compared to controls (Extended Data Fig. 1a-d) and did not show any differences in growth or cell cycle progression (Extended Data Fig. 1e, f).
Annexin V and propidium iodide (PI) staining, and Western blot (WB) measuring cleaved caspase-3 levels, revealed that 7/7 BAP1+/- fibroblast cell cultures were more resistant to various apoptotic drugs compared to 7 matched BAP1WT fibroblast cell cultures (Fig. 1a, b and Extended Data Fig. 1g-l). We obtained similar results by down-regulating BAP1, in BAP1WT primary human mesothelial cells (HM) (Extended Data Fig. 1m).
Figure 1. BAP1 localizes at the ER and modulates Ca2+ signaling and apoptosis.
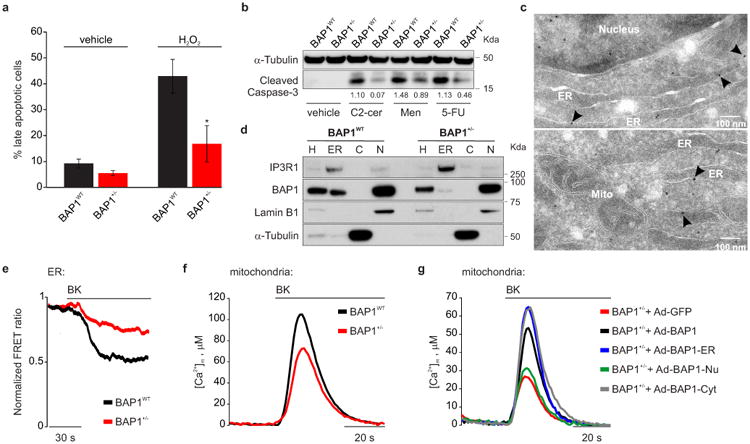
a, Reduced apoptosis in BAP1+/- L-fibroblasts treated with 100 μM H2O2, or b, with 10 μM C2-ceramide (C2-cer), 10 μM menadione (Men), 10 μM 5-fluorouracile (5-FU). Decimals: cleaved caspase-3/α-Tubulin. a, Data shown as mean ± s.e.m. of n = 4 independent experiments (3 biological replicates, 1 culture replicate) with pooled analysis displayed. P value calculated using two-tailed unpaired Student's t-test, * P < 0.05. c, d, BAP1 localizes at the ER. c, EM, immunogold labeling of BAP1WT fibroblasts; arrowheads, ER localized BAP1. Mito, mitochondria, scale-bar 100 nm. d, Subcellular fractionation: ER BAP1 levels. H: homogenate; C: cytosol; N: nuclei. Markers: ER (IP3R1), nuclei (Lamin B1), cytosol (α-Tubulin). e-g, BAP1+/- L-fibroblasts stimulated with 1 μM bradykinin (BK) show reduced ER Ca2+ release (e) and mitochondrial Ca2+ concentrations ([Ca2+]m) (f). g, Cytoplasmic- and ER-targeted BAP1 (Ad-BAP1-Cyt and Ad-BAP1-ER) restore [Ca2+]m to levels similar or higher than BAP1+/- fibroblasts transduced with BAP1 (Ad-BAP1), nuclear BAP1 (Ad-BAP1-Nu) does not. e-g, Source data, see Supplementary Table 1, 2. WB and EM source images, see Supplementary Fig. 2, 3.
Although all known activities of BAP1 have been ascribed to its nuclear localization2, apoptosis is a process largely regulated in the cytoplasm. Subcellular fractionation of primary BAP1WT fibroblasts, HM, cells of the MM cell lines PPM-Mill, and HEK-293 (Extended Data Fig. 2a), revealed that extra-nuclear BAP1 was specifically present in the ER fraction, findings confirmed by electron microscopy (EM, Fig. 1c) and immunofluorescence (IF) (Extended Data Fig. 2b-e). BAP1 ER levels were reduced more than nuclear levels in BAP1+/- fibroblasts (Fig. 1d, and Extended Data Fig. 2f-h).
The ER is the major store of intracellular Ca2+ 20,21. IP3Rs are ER channels that control Ca2+ release from the ER to the cytoplasm and the mitochondria22,23. Transient Ca2+ release promotes mitochondrial ATP production; excessive or prolonged Ca2+ release triggers apoptosis via mitochondrial Ca2+ overload and opening of the mitochondrial permeability transition pore24. The drugs shown in Fig. 1a, b and Extended Data Fig. 1g-m induce apoptosis via ER-Ca2+ release25. We hypothesized that BAP1 was involved in the regulation of intracellular Ca2+ homeostasis. We transfected BAP1+/- and BAP1WT fibroblasts with ER targeted cameleon (D1ER), a fluorescent probe to measure Ca2+ concentrations23. Cells were stimulated with bradykinin (BK), an agonist that causes ER Ca2+ release through the IP3Rs, or with H2O2. Compared to WT, BAP1+/- fibroblasts released lower amounts of Ca2+ from the ER (Fig. 1e, Extended Data Fig. 3a-c and Supplementary Table 1), findings suggestive of reduced flow of Ca2+ through the IP3Rs. Accordingly, we detected lower Ca2+ concentrations in the cytosol and the mitochondrial matrix of BAP1+/- compared to BAP1WT fibroblasts stimulated with BK (Fig. 1f, Extended Data Fig. 3d-g, and Supplementary Table 1, 2) or H2O2 (Extended Data Fig. 3h-m, and Supplementary Table 1, 2), independently of extracellular Ca2+ influx from the plasma membrane (Extended Data Fig. 3n and Supplementary Table 1). The results were reproducible in all 7 BAP1+/- and 7 matching BAP1WT fibroblasts studied, as well as in 3 cell cultures of primary HM cells in which BAP1 was silenced (Extended Data Fig. 3o, p and Supplementary Table 2). We obtained similar results in mice adult fibroblasts (MAF) we derived from Bap1+/- mice3 compared to Bap1WT mice (Extended Data Fig. 3q, r and Supplementary Table 2).
To test if cytoplasmic BAP1 modulates Ca2+ fluxes independently from nuclear BAP1, we built 3 adenoviral chimeras that specifically localize BAP1 to the nucleus (BAP1-Nu), the cytoplasm (BAP1-Cyt), and the outer surface of the ER (BAP1-ER), (Extended Data Fig. 4a): only the cytoplasmic and ER chimeras regulated Ca2+ changes (Fig. 1g, Extended Data Fig. 4b and Supplementary Table 1, 2).
IP3Rs can be rapidly ubiquitylated and degraded by the proteasome26. Fibroblasts from BAP1+/- donors contained reduced IP3R3 protein levels (the isoform that controls apoptosis27) compared to BAP1WT (Fig. 2a, b and Extended Data Fig. 5a-c). Similarly, human MM cells with mutated BAP1 (>60% of sporadic MM carry somatic BAP1 mutations11,14) contained reduced levels of IP3R3 (Extended Data Fig. 5d). IP3R3 mRNA (ITPR3) levels measured by qRT-PCR were similar in BAP1WT and BAP1+/- fibroblasts (Extended Data Fig. 5e), suggesting that the differences observed were not transcriptionally regulated. We hypothesized that BAP1 might deubiquitylate and stabilize IP3R3. We found that IP3R3 co-immunoprecipitates (CoIP) BAP1 (Fig. 2c), findings supported by proximity ligation assay (PLA) (Fig. 2d) and IF (Extended Data Fig. 6a). BAP1-IP3R3 CoIP was barely detectable in BAP1+/- fibroblasts; BAP1 rescue significantly increased the amount of BAP1 that CoIP with IP3R3 (Fig. 2e). We confirmed the specificity of the BAP1 interaction with IP3R3 in HEK-293 cells expressing FLAG-BAP1 (Extended Data Fig. 6b). Instead, overexpression of the Myc-tagged truncated BAP1 L-mutant [Myc-BAP1(L)] (the L-family mutant BAP1 which lacks the N-terminus domain5) showed an almost complete loss of interaction with IP3R3 compared to Myc-tagged WT BAP1 (Myc-BAP1) (Fig. 2f), while catalytic inactive BAP1(C91S)2,19 did bind IP3R3 (Extended Data Fig. 6c). We found that BAP1 binds the N-terminus domain of IP3R3 [IP3R3(NT)] (Fig. 2g). Deletion fragments of BAP1 revealed that its catalytic domain (UCH) does not bind IP3R3(NT), while its middle portion (NORS) and, to a minor extent, the C-terminal portion (CTD, NLS) do (Extended Data Figure 6e, f). Overexpression of the N-terminus of the IP3R3 binds and sequesters BAP1 leading to decreased IP3R3 levels, an effect counter-balanced by BAP1 co-overexpression (Extended Data Fig. 6d).
Figure 2. IP3R3 and BAP1 interaction.
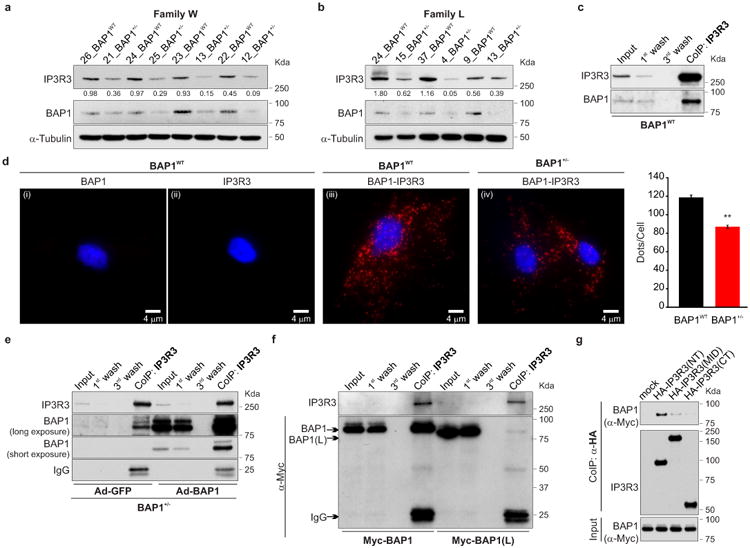
a, b, WB, reduced IP3R3 levels in BAP1+/- fibroblasts. Decimals: IP3R3/α-Tubulin. c-g, BAP1-IP3R3 interaction. c, CoIP of IP3R3-BAP1, BAP1WT fibroblasts. d, PLA, red dots show IP3R3-BAP1 interaction in BAP1WT (iii) and BAP1+/- (iv) fibroblasts; (i, ii), controls using only one antibody. Nuclei stained blue with DAPI. Scale-bar, 4 μm. Bar-graph: quantification of PLA red dots/cells showing reduced IP3R3-BAP1 interaction in BAP1+/- fibroblasts. Data shown as mean ± s.e.m. (n = 11 cells per condition). P value calculated using two-tailed unpaired Student's t-test, ** P<0.01. e, CoIP of IP3R3-BAP1 in BAP1+/- fibroblasts transduced with Ad-GFP or Ad-BAP1. f, CoIP of IP3R3-BAP1 in HEK-293 transfected with Myc-tagged WT BAP1; no CoIP with truncated BAP1(L). g, BAP1 binds the IP3R3 N-terminus. CoIP of IP3R3-BAP1 in HEK-293 co-transfected with Myc-tagged BAP1 and HA-tagged IP3R3 deletion mutants [(NT, aa 1-800), (MID, aa 801-2230), (CT, aa 2180-2670]. 1st and 3rd wash lanes show progressive loss of bound proteins during sequential washes confirming specificity of CoIP. WB source images, see Supplementary Fig. 2.
Silencing of BAP1 in BAP1WT fibroblasts consistently caused a reduction of IP3R3 protein levels (Extended Data Fig. 7a), with concomitant reduction of mitochondrial Ca2+ responses (Extended Data Fig. 7b, c, and Supplementary Table 1, 2), and protection from apoptosis (Extended Data Fig. 7d). Likewise, silencing of IP3R3 (Extended Data Fig. 7e) in BAP1WT fibroblasts reduced mitochondrial Ca2+ concentration (Extended Data Fig. 7f, g and Supplementary Table 1, 2) and apoptosis (Extended Data Fig. 7h). Similar results were obtained in HM (Extended Data Fig. 7i, j and Supplementary Table 2). Transduction of BAP1+/- fibroblasts with adenoviruses encoding BAP1, but not the catalytic inactive mutant BAP1(C91S)2,19, rescued IP3R3 protein levels (Fig. 3a), mitochondrial Ca2+ uptake (Fig. 3b, Extended Data Fig. 8j, Supplementary Table 1, 2) and resulted in enhanced apoptosis (Fig. 3c). Similar results were obtained in Phi and HMESO cells, BAP1-/- MM cell lines in which we reintroduced BAP1 or BAP1(C91S), and in HM in which we silenced BAP1 and then re-introduced BAP1 or BAP1(C91S). BAP1 stabilized IP3R3 and increased mitochondrial Ca2+ concentrations and apoptosis; BAP1(C91S) did not (Extended Data Fig. 8a-h and Supplementary Table 2). Moreover, in contrast to BAP1, mutated BAP1(W) and BAP1(L), did not influence [Ca2+]m following 1 μM BK stimulation (Extended Data Fig. 8i, and Supplementary Table 2).
Figure 3. BAP1 deubiquitylates IP3R3.
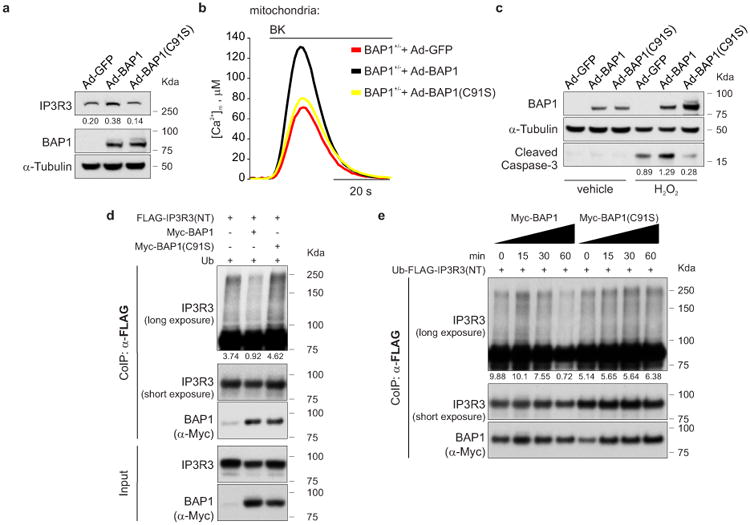
a-c, BAP1 WT, not catalytic inactive BAP1(C91S), (a) stabilizes IP3R3, (b) increases [Ca2+]m following 1 μM BK stimulation and (c) apoptosis. Decimals: IP3R3 or cleaved caspase-3/α-Tubulin. d, Ubiquitylation assay: BAP1 WT, not BAP1(C91S), deubiquitylates the IP3R3 N-terminus. HEK-293 co-transfected with FLAG-IP3R3(NT) and either Myc-BAP1, Myc-BAP1(C91S) or empty vector. Ub, Ubiquitin. e, Ubiquitylation/deubiquitylation assay. Immunopurified Myc-BAP1 or catalytically inactive Myc-BAP1(C91S) were incubated in vitro with ubiquitylated FLAG-IP3R3(NT), followed by WB. The ladder corresponds to ubiquitylated IP3R3(NT). Decimals: ubiquitylated IP3R3(NT) normalized to total immunoprecipitated IP3R3(NT) at 90 KDa (short exposure). WB source images, see Supplementary Fig. 2. b, Source data, see Supplementary Table 2.
In vitro ubiquitylation assays using purified recombinant proteins revealed that BAP1 counteracts the ubiquitylation of IP3R3(NT) (Fig. 3d). The in vitro deubiquitylating activity of BAP1 on IP3R3(NT) became detectable 30 minutes after adding BAP1 to the reaction, and was stronger at 60 minutes (Fig. 3e). BAP1(C91S), despite being able to bind IP3R3 (Extended Data Fig. 6c), failed to deubiquitylate IP3R3(NT) (Fig. 3d, e and Extended Data Fig. 8k, l), underscoring the requirement of BAP1 catalytic activity.
Comet assays showed that BAP1+/- fibroblasts had a reduced ability to repair DNA damage following exposure to ionizing radiation (IR) (Fig. 4a and Extended Data Fig. 9a), findings supported by kinetics analyses showing a prolonged phosphorylation of γ-H2A.X indicating that DNA repair was delayed (Fig. 4b). In spite of the reduced ability of BAP1+/- cells to repair IR-induced DNA damage, clonogenic assays revealed increased survival of BAP1+/- cells compared to BAP1WT following IR (Fig. 4c and Extended Data Fig. 9b). Moreover, ultraviolet radiation, UVA and UVB (UVB is a more potent carcinogen than UVA) induced ER Ca2+ release, was significantly impaired in BAP1+/- fibroblasts (Extended Data Fig. 9c-e), and UVB induced prolonged phosphorylation of γ-H2A.X (Extended Data Fig. 9f). Clonogenic assays in fibroblasts from BAP1+/- individuals and matched controls, exposed to UVA or UVB, revealed a reproducible significant increase of colony formation in BAP1+/- fibroblasts (24% increase UVA, and 132% UVB) (Fig. 4d, e, and Extended Data Fig. 9g).
Figure 4. Reduced nuclear and cytoplasmic BAP1 levels increase survival from DNA damage, resistance to apoptosis and foci formation.
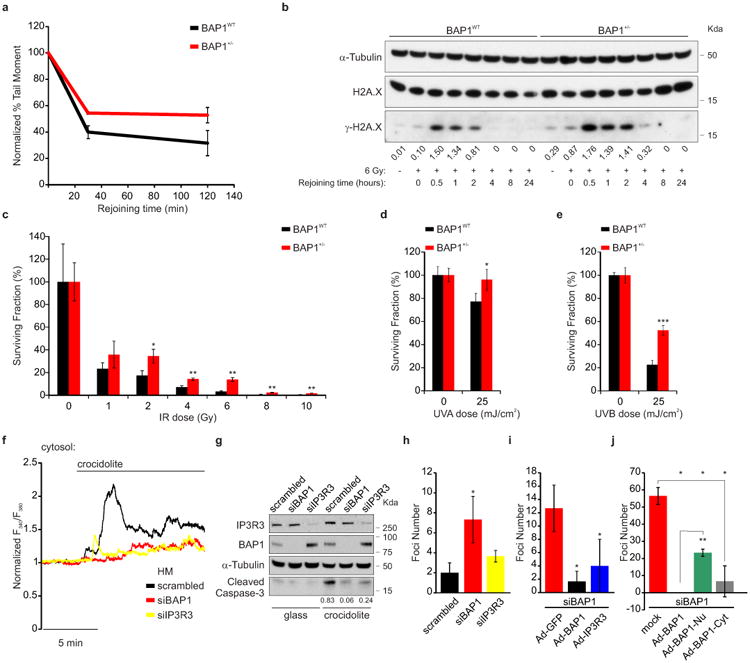
a-c, Reduced (a, comet assay), delayed (b, γ-H2A.X kinetics) DNA repair, and increased survival (c, clonogenic assays) in BAP1+/- fibroblasts following IR. Decimals: γ-H2A.X/H2A.X. a, n = 2 biological replicates with pooled analysis displayed, representative of three independent experiments. a, c, See Extended Data Fig. 9a, b. b, WB source images, see Supplementary Fig. 2. d, e, Clonogenic assays: increased survival of BAP1+/- fibroblasts following 25 mJ/cm2 UVA (d) or UVB (e) radiation; see Extended Data Fig. 9g. f, ER Ca2+ release in primary HM exposed to asbestos and transfected with siBAP1 or siIP3R3, or scrambled (see Extended Data Fig. 10a); source data, see Supplementary Table 1. g, Reduced apoptosis in HM silenced for either BAP1 or IP3R3 exposed to asbestos. WB comparing cleaved caspase-3 levels (see Extended Data Fig. 10b). Decimals: cleaved caspase-3/α-Tubulin. h-j, Cytoplasmic BAP1 and IP3R3 levels influence foci formation in HM exposed to asbestos. Foci formation in HM silenced with scrambled, siBAP1 and siIP3R3 (h); HM silenced for BAP1 and transduced with Ad-GFP (control), Ad-BAP1, and Ad-IP3R3 (i); and HM silenced for BAP1 and transduced with Ad-BAP1, Ad-BAP1-Nu and Ad-BAP1-Cyt (j). c, d, e, h, i, j, n = 3 culture replicates, representative of three (c, e, h, i) or two (d, j) independent experiments in biological replicates. Data shown as mean ± s.d. P value calculated using two-tailed unpaired Student's t-tests. *, P<0.05; **, P<0.01; ***, P<0.001.
Moreover, we discovered that crocidolite asbestos increases intracellular Ca2+ concentrations (Fig. 4f, Extended Data Fig. 10a and Supplementary Table 1) and apoptosis (Fig. 4g and Extended Data Fig. 10b). HM silenced for either BAP1 or IP3R3 and exposed to crocidolite, displayed reduced intracellular Ca2+ concentrations (Fig. 4f, Extended Data Fig. 10a and Supplementary Table 1) and were resistant to apoptosis (Fig. 4g, Extended Data Fig. 10b). Similar results were obtained in THP-1, a human monocytic cell line in which we down-regulated BAP1 with siRNAs, underscoring the general relevance of this mechanism (Extended Data Fig. 10c-e, and Supplementary Table 2). We used an established protocol in which primary HM exposed to crocidolite in the presence of TNF-α undergo in vitro transformation, which is measured as formation of tridimensional foci28. HM treated with siBAP1 and exposed to crocidolite showed a significant increase in foci formation (Fig. 4h). Silencing of IP3R3 was less effective in increasing foci formation compared to BAP1 silencing, indicating that both nuclear and cytoplasmic BAP1 act in concert to prevent malignant transformation (Fig. 4h). Moreover, transduction of either BAP1 or IP3R3 in HM silenced for BAP1 significantly reduced foci formation (Fig. 4i). To test the independent contribution of cytoplasmic and nuclear BAP1 to cellular transformation, we silenced BAP1 and then infected HM with the BAP1 chimeras (Extended Data Fig. 4a). Transduction with BAP1-Cyt that specifically localizes to the cytoplasm where it modulates intracellular Ca2+ fluxes (Fig. 1g), significantly reduced foci formation to levels similar to those obtained using BAP1 (Fig. 4j). Cells infected with BAP1-Nu which localizes only to the nucleus, showed reduced foci formation although the reduction was significantly less than cells infected with BAP1 (Fig. 4j).
It is unlikely that mutated cytoplasmic BAP1 contributed to some of the biological effects observed. With one single exception in one case of UVM, all BAP1 mutations described impair the ability of BAP1 to translocate into the nucleus, either because the NLS is deleted, as in the L and W BAP1+/- fibroblasts studied here, or because the catalytic domain is inactive8,11-14, 19. Mutated cytoplasmic BAP1 forms amyloid-like aggregates and is biologically inactive29, although it may be detectable by immunostaining2,5,11. In the W and L cells, truncation removes a critical domain for the interaction with IP3R3 (Fig. 2f). Accordingly, mutated W and L BAP1 did not influence Ca2+ signaling (Extended Data Fig. 8i, and Supplementary Table 2).
In summary, we discovered that in the cytoplasm BAP1 localizes at the ER, where it binds, deubiquitylates and stabilizes IP3R3, thus regulating ER Ca2+ release and promoting apoptosis. Decreased levels of BAP1 lead to enhanced DNA damage (due to decreased nuclear BAP1 activity), reduced apoptosis (due to decreased cytoplasmic BAP1 activity) and increased cellular transformation (due to both, decreased nuclear and cytoplasmic activities). The separate activities of BAP1 in the nucleus and cytoplasm provide a mechanistic rationale for the strong tumor suppressor activity of this deubiquitylase. Our data suggest that the reduced levels of BAP1 result in a tumor phenotype prevalently under genotoxic/stress conditions (gene-environment interaction). Accordingly, 70% of BAP1+/- heterozygous mice developed MM within a year when exposed to asbestos, and none of the non-exposed BAP1+/- mice developed MM during the same period of time3. Although almost any tumor type has been reported in carriers of germline BAP1 mutations1,2,4-10, there is a prevalence of MM, often caused by asbestos, and of melanomas and skin cancers, often caused by UV radiation4. These two environmental carcinogens induce DNA damage and cell death. The balance between DNA damage and cell death determines the outcome: the more DNA-damaged cells survive exposure, the higher the risk that one of them may grow into a malignancy. It is possible that the malignancies more frequently associated with the BAP1 cancer syndrome arise from tissues in which Ca2+-induced apoptosis plays a critical role in cellular transformation.
Our findings 1) reveal the relevance of post translational modifications in modulating gene-environment interactions in human carcinogenesis, 2) are relevant to understanding the high incidence of environmentally related cancers in carriers of germline BAP1 mutations, and 3) provide novel targets for the numerous human malignancies that carry acquired and inherited BAP1 mutations2,5-13,30.
Methods
Subjects
BAP1+/- mutant carriers and unaffected controls were recruited from the L and W families; they donated the skin biopsies from which we derived the fibroblast cell cultures studied here. In previous studies we demonstrated that ∼50% of L and W family members inherited heterozygous BAP1 mutations5. Except for being adult members of these 2 families, no other predefined inclusion/exclusion criteria were applied. Written informed consent was received from all participants (BAP1+/- mutant carriers, and gender and age matched unaffected family members). Collection and use of patient information and samples were approved by the Institutional Review Board (IRB) of the University of Hawaii (IRB no.14406). Germline BAP1 sequencing was conducted on genomic DNA extracted from peripheral blood using standard methods and analyzed using bidirectional sequencing of the BAP1 gene in the Hawaii Cancer Consortium Queen Medical Center CLIA/CAP certified laboratory, as described5. Fourteen family members (7 BAP1WT and 7 BAP1+/-) volunteered their skin biopsies for these studies and they were matched by gender and age. Assuming a two-tailed Type I error rate (alpha) equal to 0.05 and seven observations per group (14 total), we had 80 % power to detect a standardized difference equal to 1.8. Since we found a statistical difference, we had sufficient power to detect a pre-specified effect size.
Primary cultures of human dermal fibroblasts were established in tissue culture from biopsies of sun-protected forearm skin from donors of different gender and age. Biopsies were taken using a 5 mm punch (Schuco) on skin site previously disinfected and anesthetized31.
Cell cultures
We derived human dermal skin fibroblasts from explants of skin biopsies from four BAP1WT and four BAP1+/- Wisconsin (W) family members, and three BAP1WT and three BAP1+/- Louisiana (L) family members. Fibroblasts were grown from these skin explants and cultured in Dulbecco modified Eagle's medium (DMEM) with glucose (4.5 g/l), 2 mM L-glutamine, without sodium pyruvate (Corning Cellgro), supplemented with 10% (v/v) fetal bovine serum (FBS) (Gibco) and 1% Penicillin-Streptomycin (PS)31. All the experiments were performed on fibroblasts between tissue culture passages 7 and 15. Primary human mesothelial cells (HM): we routinely establish HM in tissue culture from pleural fluids that accumulate in individuals with congestive heart failure or other non-malignant conditions, who provided written informed consent. HM are characterized by immunohistochemistry and cultured in DMEM with 20% FBS, as previously described32. Independent HM cultures from three different donors between tissue culture passages 4-5 were used in the experiments described here; each experiment for each of these HM cell cultures was conducted in triplicate. MM cell lines: PPM-Mill, Phi, HMESO, Rob33 (established and provided by Dr. Harvey I. Pass), and human embryonic kidney cells (HEK-293, provided by Dr. Paolo Pinton) were grown in DMEM supplemented with 10% FBS and 1% PS. HMESO stable clones were generated as described below (see “Gene silencing with siRNA, adenovirus-mediated gene transfer and transfection”), and grown in DMEM with glucose (4.5 g/l), 2 mM L-glutamine, without sodium pyruvate (Corning Cellgro), supplemented with 10% (v/v) FBS (Gibco), 1% PS and 0.5 mg/ml G418 (Geneticin). THP-1 cells (human monocytic cell line from acute monocytic leukemia,) were obtained from ATCC and cultured in RPMI-1640 Medium (Corning Cellgro) supplemented with 10% (v/v) FBS (Gibco) and 1% PS; treatment with 20 μM 12-O-Tetradecanoylphorbol 13-acetate (TPA) for 24 hours was performed to induce monocytes differentiation into macrophages34. Mouse adult fibroblasts (MAF) cell cultures were derived from 3-month-old Bap1WT and Bap1+/- mice35 genotyped as described35; MAFs were grown in DMEM supplemented with 10% FBS and 1% PS. Cells were cultured in a humidified atmosphere of 5% (v/v) carbon dioxide in air at 37 °C. All cells used in the experiments reported here were routinely tested for mycoplasma contamination (about once a month) using LookOut Mycoplasma PCR Detection Kit (Sigma-Aldrich, cat no. MP0035) and were confirmed to be mycoplasma-free.
All main experiments were conducted in primary cells from human volunteers (fibroblasts and HM). Therefore, the results are related to the reduced levels of BAP1 present in cells derived from carriers of heterozygous germline BAP1 mutations and to the reduced levels of BAP1 we induced in primary HM by siRNA. In other words, the results presented could not be influenced by the numerous genetic alterations that are found in tumor derived cell lines. Some confirmatory experiments were conducted in cell lines. None of the cell lines used in this paper were found in the ICLAC or NCBI Biosample databases of misidentified cell lines. Short-tandem repeat analyses were performed upon arrival of these cell lines in our laboratory for authentication. Re-authentication of the cell lines confirming their identity was performed by “Genetica DNA Laboratories, LabCorp” in July 2015.
Growth curves
Fibroblasts cell cultures proliferation was measured using the AlamarBlue® assay (AbD Serotec, cat. no. BUF012B). Following incubation of the cells in 96-well plates, 10% v/v AlamarBlue was added and fluorescence was measured (excitation 560 nm, emission 590 nm) at the indicated time points.
Gene silencing with siRNA, adenovirus-mediated gene transfer and transfection
siRNA oligonucleotides were obtained from Qiagen. GeneSoluton siRNAs targeting four different BAP1 mRNAs: Hs_BAP1_1, cat.no: SI00066696; Hs_BAP1_2, cat.no: SI00066703; Hs_BAP1_3, cat.no: SI00066710; Hs_BAP1_5, cat.no: SI03036390. GeneSoluton siRNAs targeting four different IP3R3 mRNAs (ITPR3): Hs_ITPR3_1, cat.no: SI00034580; Hs_ ITPR3_2, cat.no: SI00034587; Hs_ ITPR3_3, cat.no: SI00034594; Hs_ ITPR3_4, cat.no: SI00034601. Negative control siRNA, cat.no: 1027280. Transfection was performed with HiPerfect (Qiagen), using siRNAs at 10 nM final concentrations in 0.1% FBS medium for 24 hours. Unless otherwise specified in the Figures, a pool of the 4 different siRNAs, listed above, was used to silence BAP1 or IP3R3.
Adenoviruses expressing BAP1 and GFP were purchased from SignaGen Laboratories (Ad-BAP1, cat. no. SL175127; Ad-GFP, cat. no. SL100708). Customized adenoviruses expressing Ad-Myc-BAP1, Ad-Myc-BAP1(C91S), Ad-Myc-BAP1(W) and Ad-Myc-BAP1(L), were produced by SignaGen Laboratories using their Ad.MAX™ System. Expression plasmids for Flag-HA-BAP1, Myc-BAP1, Myc-BAP1(W), Myc-BAP1(L) and Myc-BAP1(C91S) were produced by Blue Heron Biotech. For BAP1(W), BAP1(L) and BAP1(C91S) the following nucleotide sequences were used:
BAP1(W)
ATGAATAAGGGCTGGCTGGAGCTGGAGAGCGACCCAGGCCTCTTCACCCTGCTCGTGGAAGATTTCGGTGTCAAGGGGGTGCAAGTGGAGGAGATCTACGACCTTCAGAGCAAATGTCAGGGCCCTGTATATGGATTTATCTTCCTGTTCAAATGGATCGAAGAGCGCCGGTCCCGGCGAAAGGTCTCTACCTTGGTGGATGATACGTCCGTGATTGATGATGATATTGTGAATAACATGTTCTTTGCCCACCAGCTGATACCCAACTCTTGTGCAACTCATGCCTTGCTGAGCGTGCTCCTGAACTGCAGCAGCGTGGACCTGGGACCCACCCTGAGTCGCATGAAGGACTTCACCAAGGGTTTCAGCCCTGAGAGCAAAGGATATGCGATTGGCAATGCCCCGGAGTTGGCCAAGGCCCATAATAGCCATGCCAGGGCCCTGGGGGGAGGACGAGGAGTGGACAGACAAGGCCCGGCGGGTCATCATGGAGCGTATCGGCCTCGCCACTGCAGGGGAGCCCTACCACGACATCCGCTTCAACCTGATGGCAGTGGTGCCCGACCGCAGGATCAAGTATGA
BAP1(L)
ATGAATAAGGGCTGGCTGGAGCTGGAGAGCGACCCAGGCCTCTTCACCCTGCTCGTGGAAGATTTCGGTGTCAAGGGGGTGCAAGTGGAGGAGATCTACGACCTTCAGAGCAAATGTCAGGGCCCTGTATATGGATTTATCTTCCTGTTCAAATGGATCGAAGAGCGCCGGTCCCGGCGAAAGGTCTCTACCTTGGTGGATGATACGTCCGTGATTGATGATGATATTGTGAATAACATGTTCTTTGCCCACCAGCTGATACCCAACTCTTGTGCAACTCATGCCTTGCTGAGCGTGCTCCTGAACTGCAGCAGCGTGGACCTGGGACCCACCCTGAGTCGCATGAAGGACTTCACCAAGGGTTTCAGCCCTGAGAGCAAAGGATATGCGATTGGCAATGCCCCGGAGTTGGCCAAGGCCCATAATAGCCATGCCAGGCCCGAGCCACGCCACCTCCCTGAGAAGCAGAATGGCCTTAGTGCAGTGCGGACCATGGAGGCGTTCCACTTTGTCAGCTATGTGCCTATCACAGGCCGGCTCTTTGAGCTGGATGGGCTGAAGGTCTACCCCATTGACCATGGGCCCTGGGGGGAGGACGAGGAGTGGACAGACAAGGCCCGGCGGGTCATCATGGAGCGTATCGGCCTCGCCACTGCAGGGGAGCCCTACCACGACATCCGCTTCAACCTGATGGCAGTGGTGCCCGACCGCAGGATCAAGTATGAGGCCAGGCTGCATGTGCTGAAGGTGAACCGTCAGACAGTACTAGAGGCTCTGCAGCAGCTGATAAGAGTAACACAGCCAGAGCTGATTCAGACCCACAAGTCTCAAGAGTCACAGCTGCCTGAGGAGTCCAAGTCAGCCAGCAACAAGTCCCCGCTGGTGCTGGAAGCAAACAGGGCCCCTGCAGCCTCTGAGGGCAACCACACAGATGGTGCAGAGGAGGCGGCTGGTTCATGCGCACAAGCCCCATCCCACAGCCCTCCCAACAAACCCAAGCTAGTGGTGAAGCCTCCAGGCAGCAGCCTCAATGGGGTTCACCCCAACCCCACTCCCATTGTCCAGCGGCTGCCGGCCTTTCTAGACAATCACAATTATGCCAAGTCCCCCATGCAGGAGGAAGAAGACCTGGCGGCAGGTGTGGGCCGCAGCCGAGTTCCAGTCCGCCCACCCCAGCAGTACTCAGATGATGAGGATGACTATGAGGATGACGAGGAGGATGACGTGCAGAACACCAACTCTGCCCTTAGGTATAAGGGGAAGGGAACAGGGAAGCCAGGGGCATTGAGCGGTTCTGCTGATGGGCAACTGTCAGTGCTGCAGCCCAACACCATCAACGTCTTGGCTGAGAAGCTCAAAGAGTCCCAGAAGGACCTCTCAATTCCTCTGTCCATCAAGACTAGCAGCGGGGCTGGGAGTCCGGCTGTGGCAGTGCCCACACACTCGCAGCCCTCACCCACCCCCAGCAATGAGAGTACAGACACGGCCTCTGAGATCGGCAGTGCTTTCAACTCGCCACTGCGCTCGCCTATCCGCTCAGCCAACCCGACGCGGCCCTCCAGCCCTGTCACCTCCCACATCTCCAAGGTGCTTTTTGGAGAGGATGACAGCCTGCTGCGTGTTGACTGCATACGCTACAACCGTGCTGTCCGTGATCTGGGTCCTGTCATCAGCACAGGCCTGCTGCACCTGGCTGAGGATGGGGTGCTGAGTCCCCTGGCGCTGACAGAGGGTGGGAAGGGTTCCTCGCCCTCCATCAGACCAATCCAAGGCAGCCAGGGGTCCAGCAGCCCAGTGGAGAAGGAGGTCGTGGAAGCCACGGACAGCAGAGAGAAGACGGGGATGGTGAGGCCTGGCGAGCCCTTGAGTGGGGAGAAATACTCACCCAAGGAGCTGCTGGCACTGCTGAAGTGTGTGGAGGCTGAGATTGCAAACTATGAGGCGTGCCTCAAGGAGGAGGTAGAGAAGAGGAAGAAGTTCAAGATTGATGACCAGAGAAGGACCCACAACTACGATGAGTTCATCTGCACCTTTATCTCCATGCTGGCTTAG
BAP1(C91S)
ATGAATAAGGGCTGGCTGGAGCTGGAGAGCGACCCAGGCCTCTTCACCCTGCTCGTGGAAGATTTCGGTGTCAAGGGGGTGCAAGTGGAGGAGATCTACGACCTTCAGAGCAAATGTCAGGGCCCTGTATATGGATTTATCTTCCTGTTCAAATGGATCGAAGAGCGCCGGTCCCGGCGAAAGGTCTCTACCTTGGTGGATGATACGTCCGTGATTGATGATGATATTGTGAATAACATGTTCTTTGCCCACCAGCTGATACCCAACTCTAGTGCAACTCATGCCTTGCTGAGCGTGCTCCTGAACTGCAGCAGCGTGGACCTGGGACCCACCCTGAGTCGCATGAAGGACTTCACCAAGGGTTTCAGCCCTGAGAGCAAAGGATATGCGATTGGCAATGCCCCGGAGTTGGCCAAGGCCCATAATAGCCATGCCAGGCCCGAGCCACGCCACCTCCCTGAGAAGCAGAATGGCCTTAGTGCAGTGCGGACCATGGAGGCGTTCCACTTTGTCAGCTATGTGCCTATCACAGGCCGGCTCTTTGAGCTGGATGGGCTGAAGGTCTACCCCATTGACCATGGGCCCTGGGGGGAGGACGAGGAGTGGACAGACAAGGCCCGGCGGGTCATCATGGAGCGTATCGGCCTCGCCACTGCAGGGGAGCCCTACCACGACATCCGCTTCAACCTGATGGCAGTGGTGCCCGACCGCAGGATCAAGTATGAGGCCAGGCTGCATGTGCTGAAGGTGAACCGTCAGACAGTACTAGAGGCTCTGCAGCAGCTGATAAGAGTAACACAGCCAGAGCTGATTCAGACCCACAAGTCTCAAGAGTCACAGCTGCCTGAGGAGTCCAAGTCAGCCAGCAACAAGTCCCCGCTGGTGCTGGAAGCAAACAGGGCCCCTGCAGCCTCTGAGGGCAACCACACAGATGGTGCAGAGGAGGCGGCTGGTTCATGCGCACAAGCCCCATCCCACAGCCCTCCCAACAAACCCAAGCTAGTGGTGAAGCCTCCAGGCAGCAGCCTCAATGGGGTTCACCCCAACCCCACTCCCATTGTCCAGCGGCTGCCGGCCTTTCTAGACAATCACAATTATGCCAAGTCCCCCATGCAGGAGGAAGAAGACCTGGCGGCAGGTGTGGGCCGCAGCCGAGTTCCAGTCCGCCCACCCCAGCAGTACTCAGATGATGAGGATGACTATGAGGATGACGAGGAGGATGACGTGCAGAACACCAACTCTGCCCTTAGGTATAAGGGGAAGGGAACAGGGAAGCCAGGGGCATTGAGCGGTTCTGCTGATGGGCAACTGTCAGTGCTGCAGCCCAACACCATCAACGTCTTGGCTGAGAAGCTCAAAGAGTCCCAGAAGGACCTCTCAATTCCTCTGTCCATCAAGACTAGCAGCGGGGCTGGGAGTCCGGCTGTGGCAGTGCCCACACACTCGCAGCCCTCACCCACCCCCAGCAATGAGAGTACAGACACGGCCTCTGAGATCGGCAGTGCTTTCAACTCGCCACTGCGCTCGCCTATCCGCTCAGCCAACCCGACGCGGCCCTCCAGCCCTGTCACCTCCCACATCTCCAAGGTGCTTTTTGGAGAGGATGACAGCCTGCTGCGTGTTGACTGCATACGCTACAACCGTGCTGTCCGTGATCTGGGTCCTGTCATCAGCACAGGCCTGCTGCACCTGGCTGAGGATGGGGTGCTGAGTCCCCTGGCGCTGACAGAGGGTGGGAAGGGTTCCTCGCCCTCCATCAGACCAATCCAAGGCAGCCAGGGGTCCAGCAGCCCAGTGGAGAAGGAGGTCGTGGAAGCCACGGACAGCAGAGAGAAGACGGGGATGGTGAGGCCTGGCGAGCCCTTGAGTGGGGAGAAATACTCACCCAAGGAGCTGCTGGCACTGCTGAAGTGTGTGGAGGCTGAGATTGCAAACTATGAGGCGTGCCTCAAGGAGGAGGTAGAGAAGAGGAAGAAGTTCAAGATTGATGACCAGAGAAGGACCCACAACTACGATGAGTTCATCTGCACCTTTATCTCCATGCTGGCTCAGGAAGGCATGCTGGCCAACCTAGTGGAGCAGAACATCTCCGTGCGGCGGCGCCAAGGGGTCAGCATCGGCCGGCTCCACAAGCAGCGGAAGCCTGACCGGCGGAAACGCTCTCGCCCCTACAAGGCCAAGCGCCAGTGA
Customized adenoviruses expressing Ad-Myc-BAP1-ER, and Ad-Myc-BAP1-Nu and Ad-Myc-BAP1-Cyt were produced by SignaGen Laboratories. The respective expression plasmids were produced by Blue Heron Biotech; the following nucleotide sequences were used and cloned into the expression vector pCMV6-AN-My (cat. no. PS100012):
BAP1-ER
ATGAATAAGGGCTGGCTGGAGCTGGAGAGCGACCCAGGCCTCTTCACCCTGCTCGTGGAAGATTTCGGTGTCAAGGGGGTGCAAGTGGAGGAGATCTACGACCTTCAGAGCAAATGTCAGGGCCCTGTATATGGATTTATCTTCCTGTTCAAATGGATCGAAGAGCGCCGGTCCCGGCGAAAGGTCTCTACCTTGGTGGATGATACGTCCGTGATTGATGATGATATTGTGAATAACATGTTCTTTGCCCACCAGCTGATACCCAACTCTTGTGCAACTCATGCCTTGCTGAGCGTGCTCCTGAACTGCAGCAGCGTGGACCTGGGACCCACCCTGAGTCGCATGAAGGACTTCACCAAGGGTTTCAGCCCTGAGAGCAAAGGATATGCGATTGGCAATGCCCCGGAGTTGGCCAAGGCCCATAATAGCCATGCCAGGCCCGAGCCACGCCACCTCCCTGAGAAGCAGAATGGCCTTAGTGCAGTGCGGACCATGGAGGCGTTCCACTTTGTCAGCTATGTGCCTATCACAGGCCGGCTCTTTGAGCTGGATGGGCTGAAGGTCTACCCCATTGACCATGGGCCCTGGGGGGAGGACGAGGAGTGGACAGACAAGGCCCGGCGGGTCATCATGGAGCGTATCGGCCTCGCCACTGCAGGGGAGCCCTACCACGACATCCGCTTCAACCTGATGGCAGTGGTGCCCGACCGCAGGATCAAGTATGAGGCCAGGCTGCATGTGCTGAAGGTGAACCGTCAGACAGTACTAGAGGCTCTGCAGCAGCTGATAAGAGTAACACAGCCAGAGCTGATTCAGACCCACAAGTCTCAAGAGTCACAGCTGCCTGAGGAGTCCAAGTCAGCCAGCAACAAGTCCCCGCTGGTGCTGGAAGCAAACAGGGCCCCTGCAGCCTCTGAGGGCAACCACACAGATGGTGCAGAGGAGGCGGCTGGTTCATGCGCACAAGCCCCATCCCACAGCCCTCCCAACAAACCCAAGCTAGTGGTGAAGCCTCCAGGCAGCAGCCTCAATGGGGTTCACCCCAACCCCACTCCCATTGTCCAGCGGCTGCCGGCCTTTCTAGACAATCACAATTATGCCAAGTCCCCCATGCAGGAGGAAGAAGACCTGGCGGCAGGTGTGGGCCGCAGCCGAGTTCCAGTCCGCCCACCCCAGCAGTACTCAGATGATGAGGATGACTATGAGGATGACGAGGAGGATGACGTGCAGAACACCAACTCTGCCCTTAGGTATAAGGGGAAGGGAACAGGGAAGCCAGGGGCATTGAGCGGTTCTGCTGATGGGCAACTGTCAGTGCTGCAGCCCAACACCATCAACGTCTTGGCTGAGAAGCTCAAAGAGTCCCAGAAGGACCTCTCAATTCCTCTGTCCATCAAGACTAGCAGCGGGGCTGGGAGTCCGGCTGTGGCAGTGCCCACACACTCGCAGCCCTCACCCACCCCCAGCAATGAGAGTACAGACACGGCCTCTGAGATCGGCAGTGCTTTCAACTCGCCACTGCGCTCGCCTATCCGCTCAGCCAACCCGACGCGGCCCTCCAGCCCTGTCACCTCCCACATCTCCAAGGTGCTTTTTGGAGAGGATGACAGCCTGCTGCGTGTTGACTGCATACGCTACAACCGTGCTGTCCGTGATCTGGGTCCTGTCATCAGCACAGGCCTGCTGCACCTGGCTGAGGATGGGGTGCTGAGTCCCCTGGCGCTGACAGAGGGTGGGAAGGGTTCCTCGCCCTCCATCAGACCAATCCAAGGCAGCCAGGGGTCCAGCAGCCCAGTGGAGAAGGAGGTCGTGGAAGCCACGGACAGCAGAGAGAAGACGGGGATGGTGAGGCCTGGCGAGCCCTTGAGTGGGGAGAAATACTCACCCAAGGAGCTGCTGGCACTGCTGAAGTGTGTGGAGGCTGAGATTGCAAACTATGAGGCGTGCCTCAAGGAGGAGGTAGAGAAGAGGAAGAAGTTCAAGATTGATGACCAGAGAAGGACCCACAACTACGATGAGTTCATCTGCACCTTTATCTCCATGCTGGCTCAGGAAGGCATGCTGGCCAACCTAGTGGAGCAGAACATCTCCGTGCGGCGGCGCCAAGGGGTCAGCATCGGCCGGCTCCACAAGCAGCGGAAGCCTGACCGGCGGAAACGCTCTCGCCCCTACAAGGCCAAGCGCCAGATGGTTTATATTGGTATCGCTATTTTTTTGTTTTTGGTTGGCCTTTTTATGAAATGA
ER targeting sequence: ATGGTTTATATTGGTATCGCTATTTTTTTGTTTTTGGTTGGCCTTTTTATGAAA
BAP1-Nu
ATGAATAAGGGCTGGCTGGAGCTGGAGAGCGACCCAGGCCTCTTCACCCTGCTCGTGGAAGATTTCGGTGTCAAGGGGGTGCAAGTGGAGGAGATCTACGACCTTCAGAGCAAATGTCAGGGCCCTGTATATGGATTTATCTTCCTGTTCAAATGGATCGAAGAGCGCCGGTCCCGGCGAAAGGTCTCTACCTTGGTGGATGATACGTCCGTGATTGATGATGATATTGTGAATAACATGTTCTTTGCCCACCAGCTGATACCCAACTCTTGTGCAACTCATGCCTTGCTGAGCGTGCTCCTGAACTGCAGCAGCGTGGACCTGGGACCCACCCTGAGTCGCATGAAGGACTTCACCAAGGGTTTCAGCCCTGAGAGCAAAGGATATGCGATTGGCAATGCCCCGGAGTTGGCCAAGGCCCATAATAGCCATGCCAGGCCCGAGCCACGCCACCTCCCTGAGAAGCAGAATGGCCTTAGTGCAGTGCGGACCATGGAGGCGTTCCACTTTGTCAGCTATGTGCCTATCACAGGCCGGCTCTTTGAGCTGGATGGGCTGAAGGTCTACCCCATTGACCATGGGCCCTGGGGGGAGGACGAGGAGTGGACAGACAAGGCCCGGCGGGTCATCATGGAGCGTATCGGCCTCGCCACTGCAGGGGAGCCCTACCACGACATCCGCTTCAACCTGATGGCAGTGGTGCCCGACCGCAGGATCAAGTATGAGGCCAGGCTGCATGTGCTGAAGGTGAACCGTCAGACAGTACTAGAGGCTCTGCAGCAGCTGATAAGAGTAACACAGCCAGAGCTGATTCAGACCCACAAGTCTCAAGAGTCACAGCTGCCTGAGGAGTCCAAGTCAGCCAGCAACAAGTCCCCGCTGGTGCTGGAAGCAAACAGGGCCCCTGCAGCCTCTGAGGGCAACCACACAGATGGTGCAGAGGAGGCGGCTGGTTCATGCGCACAAGCCCCATCCCACAGCCCTCCCAACAAACCCAAGCTAGTGGTGAAGCCTCCAGGCAGCAGCCTCAATGGGGTTCACCCCAACCCCACTCCCATTGTCCAGCGGCTGCCGGCCTTTCTAGACAATCACAATTATGCCAAGTCCCCCATGCAGGAGGAAGAAGACCTGGCGGCAGGTGTGGGCCGCAGCCGAGTTCCAGTCCGCCCACCCCAGCAGTACTCAGATGATGAGGATGACTATGAGGATGACGAGGAGGATGACGTGCAGAACACCAACTCTGCCCTTAGGTATAAGGGGAAGGGAACAGGGAAGCCAGGGGCATTGAGCGGTTCTGCTGATGGGCAACTGTCAGTGCTGCAGCCCAACACCATCAACGTCTTGGCTGAGAAGCTCAAAGAGTCCCAGAAGGACCTCTCAATTCCTCTGTCCATCAAGACTAGCAGCGGGGCTGGGAGTCCGGCTGTGGCAGTGCCCACACACTCGCAGCCCTCACCCACCCCCAGCAATGAGAGTACAGACACGGCCTCTGAGATCGGCAGTGCTTTCAACTCGCCACTGCGCTCGCCTATCCGCTCAGCCAACCCGACGCGGCCCTCCAGCCCTGTCACCTCCCACATCTCCAAGGTGCTTTTTGGAGAGGATGACAGCCTGCTGCGTGTTGACTGCATACGCTACAACCGTGCTGTCCGTGATCTGGGTCCTGTCATCAGCACAGGCCTGCTGCACCTGGCTGAGGATGGGGTGCTGAGTCCCCTGGCGCTGACAGAGGGTGGGAAGGGTTCCTCGCCCTCCATCAGACCAATCCAAGGCAGCCAGGGGTCCAGCAGCCCAGTGGAGAAGGAGGTCGTGGAAGCCACGGACAGCAGAGAGAAGACGGGGATGGTGAGGCCTGGCGAGCCCTTGAGTGGGGAGAAATACTCACCCAAGGAGCTGCTGGCACTGCTGAAGTGTGTGGAGGCTGAGATTGCAAACTATGAGGCGTGCCTCAAGGAGGAGGTAGAGAAGAGGAAGAAGTTCAAGATTGATGACCAGAGAAGGACCCACAACTACGATGAGTTCATCTGCACCTTTATCTCCATGCTGGCTCAGGAAGGCATGCTGGCCAACCTAGTGGAGCAGAACATCTCCGTGCGGCGGCGCCAAGGGGTCAGCATCGGCCGGCTCCACAAGCAGCGGAAGCCTGACCGGCGGAAACGCTCTCGCCCCTACAAGGCCAAGCGCCAGACAGTTTTTTCTAATGGCTATTCAAGCCCCAGCATGAGACCAGATGTAAGCTCTCCTCCATCCAGCTCCTCAACAGCAACAACAGGACCACCTCCCAAACTCTGCCTGGTGTGCTCTGATGAAGCTTCAGGATGTCATTATGGAGTCTTAACTTGTGGAAGCTGTAAAGTTTTCTTCAAAAGAGCAGTGGAAGGACAGCACAATTACCTATGTGCTGGAAGGAATGATTGCATCATCGATAAAATTCGAAGAAAAAACTGCCCAGCATGCCGCTATCGAAAATGTCTTCAGGCTGGAATGAACCTGGAAGCTCGAAAAACAAAGAAAAAAATAAAAGGAATTCAGCAGGCCACTTGA
Nuclear targeting sequence
ACAGTTTTTTCTAATGGCTATTCAAGCCCCAGCATGAGACCAGATGTAAGCTCTCCTCCATCCAGCTCCTCAACAGCAACAACAGGACCACCTCCCAAACTCTGCCTGGTGTGCTCTGATGAAGCTTCAGGATGTCATTATGGAGTCTTAACTTGTGGAAGCTGTAAAGTTTTCTTCAAAAGAGCAGTGGAAGGACAGCACAATTACCTATGTGCTGGAAGGAATGATTGCATCATCGATAAAATTCGAAGAAAAAACTGCCCAGCATGCCGCTATCGAAAATGTCTTCAGGCTGGAATGAACCTGGAAGCTCGAAAAACAAAGAAAAAAATAAAAGGAATTCAGCAGGCCACT
BAP1-Cyt
ATGAATAAGGGCTGGCTGGAGCTGGAGAGCGACCCAGGCCTCTTCACCCTGCTCGTGGAAGATTTCGGTGTCAAGGGGGTGCAAGTGGAGGAGATCTACGACCTTCAGAGCAAATGTCAGGGCCCTGTATATGGATTTATCTTCCTGTTCAAATGGATCGAAGAGCGCCGGTCCCGGCGAAAGGTCTCTACCTTGGTGGATGATACGTCCGTGATTGATGATGATATTGTGAATAACATGTTCTTTGCCCACCAGCTGATACCCAACTCTTGTGCAACTCATGCCTTGCTGAGCGTGCTCCTGAACTGCAGCAGCGTGGACCTGGGACCCACCCTGAGTCGCATGAAGGACTTCACCAAGGGTTTCAGCCCTGAGAGCAAAGGATATGCGATTGGCAATGCCCCGGAGTTGGCCAAGGCCCATAATAGCCATGCCAGGCCCGAGCCACGCCACCTCCCTGAGAAGCAGAATGGCCTTAGTGCAGTGCGGACCATGGAGGCGTTCCACTTTGTCAGCTATGTGCCTATCACAGGCCGGCTCTTTGAGCTGGATGGGCTGAAGGTCTACCCCATTGACCATGGGCCCTGGGGGGAGGACGAGGAGTGGACAGACAAGGCCCGGCGGGTCATCATGGAGCGTATCGGCCTCGCCACTGCAGGGGAGCCCTACCACGACATCCGCTTCAACCTGATGGCAGTGGTGCCCGACCGCAGGATCAAGTATGAGGCCAGGCTGCATGTGCTGAAGGTGAACCGTCAGACAGTACTAGAGGCTCTGCAGCAGCTGATAAGAGTAACACAGCCAGAGCTGATTCAGACCCACAAGTCTCAAGAGTCACAGCTGCCTGAGGAGTCCAAGTCAGCCAGCAACAAGTCCCCGCTGGTGCTGGAAGCAAACAGGGCCCCTGCAGCCTCTGAGGGCAACCACACAGATGGTGCAGAGGAGGCGGCTGGTTCATGCGCACAAGCCCCATCCCACAGCCCTCCCAACAAACCCAAGCTAGTGGTGAAGCCTCCAGGCAGCAGCCTCAATGGGGTTCACCCCAACCCCACTCCCATTGTCCAGCGGCTGCCGGCCTTTCTAGACAATCACAATTATGCCAAGTCCCCCATGCAGGAGGAAGAAGACCTGGCGGCAGGTGTGGGCCGCAGCCGAGTTCCAGTCCGCCCACCCCAGCAGTACTCAGATGATGAGGATGACTATGAGGATGACGAGGAGGATGACGTGCAGAACACCAACTCTGCCCTTAGGTATAAGGGGAAGGGAACAGGGAAGCCAGGGGCATTGAGCGGTTCTGCTGATGGGCAACTGTCAGTGCTGCAGCCCAACACCATCAACGTCTTGGCTGAGAAGCTCAAAGAGTCCCAGAAGGACCTCTCAATTCCTCTGTCCATCAAGACTAGCAGCGGGGCTGGGAGTCCGGCTGTGGCAGTGCCCACACACTCGCAGCCCTCACCCACCCCCAGCAATGAGAGTACAGACACGGCCTCTGAGATCGGCAGTGCTTTCAACTCGCCACTGCGCTCGCCTATCCGCTCAGCCAACCCGACGCGGCCCTCCAGCCCTGTCACCTCCCACATCTCCAAGGTGCTTTTTGGAGAGGATGACAGCCTGCTGCGTGTTGACTGCATACGCTACAACCGTGCTGTCCGTGATCTGGGTCCTGTCATCAGCACAGGCCTGCTGCACCTGGCTGAGGATGGGGTGCTGAGTCCCCTGGCGCTGACAGAGGGTGGGAAGGGTTCCTCGCCCTCCATCAGACCAATCCAAGGCAGCCAGGGGTCCAGCAGCCCAGTGGAGAAGGAGGTCGTGGAAGCCACGGACAGCAGAGAGAAGACGGGGATGGTGAGGCCTGGCGAGCCCTTGAGTGGGGAGAAATACTCACCCAAGGAGCTGCTGGCACTGCTGAAGTGTGTGGAGGCTGAGATTGCAAACTATGAGGCGTGCCTCAAGGAGGAGGTAGAGAAGAGGAAGAAGTTCAAGATTGATGACCAGAGAAGGACCCACAACTACGATGAGTTCATCTGCACCTTTATCTCCATGCTGGCTCAGGAAGGCATGCTGGCCAACCTAGTGGAGCAGAACATCTCCGTGGCGGCGGCGCAAGGGGTCAGCATCGGCGCGCTCCACAAGCAGCGGAAGCCTGACGCGGCGGCGGCGGCGGCGCCCTACAAGGCCAAGCGCCAGTGA
Point Mutations (in Bold) Introduced in Bap1 NLS Region (accordingly to19)
GCGGCGGCGCAAGGGGTCAGCATCGGCGCGCTCCACAAGCAGCGGAAGCCTGACGCGGCGGCGGCGGCGGCGCCCTAC
The customized adenovirus expressing Ad-IP3R3 was produced by Vector BioLabs, from the expression plasmid: ITPR3 (Myc-DDK-tagged)-Human inositol 1,4,5-trisphosphate receptor, type 3, obtained from Blue Heron Biotech (cat. no. RC222737).
The adenoviruses expressing Ad-cytAEQ, Ad-mtAEQ and Ad-mtAEQmut were obtained from our co-Author, P. Pinton's Lab36.
Plasmid expressing FLAG-IP3R3(NT), HA-IP3R3(NT), HA-IP3R3(MID) and HA-IP3R3(CT) were generated by Shafi Kuchay.
Blue Heron Biotech produced the plasmid DNA vectors expressing the 6 Myc-tagged BAP1 fragments: Myc-BAP1(UCH), aa: 1-240; Myc BAP1(NORS), aa: 240-598, Myc-BAP1(CTD-NLS), aa: 598-729; Myc-BAP1(UCH-NORS-CTD), aa: 1-699; Myc-BAP1(UCH-NORS), aa: 1-598; Myc-BAP1(NORS-CTD-NLS), aa: 240-729.
Cells (fibroblasts cell cultures, HM, MAF, Phi, HMESO, macrophages, as indicated in the Figures) were seeded and allowed to grow to 50% confluence for 24 hours before transduction or transfection. Infection with the indicated adenoviruses was performed at a multiplicity of infection of 100 PFU/cell, in 10% FBS. For aequorin measurements, the cells were seeded onto 13 mm glass coverslips. Experiments were performed 36 hours post-transduction. When silencing and transduction occurred together in the same experiment, cells were first transduced for 12 hours and then transfected with Hiperfect for the remaining 24 hours. THP-1 cells were treated with 20 μM TPA for 24 hours to induce monocytes differentiation into macrophages; subsequently cells were transduced with WT mitochondrial targeted aequorin (Ad-mtAEQ) for 24 hours in presence of TPA, and then transfected with control scrambled siRNA or siRNAs-BAP1 (siBAP1#1 and siBAP1#5), in 1% FBS media, for additional 24 hours prior to Ca2+ measurements. For cell imaging experiments, cells were seeded onto 24 mm glass coverslips and allowed to grow to 50% confluence before transduction or transfection.
Transfection with the ER-targeted, D1ER, and the mitochondrial-targeted, 4mtD3cpv, Ca2+biosensors23,37 was performed using Lipofectamine LTX&PLUS (Life Technologies, 15338-100). HEK-293 cells were cultured for 24 hours, transiently transfected using polyethylenimine (PEI) and used in the experiments 24 hours post-transfection.
HMESO cells stably expressing empty vector, BAP1 or BAP1(C91S), were generated through transient transfection of the respective plasmid DNA vectors using PEI. Cells were selected using 1.5 mg/ml G418 to obtain monoclonal populations. Colonies were then grown in 0.5 mg/ml G418 and tested for BAP1 overexpression via WB.
Western blot (WB)
Total cell (fibroblasts cell cultures, HM, HEK-293, PPM-Mill, Phi, HMESO, Rob, macrophages, as indicated in the Figures) lysates were prepared in M-PER (Thermo Scientific, cat. no. 78501) reagent supplemented with proteases and phosphatases inhibitors [2 mM Na3VO4, 2 mM NaF, 50 nM Okadaic Acid (OA), 1 mM PMSF and protease inhibitor cocktail], and 1 mM DTT.
Cleaved caspase-3 levels were analyzed in fibroblasts treated with either vehicle or 100 μM H2O2, 10 μM C2-ceramide (C2-Cer), 10 μM menadione (Men), 10 μM 5-fluorouracile (5-FU), for 6 hours in DMEM supplemented with 0.1% FBS. When indicated, fibroblasts were silenced for 24 hours or transduced with adenoviruses for 36 hours as described above. HM cells were seeded in DMEM supplemented with 20% FBS, followed by transfection with Hiperfect for 24 hours, and then treated with 200 μM H2O2 for 6 hours, or 5 μg/cm2 crocidolite for 24 hours in 0.1% FBS medium. THP-1 cells were treated with 20 μM TPA for 48 hours to induce monocytes differentiation into macrophages; subsequently cells were transfected, in 1% FBS media, with control scrambled siRNA, siBAP1#1 and siBAP1#5 for 24 hours, and then treated with 5 μg/cm2 crocidolite asbestos for additional 24 hours.
Protein extracts were quantified using the Bradford assay (Bio-Rad Laboratories); 7 μg of proteins were loaded and separated on NuPAGE® Novex 4-12% Bis-Tris Gel (Life Technologies), and electron-transferred to PVDF or nitrocellulose membrane according to standard procedures.
Antibodies
Primary antibodies used were: α-Tubulin (4G1) (Santa Cruz Biotechnology, cat. no. sc-58666), BAP1 (C-4) (Santa Cruz Biotechnology, cat. no. sc-28383), BAP1 (D7W7O) (Cell Signaling, cat. no. 13271), BAP1 (H-300) (Santa Cruz Biotechnology, cat. no. sc-28236), anti-human CD90 (BD Biosciences, cat. no. 561558), Caspase-3 (Cell Signaling, cat. no. 9662), FLAG (Sigma-Aldrich, cat. no. F7425), Histone H2A.X (D17A3) (Cell Signaling, cat. no. 7631), Anti-phospho-Histone H2A.X (Ser139) (EMD Millipore, cat. no. 05-636), H3 (Cell Signaling, cat. no. 4499), IP3R1 (Novus Biologicals, cat. no. NB120-5908), IP3R3 (BD Biosciences, cat. no. 610312), Anti-Lamin B1 (abcam, cat. no. ab16048), c-myc (Bethyl Laboratories, cat. no A190-105A), Myc-Tag (9B11) (Cell Signaling, cat. no. 2276), PDI (abcam, cat. no. ab31811) Anti-VDAC1 (abcam, cat. no. ab15895). Secondary antibodies used were: Goat anti-Mouse IgG (H+L) Secondary Antibody, HRP (Thermo Scientific, cat. no. 32430); Goat anti-Rabbit IgG (H+L) Secondary Antibody, HRP (Thermo Scientific, cat. no. 32460); Mouse TrueBlot® ULTRA: Anti-Mouse Ig HRP (Rockland, cat. no. 18-8817-31).
Quantitative Real-Time PCR
Total RNA was extracted with TRIzol reagent (Invitrogen, cat no. 15596-018), followed by phenol/chloroform extractions and ethanol precipitations. The RNA was treated with DNase (Promega) and its integrity and concentration was assessed using the Agilent 2100 BioAnalyzer. cDNA was synthesized using the High-Capacity cDNA Reverse Transcription Kit (Invitrogen, cat no. 4368814) following the manufacturer's instructions. Quantitative real-time PCR was performed in triplicate using TaqMan® Universal Master Mix II (Invitrogen, cat no. 4440040) and commercially available TaqMan Probes (Invitrogen) on a StepOnePlus system (Applied Biosystem). The mRNA levels were normalized using the geometric mean of three reference genes (B2M, 18S and β-actin).
Flow cytometry
For cell cycle analyses, fibroblasts cell cultures were incubated with 10 μM bromodeoxyuridine (BrdU) for 3.5 hours at 37 °C. Cells were collected by trypsinization, fixed, and permeabilized. Cell cycle positions were determined after staining BrdU with FITC-labeled anti-BrdU antibody and DNA with 7-ADD using the FITC BrdU Flow Kit (BD Biosciences, cat. no. 559619) according to the manufacturer's instructions. Cells not treated with BrdU, but incubated with FITC anti-BrdU antibody, were used to assess nonspecific binding of the anti-BrdU antibody and to set the S-phase gate appropriately.
Cell death was measured in fibroblasts cell cultures treated with vehicle or 100 μM H2O2 for 6 hours, in DMEM supplemented with 0.1% FBS media. Cells were collected and stained with FITC-labeled anti-Annexin V and Propidium Iodide (PI) using the FITC Annexin V Apoptosis Detection Kit I (BD Biosciences, cat. no. 556547) according to the manufacturer's instructions. The percentage of late apoptotic cells was determined based on the percentage of cells that were double positive for both Annexin V and PI (Annexin V+/PI+).
Primary HM treated with glass or crocidolite asbestos were collected and incubated (blocked) for 20 minutes with 1% BSA/PBS at 4°C. Cells were stained with anti-human CD90 PE-Cy7 (BD Biosciences, cat. no. 561558) for 30 minutes at 4 °C. Cells were washed once with Binding Buffer and then stained with FITC Annexin V and PI using the FITC Annexin V Apoptosis Detection Kit I (BD Biosciences, cat. no. 556547). After gating on CD90+ cells, the percentage of live cells (Annexin V-/PI-), percentage of early apoptotic cells (Annexin V+/PI-), and the percentage of late apoptotic cells (Annexin V+/PI+) were determined.
For Annexin V/PI experiments, compensation was performed using unstained and single-stained cells and positivity gates were established using the fluorescence minus one (FMO) technique.
For all flow cytometry experiments, fluorescence was detected using a BD LSRFortessa flow cytometer (BD Biosciences) and data were analyzed using FACSDiva software version 6.2 (BD Biosciences). The investigator was blinded to the genotype and experimental conditions of the samples while conducting the experiments and assessing the outcome.
Immunofluorescence
Cells (fibroblasts cell cultures or HM, as indicated in the Figures) grown on 24-mm glass coverslips were fixed in 4% paraformaldehyde in PBS for 10 min and washed three times with PBS. Then, cells were permeabilized for 10 min with 0.1% Triton X-100 in PBS and blocked in PBS containing 2% BSA and 0.05% Triton X-100 for 1 h. Cells were incubated overnight at 4 °C with the indicated antibodies: BAP1 (C-4) (1:50), BAP1 (D7W7O) (1:50), BAP1 (H-300) (1:50), PDI (1:50), IP3R3 (1:50), Myc-Tag (1:75) or H3 (1:75). The appropriate isotype-matched, AlexaFluor-conjugated secondary antibodies [Life Technologies, A11008 (633 goat anti-rabbit, 1:1000) A-11010 (546 goat anti-rabbit, 1:1000) and A11001 (488 goat anti-mouse, 1:1000)] were used. Where indicated, cells were also loaded with 300 μM DAPI (Life Technologies) for 10 min. The coverslips were mounted with ProLong Gold Antifade reagent (Life Technologies), and the analysis of immunofluorescence was performed with a confocal laser scanner microscopy Zeiss LSM 510 (Carl Zeiss, Gottingen, Germany) equipped with a 60x oil objective (n.a.1.42) and a Zen lite 2.0 software, or with a Nikon SweptField confocal equipped with a CFI Plan Apo VC60XH objective (n.a. 1.4) (Nikon Instruments, Melville NY) and an Andor DU885 EM-CCD camera (Andor Technology LTD, Nelfast, Norther Ireland), or with an Olympus Xcellence multiple wavelength high-resolution fluorescence microscopy system equipped with a 60X UPLSAPO objective, numerical aperture 1.35 (Olympus).
Subcellular fractionation
Cell fractionation was performed as previously described38. Briefly, 109 cells (fibroblasts cell cultures, HM, PPM-Mill, HEK-293, as indicated in the Figure panels) were harvested in PBS and washed by centrifugation at 500 × g for 5 min with PBS. The cell pellet was suspended in homogenization buffer (225 mM mannitol, 75 mM sucrose, 30 mM Tris-HCl pH 7.4, 0.1 mM EGTA and PMSF) and gently disrupted by Dounce homogenization. The homogenate was centrifuged twice at 600 × g for 5 min to remove nuclei and unbroken cells, and the resultant supernatant was centrifuged at 10,300 × g for 10 min to pellet crude mitochondria. The supernatant was again centrifuged at 20,000 × g for 30 min. Further centrifugation of the supernatant at 100,000 × g for 90 min (70-Ti rotor; Beckman) results in the isolation of ER (pellet) and cytosolic fraction (supernatant).
To purify mitochondria, the crude mitochondrial fraction was suspended in isolation buffer (250 mM mannitol, 5 mM HEPES pH 7.4 and 0.5 mM EGTA) and subjected to Percoll gradient centrifugation (Percoll medium: 225 mM mannitol, 25 mM HEPES pH 7.4, 1 mM EGTA and 30% vol/vol Percoll) in a 10 ml polycarbonate ultracentrifuge tube, at 95,000 × g for 30 min (SW40 rotor; Beckman). Purified mitochondria were then washed by centrifugation at 6,300 × g for 10 min to remove the Percoll and finally suspended in isolation medium. All centrifugation steps were performed at 4 °C.
To isolate nuclei, cells were collected by centrifugation at 200 × g for 5 min, washed once with ice-cold PBS, suspended in hypotonic buffer (10 mM HEPES pH 7.4, 10 mM KCl, 0.1 mM EDTA, 0.1 mM EGTA, 1 mM DTT, 0.5 mM PMSF), and incubated 15 min on ice. NP40 (Fluka) was added to a final concentration of 0.5% and the mixture was homogenized with a pestle grinder using 30 strokes. The efficiency of shearing the cytoplasm from the nuclei was monitored under a light microscopy by staining with Trypan blue. Homogenates were centrifuged at 14,000 × g for 30 sec to sediment the nuclei. Nuclei were washed once in PBS and further centrifuged at 14,000 × g for 1 min. Nuclei were finally suspended in hypotonic buffer (20 mM HEPES pH 7.4, 400 mM NaCl, 1 mM EDTA, 1 mM EGTA, 1 mM DTT, 1 mM PMSF), incubated on ice for 30 min, vortexed every 5 min, and centrifuged at 16,000 × g for 10 min; the supernatant was collected as nuclear homogenate.
Immunoelectron microscopy
Fibroblasts cell cultures were fixed with 2% paraformaldehyde 0.2% glutaraldehyde in 0.1M Phosphate buffer pH 7.4 for 1 hour at room temperature. Samples were washed in PBS, embedded in 12% gelatin, infiltrated in 2.3 M sucrose and frozen in liquid nitrogen. Ultrathin cryo-sections were obtained using a Leica EM FC7 cryo-ultramicrotome and collected on copper-formvar-carbon-coated grids. BAP1 localization was revealed using BAP1 (D7W7O) rabbit monoclonal anti-BAP1 antibody (Cell Signaling, cat. no. 13271) and conjugated 10nm protein A-gold according to published protocols39. Sections were imaged with a Zeiss LEO 512 electron microscope and images were acquired by a 2k × 2k bottom-mounted slow-scan Proscan camera controlled by the EsivisionPro 3.2 software.
Intracellular Ca2+ concentration measurements
Cytosolic and mitochondrial Ca2+ concentration measurements with aequorins
Cells (fibroblasts cell cultures, HM, MAF, Phi, HMESO, macrophages, as indicated in the Figures) grown on 13-mm round glass coverslips were transduced (or co-transduced in BAP1 gene expression experiments) with aequorin encoded by an adenoviral construct (cytosolic aequorin, cytAEQ; mitochondria-targeted aequorin, mtAEQ; or the low-affinity mitochondrial aequorin, mtAEQmut). The coverslip with the cells was incubated with 5 μM coelenterazine for 2-3 h in 0.1% FBS medium, and then transferred to the perfusion chamber. All aequorin measurements were carried out in Krebs-Ringer buffer (KRB: 135 mM NaCl, 5 mM KCl, 1 mM MgSO4, 0.4 mM KH2PO4, 5.5 mM glucose, 20 mM HEPES, pH 7.4) supplemented with 1 mM CaCl2. Agonists and other drugs were added to the same medium, as specified in the text. The experiments were terminated by lysing the cells with 100 μM digitonin in a hypotonic Ca2+-rich solution (10 mM CaCl2 in H2O), thus discharging the remaining aequorin pool. The light signal was collected and calibrated into [Ca2+] values by an algorithm based on the Ca2+ response curve of aequorin at physiological conditions of pH, [Mg2+] and ionic strength, as previously described in36. Ca2+ measurements were conducted using a luminometer in cells transduced aequorin, which is a bio-luminescent Ca2+ probe. Note that [Ca2+] is measured only in cells containing aequorin, specifically providing the results only of the transduced cells, and therefore, are not influenced by the background not-transduced cells. To ensure that cells transduced with aequorin also contain BAP1, BAP1(C91S) or BAP1-targeted chimeras, we use a transduction ratio of 1 (aequorin): 3 (BAP1).
ER Ca2+ concentration measurements with D1ER
Luminal Ca2+ dynamics were measured using single-cell Ca2+ imaging and the Ca2+-sensitive FRET (fluorescence resonance energy transfer)-based cameleon protein D1ER23,37. Fibroblasts were cultured on 24-mm coverslips. When the cells reached 60 % confluence, they were transfected with D1ER. After 36 h, cells were imaged on a Zeiss Axiovert 200M microscope with a cooled CCD camera (Photometrics), equipped with a C-apochromat 40× oil objective (n.a.,1.2) and controlled by METAFLUOR 7.0 Software (Universal Imaging). Emission ratio imaging of the cameleon was accomplished by using a 436DF20 excitation filter, a 450 nm dichroic mirror, and two emission filters (475/40 for ECFP and 535/25 for citrine) controlled by a Lambda 10-2 filter changer (Sutter Instruments). Fluorescence images were background corrected. Exposure times were typically 100 to 200 ms, and images were collected every 5 to 15 sec. The FRET signal (YFP/CFP) was normalized to the CFP emission intensity, and changes in ER Ca2+ were expressed as the ratio of the emissions at 535 and 470 nm. Cells were treated with 1 μM bradykinin (BK) or 500 μM H2O2 as indicated in the figures, where representative changes in ER [Ca2+] in BAP1WT and BAP1+/- fibroblasts are expressed as D1ER ratios (YFP/CFP) normalized to initial values.
Cytosolic Ca2+ concentration measurements with Fura-2/AM
Dynamic measurements of cytosolic Ca2+ response were performed using the fluorescent Ca2+ indicator Fura-2/AM (Life Technologies). Fibroblasts were grown on 24-mm coverslips and incubated at 37 °C for 30 min in 1 mM Ca2+/KRB supplemented with 2.5 mM Fura-2/AM, 0.02% Pluronic F-68 (Sigma), 0.1 mM Sulfinpyrazone (Sigma). Cells were then washed and supplied with 1 mM Ca2+/KRB. To determine cytosolic Ca2+ response, the cells were placed in an open Leyden chamber on a 37 °C thermostated stage and exposed to 340/380 nm wavelength light using the Olympus xcellence multiple wavelength high-resolution fluorescence microscopy system. H2O2 was added to the 1 mM Ca2+/KRB buffer, and crocidolite asbestos, or glass, added at concentrations of 5μg/cm2. Ca2+ release was recorded upon stimulation as indicated in the figures. To determine whether the Ca2+ release occurred via the ER or if it was secondary to the plasma membrane influx, fibroblasts were loaded with fluorescent Ca2+ indicator Fura-2/AM for 30 min in Ca2+-free KRB buffer supplemented with 0.1 mM ethylene glycol-bis(β-aminoethylether)-N,N,N′,N′-tetraacetic acid (EGTA). Cells were placed in an open Leyden chamber on a 37 °C thermostated stage and exposed to 340/380 wavelength light, as described above. BK was added to the KRB buffer, and Ca2+ release was recorded upon stimulation as indicated in the figures. The fluorescence data collected were expressed as emission ratios at 340/380 nm. In the figures, the kinetic of the cytosolic Ca2+ responses after H2O2 or BK stimulation is presented as the ratio of fluorescence at 340/380 nm in cells loaded with Fura-2/AM.
Dynamic measurements of cytosolic Ca2+ response after irradiation with UVA (irradiated for 5 minutes with the Olympus xcellence Hg lamp, model: MT-ARC-Hg, 150 W, light was filtered with a 340 filter) or UVB (irradiated at 312 nm for 20 minutes, at a 2 cm fixed distance, with a SPECTROLINE model ENB-280C/F - 220 VOLT - 50 HZ - 0.17 AMPS), were performed using the fluorescent Ca2+ indicator Fura-RED (Life Technologies). Fibroblasts grown on 24-mm coverslips were incubated at 37 °C for 60 min in 1 mM Ca2+/KRB supplemented with 2.5 mM Fura-RED, 0.02% Pluronic F-68 (Sigma), 0.1 mM Sulfinpyrazone (Sigma). Cells were then washed and supplied with 1 mM Ca2+/KRB. To determine the cytosolic Ca2+ response, the cells were placed in an open Leyden chamber on a 37 °C thermostated stage and exposed to 406/494 nm wavelength light using the Olympus xcellence multiple wavelength high-resolution fluorescence microscopy system. The fluorescence data collected were expressed as emission ratios at 406/494 nm. In the figures, the kinetic of the cytosolic Ca2+ responses after UV irradiation is presented as the ratio of fluorescence at 406/494 nm in cells loaded with Fura-RED. Statistical analyses refer to normalized FRET fluorescence ratio over time after irradiaton [Σ(F406/F494)].
Single cells mitochondria Ca2+ measurements with 4mtD3cpv
BAP1WT and BAP1+/- fibroblasts were transfected with the 4mtD3cpv23,37 plasmid, as described above. When indicated, co-transfection or silencing were also performed, as described above. After 24 hours, cells were imaged on a Zeiss Axiovert 100TV microscope with a cooled CCD camera R3 Retiga (Q-Imaging), equipped of a FLUAR 40×/1.3 oil objective and controlled by METAFLUOR 7.7.2.0 Software (Molecular Device). Emission ratio imaging of the cameleon was accomplished with a 436DF20 excitation filter, a 450 nm dichroic mirror, and two emission filters (475/40 for ECFP and 535/25 for citrine), controlled by a Lambda 10-2 filter changer (Sutter Instruments). Fluorescence images were background corrected. Exposure times were typically 50 to 100 ms, and images were collected every 1 to 2 s. Mitochondrial Ca2+ uptake was followed over time after stimulation with 1 μM BK or 100 μM H2O2, as indicated in the figures. In the figures, representative traces from single experiments are presented as normalized FRET fluorescence ratio intensity. Statistical analyses refer to normalized FRET fluorescence ratio peak intensity after BK stimulation, or Σ(FRET fluorescence ratio) over time after H2O2 stimulation.
Co-immunoprecipitation
Cells (fibroblasts cell cultures or HEK-293, as indicated in the Figures) were collected and lysed in buffer containing 30 mM Tris-HCl, at pH 7.5, 50 mM NaCl, 1% NP-40. To map the BAP1 and IP3R3 binding region, HEK-293 cells were transiently transfected using polyethylenimine, collected 24 hours later, and lysed in 50 mM Tris, at pH 7.5, 150 mM NaCl, glycerol 10%, 1 mM EDTA, 50 mM NaF and NP-40 0.1%. All the buffers were supplemented with proteases and phosphatases inhibitors. Extracted proteins were pre-cleared by incubating lysates with G-coated sepharose beads (GE Healthcare) for 1 hour at 4 °C, then the supernatant (700 μg, referred as “Input”) was incubated overnight with IP3R3 antibody at 4 °C; precipitation of the immune complexes was performed with G-coated sepharose beads for 4 hours at 4 °C, according to manufacturer's instructions. Alternatively, the supernatant was incubated for 3 hours at 4 °C with FLAG® M2 resin (Sigma, cat. no A2220) or HA resin (Roche, cat. no. 11815016001). After immunoprecipitation, the beads were washed three times with lysis buffer, at 4 °C, and suspended in 40 μl of 2X Laemmli buffer. 10-20 μl (depending on experiment) were loaded on the gel and the samples were processed by SDS-PAGE and analyzed by WB.
Duolink Proximity Ligation In Situ Assay
BAP1WT and BAP1+/- fibroblasts were fixed in 4% paraformaldehyde for 10 min at 37 °C, and then washed in PBS. Cells were permeabilized with 0.05% Triton X-100 (v:v in PBS) for 10 min at 37 °C. Unspecific binding sites were blocked by incubating cells in 2% BSA (w:v in PBS-0.05% Triton) for 1 hour at 37 °C. Cells were then incubated overnight at 4°C with PLA oligonucleotide probes conjugated to primary antibodies specific for IP3R3 (BD Biosciences, cat. no. 610312) and BAP1 (Santa Cruz Biotechnology, cat. no. sc-28236), in diluent buffer according to the Duolink In Situ – Probes Maker protocol (Sigma-Aldrich, cat. no. DUO92101). Detection was performed according to the manufacturer's protocol. Briefly, a ligation-ligase solution was added to each sample for 30 minutes at 37 °C, and then washed twice for 2 minutes with 1x Duolink In Situ Wash Buffer A. An Amplification-Polymerase solution was added for 100 min at 37 °C, and then washed twice for 10 minutes with 1x Duolink In Situ Wash Buffer B. The slides were mounted using Duolink In Situ Mounting Medium with DAPI. Protein-protein interactions appear as red dots. Images were processed and red dots counted using the Analyze Particles ImageJ software plugin.
In vitro ubiquitylation and de-ubiquitylation assays
In vitro ubiquitylation assays were performed as previously described40. Briefly, FLAG-tagged IP3R3(NT) was co-transfected with either empty vector, Myc-tagged BAP1 or the catalytic dead mutant BAP1(C91S) into HEK-293 cells. 24 hours after transfection, FLAG-IP3R3(NT) was immunoprecipitated with anti-FLAG M2 agarose beads. The beads were washed three times in lysis buffer and once in PBS. In vitro ubiquitylation assays were performed on immunoprecipitated beads in a volume of 50 μl, containing 50 mM Tris-HCl, at pH 7.5, 5 mM MgCl2, 1 μM OA, 2 mM ATP, and 0.5 mM DTT, 0.1 μM E1 (Boston Biochem), 0.25 μM Ubch3 (Boston Biochem), 0.25 μM Ubch5c (Boston Biochem), and 2.5 μg μl−1 human ubiquitin (Boston Biochem). Samples were incubated for 1 hour at 33 °C, washed twice with PBS at 4 °C, suspended in 2X Laemmli buffer, and analyzed by SDS-PAGE and WB.
For in vitro de-ubiquitylation assays, HEK-293 cells were transfected with FLAG-IP3R3(NT), Myc-BAP1 or Myc-BAP1(C91S). FLAG-IP3R3(NT) was immunopurified and in vitro ubiquitylation was performed. Then, beads were washed twice with PBS at 4 °C, and suspended in de-ubiquitylation reaction buffer containing 50 mM Tris-HCl, at pH 7.5, 5 mM MgCl2, 1 μM OA, 2 mM ATP, and 0.5 mM DTT. Myc-BAP1 and Myc-BAP1(C91S) were purified with c-Myc tagged Protein MILD PURIFICATION KIT Ver.2 (MBL International, cat. no. 3305), eluted with c-Myc tag peptide accordingly to the manufacturer's instructions and added to the de-ubiquitylation reaction buffer. Samples were incubated at 33 °C for the indicated times, then beads were washed twice with PBS at 4 °C, and suspended in 2X Laemmli buffer. Samples were processed by SDS-PAGE and analyzed by WB.
Neutral comet assay
BAP1WT and BAP1+/- fibroblasts were plated at 8 × 10⁵/T25 flasks and incubated overnight, then the medium was replaced with cold PBS and cells were irradiated, on ice, with 6 Gy IR dose using a cabinet X-Ray system (Faxitron). Following IR, cells were collected immediately (detached using trypsin, harvested and frozen in 90% FBS/10% DMSO) or incubated in complete growth medium for the indicated time before being collected. Neutral comet assay and data analysis were performed by Trevigen Inc (https://www.trevigen.co). Samples were tested using Trevigen's CometAssay Electrophoresis System. Images were captured and analyzed using Loats Associates, Inc Comet Analysis System (LOATS). At least 200 cells were scored per sample. Trevigen Neutral Controls Cells were used as electrophoresis controls. Data from triplicate wells for each sample were pooled to calculate the median and mean, and expressed as Tail Moment. Experiments were conducted and analyzed by investigators blinded to the genotype and experimental conditions of the samples.
Kinetics of H2A.X phosphorylation
BAP1WT and BAP1+/- fibroblasts were plated and treated with 6 Gy IR, as described for neutral comet assay. In UV radiation experiments, fibroblasts were plated at 3.5 × 10⁵/60 mm dish and incubated overnight, then the medium was replaced with PBS and cells were irradiated with 50 mJ/cm2 of either UVA (340 nm, using a UVA-340 sunlamp, Atlas Material Testing Technology), or UVB (290-315 nm, using a Philips UVB Broadband TL 40W/12 RS SLV/25). For UVA and UVB, spectral output was quantified with a General UV-513/AB Digital UV AB Light Meter.
Following radiation, cells were collected immediately or incubated in complete growth medium for the indicated time before being collected. Dry cell pellets were immediately store at -80 °C. Total cell lysates were prepared by sonication in 200 μl of buffer containing 25 mM Tris-HCl pH 7.5 and 1% SDS. Samples were immediately boiled at 95 °C for 10 min. Following centrifugation, the supernatant was collected and the protein concentration determined using the Pierce BCA Protein Assay Kit (Life Technologies, cat. no. 23225). SDS-PAGE and WB were conducted according to standard procedure (see above).
Clonogenic survival assay after exposure to IR or UV
In ionizing radiation experiments, BAP1WT and BAP1+/- fibroblasts were plated and treated with the indicated Gy IR, as described for neutral comet assay. In UV radiation experiments, fibroblasts were plated at 3.5 × 10⁵/60 mm dish and incubated overnight, then the medium was replaced with PBS and the cells were irradiated with 25 mJ/cm2 as described for Kinetics of H2A.X phosphorylation.
After irradiation, fibroblasts were trypsinized, harvested, counted and plated on 6-well plates. Cells were incubated at 37 °C for 14 days (the tissue culture medium was changed twice a week) to allow colony formation. The surviving colonies were washed with PBS and fixed and stained with 0.5% crystal violet in 50/50 methanol/water for 10 min, followed by three washes with PBS. Colonies were counted and the plating efficiencies (PE) were calculated for untreated cells as the ratio of the number of colonies to the number of cells seeded. The surviving fractions, expressed in terms of PE, were calculated as the ratio between the number of colonies that arise after treatment and the number of cells seeded × PE.
In vitro cell transformation assay
HM transformation assay was accordingly to an established protocol28,41. HM cells were cultured and seeded in six-well plates at a density of 3 × 10⁵ cells per well in 20% FBS growth medium. After 24 hours, the medium was switched to 0.1% FBS, and transfection performed with HiPerfect as described above. When indicated, transduction of cells was performed 6 hours after Hiperfect transfection. 24 hours later, HM were pretreated with 10 ng/ml Recombinant Human Tumor Necrosis Factor-alpha (TNF-α; PromoKine, cat. no. C-63720), or 0.1% BSA (vehicle), and incubated for additional 24 hours. At this time point, HM were exposed to 5 μg/cm2 crocidolite asbestos fibers or PBS (control) for 48 hours. HM were then maintained in 10% FBS supplemented with 10 ng/ml TNF-α. Transfection/transduction were repeated every 96 hours in fresh 10% FBS supplemented with 10 ng/ml TNF-α. Media was completely replaced 24 hours after transfection/transduction, then cells were incubated at 37 °C for the remaining 72 hours. After 2 to 3 weeks, three-dimensional foci were identified and counted under a light microscope. Experiments were performed three times.
Statistics and Reproducibility
Statistical analyses were performed using Student's two-tailed unpaired t-tests, unless otherwise specified. P-values < 0.05 were considered statistically significant and marked with asterisks (*P < 0.05; **P < 0.01; ***P < 0.001), as indicated in the Figure legends. All data collected met the normal distributions assumption of the test. Data are represented as mean ± s.e.m., unless otherwise specified. The exact sample size (n) for experimental groups/conditions and whether samples represent technical or cell culture replicates are indicated in the Figure legends and Supplementary Tables. The exact sample size of Ca2+ experiments are reported in Supplementary Tables 1 and 2. For all other experiments, unless otherwise specified, the results shown are representative of experiments independently conducted three times that produced similar results.
Extended Data
Extended Data Figure 1. Fibroblasts from BAP1 germline mutation carriers have reduced BAP1 protein levels, do not show differences in growth or cell cycle progression, and are protected from apoptosis.
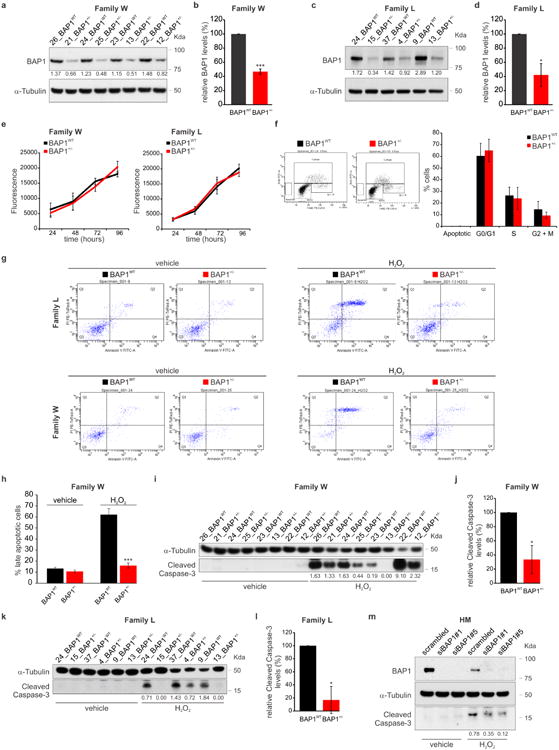
a-d, Western blot (WB): amounts of WT BAP1 in total cell lysates of W (a) and L (c) fibroblasts, matched by gender and age (see Supplementary Fig. 1; i.e., W: 26_BAP1WT and 21_BAP1+/-; etc., as shown in subsequent figures); decimals indicate the amounts of BAP1 relative to α-Tubulin as per densitometry. b, d, Densitometric analyses. BAP1 protein levels normalized to α-Tubulin in fibroblast cell cultures from W (b) and L (d) family members matched by gender and age; data shown as mean ± s.e.m. of n = 4 (b) and n = 3 (d) biological replicates per condition, representative of three or more independent experiments. e, AlamarBlue assay was used to measure cell growth at the indicated time points, in fibroblasts from W (left panel) and L (right panel) family members; data shown as mean ± s.d. of n = 6 technical replicates per data point, representative of three or more independent experiments in biological replicates. f, Flow cytometry analyses showing percentage of cells in different phases of the cell cycle; data shown as mean ± s.e.m. of n = 4 biological replicates per condition. No differences were observed between BAP1WT and BAP1+/- fibroblasts from either W and L family members. g, Representative flow cytometry dot plots assessing Annexin V-FITC and PI staining in fibroblasts from L (upper panels, n = 4 independent experiments: 3 biological replicates per condition, 1 culture replicate) and W (lower panels, n = 4 biological replicates per condition) family members treated with 100 μM H2O2 for 6 hours. h, Late apoptotic cells calculated as percentage of gated cells in the top right quadrant (Q2: Annexin V+/PI+); data shown as mean ± s.e.m. of n = 4 biological replicates per condition. i-l, Cleaved caspase-3 levels measured by WB in fibroblast cell cultures from W (i) and L (k) family members, matched by gender and age, treated with H2O2. Decimals indicate the densitometrically determined amounts of cleaved caspase-3 relative to α-Tubulin. j, l, Cleaved caspase-3 densitometry of bands in BAP1+/- fibroblasts expressed relatively to the amounts detected in BAP1WT fibroblasts (100 %); data shown as mean ± s.e.m. of n = 4 (j) and n = 3 (l) biological replicates per condition, representative of at least three independent experiments. m, Primary human mesothelial cells (HM) were transfected with control scrambled siRNA, or siRNAs-BAP1 (siBAP1#1 and siBAP1#5). After 24 hours, cells were treated with 200 μM H2O2 for 6 hours. Total cell lysates were prepared and analyzed by WB to compare cleaved caspase-3 levels. Decimals indicate densitometrically determined cleaved caspase-3 levels normalized to α-Tubulin. Similar results were obtained in 3 separate HM primary cultures from different donors. Black, BAP1WT; Red, BAP1+/-; *, P<0.05; ***, P<0.001, calculated using two-tailed unpaired Student's t-tests. WB source images, see Supplementary Fig. 2.
Extended Data Figure 2. Subcellular fractionation and immunofluorescence showing BAP1 localization at the ER.
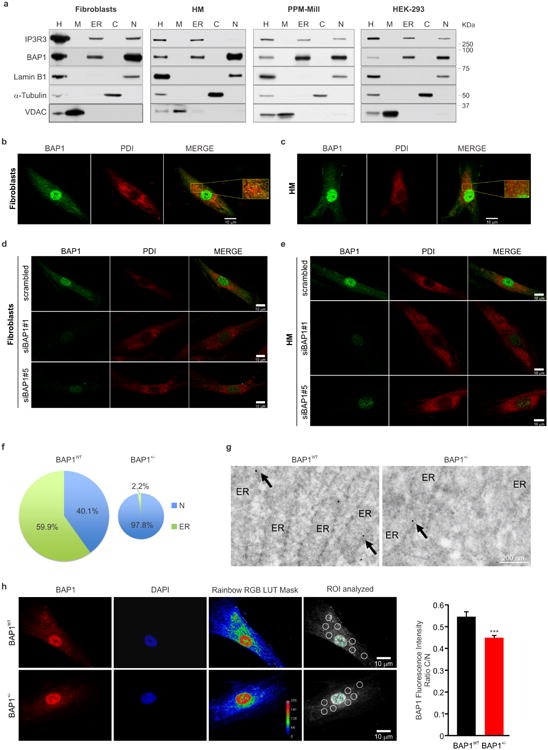
a, WB showing the amounts of BAP1 in the subcellular fractions of primary fibroblasts, HM, PPM-Mill (a human MM cell line), and HEK-293 (human embryonic kidney cells). H: homogenate; M: mitochondria; ER: endoplasmic reticulum; C: cytosol; N: nuclei. Markers: mitochondria (VDAC), ER (IP3R3), nuclei (Lamin B1), cytosol (α-Tubulin). b, c, IF: BAP1 localization in WT fibroblasts (b) and HM (c). Cells were immunostained for BAP1 (green) and PDI (ER marker, red). Merged images show the overlapping yellow signal between BAP1 and PDI. Inserts show magnified merged images. BAP1, besides its nuclear localization, shows a diffuse pattern of punctate hyper-fluorescent spots in the cytoplasm that co-localized with the ER, in both BAP1WT fibroblasts (b) and in HM (c). Representative IF images from n = 10 fields of view; scale bar, 10 μm. d, e, The specificity of BAP1 IF staining was confirmed by complete disappearance of this IF pattern when BAP1 was down-regulated using two different siRNAs, but not in cells transfected with scrambled siRNA. IF in WT fibroblasts (d) and HM (e) after BAP1 silencing. Cells were transfected with control scrambled siRNA or siRNAs-BAP1 (siBAP1#1 and siBAP1#5). After 24 hours, the cells were immuno-stained using monoclonal antibodies for BAP1 (green) and PDI (ER marker, red). Merged images show the overlapping signal (yellow) between BAP1 and PDI. Representative IF images from n = 5 fields of view per condition; scale bar, 10 μm. f, Percentages of nuclear (N) and ER localized BAP1 in BAP1WT and BAP1+/- fibroblasts, related to Fig. 1d. Densitometric analysis of the intensity of the bands was performed using ImageJ, and the amounts of nuclear and ER localized BAP1 were normalized on the respective markers, Lamin B1 (nuclei) and IP3R1 (ER). The total, combined, amount of nuclear and ER BAP1 was reduced by 47.9% in BAP1+/- fibroblasts, depicted by the smaller size of the pie chart. Percentages of BAP1 in the nuclear or ER fractions are relative to the total amount of nuclear and ER BAP1. g, Immunogold BAP1 labeling of cryosections in BAP1WT and BAP1+/- fibroblasts. Note reduced detection of BAP1 associated with the ER (arrows) in BAP1+/- cells; scale bar 200 nm. h, IF showing reduced Cytoplasm/Nucleus (C/N) ratio intensity in BAP1+/- fibroblasts. Cells were stained with DAPI (nuclei, blue) and BAP1 (red). Representative images from n = 20 fields of view per condition. Rainbow RGB LUT mask shows color-coded contrast and pseudocoloring according to an arbitrary color LUT (see pseudocolor scale, numbers on the scale are: 0, black; 64, blue, 128, green, 191, light red, 255, darker red). Scale bar, 10 μm. The bar graph shows the mean ± s.e.m. of the C/N ratio intensity measured in random region of interests (ROIs) of the acquired images: the areas (ROIs) where the intensities of fluorescence were measured are indicated by white and green circles in the cytoplasm and nucleus respectively (n = 40 cells BAP1WT; n = 46 cells BAP1+/-); *** P<0.001. P value calculated using two-tailed unpaired Student's t-test. WB and EM source images, see Supplementary Fig. 2, 3.
Extended Data Figure 3. BAP1 modulates intracellular Ca2+ homeostasis.
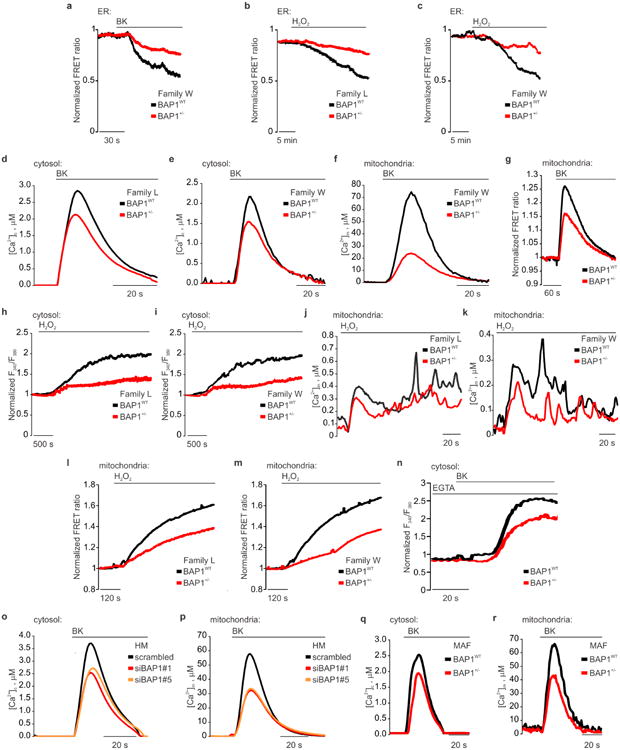
a, BAP1+/- W-fibroblasts displayed reduced Ca2+ release from the ER following stimulation with 1 μM bradykinin (BK) compared to WT fibroblasts (see also Fig. 1e). b, c, BAP1+/- L (b) and W (c) fibroblasts showed reduced Ca2+ release from the ER after stimulation with H2O2. d, e, BAP1+/- L (d) and W (e) fibroblasts had reduced cytosolic Ca2+ concentrations ([Ca2+]c) following stimulation with 1 μM BK. f, BAP1+/- W-fibroblasts, stimulated with 1 μM BK displayed reduced mitochondrial Ca2+ concentrations ([Ca2+]m) (see also Fig. 1f). g, Representative traces of single cells Ca2+ measurements using mitochondrial targeted cameleon (4mtD3cpv) showing reduced mitochondrial Ca2+ in BAP1+/- fibroblasts upon treatment with 1 μM BK. h, i, BAP1+/- L (h) and W (i) fibroblasts showed reduced cytosolic Ca2+ after stimulation with H2O2. j, k, BAP1+/- L (j) and W (k) fibroblasts displayed reduced [Ca2+]m after stimulation with H2O2. l, m, Representative time-lapse traces of single cells Ca2+ measurements using 4mtD3cpv showing reduced mitochondrial Ca2+ in BAP1+/- L (l) and W (m) fibroblasts after stimulation with 100 μM H2O2 for 20 minutes. n, Reduced intracellular Ca2+ levels in stimulated BAP1+/- fibroblasts are independent of extracellular Ca2+ influx from the plasma membrane. BAP1+/- and matched WT fibroblasts were loaded with Fura-2/AM in Ca2+-free KRB buffer supplemented with 0.1 mM ethylene glycol-bis(β-aminoethylether)-N,N,N′,N′-tetraacetic acid (EGTA), then dynamic measurements of intracellular Ca2+ levels where conducted after addition of 1 μM BK to the same buffer. Changes in intracellular Ca2+ responses after BK stimulation are displayed as the ratio of fluorescence at 340/380 nm. o, p, HM silenced for BAP1 displayed reduced [Ca2+]c (o) and [Ca2+]m (p) after stimulation with 1 μM BK. HM cell cultures were transfected with control scrambled siRNA or siRNAs-BAP1 (siBAP1#1 and siBAP1#5). After 24 hours, cells were stimulated with 1 μM BK and [Ca2+]c (o) and [Ca2+]m (p) were measured using targeted aequorin probes. q, r, Mice adult fibroblasts (MAF) derived from Bap1+/- mice displayed reduced [Ca2+]c (q) and [Ca2+]m (r) compared to Bap1WT mice, and thus they reproduce the human condition. Representative changes in [Ca2+]c (q) and [Ca2+]m (r) in MAF cells after agonist stimulation (100 μM BK). Source data, see Supplementary Table 1, 2.
Extended Data Figure 4. BAP1 targeting to ER, nucleus and cytoplasm differentially affects mitochondrial Ca2+ homeostasis.
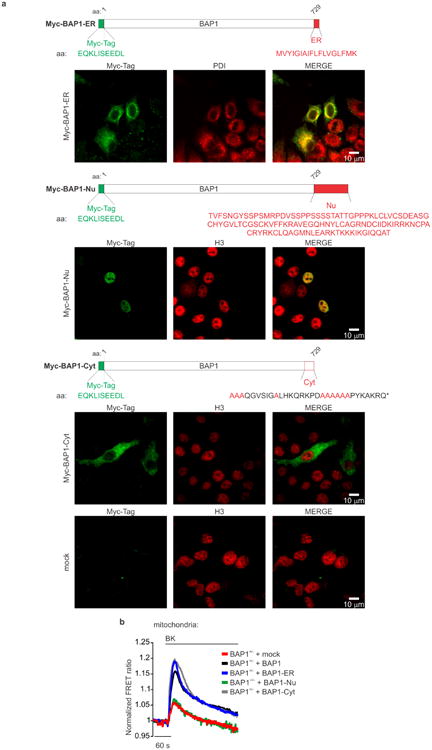
a, Localization of Myc-tagged BAP1 chimeras. IF: BAP1 localization in WT fibroblasts. ER chimera (Myc-BAP1-ER): BAP1 was fused to the ER-targeting sequence from the yeast UBC6 protein to target BAP1 to the cytosolic face of the ER membrane. Nuclear chimera (Myc-BAP1-Nu): BAP1 was fused to a sequence derived from the glucocorticoid receptor NR3C1. Cytoplasmic chimera (Myc-BAP1-Cyt): point mutations were introduced in the NLS region of BAP1 to prevent its nuclear localization (*: STOP codon). BAP1 localization is shown in green using a Myc-Tag antibody, the nuclei and the ER are shown in red using histone H3 (nucleus) and PDI (ER) antibodies. The merged signal is shown in yellow. Note the specific localization of the three chimeras to the ER, nuclei and cytoplasm. Mock, empty vector (control). Representative IF images from n = 5 fields of view per condition; scale bar, 10 μm. b, Representative traces of single cells Ca2+ measurements in BAP1+/- fibroblasts co-transfected with mitochondrial targeted 4mtD3cpv and either BAP1 or targeted BAP1-ER, BAP1-Nu, BAP1-Cyt; mock, co-transfection with an empty vector. Mitochondrial Ca2+ uptake was followed over time after stimulation with 1 μM BK. Descriptive statistic is shown in Supplementary Table 1.
Extended Data Figure 5. BAP1 stabilizes IP3R3.
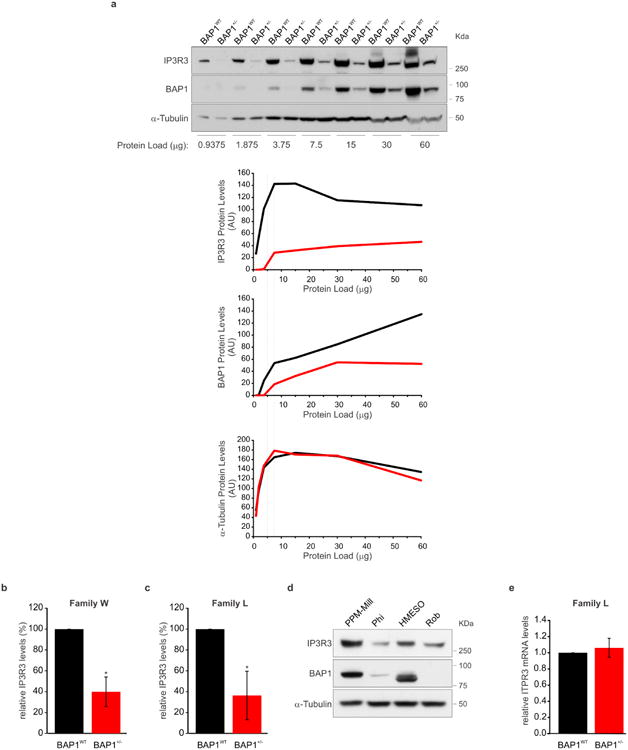
a, Defining the linear dynamic range of BAP1 and IP3R3 detection by WB. The upper panel shows a representative WB performed on a two-fold dilution series (from 60 to 0.9375 μg) of total cell homogenates from BAP1+/- and matched control BAP1WT fibroblasts. Protein levels were determined using the following primary antibodies: BAP1 (C-4), Santa Cruz Biotechnology, cat. no. sc-28383, 1:300; IP3R3, BD Biosciences, cat. no. 610312, 1:500; α-Tubulin (4G1), Santa Cruz Biotechnology, cat. no. sc-58666, 1:15,000. A horseradish peroxidase (HRP)-conjugated secondary antibody (Stabilized Peroxidase Conjugated Goat Anti-Mouse, Thermo Scientific, cat. no. 32430; 1:1,000 for BAP1 and IP3R3, 1:5,000 for α-Tubulin) was used to generate the chemiluminescent signal captured on autoradiography film. Digital images were acquired, then densitometric analysis of the intensity of the bands was performed using ImageJ, and expressed as arbitrary optical densitometry units (AU). The lower panels show the AU for IP3R3, BAP1 and α-Tubulin, plotted against the protein load. The dotted lines define the linear dynamic range of protein load for BAP1, IP3R3 and α-Tubulin detection. b, c, Densitometric analysis of IP3R3 protein levels normalized to α-Tubulin in fibroblasts from W (b) and L (c) family members, related to Fig. 2a, b. Densitometry of bands in BAP1+/- fibroblasts is expressed relative to BAP1WT fibroblasts (100%), matched by gender and age as indicated in Supplementary Fig. 1a, b; data shown as mean ± s.e.m. of n = 4 (b) and n = 3 (c) biological replicates per condition, representative of three independent experiments; *, P<0.05 calculated using two-tailed paired Student's t-tests. d, MM cell lines with mutated BAP1 contained reduced amounts of IP3R3: PPM-Mill (WT BAP1), Phi (mutated BAP1 with shorter splicing isoform), HMESO (mutated BAP1 alternative splicing, shorter protein) and Rob (BAP1 null). e, Quantitative Real-time PCR analysis of ITPR3, the gene that codes for IP3R3. mRNA expression levels were normalized using the geometrical mean of B2M, 18S and β-actin reference genes in BAP1WT and BAP1+/- fibroblasts. mRNA expression levels in BAP1+/- fibroblasts are expressed relative to BAP1WT. Data shown as mean ± s.e.m. of n = 6 technical replicates, representative of three independent experiments in biological replicates. WB source images, see Supplementary Fig. 2.
Extended Data Figure 6. BAP1 binds IP3R3.
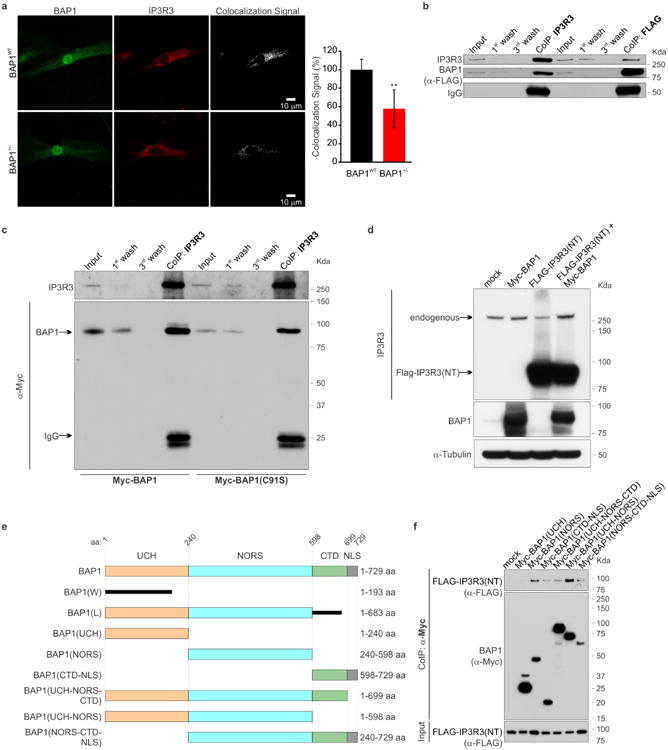
a, IF, reduced BAP1 colocalization with IP3R3 in BAP1+/- fibroblasts compared to BAP1WT fibroblasts. Cells were immunostained for BAP1 (green) and IP3R3 (red). Images were processed with the ImageJ software equipped with Colocalization Highlighter plugin; the colocalization signal is showed in white. Scale bar, 10 μm. The bar graph depicts the decreased colocalization of BAP1 and IP3R3 in BAP1+/- fibroblasts, expressed as (%) mean ± s.e.m.; ** P<0.01 (n = 9 cells per condition), P value calculated using two-tailed unpaired Student's t-test. b, Co-immunoprecipitation (CoIP) of IP3R3 and BAP1 from HEK-293 cells stably expressing FLAG-HA-BAP1. c, CoIP of endogenous IP3R3 and Myc-tagged BAP1 WT or the catalytic inactive BAP1(C91S). Washes (1st and 3rd) show loss of bound proteins that washed out during three sequential washes of the immuno-complexes. BAP1(C91S) retains the ability to bind IP3R3. d, The dominant negative effect of NT-IP3R3 overexpression on endogenous IP3R3 levels is counteracted by concomitant BAP1 overexpression, findings indicating that BAP1 binds IP3R3 and prevents its degradation. e, Schematic representation of BAP1 domains, truncated W and L mutants (see also reference 5), and fragments. Domains of the 729 amino acid (aa) BAP1 protein (1–729 aa), consisting of an N-terminal Ubiquitin carboxy-terminal hydrolase (UCH) domain (1–240 aa), a non-regular secondary structure (NORS) domain (240–598 aa), a C-terminal (CTD) domain (598–699 aa) and NLS (699–729). Numbers refer to amino acids positions. BAP1(W) and BAP1(L) are the predicted truncations of BAP1 resulting from the germline mutations in W and L families, respectively. f, Mapping of the BAP1 region interacting with IP3R3. HEK-293 cells were co-transfected with FLAG-IP3R3(NT) and the indicated Myc-tagged BAP1 fragments expression vectors; cell extracts were used for CoIP using anti-Myc resin. The BAP1 region UCH-NORS had the highest binding affinity to Flag-IP3R3(NT), and the CTD-NLS region contributed to the binding, whilst the UCH region alone showed no interaction. WB source images, see Supplementary Fig. 2.
Extended Data Figure 7. Effects of BAP1 silencing on IP3R3 protein levels, mitochondrial Ca2+ uptake and apoptosis.
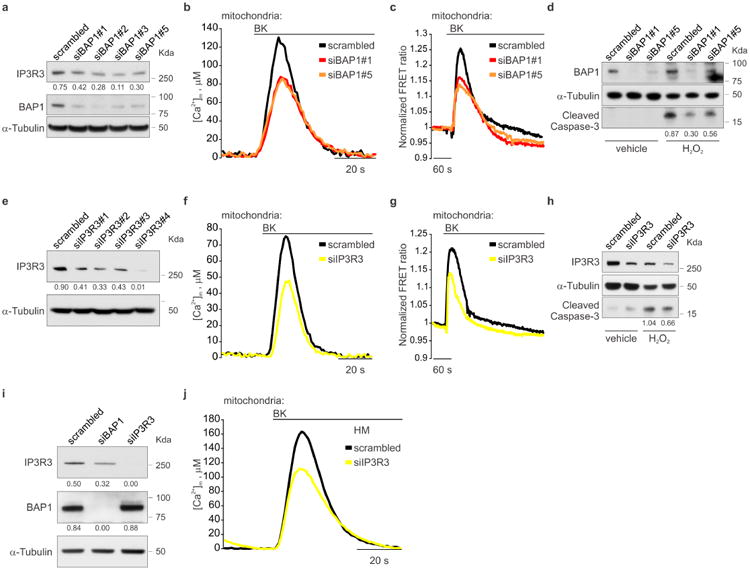
a, WB of BAP1 and IP3R3 protein levels in BAP1WT fibroblasts silenced for BAP1. b, [Ca2+]m measurements following stimulation with 1 μM BK, in BAP1WT fibroblasts transfected with control scrambled siRNA or siRNAs-BAP1 (siBAP1#1 and siBAP1#5). c, Representative traces of single cells Ca2+ measurements in BAP1WT fibroblasts transfected with mitochondrial targeted 4mtD3cpv and control scrambled siRNA, or siBAP1#1 and siBAP1#5; mitochondrial Ca2+ uptake was followed over time after stimulation with 1 μM BK. d, Reduced sensitivity to apoptosis after treatment with 100 μM H2O2 for 6 hours, in BAP1WT fibroblasts after BAP1 silencing. e-h, IP3R3 silencing in BAP1WT fibroblasts (e) leads to decreased mitochondrial Ca2+ uptake following stimulation with 1 μM BK - as shown both by cell-population experiments with mitochondrial targeted aequorin (f) or single-cell experiments with 4mtD3cpv (g) - and protection from apoptosis (h). i, j, BAP1 or IP3R3 silencing in primary HM leads to reduced IP3R3 protein levels (i), and decreased [Ca2+]m following stimulation with 1 μM BK (j and Extended Data Figure 3p). In a, e and f: decimals indicate the amounts of IP3R3 or BAP1 relative to α-Tubulin, as per densitometry. In d and h: decimals indicate the amounts of cleaved caspase-3 relative to α-Tubulin, as per densitometry. WB source images, see Supplementary Fig. 2. b, c, f, g, j, Source data, see Supplementary Table 1, 2.
Extended Data Figure 8. Effects of BAP1 rescue on IP3R3 protein levels, mitochondrial Ca2+ uptake, apoptosis, and IP3R3 deubiquitylation.
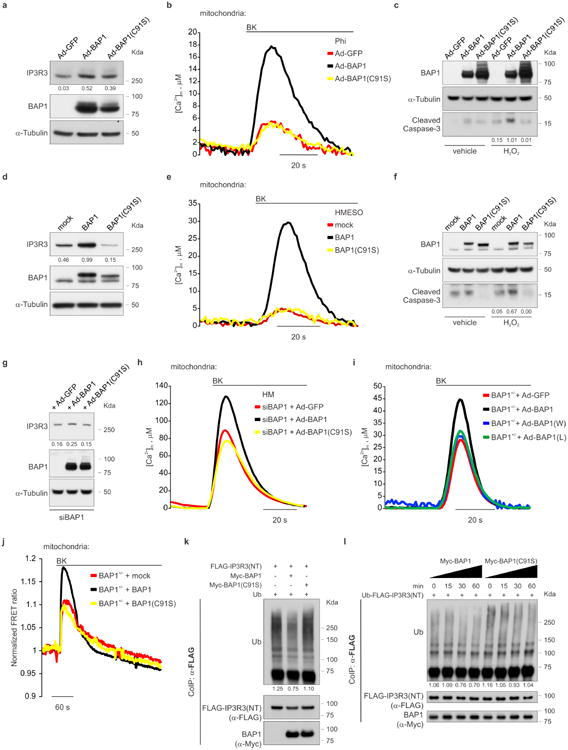
a-c, Phi (human MM cell line with mutated BAP1, see Extended Data Figure 5d) were transiently transduced with WT BAP1 (Ad-BAP1), catalytically inactive BAP1(C91S)-mutant, or control (Ad-GFP). BAP1 WT, (a) stabilizes IP3R3, (b) increase [Ca2+]m following stimulation with 1 μM BK, and (c) apoptosis, while the catalytic inactive BAP1(C91S) mutant was less effective. In c, cells were treated with 500 μM H2O2 for 6 hours and total cell lysates were prepared and analyzed by WB to compare cleaved caspase-3 levels. d-f, Stable clones of HMESO (human MM cell line with mutated BAP1, see Extended Data Figure 5d) in which we reintroduced BAP1 WT, the catalytic inactive BAP1(C91S), or an empty vector (mock), showed that BAP1 WT - but not the catalytic inactive BAP1(C91S) mutant - (d) stabilizes IP3R3, and (e) increases [Ca2+]m following stimulation with 1 μM BK, and (f) apoptosis in cells treated with 100 μM H2O2 for 3 hours. Total cell lysates were analyzed by WB to compare cleaved caspase-3 levels. g, h, HM containing WT BAP1, were first silenced for BAP1 using siRNA and subsequently transduced with WT BAP1 (Ad-BAP1), catalytically inactive BAP1(C91S)-mutant or control (Ad-GFP). BAP1 WT, but not the catalytic inactive BAP1(C91S) mutant, (g) stabilizes IP3R3 and (h) increases [Ca2+]m following stimulation with 1 μM BK. Panels a, c, d, f, g: decimals indicate the amounts of IP3R3 or cleaved caspase-3 relative to α-tubulin, as per densitometry. i, BAP1+/- fibroblasts were transduced with WT BAP1 (Ad-BAP1), truncated BAP1(W) and BAP1(L), or control (Ad-GFP), and [Ca2+]m was measured following stimulation with 1 μM BK. j, Representative traces of single cells Ca2+ measurements in BAP1+/- fibroblasts co-transfected with mitochondrial targeted 4mtD3cpv and, either BAP1, or the catalytically inactive BAP1(C91S)-mutant; mock, co-transfection with an empty vector. Mitochondrial Ca2+ uptake was followed over time after stimulation with 1 μM BK. k, Ubiquitylation assay showing that BAP1 WT (Myc-BAP1), but not BAP1(C91S)-mutant, deubiquitylates the N-terminus of IP3R3. HEK-293 cells were co-transfected with FLAG-IP3R3(NT) and either Myc-BAP1, Myc-BAP1(C91S) or empty vector. Ub, Ubiquitin. l, Ubiquitylation/deubiquitylation assay to monitor BAP1 deubiquitylation of FLAG-IP3R3(NT). Either immunopurified WT Myc-BAP1 or catalytically inactive Myc-BAP1(C91S) were incubated in vitro with ubiquitylated FLAG-IP3R3(NT). Protein levels were analyzed by WB with the indicated antibodies. The ladder of bands with a relative molecular mass of ≥ 90 KDa corresponds to ubiquitylated FLAG-IP3R3(NT). Decimals indicate the amounts of ubiquitylated FLAG-IP3R3(NT) normalized on total co-immunoprecipitated FLAG-IP3R3(NT) at 90 KDa. WB source images, see Supplementary Fig. 2. b, e, h, i, j, Source data, see Supplementary Table 1, 2.
Extended Data Figure 9. BAP1+/- fibroblasts exposed to ionizing radiation (IR) or to ultraviolet (UV) radiation show increased survival in spite of increased DNA damage.
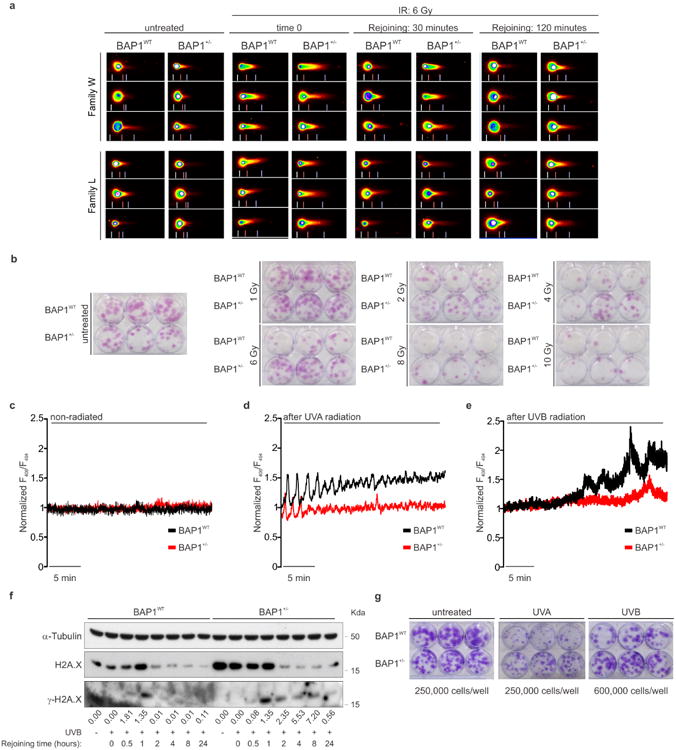
a, Representative images of comet assays. W and L family derived fibroblasts were irradiated and analyzed at the indicated time points (see also Fig. 4a). Representative results showing the rejoining of the DNA damage measured as percentage of the tail moment at the indicated time points, after BAP1+/- fibroblasts and matched controls were irradiated with 6 Gy IR. The length of the tail of the comet is proportional to the DNA damage. Note increased tail length in BAP1+/- cells. b, Clonogenic assay showing higher number of colonies in BAP1+/- fibroblasts following irradiation at the indicated amounts (see Fig. 4c). c-e, Reduced intracellular Ca2+ levels in BAP1+/- fibroblasts following ultraviolet radiation with UVA (340 nm) or UVB (312 nm). Dynamic measurements of cytosolic Ca2+ response were performed using the fluorescent Ca2+ indicator Fura-RED. c, Control; no changes in dynamic intracellular Ca2+ levels were detected over time in non-radiated BAP1+/- fibroblasts and matched controls. d, e, Dynamic measurements of intracellular Ca2+ levels in BAP1+/- fibroblasts and matched controls following UVA (d) or UVB (e). Changes in intracellular Ca2+ responses over time are displayed as the ratio of fluorescence at 406/494 nm. Descriptive statistic is shown in Supplementary Table 1. f, Delayed DNA repair following UVB radiation in BAP1+/- fibroblasts. γ-H2A.X kinetics: BAP1WT and BAP1+/- fibroblasts were exposed to UVB and γ-H2A.X amounts were measured in cell lysates collected at the indicated time points. Total levels of H2A.X are shown as control. Densitometry: decimals indicate the amounts of γ-H2A.X relative to H2A.X. g, Clonogenic assay at 2 weeks post UV radiation: higher number of colonies in BAP1+/- fibroblasts following UVA, or UVB exposure. Plating: untreated 250,000 cells/well; UVA, 250,000/well; UVB treated 600,000/well to accommodate for the higher potency of UVB that caused extensive cell death. Cells were exposed to 25 mJ/cm2, see also Fig. 4d, e. Higher doses of 50, 75 and 100 mJ/cm2, killed all the cells within 2 weeks from exposure. WB source images, see Supplementary Fig. 2.
Extended Data Figure 10. HM and macrophages with reduced levels of BAP1 or IP3R3 are resistant to asbestos-induced apoptosis.
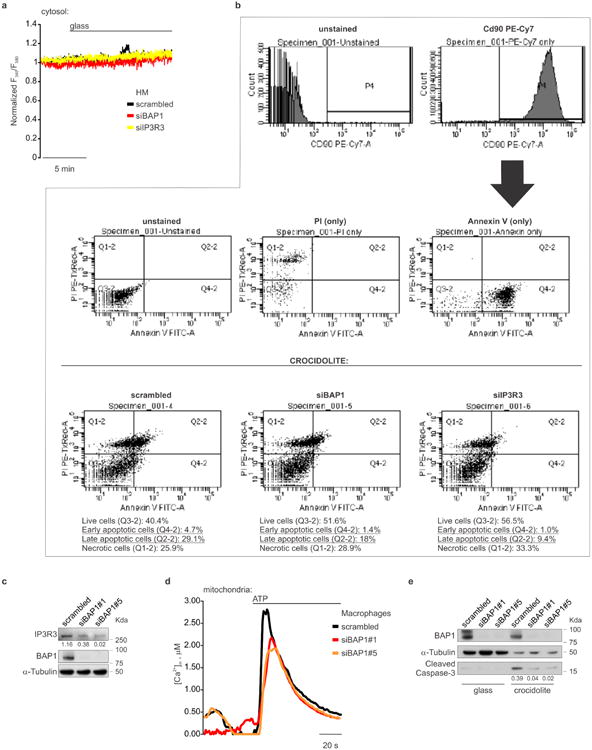
a, Primary HM transfected with either scrambled, siBAP1 or siIP3R3, and exposed to glass, displayed no changes in intracellular Ca2+ concentrations (control for Fig. 4f). b, Flow cytometric analyses of HM silenced for BAP1, IP3R3, or scrambled control, and exposed to crocidolite asbestos for 24 hours. Note that HM silenced for BAP1 or IP3R3 show a reduction in the percentage of apoptotic cells compared to scrambled control. c-d, BAP1 silencing in human THP-1 cells differentiated into macrophages leads to decreased IP3R3 protein levels (c), reduced mitochondrial Ca2+ uptake following stimulation with 100 μM ATP (d), and protection from apoptosis following treatment with 5 μg/cm2 crocidolite asbestos (e). In d, THP-1 cells were treated with 20 μM 12-O-Tetradecanoylphorbol 13-acetate (TPA) for 24 hours to induce monocytes differentiation into macrophages; subsequently cells were transduced with WT mitochondrial targeted aequorin (mtAEQ) for 24 hours in presence of TPA, and then transfected with control scrambled siRNA or siRNAs-BAP1 (siBAP1#1 and siBAP1#5) for additional 24 hours prior to Ca2+ measurements. In e, cells were treated with 20 μM TPA for 48 hours, transfected with control scrambled siRNA, siBAP1#1 and siBAP1#5 for 24 hours, and treated with 5 μg/cm2 crocidolite asbestos for additional 24 hours; total cell lysates were analyzed by WB to compare cleaved caspase-3 levels. In c and e, decimals indicate densitometrically determined IP3R3 or cleaved caspase-3 levels normalized to α-Tubulin. WB source images, see Supplementary Fig. 2. a, d, For source data see Supplementary Table 1, 2.
Supplementary Material
Supplementary Table 1: Descriptive statistic of fluorescence ratio (◆ FRET FYFP/FCFP; ■ F340/F380; ● F406/F494) based on Ca2+ measurements shown in main Figures and Extended Data Figures.
Supplementary Table 2: Descriptive statistic of [Ca2+] measurements shown in main Figures and Extended Data Figures.
Acknowledgments
We are grateful to the members of L and W families who donated their cells to our research. We acknowledge Dr. K. Dixon for advice on UV studies, M. Pagano for advice on ubiquitylation assays, H. Yu for advice on DNA repair studies, I. Pagano for critical review of all statistical analyses, and G. Khan for technical support. This work was supported by NCI R01 CA198138 to M.C; by NCI-R01 CA160715, DOD CA120355 to H.Y., and by the University of Hawai'i Foundation, which received unrestricted donations to support mesothelioma research from Honeywell International Inc., to M.C., and by The Riviera United 4-a Cure to M.C. and H.Y; by the AIRC (IG-18624, MFAG13521) and the Italian Ministry of Health to P.P. and C.G. P.P thanks Camilla degli Scrovegni for support.
Footnotes
Supplementary Information is available in the online version of the paper.
Author contributions. M.C. conceived the study. A.B. led the experiments and prepared the figures. M.C., S.Pas and H.Y. built pedigrees. M.N. and M.T genotyped patients and controls. P.M., G.S., L.K.F. performed skin biopsies. A.B., C.G, K.V established fibroblasts cell cultures. A.B., C.G., S.P., V.S. independently conducted and reproduced cell death assays. D.L. performed flow cytometry experiments. A.R. and C.T. performed EM studies. A.B. and C.G. performed subcellular fractionation studies. A.B. performed WB, CoIP, aequorin-based Ca2+ measurements and in vitro cell transformation assays. C.G. and S.P. performed single cells Ca2+ measurements. C.G., S.P., F.O., performed IF studies. A.D. performed PLA studies. A.B. with the help of S.K. performed ubiquitylation assays. L.P. performed qRT-PCR studies. A.B., C.G. and S.P., with the help of E.B.A. performed IR and UV radiation studies. A.N., S.Pas., G.G., and H.I.P. critically discussed the results. M.C., H.Y. and P.P. coordinated the study and oversaw the results. A.B. and M.C., wrote the manuscript with help from co-authors.
Authors information. M.C. has a pending patent applications on BAP1. M.C. provides consultation for mesothelioma diagnosis. The authors have no other potential competing financial interests.
Data availability: The authors declare that the data supporting the findings of this study are either available within the paper (and its Supplementary Information files) or are available from the corresponding author upon reasonable request.
References
- 1.Carbone M, et al. Consensus Report of the 2015 Weinman International Conference on Mesothelioma. J Thorac Oncol. 2016;11:1246–1262. doi: 10.1016/j.jtho.2016.04.028. [DOI] [PMC free article] [PubMed] [Google Scholar]
- 2.Carbone M, et al. BAP1 and cancer. Nat Rev Cancer. 2013;13:153–159. doi: 10.1038/nrc3459. [DOI] [PMC free article] [PubMed] [Google Scholar]
- 3.Napolitano A, et al. Minimal asbestos exposure in germline BAP1 heterozygous mice is associated with deregulated inflammatory response and increased risk of mesothelioma. Oncogene. 2016;35:1996–2002. doi: 10.1038/onc.2015.243. [DOI] [PMC free article] [PubMed] [Google Scholar]
- 4.Baumann F, et al. Mesothelioma patients with germline BAP1 mutations have 7-fold improved long-term survival. Carcinogenesis. 2015;36:76–81. doi: 10.1093/carcin/bgu227. [DOI] [PMC free article] [PubMed] [Google Scholar]
- 5.Testa JR, et al. Germline BAP1 mutations predispose to malignant mesothelioma. Nat Genet. 2011;43:1022–1025. doi: 10.1038/ng.912. [DOI] [PMC free article] [PubMed] [Google Scholar]
- 6.de la Fouchardiere A, et al. Germline BAP1 mutations predispose also to multiple basal cell carcinomas. Clin Genet. 2015;88:273–277. doi: 10.1111/cge.12472. [DOI] [PubMed] [Google Scholar]
- 7.Njauw CN, et al. Germline BAP1 inactivation is preferentially associated with metastatic ocular melanoma and cutaneous-ocular melanoma families. PLoS One. 2012;7:e35295. doi: 10.1371/journal.pone.0035295. [DOI] [PMC free article] [PubMed] [Google Scholar]
- 8.Jiao Y, et al. Exome sequencing identifies frequent inactivating mutations in BAP1, ARID1A and PBRM1 in intrahepatic cholangiocarcinomas. Nat Genet. 2013;45:1470–1473. doi: 10.1038/ng.2813. [DOI] [PMC free article] [PubMed] [Google Scholar]
- 9.Farley MN, et al. A novel germline mutation in BAP1 predisposes to familial clear-cell renal cell carcinoma. Mol Cancer Res. 2013;11:1061–1071. doi: 10.1158/1541-7786.MCR-13-0111. [DOI] [PMC free article] [PubMed] [Google Scholar]
- 10.Abdel-Rahman MH, et al. Germline BAP1 mutation predisposes to uveal melanoma, lung adenocarcinoma, meningioma, and other cancers. J Med Genet. 2011;48:856–859. doi: 10.1136/jmedgenet-2011-100156. [DOI] [PMC free article] [PubMed] [Google Scholar]
- 11.Nasu M, et al. High Incidence of Somatic BAP1 alterations in sporadic malignant mesothelioma. J Thorac Oncol. 2015;10:565–576. doi: 10.1097/JTO.0000000000000471. [DOI] [PMC free article] [PubMed] [Google Scholar]
- 12.Harbour JW, et al. Frequent mutation of BAP1 in metastasizing uveal melanomas. Science. 2010;330:1410–1413. doi: 10.1126/science.1194472. [DOI] [PMC free article] [PubMed] [Google Scholar]
- 13.Pena-Llopis S, et al. BAP1 loss defines a new class of renal cell carcinoma. Nat Genet. 2012;44:751–759. doi: 10.1038/ng.2323. [DOI] [PMC free article] [PubMed] [Google Scholar]
- 14.Yoshikawa Y, et al. High-density array-CGH with targeted NGS unmask multiple noncontiguous minute deletions on chromosome 3p21 in mesothelioma. Proc Natl Acad Sci U S A. 2016 doi: 10.1073/pnas.1612074113. [DOI] [PMC free article] [PubMed] [Google Scholar]
- 15.Lee HS, Lee SA, Hur SK, Seo JW, Kwon J. Stabilization and targeting of INO80 to replication forks by BAP1 during normal DNA synthesis. Nat Commun. 2014;5:5128. doi: 10.1038/ncomms6128. [DOI] [PubMed] [Google Scholar]
- 16.Zarrizi R, Menard JA, Belting M, Massoumi R. Deubiquitination of gamma-tubulin by BAP1 prevents chromosome instability in breast cancer cells. Cancer Res. 2014;74:6499–6508. doi: 10.1158/0008-5472.CAN-14-0221. [DOI] [PubMed] [Google Scholar]
- 17.Ismail IH, et al. Germline mutations in BAP1 impair its function in DNA double-strand break repair. Cancer Res. 2014;74:4282–4294. doi: 10.1158/0008-5472.CAN-13-3109. [DOI] [PubMed] [Google Scholar]
- 18.Bhattacharya S, Hanpude P, Maiti TK. Cancer associated missense mutations in BAP1 catalytic domain induce amyloidogenic aggregation: A new insight in enzymatic inactivation. Sci Rep. 2015;5:18462. doi: 10.1038/srep18462. [DOI] [PMC free article] [PubMed] [Google Scholar]
- 19.Yu H, et al. Tumor suppressor and deubiquitinase BAP1 promotes DNA double-strand break repair. Proc Natl Acad Sci U S A. 2014;111:285–290. doi: 10.1073/pnas.1309085110. [DOI] [PMC free article] [PubMed] [Google Scholar]
- 20.Mashtalir N, et al. Autodeubiquitination protects the tumor suppressor BAP1 from cytoplasmic sequestration mediated by the atypical ubiquitin ligase UBE2O. Mol Cell. 2014;54:392–406. doi: 10.1016/j.molcel.2014.03.002. [DOI] [PubMed] [Google Scholar]
- 21.Clapham DE. Calcium signaling. Cell. 2007;131:1047–1058. doi: 10.1016/j.cell.2007.11.028. [DOI] [PubMed] [Google Scholar]
- 22.Berridge MJ. The Inositol Trisphosphate/Calcium Signaling Pathway in Health and Disease. Physiol Rev. 2016;96:1261–1296. doi: 10.1152/physrev.00006.2016. [DOI] [PubMed] [Google Scholar]
- 23.Mikoshiba K. The IP3 receptor/Ca2+ channel and its cellular function. Biochem Soc Symp. 2007:9–22. doi: 10.1042/BSS0740009. [DOI] [PubMed] [Google Scholar]
- 24.Palmer AE, Jin C, Reed JC, Tsien RY. Bcl-2-mediated alterations in endoplasmic reticulum Ca2+ analyzed with an improved genetically encoded fluorescent sensor. Proc Natl Acad Sci U S A. 2004;101:17404–17409. doi: 10.1073/pnas.0408030101. [DOI] [PMC free article] [PubMed] [Google Scholar]
- 25.Giorgi C, et al. Mitochondrial Ca(2+) and apoptosis. Cell Calcium. 2012;52:36–43. doi: 10.1016/j.ceca.2012.02.008. [DOI] [PMC free article] [PubMed] [Google Scholar]
- 26.Giorgi C, et al. PML regulates apoptosis at endoplasmic reticulum by modulating calcium release. Science. 2010;330:1247–1251. doi: 10.1126/science.1189157. [DOI] [PMC free article] [PubMed] [Google Scholar]
- 27.Oberdorf J, Webster JM, Zhu CC, Luo SG, Wojcikiewicz RJ. Down-regulation of types I, II and III inositol 1,4,5-trisphosphate receptors is mediated by the ubiquitin/proteasome pathway. The Biochemical journal. 1999;339(Pt 2):453–461. [PMC free article] [PubMed] [Google Scholar]
- 28.Mendes CC, et al. The type III inositol 1,4,5-trisphosphate receptor preferentially transmits apoptotic Ca2+ signals into mitochondria. J Biol Chem. 2005;280:40892–40900. doi: 10.1074/jbc.M506623200. [DOI] [PubMed] [Google Scholar]
- 29.Qi F, et al. Continuous exposure to chrysotile asbestos can cause transformation of human mesothelial cells via HMGB1 and TNF-alpha signaling. Am J Pathol. 2013;183:1654–1666. doi: 10.1016/j.ajpath.2013.07.029. [DOI] [PMC free article] [PubMed] [Google Scholar]
- 30.Wiesner T, et al. Germline mutations in BAP1 predispose to melanocytic tumors. Nat Genet. 2011;43:1018–1021. doi: 10.1038/ng.910. [DOI] [PMC free article] [PubMed] [Google Scholar]
- 31.Vangipuram M, Ting D, Kim S, Diaz R, Schule B. Skin punch biopsy explant culture for derivation of primary human fibroblasts. J Vis Exp. 2013:e3779. doi: 10.3791/3779. [DOI] [PMC free article] [PubMed] [Google Scholar]
- 32.Bocchetta M, et al. Human mesothelial cells are unusually susceptible to simian virus 40-mediated transformation and asbestos cocarcinogenicity. Proc Natl Acad Sci U S A. 2000;97:10214–10219. doi: 10.1073/pnas.170207097. [DOI] [PMC free article] [PubMed] [Google Scholar]
- 33.Pass HI, et al. Characteristics of nine newly derived mesothelioma cell lines. Ann Thorac Surg. 1995;59:835–844. doi: 10.1016/0003-4975(95)00045-m. [DOI] [PubMed] [Google Scholar]
- 34.Tsuchiya S, et al. Induction of maturation in cultured human monocytic leukemia cells by a phorbol diester. Cancer Res. 1982;42:1530–1536. [PubMed] [Google Scholar]
- 35.Dey A, et al. Loss of the tumor suppressor BAP1 causes myeloid transformation. Science. 2012;337:1541–1546. doi: 10.1126/science.1221711. [DOI] [PMC free article] [PubMed] [Google Scholar]
- 36.Bonora M, et al. Subcellular calcium measurements in mammalian cells using jellyfish photoprotein aequorin-based probes. Nat Protoc. 2013;8:2105–2118. doi: 10.1038/nprot.2013.127. [DOI] [PubMed] [Google Scholar]
- 37.Palmer AE, Tsien RY. Measuring calcium signaling using genetically targetable fluorescent indicators. Nat Protoc. 2006;1:1057–1065. doi: 10.1038/nprot.2006.172. [DOI] [PubMed] [Google Scholar]
- 38.Wieckowski MR, Giorgi C, Lebiedzinska M, Duszynski J, Pinton P. Isolation of mitochondria-associated membranes and mitochondria from animal tissues and cells. Nat Protoc. 2009;4:1582–1590. doi: 10.1038/nprot.2009.151. [DOI] [PubMed] [Google Scholar]
- 39.Slot JW, Geuze HJ. Cryosectioning and immunolabeling. Nat Protoc. 2007;2:2480–2491. doi: 10.1038/nprot.2007.365. [DOI] [PubMed] [Google Scholar]
- 40.Kuchay S, et al. FBXL2- and PTPL1-mediated degradation of p110-free p85beta regulatory subunit controls the PI(3)K signalling cascade. Nat Cell Biol. 2013;15:472–480. doi: 10.1038/ncb2731. [DOI] [PMC free article] [PubMed] [Google Scholar]
- 41.Yang H, et al. Programmed necrosis induced by asbestos in human mesothelial cells causes high-mobility group box 1 protein release and resultant inflammation. Proc Natl Acad Sci U S A. 2010;107:12611–12616. doi: 10.1073/pnas.1006542107. [DOI] [PMC free article] [PubMed] [Google Scholar]
Associated Data
This section collects any data citations, data availability statements, or supplementary materials included in this article.
Supplementary Materials
Supplementary Table 1: Descriptive statistic of fluorescence ratio (◆ FRET FYFP/FCFP; ■ F340/F380; ● F406/F494) based on Ca2+ measurements shown in main Figures and Extended Data Figures.
Supplementary Table 2: Descriptive statistic of [Ca2+] measurements shown in main Figures and Extended Data Figures.