

SUMMARY
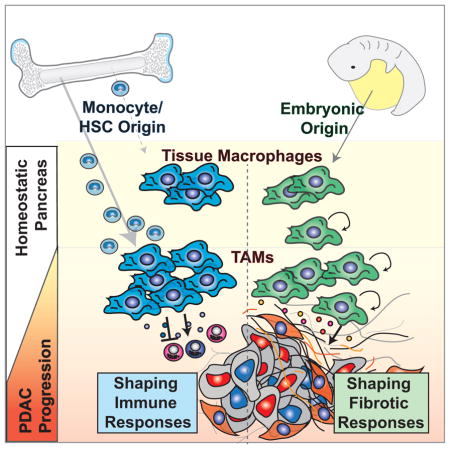
Tumor-associated macrophages (TAMs) are essential components of the cancer microenvironment and play critical roles in the regulation of tumor progression. Optimal therapeutic intervention requires in-depth understanding of the sources that sustain macrophages in malignant tissues. In this study, we investigated the ontogeny of TAMs in murine pancreatic ductal adenocarcinoma (PDAC) models. We identified both inflammatory monocytes and tissue-resident macrophages as sources of TAMs. Unexpectedly, significant portions of pancreas-resident macrophages originated from embryonic development and expanded through in situ proliferation during tumor progression. Whereas monocyte-derived TAMs played more potent roles in antigen presentation, embryonically derived TAMs exhibited a pro-fibrotic transcriptional profile, indicative of their role in producing and remodeling extracellular matrix molecules. Collectively, these findings uncover the heterogeneity of TAM origin and functions, and could provide therapeutic insight for PDAC treatment.
Keywords: Macrophage ontogeny, Tissue resident macrophage, Fibrosis, Pancreatic cancer, Pancreas, Tumor immunity
Graphical Abstract
INTRODUCTION
Pancreatic ductal adenocarcinomas (PDAC) are characterized by the dense fibrotic stroma and extensive infiltration by myeloid cells. Of these myeloid cells, tumor-associated macrophages (TAMs) are one of the most abundant. TAMs are known to promote tumor growth by releasing growth factors, inhibiting immune surveillance, and enhancing angiogenesis, among other mechanisms. Therefore, high numbers of TAMs correlate with poor patient outcome (Ino et al., 2013; Kurahara et al., 2011), making macrophages are considered a highly desirable therapeutic target.
Optimal therapeutic strategies targeting TAMs require an in-depth understanding of their ontogeny and mechanisms governing their homeostasis. Traditional view holds that tissue macrophages are derived from circulating monocytes. However, emerging evidence suggests that various types of tissue-resident macrophages are established during embryonic development, persist into adulthood, and self-maintain independently of the adult hematopoietic system (Ginhoux and Guilliams, 2016; Gomez Perdiguero et al., 2015; Schulz et al., 2012). Under homeostatic conditions, macrophages derived from different developmental origins co-exist in many organs. Two notable exceptions are brain microglia, which are generated during yolk sac hematopoiesis (Ginhoux et al., 2010; Hoeffel et al., 2015), and intestinal macrophages, which rely on continuous replenishment by adult blood monocytes (Bain et al., 2014). Macrophages in many other organs, including the pancreas, have mixed origins (Calderon et al., 2015). A limited number of studies suggest that macrophages derived from different developmental origins have both overlapping and distinct functions within the same tissue (Epelman et al., 2014; Gibbings et al., 2015). However, our understanding of the persistence and function of macrophages derived from different origins under pathologic conditions, like cancer, is still limited.
In this study, we document a previously unappreciated heterogeneity in the ontogeny of TAMs in PDAC. We identify both Ly6Chi monocytes and tissue-resident macrophages of embryonic origin as sources of TAMs. Notably, TAMs derived from different origins demonstrate distinct phenotypes and divergent functionality. While monocyte-derived TAMs are more potent at sampling tumor antigens, embryonically derived TAMs have higher expression of pro-fibrotic factors. These data reveal a potential novel function of embryonically derived macrophages, and suggest a previously unknown interaction between TAMs and the fibrotic stroma of PDAC.
RESULTS
Pancreatic Ductal Adenocarcinoma Tissues are Infiltrated with Macrophages
High amounts of fibrosis and extensive immune cell infiltration characterize the tumor microenvironment of human PDAC. Among the infiltrating cells, macrophages are frequently a dominant component. This can be readily observed by comparing the expression of pan-macrophage markers CD68, CD163, and CD206 in paired human pancreatic tissue samples containing both PDAC lesions and adjacent normal tissue (Figure 1A–B). This increase in macrophage number parallels the amount of tissue fibrosis. While tumor infiltration by macrophages is well characterized, the sources of these cells are not well understood.
Figure 1. Pancreatic Ductal Adenocarcinomas Are Highly Infiltrated with Macrophages.

(A) Representative images of human PDAC and adjacent normal pancreatic tissues assessed for macrophage density (CD68, CD206, or CD163) and fibrosis (Sirius Red). Epithelial cells were stained by pan-Keratin (PanK).
(B) Quantitation of CD68+ cells in human PDAC tissue vs. normal adjacent tissue from the same surgical sample.(n=10 paired samples)
(C) Representative images of pancreas tissue from the p48-CRE/KrasG12D/p53flox/+ (KPC) mouse model assessing macrophage infiltration (F4/80) and collagen density (Sirius Red).
(D) Representative flow cytometry plots showing gating strategy to identify macrophages in autochthonous KPC tumors.
(E) Measurement of listed cell surface markers analyzed by flow cytometry and pre-gated on macrophages as shown in (D).
(F) Quantitation of macrophages by flow cytometry in normal pancreas tissues and advanced KPC PDAC tissues (n=4–8/group).
(G) Kinetics of macrophage numbers assessed by flow cytometry in syngeneic orthotopic KPC-1 tumors. (n=4/group)
Data are shown as mean ± SEM and * denotes p<0.05 by t-test or Mann-Whitney test. Panels D–G are representatives of 2–3 independent experiments.
To explore the ontogeny of TAMs in PDAC, we analyzed p48-Cre+ Lox-Stop-Lox (LSL)-KrasG12Dp53flox/+ (KPC) genetically engineered mouse models (GEMMs), which undergo stepwise progression through stages of pancreatic intraepithelial neoplasia (PanIN) and ultimately develop PDAC (Hingorani et al., 2005). The KPC model faithfully recapitulates many pathological features of human PDAC, including progressive development of fibrosis and extensive accumulation of macrophages (Figure 1C). By flow cytometry, we identified CD45+CD11b+CD3−CD19−Ly6G−Ly6Clo/−F4/80+MHCII+ macrophages in normal pancreas and PDAC tissues of KPC mice and syngeneic orthotopic tumors established from KPC-derived cell lines (KPC-1) (Figures 1D, S1). We confirmed macrophage identity in our gating strategy based on the expression of CD68, MerTK, CD64, colony-stimulating factor-1 receptor (CSF1R), and CX3C chemokine receptor-1 (CX3CR1), but not Siglec-F or Zbtb46 using Zbtb46gfp/+ reporter mice (Figures 1E, S1C–E). Flow cytometry analyses of tissues from the KPC model demonstrated a 24-fold increase in total number and 5-fold increase in density of macrophages in end-point PDAC compared to normal pancreas (Figure 1F). Similarly, macrophage numbers expand in orthotopic PDAC tissues as the tumors progress (Figure 1G). Taken together, the marked increase of macrophages in PDAC mouse models mimics that seen in human pancreatic cancer.
Subsets of Macrophages in PDAC Are Maintained Independently of Blood Monocytes
To test the contribution of blood monocytes to macrophages in tumors, we first performed parabiosis by surgically joining the CD45.2+ KPC mice with congenic wild-type mice that are CD45.1+. Parabiotic pairs were set up at 3.5 months of age when KPC mice have developed extensive PanIN lesions, but lack frank PDAC lesions. We then analyzed chimerism after up to 6 weeks, when KPC mice had progressed to late-stage PDAC. We observed 28% chimerism of Ly6Chi monocytes in the blood of KPC mice within the first 2 weeks, which did not increase further after 6 weeks of parabiosis (Figures 2A–2B). However, in steady-state pancreas, tissue macrophages only achieved 2.5% chimerism after 6 weeks (Figure 2B), suggesting that the majority of macrophages were maintained independently of circulating monocytes during this time period. Interestingly, the chimerism of macrophages in KPC tumors was only 8.8%, compared to 27% for Ly6Chi monocytes in the same tissue. We observed similar chimerism at both 2 and 6 weeks in spite of significant increases in macrophage numbers during this time period (Figures 1F, 2B). These data suggest that while monocytes contribute to the expansion of macrophages during PDAC progression, they might not be the sole source of macrophages.
Figure 2. Substantial Portions of Macrophages in Steady-State Pancreas and PDAC Maintained Independently of Blood Monocytes.

(A) 3.5-month-old homozygous CD45.1 and CD45.2 (KPC or wild-type C57BL/6) mice were surgically joined to create parabiotic pairs. Tissues were analyzed after 2 or 6 weeks of parabiosis. Representative plots (6 weeks) of chimerism in indicated cell types are shown.
(B) Quantitation of chimerism in (A); (n=6–16/group).
(C) MHCIIhi and MHCIIlo composition of CD45.1+CD45.2(−)-derived TAMs in (B); (n=6/group)
(D) C57BL/6J mice were lethally irradiated and adoptively transferred with bone marrow cells from homozygous CD45.1 mice. Analysis of chimerism in several tissues after 6 weeks is depicted.
(E) Quantitation of chimerism in MHCIIHi and MHCIILow macrophage subsets in normal pancreas in (D).
(F) Representative plots of (E).
(G) Autochthonous KPC mice bearing premalignant disease (3.5-month-old) were lethally irradiated and adoptively transferred with bone marrow cells from CD45.1 mice. Tissues were analyzed for chimerism after 6 weeks, when disease had progressed to full PDAC. Relative CD45.1 and CD45.2 percentages analyzed by flow cytometry are depicted.
(H) Quantitation of chimerism in MHCIIHi and MHCIILow TAMs in (G).
(I) Tumor-naïve mice and orthotopic KPC tumor-bearing mice were treated with clodronate-loaded liposomes followed by i.v. injection of FITC-labeled beads. Tissue macrophages were analyzed for FITC signal by flow cytometry after 24 hours.
(J) Representative flow cytometry plots of beads+ TAMs in orthotopic PDAC from (I).
(K) MHCIIHi and MHCIILow composition of beads+ TAMs from (I).
Data are shown as mean ± SEM and * denotes p<0.05 by t-test. Panels D–F and I–K are representatives of 2–3 independent experiments.
Macrophages in tumors exist in subsets with distinct molecular phenotypes. One approach to identity these TAM subsets is based on differential expression of major histocompatibility class (MHC) II (Movahedi et al., 2010). To determine if monocytes replenish these subsets differentially, we analyzed the tumor tissue following parabiosis. We found that the MHCIIhi subset constituted up to 80% of the donor-derived TAMs, suggesting that monocytes preferentially, but not exclusively, replenish MHCIIhi TAMs (Figure 2C).
To complement these parabiosis studies, we established bone marrow chimeras by lethally irradiating wild-type CD45.2+ mice and adoptively transferring bone marrow cells from CD45.1+ wild-type mice. Six weeks after transfer, >99% of the immune cells in the blood and bone marrow of host mice were donor-derived (Figure 2D). Despite potential elimination of radio-sensitive tissue-resident macrophages, 30% of macrophages in the pancreas were host-derived (Figure 2D). In parallel, we lethally irradiated 3.5-month-old KPC mice at the PanIN stage, adoptively transferred bone marrow cells from CD45.1+ wild-type mice, and analyzed chimerism 6 weeks later in fully established PDAC. Similarly, a significant portion (>15%) of TAMs in KPC tumors were host-derived (Figure 2G). These data confirmed the presence of pancreas-resident TAMs that are not rapidly replaced by blood. Consistent with the parabiosis studies, host-derived (CD45.2+) macrophages were preferentially, but not exclusively, MHCIIlo (Figures 2E–F, 2H).
To further assess the short-term contribution of blood monocytes to TAMs, we used fluorescently labeled latex beads to selectively trace Ly6Chi blood monocytes in tumor-bearing mice, and analyzed fluorescent signals in the TAM compartments at 12, 24, 48, and 72 hours after labeling (Figure S2C) (Tacke et al., 2006). While fluorescent beads labeled 25% of blood monocytes within 24 hours, which is the peak time for fluorescence detection in blood (Tacke et al., 2006), bead signal was observed in a negligible amount of macrophages (<0.5%) in normal pancreas (Figure 2I) and 12% of TAMs in orthotopic PDAC tumors (Figure 2I). These data suggest that tumors up-regulate the recruitment of circulating Ly6Chi monocytes to replenish a portion of TAMs. Consistent with BMT and parabiosis results, bead-labeled monocytes almost exclusively replenished the MHCIIhi TAM subset (Figures 2J–K), and this replenishment persisted through 72 hours after bead injection (Figure S2D).
Impairment of Circulating Monocytes Alone Does Not Impact PDAC Progression
To determine the long-term contribution of blood monocytes to macrophages in the pancreas, we evaluated pancreas and PDAC macrophages in CCR2- and Nur77-deficient mice, which have impairments in circulating Ly6Chi and Ly6Clo monocytes, respectively (Boring et al., 1997; Hanna et al., 2011). Despite >95% reduction in the number of circulating Ly6Chi monocytes (Figures 3A and S3A), the frequency of macrophages in steady-state pancreas was not changed in Ccr2−/− mice (Figure S3B) and PDAC-infiltrating macrophages were decreased by only 50% compared to Ccr2+/− mice (Figures 3B and S3C). Consistent with the monocyte labeling experiments, CCR2 deficiency decreased MHCIIhi TAM frequency, while MHCIIlo TAMs were not affected (Figure 3C). Surprisingly, despite the reduced macrophage numbers, CCR2 deficiency did not impact tumor growth in two independent PDAC models (Figures 3D and S3D). Additionally, we observed no changes in tumor burden in KPPC GEMMs treated with CCR2 inhibitors continuously for 45 days (Figure 3K).
Figure 3. Tissue-Resident Macrophages Promote PDAC Progression.

(A–D) KPC cells were orthotopically implanted into CCR2+/− and CCR2−/− mice. Tumors were processed on Day 12 for flow cytometry analysis.
(A) Blood was drawn from orthotopic KPC-2-bearing mice via intracardiac puncture. Monocytes were assessed by flow cytometry (n=3–4/group).
(B) Frequency of macrophages orthotopic KPC-2 tissues of CCR2+/− and CCR2−/− mice.
(C) Frequency of MHCIIHi and Low TAM subsets assessed by flow cytometry in orthotopic KPC-2 tumors. Representative plots of TAM subsets are shown (n=3–4/group).
(D) Wet weights of KPC-2 tumors in (B).
(E–H) KPC-2 cells were orthotopically implanted into Nur77+/− and Nur77−/− mice. Tumors were processed on Day 13 for flow cytometry analysis (n=4/group normal, n=6–8/group of tumor bearing).
(E) Blood was drawn from orthotopic PDAC-bearing mice via intracardiac puncture. Monocytes were quantified.
(F) Quantity of macrophages in normal pancreas and orthotopic PDAC in Nur77+/− and Nur77−/− mice.
(G) Representative plots of MHCIIHi and Low TAM subsets.
(H) Wet weights of KPC-2 tumors in (F).
(I–J) KPC-2-CBRLuc+ cells were orthotopically implanted into IgG/PBS- or αCSF1/clodronate-treated mice. Bioluminescence imaging (BLI) was used to measure tumor progression. Tumors were processed on Day 12 for flow cytometry and tumor burden analyses.
(I) Scheme of pancreas-resident macrophage depletion followed by orthotopic PDAC of KPC-2-CBRLuc+ cells. Blood monocytes and pancreatic macrophage numbers before and after PDAC implantation are shown.
(J) Tumor burden based on BLI and wet weight measurement.
(K) 2.5-month-old KPC or 1.0-month-old KPPC mice were treated with αCSF1/clodronate. Tumor burden was analyzed at 4.5 or 2.0 month of age.
Data are shown as mean ± SEM and * denotes p<0.05 by t-test or Mann-Whitney test. Panels A–D and E–H are representatives of 4 independent experiments each, while I–J is representative of 3.
To address the possibility that Ly6Clo monocytes might contribute to macrophages in PDAC tissues, we analyzed nur77−/− mice. Similar to data from a previous report (Hanna et al., 2011), we observed a 75% decrease in circulating Ly6Clo monocyte numbers in nur77−/− mice compared to nur77+/− littermates (Figures 3E and S3A). However, neither macrophage numbers nor their MHCII-subset distribution was changed in normal pancreas or PDAC tissues (Figures 3F–G). Additionally, Nur77 deficiency did not impact PDAC tumor growth in three PDAC models (Figures 3H and S4E). Together, these data suggest that circulating Ly6Chi monocytes are important for sustaining MHCIIhi macrophages, but dispensable for tumor progression.
Tissue-Resident Macrophages Promote PDAC Progression
To determine whether tissue-resident macrophages regulate tumor growth, we treated tumor-naïve mice with CSF1 neutralizing antibodies in combination with clodronate-liposomes (CLD), followed by a 10-day chase period to allow mice to recover circulating monocyte numbers. Following the 10-day recovery, we found that circulating monocyte numbers in αCSF1-CLD-treated animals were restored to control levels (Figure 3I). By contrast, pancreas-resident macrophages were depleted as early as 12 hours after injection and remained depleted by 85–95% after 10 days of recovery (Figures 3I and S3F). This suggests this regimen allows us to test the loss of tissue-resident macrophages while leaving circulating inflammatory monocytes intact. To study how loss of resident macrophages affects tumor progression, we established orthotopic PDAC tumors 10 days after αCSF1-clodronate or IgG-PBS treatment. Loss of resident macrophages implantation resulted in a 50% reduction in TAMs in established tumors (Figures 3I and S3F), suggesting that loss of resident macrophages was not fully compensated for by monocyte recruitment. In contrast to observations in CCR2-null mice, depletion of pancreas-resident macrophages led to a significant reduction in tumor burden, as measured by both bioluminescence imaging (BLI) and tumor weight in two distinct PDAC models (Figure 3J, S3G). To exclude the possibility that the impaired tumor progression was due to deficient tumor “seeding” upon implantation, we treated two genetic PDAC models (KPC and KPPC mice) with αCSF1-CLD at the premalignant PanIN stage, and analyzed tumor burden after mice had progressed to PDAC. In both KPC and KPPC models, depletion of resident macrophages resulted in significant reduction in tumor burden (Figures 3K). By contrast, continuous treatment of KPPC-mice with CCR2 inhibitors during the same time period, did not impact tumor burden (Figures 3K). Additionally, analysis of tumor pathology in KPPC mice showed that depletion of resident macrophages dramatically reduced the development of high-grade invasive tumors and PDAC cell proliferation (Figures 3L–M). Taken together, these data suggest that pancreas-resident macrophages are more potent drivers of PDAC progression compared to their monocyte-derived counterparts.
Embryonically Derived Macrophages are Expand During Tumor Progression
To determine whether tissue-resident macrophages are derived from the adult hematopoietic system, we performed lineage tracing using Flt3-Cre+ LSL-YFP reporter mice (Flt3-CreYFP). Flt3 is upregulated at the multipotent progenitor stages of hematopoietic stem cell (HSC) differentiation. HSC-derived cells that have gone through the Flt3+ stage are YFP+, whereas macrophages derived from embryonic progenitors outside HSCs are YFP− (Schulz et al., 2012). To validate this model, we analyzed circulating leukocytes and found that >95.5% of cells in the blood, including both Ly6Chi and Ly6Clo monocytes, were YFP+ (Figure 4A). As controls, we analyzed colon macrophages and brain microglia. Consistent with previous reports (Bain et al., 2014; Ginhoux et al., 2010), in adult mice, 93% of the macrophages in the colon were YFP+ and 98.8% of brain microglia were YFP− (Figure 4B). In contrast, we observed heterogeneity of macrophage ontogeny in pancreatic tissues, with 32.4% of tissue macrophages labeled as YFP−. To determine if this heterogeneity is retained in aged mice, we analyzed 15-month-old Flt3-CreYFP mice and found that 30% of pancreas macrophages were still YFP− (Figures S4A–B). These data suggest that embryonically derived pancreas-resident macrophages persist with age.
Figure 4. Embryonically Derived Macrophages are Significant Components of Tissue-Resident TAMs and Expand During PDAC Progression.

(A–C) KPC-1 cells were orthotopically implanted into Flt3-CreYFP mice. Indicated tissues were analyzed by flow cytometry for YFP expression. Representative flow cytometry plots of YFP signal in leukocytes from blood (A), macrophages from colon and brain (B), and macrophages in normal pancreas and end stage PDAC tissues (C) are depicted.
(D) Quantitation of percentage of YFP-negativity in leukocytes from (A–C; n=7–22/group).
(E) Kinetics of YFP-negative macrophages quantity and density in orthotopic KPC-1 tumors.
(F) Representative immunofluorescence images of CD68 and YFP from (C). Inlets identify YFP-positive and YFP-negative macrophages.
(G) Flt3-CreYFP reporter mice were treated with αCSF1R on E13.5. Pancreas was isolated at 6 weeks of age. Density of YFP-negative macrophages was quantified (n=3–5/group).
(H) C57BL/6 mice were treated with αCSF1R or vehicle on E13.5. Orthotopic PDAC was established at 6 weeks of age. TAMs were quantified after 12 days (n=5–6/group).
(I) Tumor burden from (H) was analyzed (n=6–9/group).
Data are shown as mean ± SEM and * denotes p<0.05 by t-test. Panels A–C are pooled data from 3 experiments and G–I representative of two independent experiments.
To determine whether these YFP− macrophages persist during tumor progression, we established orthotopic KPC tumors in Flt3-CreYFP mice. Surprisingly, despite the known contribution from circulating monocytes, 35.4% of the macrophages in these KPC tumors remained YFP−, similar to the frequency in normal pancreas (Figure 4C–D). More strikingly, the number of YFP− macrophages was elevated by >29-fold in tumors compared to normal pancreas (Figure 4E). Immunofluorescence analysis also identified clear subsets of both YFP+ and YFP− macrophages in normal pancreas and PDAC tissues (Figure 4F). These data suggest that a significant portion of TAMs in PDAC tissues are derived independently of the HSCs, and expand rapidly during tumor progression.
The presence of large numbers of YFP− macrophages suggests that many TAMs could be derived during embryonic hematopoiesis. Alternatively, these cells could have originated from adult HSCs without going through extensive Flt3+ stages. To distinguish between these two possibilities, we treated Flt3-CreYFP mice with one dose of a CSF1R antibody (αCSF1R) at 13.5 days post coitum (E13.5) to deplete macrophages derived from embryonic sources (Hoeffel et al., 2015). We found that treatment with αCSF1R on E13.5 resulted in 80% reduction in the density of YFP− macrophages in the pancreas of F1 progeny at 6 weeks of age (Figure 4G). To further confirm the contribution of embryonically derived macrophages to TAMs in PDAC, we orthotopically implanted KPC cells in adult mice following αCSF1R treatment on E13.5. Embryonic αCSF1R treatment resulted in a 40–60% reduction in the number of macrophages in established tumors (Figure 4H). Additionally, the loss of embryonically derived macrophages led to delayed tumor progression in two distinct syngeneic PDAC models (Figure 4I). Taken together these data suggest that embryonically derived macrophages facilitate PDAC progression.
To further assess the specific contribution of embryonic hematopoietic progenitors to PDAC TAMs, we administered one dose of tamoxifen in Csf1r-mer-iCre-mer/LSL-tdTomato mice at E8.5, E9.5, E10.5, E11.5, or E13.5 to span yolk sac and fetal liver stages. Using this model, we observed that HSC-derived circulating monocytes were labeled at all time points later than E9.5 (Figures S5A–B). Using E8.5 or E9.5 tamoxifen pulsing, we observed labeling in 4% and 10% of macrophages, respectively, in normal pancreas retained the label as mice reached 6 weeks of age (Figures 5A–B). To confirm this, we used Cx3cr1-CreERT2/LSL-eYFP reporter mice and found after tamoxifen administration on E13.5 at fetal liver stage, the majority of Ly6Chi monocytes were not labeled (Yona et al., 2013), but significant portion of pancreas tissue macrophages were labeled (Figures S5C). To assess if the embryonically labeled macrophages would expand during tumor progression, we established orthotopic Kras-INK (KI)-derived PDAC tumors in Csf1r-mer-iCre-mer LSL-tdTomato mice. Consistent with results in Flt3-CreYFP mice, tdTomato+ macrophages labeled with a tamoxifen pulse at E8.5 or E9.5 expanded in number by 6.8- or 13.5-fold, respectively, during PDAC tumor progression (Figures 5C). These data suggest that yolk sac-derived macrophages undergo significant numerical expansion during tumor progression.
Figure 5. Yolk Sac-Derived Macrophages Expand during PDAC Progression.

(A) Representative flow cytometry plot of tdTomato signals in the normal pancreas and orthotopic KI tumors of adult mice upon E8.5 or E9.5 tamoxifen pulse.
(B) Percentage of indicated leukocytes that were labeled upon E8.5 or E9.5 tamoxifen pulse (n=3–7/group).
(C) Absolute numbers of tdTomato+ macrophages in the normal pancreas and orthotopic KI tumors (n=3–4/group).
Data are shown as mean ± SEM and * denotes p<0.05 by t-test. Data represent 3 independent experiments.
In both CSF1R- and CX3CR1-driven lineage-tracing models, we observed higher labeling in the MHCIIlo macrophage subset (Figures S5D–E). Similarly in the Flt3-Cre reporter mice, significantly larger portions of YFP− macrophages constitute the MHCIIlo subset in both normal pancreas and PDAC tissues (Figures S4C–D) suggesting that embryonically derived TAMs are preferentially but not exclusively enriched in the MHCIIlo subset. Interestingly, we found that in both HSC-derived and embryonically derived TAMs, the MHCIIlo subset experiences higher levels of hypoxia, but TAM hypoxia level was independent of origin (Figure S4E–F). These data suggest that macrophage origin might drive intrinsic differences in macrophage phenotype that can be further molded by the tumor microenvironment.
Embryonically Derived Macrophages Expand through in situ Proliferation
To determine if tissue-resident macrophages expand through local proliferation, we analyzed Ki67 expression and short-term 5-Bromo-2′-deoxyuridine (BrdU) incorporation. Analyses of normal pancreas demonstrated that <1% of macrophages incorporated BrdU following a 3-hour pulse and <3% were Ki67+ (Figure 6A–D). These data suggest that pancreas-resident macrophages in steady state are mostly quiescent. By contrast, >15% of TAMs in either autochthonous KPC tissues or orthotopic KPC-1 tumors were Ki67+, and 3.5–4% were labeled with BrdU within 3 hours (Figures 6A–D). Of note, the 3-hour pulse resulted in no detectable BrdU signal in circulating monocytes (Figure S6A), suggesting that BrdU signals in pancreatic macrophages reflect in situ proliferation. Immunofluorescence staining also identified a significant portion of Ki67+F4/80+ cells in autochthonous KPC PDAC tissues (Figure 6C), but not in normal pancreas. Interestingly, the majority of these Ki67+F4/80+ cells localized to fibrotic tumor areas (Figures 6C and S6C). Consistent with this, macrophages cultured on high-density collagen I gels had higher proliferation rates (Figure S6D), suggesting that there may be cross talks between tumor fibrosis and macrophage proliferation. Microarray analysis of TAMs from autochthonous KPC tumors demonstrated distinct changes in cell cycle regulatory genes when compared to macrophages from normal pancreas (Figure 6E). To assess if embryonically derived TAMs proliferate at higher rates than HSC-derived TAMs, we stained for Ki67 in tumor-bearing Flt3-CreYFP mice. Embryonically derived TAMs had a significantly higher frequency of Ki67 positivity than their HSC-derived counterparts (Figure 6F). This increased level of Ki67 in embryonic TAMs was independent of their MHCII status (Figure S6B). In addition, transcriptional profiling by Q-PCR also identified significantly reduced level of genes that negatively regulate cell cycle progression, such as Mafb and c-Maf, but higher levels of cell cycle promoting genes, such as Jun and Ets2, in the YFP− TAM subset (Figure 6G). These data suggest that embryonically derived macrophages in PDAC tissues up-regulate proliferative programs, perhaps in response to fibrosis, to keep pace with tumor progression.
Figure 6. Embryonically Derived Macrophages in PDAC Expand through in situ Proliferation.

(A) Analysis of autochthonous KPC PDAC and normal pancreas tissues for BrdU+ macrophages. Animals were injected with BrdU 3 hours prior to sacrifice. Representative plots are shown.
(B) Quantitation of BrdU incorporation in (A).
(C) Representative immunofluorescence images of Ki67 and F4/80 staining in autochthonous KPC tumors.
(D) Quantitation of flow cytometry data for Ki67 and BrdU positivity in macrophages in normal pancreas and orthotopic KPC-1 tumors (n=4–5/group and representative of two independent repeats).
(E) Heat map of cell cycle genes assessed by array on RNA in macrophages isolated from normal pancreas and autochthonous KPC-1 tissues (n=6/group).
(F) Orthotopic KPC-1 tumors were established in Flt3-CreYFP mice. Proliferation of TAM subsets was analyzed by flow cytometry for Ki67.
(G) TAM subsets were sorted from orthotopic KPC-1 tumors in Flt3-CreYFP mice. Q-PCR analyses were performed to quantify transcripts of proliferation regulation genes.
(H) Orthotopic KPC-1-bearing Flt3-CreYFP mice were treated with three doses of αCSF1 or αCSF2 on Days 7, 11, and 14. TAM subsets were quantified on Day 15.
Data are shown as mean ± SEM and * denotes p<0.05 by t-test.
We next tested what signals sustain the survival of these TAM subsets in PDAC tissues. We treated orthotopic PDAC-bearing Flt3-CreYFP mice with neutralizing antibodies against CSF1 and CSF2, both of which have been implicated in macrophage survival in mouse models of cancer (Hoeffel et al., 2015; Zhu et al., 2014). Although CSF2 signal blockade did not change the number of TAMs, inhibition of CSF1 signaling led to a 48% reduction in the YFP+ and a 75% reduction in the YFP− macrophages (Figure 6H). These data suggest that CSF1 is important for the survival of both TAM subsets, but embryonically derived macrophages are more sensitive.
Embryonically Derived TAMs Have a Distinct Pro-fibrotic Phenotype
We next asked whether distinct macrophage origins correlated with phenotypic differences. Towards that end, we first performed flow cytometry analyses to compare the expression of a panel of cell surface markers in TAM subsets using the Flt3-CreYFP mice. Both subsets expressed similar levels of macrophage identity markers, including CD64, CD115, and F4/80, whereas YFP− TAMs expressed lower levels of CD11b (Figures 7A and S7A). YFP− TAMs also expressed significantly lower levels of MHCI and MHCII (Figure 7A). Similar differences were also seen between the two macrophage subsets in normal pancreas (Figure S7B), which suggests possibly inherent differences in antigen presentation. By contrast, co-stimulatory molecules (CD80, CD86), T cell-activating molecules (CD40), and immune checkpoint molecules (PDL1, PDL2, PD1) were expressed at comparable levels (Figure 7A). Embryonically derived TAMs also expressed significantly higher levels of CX3CR1 and lower levels of CD11a and CD49d (Figures 7A and S7C). Interestingly, despite the lack of CXCR4 expression in either macrophage subset in the normal pancreas, CXCR4 was significantly upregulated in YFP− TAMs (Figure 7A and S7B). Taken together, these data suggest that TAMs derived from different origins are phenotypically distinct.
Figure 7. Embryonically Derived TAMs Have Distinct Phenotypes and Functions that are Recapitulated by Subsets of TAMs in Human PDAC.

(A) Flow cytometry analysis of orthotopic KPC-1 PDAC tissues in Flt3-CreYFP mice stained with indicated antibodies and gated on TAMs (gray, isotype control; blue, YFP-negative TAMs; red YFP-positive TAMs).
(B) YFP+ and YFP- macrophages were sorted from normal pancreas or late-stage orthotopic KPC-1 tumors of Flt3-CreYFP mice. RNA was extracted for microarray analyses. Hierarchical clustering of genes that were differentially expressed between macrophage subsets either in normal pancreas or PDAC is shown.
(C) Gene ontogeny analyses of molecules expressed at higher levels in YFP- TAMs.
(D–E) Q-PCR analyses of gene expression for molecules involved in ECM modification (D) or immune modulation (E). Analysis was performed on RNA from sorted YFP+ and (−) TAMs from Flt3-CreYFP mice bearing KCP-1 tumors (n=5/group). Genes were selected from the top candidates in (B).
(F) Analysis of collagen production ex vivo by YFP+ and (−) TAMs sorted from orthotopic KPC-1 PDAC tissues in Flt3-CreYFP mice. Collagen laydown was assessed after 36 hours by immunofluorescence intensity. Experiments are representative of three independent repeats.
(G) Orthotopic tumors were established in Flt3-CreYFP reporter mice using KPC-1-mCherry+ tumor cells. TAMs were analyzed for mCherry positivity. Representative flow plots and mean fluorescence intensity (MFI) are depicted (n=4/group).
(H) Analysis of antigen presentation to CD8+ T cells by YFP+ and (−) TAMs sorted from Flt3-CreYFP mice bearing KPC-1 tumors. Antigen presentation was assessed by the ability of TAMs to activate OT1 cells after SIINFEKL loading and measured by CFSE-dilution and/or CD44+/CD69+/CD62L− expression on T cells. Three independent sorting experiments are depicted as paired analyses.
(I) Flow cytometry analysis of human PDAC tissues from surgical resections is depicted. The percentage of CXCR4+ TAMs of total is shown for nine patients.
(J) Analysis of HLA-DR expression in CXCR4-positive and negative TAMs using data from (I). A representative flow plot and MFI analysis in paired samples are depicted.
(K) Q-PCR analysis of mRNA from CXCR4-positive and negative TAMs sorted from human PDAC tissues. Pro-fibrotic genes assessed were identified in (B), and analysis of paired isolates from three patients is depicted. All graphs depict mean values +/− SEM and * denotes p<0.05 by t-test, Mann-Whitney test, or Wilcoxon matched pairs rank test as appropriate for the data set.
To gain further insight into potential functional differences between embryonically derived and HSC-derived macrophages, we performed transcriptional profiling on macrophages sorted from Flt3-CreYFP mice (Figures 7B and S7D). Only a modest number of genes were expressed differentially between the YFP+ and YFP− macrophages in steady-state pancreas. However, 660 genes were differentially expressed (>1.5 fold, p<0.05) between the two subsets in orthotopic KPC tumors. Using gene set enrichment analysis, we found that the genes enriched in embryonic-derived macrophages showed a strong trend toward poor survival when mapped to human PDAC data sets (Figure S7E). Analysis of gene ontology demonstrated that embryonically derived macrophages had a higher expression of molecules involved in extracellular matrix (ECM) deposition and remodeling (Figure 7C). Indeed, molecules on top of the list of genes that were expressed at higher levels in embryonically derived TAMs were mostly involved in ECM organization (Table S1). This included genes encoding for ECM molecules (collagen isoforms, nidogen, tenascin C, and elastin), ECM-producing enzymes (hyaluronan synthases 2 and 3), and ECM-remodeling molecules (lysyl oxidase), which we validated using Q-PCR (Figures 7D and S7F). Correlating with their differential expression profiles, embryonically derived TAMs could produce significantly more Collagen I and IV in ex vivo assays (Figure 7F). To correlate these ex vivo results to in vivo impact, we analyzed collagen density in PDAC tissue from mice treated on E13.5 with αCSF1R or control IgGs and compared these results to CCR2-deficient mice. We found embryonic macrophage depletion reduced collagen deposition. By contrast, CCR2-deficient mice had slightly elevated collagen levels (Figure S7G). These data suggest that macrophages of different origins have differential impacts on fibrosis.
To rule out the possibility that the identified YFP− cells contained fibroblasts, we compared cancer-associated fibroblasts (CAFs) to YFP− TAMs. We found that CAFs expressed platelet-derived growth factor receptor-β (PDGFRβ), but not CD45, F4/80, or CD11b (Figure S7H). Similarly, the mRNA expression levels of macrophage/myeloid identity genes (Emr1, Itgam, Csf1r, Csf2r, and Cx3cr1) were comparable in both YFP+ and YFP− TAMs but 10- to 1000-fold higher in TAMs than CAFs (Figure S7I). These data confirm that the YFP− cells were not fibroblasts but were macrophages with a pro-fibrotic phenotype. To evaluate how the pro-fibrotic gene signature in embryonically derived TAMs might differ from that in CAFs, we compared selected genes by Q-PCR. As expected, CAFs were the dominant producers of several isoforms of collagens, Elastin, and Sparc while YFP− TAMs expressed more Col4a4, Col10a1, Col17a1, Col18a1, and Has3 (Figure S7J). Taken together, these data suggest that embryonically derived TAMs may be involved in “fine-tuning” fibrotic responses in PDAC tumors.
In contrast to pro-fibrotic genes, the levels of mRNA involved in class I and class II antigen presentation (Erap1, Psme1, and Ciita) were higher in HSC-derived TAMs (Figure 7E). To test the phagocytosis capacity in TAM subsets in vivo, we orthotopically implanted mCherry+ KPC-1 cells and determined mCherry positivity in TAMs. Although both TAM subsets demonstrated potent capacity to uptake tumor antigen, the amount of antigen uptake was >2-fold higher in HSC-derived TAMs (Figure 7G). We next tested the ability of each TAM subset to present antigen (ovalbumin) to OT1+ CD8+ T cells and found that HSC-derived (YFP+) TAMs were far more potent at antigen presentation (Figure 7H). In addition, YFP+ TAMs expressed significantly higher levels of Il12a, Il4, Ccl17, and Ifnβ (Figure 7E). Taken together, these data suggest that TAMs derived from HSCs may play more potent roles in regulating adaptive immunity. This is consistent with previous reports showing that monocyte-derived TAMs regulate immunosuppression in PDAC models (Beatty et al., 2015; Sanford et al., 2013).
Subsets of TAMs in Human PDAC Tissue Resemble Murine Embryonically Derived TAMs
To evaluate if the characterization of embryonically derived TAMs in murine PDAC models is relevant for human cancer, we took advantage of the observation that CXCR4 was almost exclusively upregulated in embryonically derived TAMs (Figure 7A), and evaluated human PDAC tissues for CXCR4+ TAMs. We found that 10–40% of TAMs expressed high levels of CXCR4 (Figure 7I), and that these CXCR4+ TAMs expressed lower levels of HLA-DR in eight out of nine patient tissues (Figure 7J). These results were consistent with our observation that embryonically derived TAMs express lower levels of MHCII. To determine if this subset of human TAMs shared similar pro-fibrotic gene expression profile identified in mice, we isolated mRNA from CXCR4+ and negative TAMs from human PDAC tissues. Consistent with murine data, we found that CXCR4+ TAMs expressed significantly higher levels of collagens and ECM-remodeling genes (Figure 7K). Collectively, these data suggest that CXCR4+ TAMs in human PDAC resemble murine embryonically derived TAMs and may have the ability to fine-tune PDAC fibrosis.
DISCUSSION
Ontogeny of tissue macrophages varies in different tissues under steady state. With the exception of brain and intestine, many other organs contain macrophages of different origins coexisting within the tissue context. Consistent with previous reports (Calderon et al., 2015), our study demonstrated that pancreas-associated macrophages are derived from both adult HSCs and embryonic sources. Regardless of developmental origin, significant portions of macrophages in the pancreas are resident in the tissue and not rapidly replenished by monocytes. The majority of pancreas-resident macrophages are quiescent under steady state, suggesting that these cells may self-maintain through longevity. It is also important to note that ontogeny of tissue-resident macrophages is not static. Embryonically derived macrophages in multiple organs have various degrees of replacement by monocytes with different kinetics (Bain et al., 2016; Ginhoux and Guilliams, 2016; Molawi et al., 2014). Our study using aged mice demonstrated that embryonically derived macrophages could persist long-term in the pancreas, but it remains to be seen to what extent could these macrophages persist in aged humans.
Fates of tissue-resident macrophages vary under different pathological conditions. For example, liver resident Kupffer cells undergo necroptosis during Listeria monocytogenes infection, which recruits monocytes to replenish macrophages (Bleriot et al., 2015). On the other hand, tissue macrophages undergo in situ proliferation during helminth infections (Jenkins et al., 2011). Very few studies looked at the fate of tissue-resident macrophages during cancer progression. One report documented a loss of resident macrophages concomitant with an increase in monocyte-derived TAMs in a breast cancer model (Franklin et al., 2014). On the other hand, microglia remain present in brain tumor models (Bowman et al., 2016; Hambardzumyan et al., 2016). Here, we demonstrated that in PDAC, tissue-resident macrophages not only persisted, but undergo significant expansion during PDAC progression. TAMs in PDAC tissues adopted a transcriptional program to enhance proliferation, and embryonically derived macrophages further enhanced their proliferative programs compared to HSC-derived counterparts. Factors that sustain and promote in situ proliferation in different TAM subsets, as well as the cellular sources of these factors, have yet to be identified. It also remains to be seen to what extent would these observations hold true in other cancers. Answers to these questions could provide insights into how we can therapeutically target TAM subset-specific pathways in order to restrain the progression of different types of tumors.
A highly debated question is whether macrophage origin dictates functionality. This question remains largely unsolved. A limited number of transcriptional studies suggest that macrophages of different ontogeny demonstrate mostly overlapping transcriptional profiles within the same tissue, at least in non-disease settings (Gibbings et al., 2015; Gundra et al., 2014; van de Laar et al., 2016). Upon engraftment, circulating monocytes could also replenish the resident macrophage pool and adopt a transcriptional profile similar to their embryonically derived counterparts (Scott et al., 2016). These studies suggest that tissue environment, as opposed to ontogeny, is the main driver of macrophage functions. However, our data demonstrated that although gene expression profiles of embryonically- and HSC-derived macrophages are fairly similar in the normal pancreas, their transcriptional profiles and ex vivo functions are very distinct in PDAC tissues. As a harbinger of this dynamic, CXCR4 is largely not expressed in macrophages of either origin in the normal pancreas, but specifically upregulated in PDAC TAMs of embryonic origin. These data suggest that origin may poise macrophages to differentially respond to inflammatory insults with distinct bioactivities. Future experiments are needed to determine which lineage commitment factors poise macrophages for differing functional responses during tumor progression.
Our study suggested potentially unique fibrosis-modulating functions in embryonically derived TAMs. Fibrosis is a hallmark of PDAC, as well as pancreas injury responses such as pancreatitis. Macrophages are well known for their ability to promote fibrosis in various physiological and pathological conditions (Wynn and Vannella, 2016), by activating fibroblasts to secrete and remodel ECM. Here, our data suggest that subsets of macrophages may fine-tune fibrosis by directly depositing and/or remodeling the ECM. Corresponding with this idea, a recent report demonstrated that TAMs directly construct ECM in colon cancer (Afik et al., 2016). Interestingly, such activities were carried out by monocyte-derived TAMs in their model.
Strikingly, macrophages of different origins had different impacts on tumor progression in our PDAC models. Loss of monocyte-derived macrophages had limited effects on tumor progression, whereas depletion of tissue-resident macrophages significantly reduced tumor progression. These observations form a nice comparison to several other tumor models, where depletion of monocyte-derived macrophages inhibits tumor growth and metastasis (Afik et al., 2016; Franklin et al., 2014; Qian et al., 2011). Although we cannot rule out the importance of monocyte-derived TAMs in the regulation of tumor immunity, our data suggest that tissue-resident macrophages are important for progression.
In summary, our study demonstrated that PDAC contains macrophages with heterogeneous origins. In addition to monocytes, tissue-resident macrophages derived from embryonic progenitors are also a major source of TAMs. Embryonically derived macrophages expand in PDAC tissues through in situ proliferation and exhibit a pro-fibrotic transcriptional profile. We provide a new paradigm of macrophage heterogeneity under the tumor setting, which may facilitate future investigations that ultimately improve therapeutics to target the “fibro-inflammatory” microenvironment of PDAC.
CONTACT FOR REAGENT AND RESOURCE SHARING
Further information and requests for reagents may be directed to, and fulfilled by the corresponding author David G. DeNardo (ddenardo@wustl.edu).
EXPERIMENTAL MODEL AND SUBJECT DETAILS
Murine PDAC Models
KPC mice (p48-CRE/LSL-KrasG12D/p53flox/+) used in these studies have been previously described (Hingorani et al., 2005) and were backcrossed to C57BL/6 background and screened for C57BL/6 identity using congenic markers. KPC-1 cell line was derived from PDAC tissues of 2.2-month-old p48-CRE+/LSL-KrasG12D/p53flox/flox (KPPC); the KPC-2 cell line was derived from tumors of 6-month-old p48-CRE+/LSL-KrasG12D/p53flox/+ (KPC) mice. Cells were grown on collagen-coated tissue culture flasks for <12 passages, and were tested for cytokeratin-19, smooth muscle actin, vimentin, and CD45 to verify their carcinoma identity and purity. To establish orthotopic KPC models, either 50,000 or 200,000 KPC-1 or KPC-2 cells in 50 μL of Cultrex (Trevigen) were injected into the pancreas of 6–12-week-old C57BL/6 mice according to published protocol (Kim et al., 2009). For mCherry uptake analyses or bioluminescence imaging (BLI), KPC-1 or KPC-2 cells were infected with mCherry or click beetle red (CBR)-GFP vector respectively. mCherryhi or GFPhi cells were selected by FACS prior to orthotopic tumor establishment.
Other Mouse Models
The following mouse strains were purchased from Jackson Laboratories: CCR2−/−, Nur77−/−, Rosa26- LSL-eYFP, and Cx3cr1-CreERT2 (all on the C57BL/6 background). Csf1r-Mer-iCre-Mer mice were purchased from Jackson Laboratories, and were crossed to Rosa26-LSL-tdTomato mice, which were a kind gift from Dr. Gregory D. Longmore; both strains are on the FVB background. Flt3-Cretg mice were a kind gift from Dr. Thomas Boehm and were crossed to Rosa26-LSL-eYFP or –tdTomato mice, all under the C57BL/6 background. Mice were maintained in the Laboratory for Animal Care barrier facility at Washington University School of Medicine. Washington University School of Medicine Institutional Animal Studies Committee approved all animal studies.
Human PDAC Tissues
Human PDAC tissues were obtained from surgically resected specimens from patients diagnosed in the Department of Pathology at Washington University (St. Louis, MO). Patients underwent pancreaticoduodenectomy followed by adjuvant chemotherapy. Patients did not receive neoadjuvant therapy. For histological analyses (Figure 1), tissues were embedded in paraffin blocks and processed into 6 μm-thick sections for immunofluorescence staining. For gene expression profiling in PDAC patients (Figure 7), tissues were freshly obtained from 9 patients at pancreaticoduodenectomy, and processed immediately for flow cytometry analysis and/or fluorescence-activated cell sorting. Four out of the nine patients have received neoadjuvant therapies, including FOLFIRINOX or ABRAXANE/gemcitabine prior to being scheduled for resection. All patients were off therapy for 21 days prior to surgery. All tissues were collected under informed consent from patients. Washington University Ethics committee approved the study under IRB protocol #201108117.
METHOD DETAILS
Parabiosis
Parabiotic pairs were generated according to established protocols (Peng et al., 2013) from age- (3.5-month-old) and weight-matched female CD45.2+ (KPC or wild-type C57BL/6) and CD45.1+ (C57BL/6) mice. Mice were injected with Buprenex® subcutaneously after surgery. Sulfatrim was continuously added in drinking water for 10 days post-surgery to minimize infections at surgical wounds. Mice were separated and perfused with phosphate buffered saline (PBS) containing 0.2% heparin. Single cell suspensions from tissues were stained with antibodies for flow cytometry analyses 2 or 6 weeks after the establishment of parabiosis.
Bone Marrow Transplantation
Three and a half-month-old C57BL/6 mice or KPC mice were exposed to γ-irradiation dosed at 1100 rads. Animals were subsequently injected with 2.5 × 10⁶ bone marrow cells from CD45.1+ C57BL/6 mice through n). Leukocyte chimerism was analyzed 6 weeks later.
Macrophage Depletion
To deplete tissue resident macrophages, 8–16-week old C57BL/6 mice were treated with 3 doses of CSF1 neutralizing antibody (clone 5A1, BioXCell) (1 mg, 0.5 mg, 0.5 mg on Days −18, −14, and −11, Figure 3) and 3 doses of clodronate-containing liposome (200 uL/each on Days −17, −13, and −10). Control mice were treated with same doses/volume of IgG (clone HRPN, BioXCell) and liposome (or phosphate buffered saline as indicated). On Day 0, Mice were implanted orthotopically with 200,000 CBR+ KPC-2 cells or 50,000 CBR+ KPC-1 cells, and subjected to BLI on Days 3 and 7.
Similarly, KPC and KPPC mice were treated with 2 doses of αCSF1 (0.5 mg each, Day 1 and Day 5) and 2 doses of clodronate-loaded liposome (100 uL each, Day 3 and Day 7) starting at 2.5-month and 1-month of age, respectively. Tumor burden was analyzed when mice reached 4.5 months for KPC mice or 2.0 months for KPPC mice.
To deplete embryonically derived macrophages, C57BL/6 or Flt3-CreYFP mice were intraperitoneally injected with 3.0 mgs of CSF1R depleting antibody (AFS98 clone, BioXCell) on 13.5 dpc. Surviving mice were implanted with 50,000 CBR+ KPC-1 at 6 weeks of age. Mice were sacrificed 12 days after tumor establishment for flow cytometry and tumor burden analyses.
Lineage Tracing of Embryonically Derived Macrophages
Timed breeding was set up by crossing Csf1r-Mer-iCre-Mer mice with Rosa26-LSL-tdTomato mice (both on the FVB background). Embryonic timeline was assessed based on vaginal plug observation: 12pm on the day of plug formation was estimated to be 0.5 day post coitum (dpc). Pregnant mice were treated with tamoxifen (Sigma-Aldrich) (75 μg/g) combined with progesterone (Sigma-Aldrich) (37.5 μg/g) at one of the following time points: 8.5, 9.5, 10.5, or 13.5 dpc. To test the contribution of embryonically derived CSF1R+ cells to monocytes or macrophages at homeostatic conditions, tumor-free F1 mice were sacrificed for fate mapping analyses as they reached 6 weeks of age. To test the contribution of embryonically derived CSF1R+ cells to TAMs in PDAC tumors, 50,000 syngeneic Kras-INK cells were orthotopically implanted into F1 mice as they reached 6 weeks. Kras-INK cells were derived from p48-Cre/Lox-Stop-Lox (LSL)-KrasG12D/Ink4a-Arflox/lox mice on the FVB background as previously described. Mice were sacrificed approximately 12 days after tumor implantation for the analyses of tdTomato signal in different leukocyte populations.
To trace CX3CR1+ cells, Cx3cr1-CreERT2 mice were crossed with Rosa26-LSL-eFYP mice (both on the C57BL/6 background). Pregnant mice were treated with tamoxifen (75 μg/g) and progesterone (37.5 μg/g) on 13.5 dpc. F1 neonates were fostered by lactating female mice and then aged to 6 weeks for fate mapping analyses.
Labeling of Blood Ly6Chi Monocytes
To selectively label Ly6Chi monocytes, 250 uL of liposomes containing clodronate were injected intraveneously (i.v.), followed by i.v. injection of 250 uL of FITC-conjugated plain microspheres 16–18 hours later (1.0 um, 2.5% solids [wt/vol]; Polysciences, diluted 1:4 in PBS). Tissues were processed for flow cytometry analyses at indicated time points after bead injection.
Mouse Tissue Isolation and Flow Cytometry
Mice were euthanized by intracardiac perfusion using 20 mL of PBS-heparin under isoflurane anesthesia. Tumor tissues and colon were manually minced and digested in 25 mL of Dulbecco’s Modified Eagle Medium (DMEM) (Thermo Fisher) containing 2 mg/mL of collagenase A (Roche) and 1X DNase I (Sigma) for 30 minutes at 37°C with constant stirring. Normal pancreas was digested in the same buffer for 15 minutes at 37°C. Digestion was quenched in 5 mL of fetal bovine serum (FBS) (Atlanta Biologicals) and filtered through 40 μm Nylon mesh, pelleted through centrifugation (2000 rpm for 5 min at 4°C), and resuspended in staining buffer (PBS containing 1% BSA). Brain and spleen were minced and triturated through 40 μm filters.
Single cell suspensions were blocked with rat anti-mouse CD16/CD32 antibodies (eBioscience) (1/200) for 10 minutes, pelleted by centrifugation, and subsequently labeled with 100 uL of fluorophore-conjugated anti-mouse antibodies at recommended dilutions for 20 minutes on ice, and washed with staining buffer. For proliferation assays, mice were injected with 5-bromo-2′-deoxyuridine (BrdU, 1 mg) i.p. 3 hours prior to sacrifice. BD Bioscience Cytofix/cytoperm kit was used to stain for BrdU. eBioscience transcription factor staining buffer set was used to stain for Ki67. Data were acquired on LSR-II (BD Biosciences), and analyzed using FlowJo software (Tree Star). To quantify proliferating/cycling cells in Flt3-CreYFP mice, tumors were digested as described above, stained with fluorophore-conjugated antibodies for 20 minutes, fixed in 4% formaldehyde for 10 minutes on ice, permeabilized in ice-cold 70% ethanol for 3 hours, stained with Ki67 antibody diluted in staining buffer for 20 minutes on ice, pelleted and resuspended in staining buffer, and immediately processed for data acquisition on LSR-II. To assess hypoxia, Flt3-CreYFP mice were intraperitoneally injected with pimonidazole hydroxychloride (60 mg/kg) 1 hour prior to sacrifice (Hypoxyprobe). Single cell suspensions were stained with antibodies against pimonidazole adducts for 20 minutes at 4°C without fixation or permeabilization prior to data acquisition.
To quantitate blood monocytes, 200 uL of blood was obtained by intracardiac puncture prior to perfusion, incubated in red blood cell lysis buffer (BioLegend) for 15 minutes on ice, and stained with fluorophore-conjugated antibodies for 20 minutes on ice. Stained cells were counted using LSR-II. For blood analysis that does not require numeration, blood was drawn via tail vein bleeding, followed by RBC lysis, antibody staining, and data acquisition.
Fluorescence-Activated Cell Sorting (FACS)
Normal or tumor-bearing mice (Flt3-CreYFP, KPC, or C57BL/6 control) were perfused with 20 mL of heparin-containing PBS. Tissues were digested in 25 mL of DMEM containing 2 mg/mL of collagenase A (Roche) and 1X DNase I (Sigma) for 30 minutes at 37°C with constant stirring. CD45+ cells were enriched from single cell suspensions through MACS® magnetic selection using anti-mouse CD45 microbeads (Miltenyi). Elutes were blocked with rat anti-mouse CD16/CD32 antibodies (eBioscience) (1/200) for 10 minutes, pelleted by centrifugation, and labeled with fluorophore-conjugated anti-mouse antibodies at recommended dilutions for 20 minutes on ice. Cells were filtered through 40 μm Nylon mesh, and immediately sorted using Aria-II (BD Biosciences). For microarray analyses and gene expression analyses, cells were sorted directly into RNA lysis buffer (Omega Biotek); RNA was isolated using the EZNA kit (Omega Biotek) according to instructions by the manufacturer. For ex vivo assays, cells were sorted into DMEM containing 20% FBS before being pelleted and resuspended for subsequent treatments.
Ex vivo Antigen Presentation and Collagen Deposition Assays
For ex-vivo analysis of TAM subsets, macrophages were sorted from Flt3-CreYFP mice as described above. To evaluate their potential for antigen presentation, sorted cells were added to 96 well round bottom plates at 40,000 cells per well and allowed to adhere for 2 hours in the presence of 10 ug/ml CSF1 (Peprotech). Cells were then washed with media and incubated with SIINFEKL peptide (Thermo, 2.5 ug/ml). During this time CD8+ OT1s were isolated from the spleen of tumor free mice using CD8+ magnetic bead selection (Miltenyi) and these T cells were labeled with Carboxyfluorescein succinimidyl ester (CFSE) according to instructions from the manufacturer (Invitrogen). Macrophages were then washed twice with media and 40,000 CD8+ OT1’s were added. Co-culture was done in Roswell Park Memorial Institute medium (RPMI)-1640 (Gibco) supplemented 5% FBS, 1x beta mercaptoethanol (BME) and 5 ug/ml CSF1. Cells were analyzed for proliferating T cells after 36 hours by flow cytometry analysis of CD8a, CD44, CD62L and CSFE-dilution.
For ex vivo analysis of collagen production, TAMs were isolated and cultured with 10ug/ml CSF1 on glass chamber slides (Falcon). 20,000 TAMs were used per well. After 24 hours cells were fixed in PFA and analyzed for Collagen I or IV by standard immunofluorescent staining, as described above. Importantly cells were not permeabilized with detergent. Collagen content was accessed by fluorescent intensity per 20x field divided by cell number (DAPI+ nuclei).
Sirius Red Staining and Immunofluorescence Staining
Tissues were isolated from perfused mice, fixed in 10% formalin overnight, incubated in graded ethanol, embedded in paraffin, and cut into 6 μm-thick sections. To analyze tumor fibrosis, tissue sections were deparaffinized in xylene, rehydrated in graded ethanol, and processed for Picro-Sirius Red staining according to instructions by the manufacturer (Sigma Aldrich). To visualize macrophages in mouse KPC and human PDAC tissues, paraffin sections were steam heated for antigen retrieval in citrate-based buffer (Biogenex), treated with 1% hydrogen peroxide (Invitrogen) for 20 minutes to quench endogenous peroxidase, incubated with blocking buffer (PBS containing 5% goat serum and 2.5% BSA) for 1 hour at room temperature (RT), blocked for biotin/avidin according to instructions by the manufacturer (Vector Labs), and stained with primary antibodies at recommended dilutions at 4°C overnight. Opal 4-color IHC kit was then used according to instructions by the manufacturer (PerkinElmer). When two antibodies were used for co-staining, FITC and Cy5 were used to minimize emission spectral overlap. To visualize YFP-positive macrophages in Flt3-CreYFP mice, orthotopic PDAC tissues were fixed in 4% formaldehyde at 4°C overnight, incubated in PBS containing 30% sucrose and 0.1% sodium azide overnight at 4°C, and embedded in OCT compound on dry ice. Frozen sections (6 μm-thick) were air-dried, treated with blocking buffer at RT for 1 hour, and stained with CD68 (1/200) (Abcam) overnight, followed by 1 hour incubation with goat anti-rabbit-Alexa594 (1/400) (Molecular Probes) at RT. All sections were washed in PBS containing 0.05% Tween-20 between incubation steps, and mounted in DAPI-containing media (Vector Labs) for imaging on Nikon 80i microscope.
PDAC Patient Outcome Analysis
We used top 110 genes whose expression was >10-fold higher in the mouse Flt3-CreYFP-negative TAM subset than the Flt3-CreYFP-positive subset. Mouse gene entrez IDs were mapped to human ortholog based on ENSEMBLE 87 annotation using Bioconductor package “biomaRt”. Genes were queried in the cbioportal TCGA pancreatic RNA-seq data through the R package “cdgsr” on 178 primary PDAC tumors. For association analysis with survival outcomes, we considered the gene signature using the averaged gene expression across all mapped genes (after centering each by their median). The gene signature was dichotomized by associated median to divide patients into the two groups of over- and under-expression. The Kaplan-Meier method was used to estimate empirical survival probabilities and log rank test to compare survival difference between patient groups. Hazard ratio from Cox proportional hazard model was reported with 95% confidence interval.
Human PDAC TAM Profiling
For gene expression profiling in PDAC patients, tissues were freshly obtained from 9 patients at pancreaticoduodenectomy, digested into single cell suspension using the protocol described above, stained with indicated antibodies, and processed for cell isolation using Aria-II (BD Biosciences). Cells were directly sorted into RNA lysis buffer (Omega Biotek). RNA was isolated using the EZNA kit (Omega Biotek) according to instructions by the manufacturer. cDNA was synthesized using the qScript Supermix (Quanta). cDNA targets were pre-amplified for 12 cycles, followed by QPCR analyses (Taqman®, Thermo Fisher).
Quantitation and Statistical Analysis
Statistical analysis was performed using Unpaired Student’s t-test, Mann-Whitney U test, Wilcoxon matched-pairs signed rank test, or ANOVA analysis as appropriate for the data set. Data in bar graphs are displayed as means ± SEM. Statistical significance is displayed as * p<0.05.
DATA AND SOFTWARE AVAILABILITY
All software packages used are publically available thru commercial vendors.
Supplementary Material
Acknowledgments
The Authors acknowledge support from an AACR/PANCAN Award, NCI awards R01-CA177670, R01-CA203890, P50-CA196510, T32CA009621, UL1TR000448, P30-CA91842 and the BJCIH/Siteman Cancer Center Cancer Frontier Fund. Microarray analyses were performed by Genome Technology Access Center at Washington University, funded partially by NCI Award P30-CA91842 NCRR UL1RR024992. The authors also acknowledge Grant Gould and Hans Challen for help on irradiation experiments, Liping Yang for help on parabiosis, and Daniel C. Link, Jason C. Mills, Boris Calderon, and Jesse W. Williams for advice.
Footnotes
AUTHOR CONTRIBUTIONS
Y.Z., and D.G.D. conceived the study, designed experiments and wrote the manuscript with input from all authors. Y.Z., J.M.H., D.K.S., K.W.K., J.L., B.L.K., C.Z., A.R.B., and D.G.D. performed experiments and analyzed data. G.J.R., D.R.C., K.J.L., R.C.F., W.G.H., and W.M.Y. provided key experience, resources and tissues.
Publisher's Disclaimer: This is a PDF file of an unedited manuscript that has been accepted for publication. As a service to our customers we are providing this early version of the manuscript. The manuscript will undergo copyediting, typesetting, and review of the resulting proof before it is published in its final citable form. Please note that during the production process errors may be discovered which could affect the content, and all legal disclaimers that apply to the journal pertain.
References
- Afik R, Zigmond E, Vugman M, Klepfish M, Shimshoni E, Pasmanik-Chor M, Shenoy A, Bassat E, Halpern Z, Geiger T, et al. Tumor macrophages are pivotal constructors of tumor collagenous matrix. J Exp Med. 2016;213:2315–2331. doi: 10.1084/jem.20151193. [DOI] [PMC free article] [PubMed] [Google Scholar]
- Bain CC, Bravo-Blas A, Scott CL, Gomez Perdiguero E, Geissmann F, Henri S, Malissen B, Osborne LC, Artis D, Mowat AM. Constant replenishment from circulating monocytes maintains the macrophage pool in the intestine of adult mice. Nat Immunol. 2014;15:929–937. doi: 10.1038/ni.2967. [DOI] [PMC free article] [PubMed] [Google Scholar]
- Bain CC, Hawley CA, Garner H, Scott CL, Schridde A, Steers NJ, Mack M, Joshi A, Guilliams M, Mowat AM, et al. Long-lived self-renewing bone marrow-derived macrophages displace embryo-derived cells to inhabit adult serous cavities. Nat Commun. 2016;7:ncomms11852. doi: 10.1038/ncomms11852. [DOI] [PMC free article] [PubMed] [Google Scholar]
- Beatty GL, Winograd R, Evans RA, Long KB, Luque SL, Lee JW, Clendenin C, Gladney WL, Knoblock DM, Guirnalda PD, et al. Exclusion of T Cells From Pancreatic Carcinomas in Mice Is Regulated by Ly6C(low) F4/80(+) Extratumoral Macrophages. Gastroenterology. 2015;149:201–210. doi: 10.1053/j.gastro.2015.04.010. [DOI] [PMC free article] [PubMed] [Google Scholar]
- Bleriot C, Dupuis T, Jouvion G, Eberl G, Disson O, Lecuit M. Liver-resident macrophage necroptosis orchestrates type 1 microbicidal inflammation and type-2-mediated tissue repair during bacterial infection. Immunity. 2015;42:145–158. doi: 10.1016/j.immuni.2014.12.020. [DOI] [PubMed] [Google Scholar]
- Boring L, Gosling J, Chensue SW, Kunkel SL, Farese RV, Jr, Broxmeyer HE, Charo IF. Impaired monocyte migration and reduced type 1 (Th1) cytokine responses in C-C chemokine receptor 2 knockout mice. J Clin Invest. 1997;100:2552–2561. doi: 10.1172/JCI119798. [DOI] [PMC free article] [PubMed] [Google Scholar]
- Bowman RL, Klemm F, Akkari L, Pyonteck SM, Sevenich L, Quail DF, Dhara S, Simpson K, Gardner EE, Iacobuzio-Donahue CA, et al. Macrophage Ontogeny Underlies Differences in Tumor-Specific Education in Brain Malignancies. Cell Rep. 2016;17:2445–2459. doi: 10.1016/j.celrep.2016.10.052. [DOI] [PMC free article] [PubMed] [Google Scholar]
- Calderon B, Carrero JA, Ferris ST, Sojka DK, Moore L, Epelman S, Murphy KM, Yokoyama WM, Randolph GJ, Unanue ER. The pancreas anatomy conditions the origin and properties of resident macrophages. J Exp Med. 2015;212:1497–1512. doi: 10.1084/jem.20150496. [DOI] [PMC free article] [PubMed] [Google Scholar]
- Epelman S, Lavine KJ, Beaudin AE, Sojka DK, Carrero JA, Calderon B, Brija T, Gautier EL, Ivanov S, Satpathy AT, et al. Embryonic and adult-derived resident cardiac macrophages are maintained through distinct mechanisms at steady state and during inflammation. Immunity. 2014;40:91–104. doi: 10.1016/j.immuni.2013.11.019. [DOI] [PMC free article] [PubMed] [Google Scholar]
- Franklin RA, Liao W, Sarkar A, Kim MV, Bivona MR, Liu K, Pamer EG, Li MO. The cellular and molecular origin of tumor-associated macrophages. Science. 2014;344:921–925. doi: 10.1126/science.1252510. [DOI] [PMC free article] [PubMed] [Google Scholar]
- Gibbings SL, Goyal R, Desch AN, Leach SM, Prabagar M, Atif SM, Bratton DL, Janssen W, Jakubzick CV. Transcriptome analysis highlights the conserved difference between embryonic and postnatal-derived alveolar macrophages. Blood. 2015;126:1357–1366. doi: 10.1182/blood-2015-01-624809. [DOI] [PMC free article] [PubMed] [Google Scholar]
- Ginhoux F, Greter M, Leboeuf M, Nandi S, See P, Gokhan S, Mehler MF, Conway SJ, Ng LG, Stanley ER, et al. Fate mapping analysis reveals that adult microglia derive from primitive macrophages. Science. 2010;330:841–845. doi: 10.1126/science.1194637. [DOI] [PMC free article] [PubMed] [Google Scholar]
- Ginhoux F, Guilliams M. Tissue-Resident Macrophage Ontogeny and Homeostasis. Immunity. 2016;44:439–449. doi: 10.1016/j.immuni.2016.02.024. [DOI] [PubMed] [Google Scholar]
- Gomez Perdiguero E, Klapproth K, Schulz C, Busch K, Azzoni E, Crozet L, Garner H, Trouillet C, de Bruijn MF, Geissmann F, et al. Tissue-resident macrophages originate from yolk-sac-derived erythro-myeloid progenitors. Nature. 2015;518:547–551. doi: 10.1038/nature13989. [DOI] [PMC free article] [PubMed] [Google Scholar]
- Gundra UM, Girgis NM, Ruckerl D, Jenkins S, Ward LN, Kurtz ZD, Wiens KE, Tang MS, Basu-Roy U, Mansukhani A, et al. Alternatively activated macrophages derived from monocytes and tissue macrophages are phenotypically and functionally distinct. Blood. 2014;123:e110–122. doi: 10.1182/blood-2013-08-520619. [DOI] [PMC free article] [PubMed] [Google Scholar]
- Hambardzumyan D, Gutmann DH, Kettenmann H. The role of microglia and macrophages in glioma maintenance and progression. Nature neuroscience. 2016;19:20–27. doi: 10.1038/nn.4185. [DOI] [PMC free article] [PubMed] [Google Scholar]
- Hanna RN, Carlin LM, Hubbeling HG, Nackiewicz D, Green AM, Punt JA, Geissmann F, Hedrick CC. The transcription factor NR4A1 (Nur77) controls bone marrow differentiation and the survival of Ly6C- monocytes. Nat Immunol. 2011;12:778–785. doi: 10.1038/ni.2063. [DOI] [PMC free article] [PubMed] [Google Scholar]
- Hingorani SR, Wang L, Multani AS, Combs C, Deramaudt TB, Hruban RH, Rustgi AK, Chang S, Tuveson DA. Trp53R172H and KrasG12D cooperate to promote chromosomal instability and widely metastatic pancreatic ductal adenocarcinoma in mice. Cancer Cell. 2005;7:469–483. doi: 10.1016/j.ccr.2005.04.023. [DOI] [PubMed] [Google Scholar]
- Hoeffel G, Chen J, Lavin Y, Low D, Almeida FF, See P, Beaudin AE, Lum J, Low I, Forsberg EC, et al. C-Myb(+) erythro-myeloid progenitor-derived fetal monocytes give rise to adult tissue-resident macrophages. Immunity. 2015;42:665–678. doi: 10.1016/j.immuni.2015.03.011. [DOI] [PMC free article] [PubMed] [Google Scholar]
- Ino Y, Yamazaki-Itoh R, Shimada K, Iwasaki M, Kosuge T, Kanai Y, Hiraoka N. Immune cell infiltration as an indicator of the immune microenvironment of pancreatic cancer. Br J Cancer. 2013;108:914–923. doi: 10.1038/bjc.2013.32. [DOI] [PMC free article] [PubMed] [Google Scholar]
- Jenkins SJ, Ruckerl D, Cook PC, Jones LH, Finkelman FD, van Rooijen N, MacDonald AS, Allen JE. Local macrophage proliferation, rather than recruitment from the blood, is a signature of TH2 inflammation. Science. 2011;332:1284–1288. doi: 10.1126/science.1204351. [DOI] [PMC free article] [PubMed] [Google Scholar]
- Kurahara H, Shinchi H, Mataki Y, Maemura K, Noma H, Kubo F, Sakoda M, Ueno S, Natsugoe S, Takao S. Significance of M2-polarized tumor-associated macrophage in pancreatic cancer. The Journal of surgical research. 2011;167:e211–219. doi: 10.1016/j.jss.2009.05.026. [DOI] [PubMed] [Google Scholar]
- Molawi K, Wolf Y, Kandalla PK, Favret J, Hagemeyer N, Frenzel K, Pinto AR, Klapproth K, Henri S, Malissen B, et al. Progressive replacement of embryo-derived cardiac macrophages with age. J Exp Med. 2014;211:2151–2158. doi: 10.1084/jem.20140639. [DOI] [PMC free article] [PubMed] [Google Scholar]
- Movahedi K, Laoui D, Gysemans C, Baeten M, Stange G, Van den Bossche J, Mack M, Pipeleers D, In’t Veld P, De Baetselier P, et al. Different tumor microenvironments contain functionally distinct subsets of macrophages derived from Ly6C(high) monocytes. Cancer research. 2010;70:5728–5739. doi: 10.1158/0008-5472.CAN-09-4672. [DOI] [PubMed] [Google Scholar]
- Qian BZ, Li J, Zhang H, Kitamura T, Zhang J, Campion LR, Kaiser EA, Snyder LA, Pollard JW. CCL2 recruits inflammatory monocytes to facilitate breast-tumour metastasis. Nature. 2011;475:222–225. doi: 10.1038/nature10138. [DOI] [PMC free article] [PubMed] [Google Scholar]
- Sanford DE, Belt BA, Panni RZ, Mayer AB, Deshpande AD, Carpenter D, Mitchem JB, Plambeck-Suess S, Worley LA, Goetz BD, et al. Inflammatory Monocyte Mobilization Decreases Patient Survival in Pancreatic Cancer: a Role for Targeting the CCL2/CCR2 Axis. Clin Cancer Res. 2013 doi: 10.1158/1078-0432.CCR-13-0525. [DOI] [PMC free article] [PubMed] [Google Scholar]
- Schulz C, Gomez Perdiguero E, Chorro L, Szabo-Rogers H, Cagnard N, Kierdorf K, Prinz M, Wu B, Jacobsen SE, Pollard JW, et al. A lineage of myeloid cells independent of Myb and hematopoietic stem cells. Science. 2012;336:86–90. doi: 10.1126/science.1219179. [DOI] [PubMed] [Google Scholar]
- Scott CL, Zheng F, De Baetselier P, Martens L, Saeys Y, De Prijck S, Lippens S, Abels C, Schoonooghe S, Raes G, et al. Bone marrow-derived monocytes give rise to self-renewing and fully differentiated Kupffer cells. Nat Commun. 2016;7:10321. doi: 10.1038/ncomms10321. [DOI] [PMC free article] [PubMed] [Google Scholar]
- Tacke F, Ginhoux F, Jakubzick C, van Rooijen N, Merad M, Randolph GJ. Immature monocytes acquire antigens from other cells in the bone marrow and present them to T cells after maturing in the periphery. J Exp Med. 2006;203:583–597. doi: 10.1084/jem.20052119. [DOI] [PMC free article] [PubMed] [Google Scholar]
- van de Laar L, Saelens W, De Prijck S, Martens L, Scott CL, Van Isterdael G, Hoffmann E, Beyaert R, Saeys Y, Lambrecht BN, et al. Yolk Sac Macrophages, Fetal Liver, and Adult Monocytes Can Colonize an Empty Niche and Develop into Functional Tissue-Resident Macrophages. Immunity. 2016;44:755–768. doi: 10.1016/j.immuni.2016.02.017. [DOI] [PubMed] [Google Scholar]
- Wynn TA, Vannella KM. Macrophages in Tissue Repair, Regeneration, and Fibrosis. Immunity. 2016;44:450–462. doi: 10.1016/j.immuni.2016.02.015. [DOI] [PMC free article] [PubMed] [Google Scholar]
- Yona S, Kim KW, Wolf Y, Mildner A, Varol D, Breker M, Strauss-Ayali D, Viukov S, Guilliams M, Misharin A, et al. Fate mapping reveals origins and dynamics of monocytes and tissue macrophages under homeostasis. Immunity. 2013;38:79–91. doi: 10.1016/j.immuni.2012.12.001. [DOI] [PMC free article] [PubMed] [Google Scholar]
- Zhu Y, Knolhoff BL, Meyer MA, Nywening TM, West BL, Luo J, Wang-Gillam A, Goedegebuure SP, Linehan DC, DeNardo DG. CSF1/CSF1R Blockade Reprograms Tumor-Infiltrating Macrophages and Improves Response to T Cell Checkpoint Immunotherapy in Pancreatic Cancer Models. Cancer Res. 2014 doi: 10.1158/0008-5472.CAN-13-3723. [DOI] [PMC free article] [PubMed] [Google Scholar]
Associated Data
This section collects any data citations, data availability statements, or supplementary materials included in this article.