

Abstract
Understanding structure–activity relationships (SARs) of small molecules is important for developing probes and novel therapeutic agents in chemical biology and drug discovery. Increasingly multiplexed small-molecule profiling assays allow simultaneous measurement of many biological response parameters for the same compound, e.g. expression levels for many genes or binding constants against many proteins. While such methods promise to capture SARs with high granularity, few computational methods are available to support SAR analyses of high-dimensional compound activity profiles. Many of these methods are not generally applicable or reduce the activity space to scalar summary statistics before establishing SARs. In this article, we present a versatile computational method that automatically extracts interpretable SAR rules from high-dimensional profiling data. The rules connect chemical structural features of compounds to patterns in their biological activity profiles. We applied our method to data from novel cell-based gene-expression and imaging assays collected on more than 30,000 small molecules. Based on the rules identified for this dataset, we prioritized groups of compounds for further study, including a novel set of putative histone deacetylase inhibitors.
Keywords: structure-activity relationships, small-molecule profiling, high-content screening, frequent itemset mining, association rule mining
Introduction
Small-molecule profiling, i.e., the characterization of compounds by multiple biological activity measurements, has been shown to capture detailed information about biological effects and mechanisms of action of small molecules.1 This level of granularity holds great promise for a comprehensive understanding of compound SARs,2,3 which in turn allows optimizing compounds simultaneously against multiple biological endpoints.4 To overcome limitations of existing approaches, we developed a computational method to automatically mine small-molecule profiling data for SAR rules.
Profiles can be obtained in parallel by combining separately acquired assay results such as binding constants against different purified proteins,4 drug sensitivity of different cell lines, 5,6 or high-throughput screening results from different assays7. By contrast, multiplexed profiling assays capture complex cell states by simultaneously measuring many features in a single well format as a “signature”, e.g. gene expression, protein levels and modifications, or cell morphology descriptors. 1,4
Growing public bioactivity databases8,9 and novel high-throughput experimental methods10,11 enable researchers to apply both types of profiling data in early stages of drug- and probe-discovery projects when the number of compounds to consider is still very large.1,4 This application, in turn, requires robust and scalable computational analysis methods to help interpret the large numbers of complex activity profiles. In addition to the inherently multi-dimensional space of chemical structures, the number of possible profiles grows exponentially with each biological measurement dimension.
Most available SAR analysis methods, however, were designed to handle between one and five bioactivity annotations and are not easily extensible.12–14 One strategy is therefore to reduce high-dimensional bioactivity data to summary statistics, such as the number of shared targets between two compounds, before connecting this information to chemical structure.15
Here, we present a computational approach for directly deriving interpretable SAR rules from large amounts of biological profiling data. We used frequent pattern mining (FPM; also called frequent itemset mining) and association rule mining (ARM) to find combinations of substructures that are associated with characteristic biological profiles.16
FPM was originally developed for market-basket analysis to find combinations of products that are frequently bought together. ARM builds on these “frequent patterns” (or “frequent itemsets”) to find interesting associations between products. These associations are formulated as rules. For example, the rule {paper, envelopes} → {stamps} indicates that customers who buy paper and envelopes are likely to also purchase stamps. We applied ARM to small-molecule profiling data to identify SAR rules of the form {chemical attributes} → {biological effect patterns}. Importantly, rules can be prioritized by measuring the strength of the association between features and their “interestingness”.
FPM has been used to find frequent substructures in sets of compounds and to identify single contiguous fragments that distinguish active and inactive compounds in a bioactivity assay.17,18 Fragment combinations that separate compounds with distinct binding profiles have been identified using formal concept analysis, a framework that is conceptually related to FPM.19 This method captures the precise relations between individual sets of compounds and fragments, rendering this approach more useful for in-depth analysis of smaller data sets with few activity annotations. The requirement that fragment combinations perfectly separate compound sets is usually too stringent for exploratory SAR studies.
We present here a general approach to analyzing SARs for large numbers of high-dimensional biological profiles using FPM and, in addition, ARM to automatically formulate SAR rules. Rules that connect chemical features to patterns in biological profiles are automatically identified and ranked by interestingness. We evaluated our method on gene-expression and cell-morphology profiles for more than 30,000 compounds. The compound collection contains subsets representative of common screening libraries assembled from various sources as well as planned synthetic libraries of compounds with well-defined structural relationships. We used different chemical and biological descriptors to tailor the general approach to specific requirements of the compound library.
Materials and Methods
Compound sets
We assembled three distinct compound sets with varying structural properties and levels of biological activity annotation. We first selected a collection of 19,637 structurally diverse compounds derived from diversity-oriented synthesis (DOS).20 The library was synthesized by the Center for the Science of Therapeutics at the Broad Institute using a build/couple/pair strategy.21 The compounds were built around 23 novel chiral core structures by systematically varying the configuration of core stereocenters and decorating them with various side-chains (see Supplementary Information). Whenever possible, complete sets of stereoisomers were included in our set. No biological activity information was used in the selection of the DOS set. Second, we used PubChem (http://pubchem.ncbi.nlm.nih.gov/) assay data to select 10,162 compounds from the Molecular Libraries Small Molecule Repository (MLSMR) that cover many different chemical structures and biological activities. Third, 2,222 known drugs and probes were added as bioactivity landmarks. Again, these compounds were selected to be structurally diverse and cover a wide range of biological activities. The complete compound set is available as Supplementary Material at http://jbx.sagepub.com/.
Gene-expression profiles (GE)
We followed the protocol of Peck et al. (see Supplementary Methods for a detailed protocol).10 Briefly, 3,500 U-2 OS cells (ATCC, cat. no. HTB-96) were seeded per well in 384-well plates. After 24h of incubation at 37°C, compounds were added and the cells incubated for another 6h of treatment. Cell lysates were prepared and transferred to oligo-dT capture plates to immobilize mRNAs. cDNA was then generated via reverse transcription and amplified via polymerase chain reaction (PCR). The cDNA was first annealed with a mix of specific probe pairs designed for each of 978 transcripts. All upstream probes contain a universal 20-nucleotide (nt) primer site (complementary to T7 primer), a specific 24-nt barcode sequence, and a transcript-specific sequence of 24nt complementary to the 3′-end of the transcript. Downstream probes consist of a 5′-phosphorylated 20-nt sequence that is complementary to the sequence contiguous to the binding site of the upstream probe on each transcript, as well as a 20-nt universal primer (T3) site. After annealing and removal of free probes, adjacent probes bound to transcript cDNAs were joined by ligation and amplified by PCR using T3 and 5′-biotinylated T7 primers. The resulting amplicons were hybridized with color-coded Luminex microspheres each of which carries capture probes complementary to one of the barcode sequences in the amplicons. After incubation with streptavidin-phycoerythrin, the captured amplicons were quantified by flow cytometry measuring phycoerythrin fluorescence. At the same time, transcript identity was identified by bead color. Compound effects were measured in triplicate treated wells.
Multiplexed cytological morphology profiles (MC)
We followed the protocol of Gustafsdottir et al. (see Supplementary Methods for a detailed protocol).11 Briefly, 1,500–2,000 U-2 OS cells (ATCC, cat. no. HTB-96) were seeded per well in 384-well clear-bottom imaging plates. After 24h of incubation at 37°C, compounds were added and cells incubated for another 48h of treatment. Six fluorescent dyes were added to stain different cell compartments: nucleus (Hoechst 33342), endoplasmic reticulum (concanavalin A/AlexaFluor488 conjugate), nucleoli (SYTO 14 green fluorescent nucleic acid stain), Golgi apparatus and plasma membrane (wheat germ agglutinin/AlexaFluor594 conjugate, WGA), F-actin (phalloidin/AlexaFluor594 conjugate) and mitochondria (MitoTracker Deep Red). WGA and Mitotracker stains were performed on live cells. Afterwards, cells were fixed with 16% paraformaldehyde and the remaining dyes added. Images in 5 fluorescent channels were captured for 9 sites per well at 20× magnification. Images were measured in quadruplicate and CellProfiler software was used to calculate morphological features for each cell.11
Chemical descriptors
DOS-FP
We used synthetic history information to define DOS compound core structures. Based on these cores, appendages were determined by R-group decomposition. Information about the attachment position of each appendage to the core was recorded. In addition, the absolute configuration of all stereocenters in the core was determined. This determination was performed on core structures without appendages to keep absolute stereochemistry consistent irrespective of substituent priority changes with different appendages. Concatenating core, appendage, and stereochemistry features into a feature string generated the DOS-FP for each compound.
ECFP
Extended connectivity fingerprints22 with atom types were calculated using a bond distance of 4 (ECFP4). Structural fragments that correspond to each bit were combined into a feature string for each compound. Only features with a bond diameter of 2 and higher were considered to exclude non-informative single atom fragments. All calculations were performed in SciTegic Pipeline Pilot 8.5.
Biological descriptors
Cluster attributes
We hierarchically clustered the data based on biological profiles (GE or MC) using a complete linkage method on pairwise correlation distances. All nodes in the cluster dendrogram were indexed. Each compound was assigned a set of indices based on cluster membership.
Signatures
GE signatures were obtained from GE profiles by applying a threshold of 2 (−2) to z-scores relative to DMSO to obtain up-regulated (down-regulated) genes. Genes were then combined into a feature string, indicating the direction of regulation.
Frequent pattern mining and association rules
Frequent itemsets were determined using a publicly available implementation (http://mahout.apache.org/) of the Parallel FPgrowth algorithm23 on a Hadoop platform (version 1.0.4; http://hadoop.apache.org/). Association rules were generated from the list of frequent patterns in R (version using the arules package.24
SAR score
We calculated confidence, purity, and p-values (Fisher’s exact test) for each rule and combined them into a single SAR score. P-values were transformed into negative decadic logarithms. The distributions of all three quality measures were first normalized using a Box-Cox transformation25 to avoid one criterion dominating the others and the resulting values for each quality measure were scaled to a range [0,1]. Purity values were multiplied with a weighting factor of 0.2. The sum of the normalized quality measures yielded the SAR score for each compound. SAR scores were scaled to range [0,1] by division with the theoretical maximum score of 2.2.
Replicate-based hit selection
To determine which compounds led to stable profile changes compared to negative controls (DMSO), we used replicate correlation and connectivity, i.e., the similarity of replicates compared to all other wells on the same set of replicate assay plates. Replicate correlation was calculated as the Pearson correlation coefficient between their GE (or MC) profiles. Replicate connectivity was calculated for each pair of replicates (e.g., R1 and R2) by ranking all wells on the same set of replicate plates by their profile similarity against R1 and identifying the fraction of unrelated wells that rank higher than R2. The reverse calculation (R2 vs. R1) was also performed because connectivity values are not symmetric. To allow individual replicates to fail, we only considered the top 50% of replicate correlation and connectivity values for each compound. We then calculated the two-dimensional distribution of negative-control replicate correlation and connectivity. Compounds were considered hits if they exceeded the 97% confidence interval of this negative-control distribution.
Results
Background
We applied FPM and ARM to small-molecule gene-expression and cell-morphology profiles to derive SAR rules of the form {chemical fragments} → {biological effect pattern}, indicating that compounds containing specific molecular fragments (or chemical substructures) often lead to the same pattern in biological responses (e.g. similar expression changes for a common set of genes). Even though our method can be applied to more abstract chemical attributes (e.g. calculated properties), using fragments makes it easy to interpret the final rules. Rules that connect fragments to biological effects can directly inform synthetic chemistry decisions, especially if these fragments match existing molecular building blocks.
We derived biological attributes from two profiling assays, gene expression (GE) and cell morphology (multiplexed cytological, MC). For GE profiles, the expression levels of 978 protein-coding transcripts were determined by ligation-mediated amplification and Luminex bead-based detection.10 For MC profiles, changes in 812 cell morphology features were captured by automated microscopy and computational image analysis. We used a “cell-painting” assay with 6 fluorescent dyes in five channels to distinguish cellular compartments and organelles.11
In the following, we follow the notation of Tan, Steinbach, and Kumar16 to introduce FPM and ARM. FPM and ARM operate on collections of binary attribute vectors (“objects”). Let be a set of binary attributes and a set of objects where each object is characterized by a subset of all attributes I, i.e., . The support count σ of a set of attributes X is defined as the number of objects that have all attributes in X:
Given a minimum support count threshold s, FPM finds all sets of attributes (“itemsets” or “patterns”) that occur at least s times (“frequent patterns”).
For the purpose of SAR rule mining, objects ti represent compounds tested in a profiling experiment. I then is a set of chemical and biological attributes. Each compound ti is represented by a specific subset of chemical and biological attributes – the substructures it contains and the biological response parameters it affects (Figure 1). A screening library usually contains only a few compounds with both similar structure and similar biological activity. We therefore used a support count threshold of , identifying all patterns that occur at least three times.
Figure 1. ARM identifies and scores rules that relate chemical features of compounds to biological profile attributes.
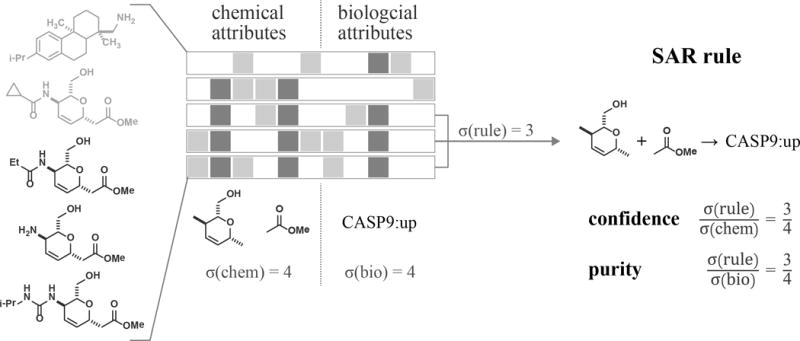
In this schematic example, three out of five compounds match a rule that relates the occurrence of two structural features to the up-regulation of a gene (CASP9). Confidence and purity measure the overlap between compounds that match the structural rule and compounds that elicit the biological phenotype. This information is used to quantify the quality of a rule.
From these patterns, ARM derives rules of the form , indicating that the occurrence of attribute set X (left-hand side, LHS) is associated with the occurrence of attribute set Y (right-hand side, RHS). We limited chemical attributes to the LHS and biological attributes to the RHS to obtain SAR rules of the form {chemical fragments} → {biological pattern}. To reduce redundancy, we only consider rules that consist of closed patterns, i.e., sets of attributes for which no superset exists that has the same support count.
Three measures of rule quality or “interestingness” are then used to filter and prioritize rules. First, the confidence of a rule is defined as the fraction of objects with LHS attributes X for which the rule is true. In other words, the confidence quantifies how likely it is to observe the biological pattern Y when the chemical attributes X are given:
Second, we defined the purity of a rule as the reverse measure, i.e., the fraction of RHS attributes Y for which the rule is true, which gives a measure of how characteristic a biological pattern is for a certain chemotype:
Third, we calculated a p-value for each rule using Fisher’s exact test.26 Low p-values indicate that chemical attributes X and biological pattern Y are unlikely to be independent of each other.
We only kept rules with p-values smaller than 0.01. To rank the remaining rules by their quality, we combined confidence, purity, and p-value into a single SAR score ranging from 0 to 1 (see Methods). A weighting factor can be applied to each individual quality measure to balance their effect on the score. We lowered the influence of the purity with a weighting factor of 0.2 because we considered a high purity less critical for a good rule. This avoids exaggerated down-rating of cases where multiple different structural classes share a biological activity pattern. However, we considered rare and chemotype-specific bioactivities more interesting than common ones and therefore included purity in the score. The set of rules usually contains groups of related rules. We created a “minimal rule set” by removing all rules that consist of attribute subsets or supersets of a rule with a higher SAR score. Unless stated otherwise, all reported rule ranks refer to this minimal set.
We tested our method on GE and MC profiles for two distinct compound libraries. In the following sections, we discuss examples of rules obtained with different chemical structural and biological attributes.
ARM with custom substructure descriptors on planned synthetic libraries leads to intuitive and testable SAR hypotheses
SAR analyses take advantage of structural similarity between compounds. While analog series in advanced projects are tailored to meet this requirement, many screening libraries do not. Early-stage SAR exploration is hence especially useful for planned screening libraries that were designed to include groups of compounds with defined structural relationships.4
We therefore included 19,637 compounds in our experiment that were derived from diversity-oriented synthesis (DOS).20 The compounds represent systematic combinations of three basic structural elements: core structures, appendages, and stereochemistry. Compounds were built by modular synthesis, attaching different appendages to 23 chiral core structures and systematically varying the configuration of core stereocenters.21 The resulting collection is chemically diverse but, at the same time, contains related structures: groups of compounds that share common cores, stereochemistry, or appendages can be directly compared in SAR analysis. Importantly, this modular design also allows quickly synthesizing structural analogs of identified hits for follow-up studies.
We used as chemical attributes a custom structural fingerprint (“DOS-FP”) that reflects the modular design of DOS compounds to obtain rules that directly relate to compound synthesis. Based on the three DOS diversity elements, DOS-FP specifies for each compound the (a) core structure, (b) appendages attached to the core (as a simple occurrence or as “R-groups” that include information about their attachment position in the core), and (c) configuration of core stereocenters. Stereoisomers of appendages were treated as distinct structures. Note that R-group and stereochemistry features refer to specific positions in the core and can hence only occur in combination with a core feature.
We added a reference set of 2,222 compounds with known bioactivities (BIO) to the DOS library to support the generation of hypotheses about the biological effects of novel DOS compounds. The BIO collection was assembled to contain structurally diverse compounds that cover a wide range of biological activities and often have known direct targets. We measured both GE and MC profiles for most compounds. Exact compound numbers measured with each method differ slightly due to quality-control filters on the experimental data (GE: 17,553 DOS compounds + 1,935 known bioactives; MC: 17,805 DOS compounds + 2,211 known bioactives).
We first aimed to identify SARs on global phenotypic effects. We hierarchically clustered GE and MC profiles to find groups of compounds with similar biological activities. Each node of the resulting dendrogram was considered one cluster. Each compound could therefore be a member of multiple clusters (characterized by superset/subset relationships). Importantly, both DOS and BIO compounds were clustered, but only DOS compounds were subject to ARM for SAR rule mining. While BIO compounds cannot be represented with DOS-FP, this allowed us to evaluate structural rules for DOS compounds in the context of biologically annotated reference molecules.
We found a total of 6,206 rules for GE and 7,098 rules for MC (2,752 and 2,861 for minimal rule sets, respectively). About 70% of the rules for both GE and MC were combinations of core and stereo features and another 17% specified core features alone (Table 1). This distribution is likely to reflect the fact that the DOS library contains many more compounds that match on these two features than on appendages. However, rules that include R-group information are about 5 to 6-fold enriched among the top 10% of rules (Table 1), indicating their importance for describing specific small-molecule effects.
Table 1. GE and MC show comparable distributions of rule types.
Shown are absolute and relative frequencies for rules that involve different combinations of chemical structural features. Combinations that are theoretically impossible to occur are omitted. rgroup: appendages with attachment position to core tracked; app: simple occurrence of appendages irrespective of position
| structural features in rule
|
freq. – all rules
|
freq. – top 10% of rules
|
|||||||||
|---|---|---|---|---|---|---|---|---|---|---|---|
| GE | GE[%] | MC | MC[%] | GE | GE [%] | MC | MC[%] | ||||
| core | stereo | rgroup | app | 0 | 0 | 1 | 0.01 | 0 | 0 | 1 | 0.14 |
| core | rgroup | app | 1 | 0.02 | 0 | 0.00 | 0 | 0 | 0 | 0.00 | |
| core | stereo | app | 22 | 0.35 | 13 | 0.18 | 16 | 2.58 | 6 | 0.85 | |
| core | app | 9 | 0.15 | 12 | 0.17 | 3 | 0.48 | 2 | 0.28 | ||
| app | 472 | 7.61 | 442 | 6.23 | 35 | 5.64 | 48 | 6.76 | |||
| core | stereo | rgroup | 251 | 4.04 | 241 | 3.40 | 150 | 24.15 | 170 | 23.94 | |
| core | rgroup | 140 | 2.26 | 157 | 2.21 | 66 | 10.63 | 90 | 12.68 | ||
| core | stereo | 4252 | 68.51 | 4991 | 70.32 | 288 | 46.38 | 341 | 48.03 | ||
| core | 1059 | 17.06 | 1241 | 17.48 | 63 | 10.14 | 52 | 7.32 | |||
| 6206 | 100 | 7098 | 100 | 621 | 100 | 710 | 100 | ||||
The majority of rules that include R-group information specify analog series, i.e., compounds that vary in one R-group (70% for GE and 80% for MC). Hence, these rules lead to directly testable hypothesis that are easily accessible through DOS. Analogously, 11% (GE) and 14% (MC) of rules with R-group information specify all R-groups and hence apply to series of stereoisomers. The remaining fraction consists of rules that allow two of three R-groups to vary. Overall, chemical feature combinations occur with highly similar frequencies in the rules for both profiling experiments (Table 1). These frequencies did not change appreciably when only profiles with very good replicate agreement were used (see Methods).
We next examined rules for DOS compounds that co-cluster with known bioactive molecules to find rules with interpretable structural and biological parts. The highest-ranking rule identified a cluster that was strongly enriched for compounds carrying an ortho-aminoanilide (OAA) appendage (Figure 2). 50% of all OAA DOS compounds are contained in this cluster (confidence: 0.5) and hence have similar GE profiles. The OAA motif is known as a biasing element for inhibitory activity against class I histone deacetylases (HDACs) due to its ability to interact with zinc and active site resides chains required for hydrolysis of the acetyl moiety on lysine side chains.27 Indeed, the DOS compounds co-cluster with two known HDAC inhibitors that also contain an OAA residue, mocetinostat (MGCD0103) and tacedinaline (CI-994). Furthermore, the only DOS cluster member that does not match the structural rule, BRD4805, has recently been identified as a low micromolar HDAC inhibitor.28
Figure 2. The best-scoring rule for GE profiles identified a known biasing element for HDAC inhibitory activity.
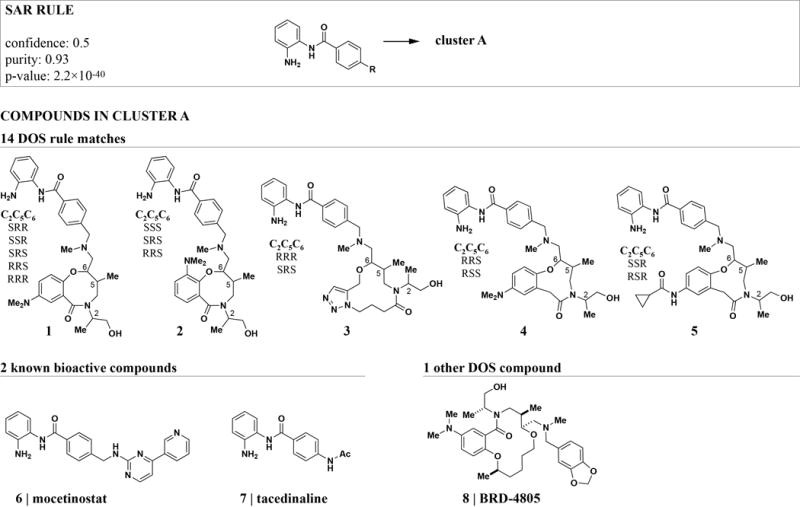
The quality measures for this rule indicate that compounds with an ortho-aminoanilide (OAA) residue are strongly enriched in cluster A. All compounds in cluster A are shown. The cluster contains two known OAA HDAC inhibitors (6 and 7) and all DOS compounds except one carry the OAA residue. The remaining DOS compound BRD4805 has recently been identified as an HDAC inhibitor.28 For simplicity, stereoisomers are shown as combinations of generic structures and configuration tables.
Mocetinostat, tacedinaline, and BRD4805 exhibit selectivity for HDAC1, 2, and 3 over other isoforms.28,29 Interestingly, less selective inhibitors29 contained in our compound library – trichostatin A (TSA), vorinostat (SAHA), and belinostat (PXD-101) – formed a separate cluster, indicating that GE profiling can distinguish compounds with distinct HDAC isoform selectivity patterns. We therefore hypothesize that the clustered OAA DOS compounds show some degree of specificity for HDACs 1–3. Supporting this hypothesis, stereoisomers of structures 1, 2, and 4 have recently been identified as HDAC1-3 selective inhibitors.30 Members of this structural class shared the highest profile similarity with the known HDAC inhibitors in our experiment (Table S1).
Several of the OAA DOS compounds have further been tested in abiochemical assay measuring inhibition of HDAC2 deacetylase activity (Figure S2). 90% (9 of 10) of the OAA DOS compounds that were in the cluster were hits in this screen. By contrast, OAA DOS compounds that were not part of the profile-based cluster achieved a lower hit rate (57%, 4 of 7). Beyond this enrichment of hits in the cluster, we found no apparent correlation between the profile similarities of DOS compounds to known HDAC inhibitors and their performance in the HDAC2 assay. While HDAC2 serves as a representative class I HDAC, the discrepancies between profile similarity to class I HDAC inhibitors and degree of HDAC2 inhibition may reflect the fact that ortho-aminoanilde-based HDAC inhibitors also target HDAC1 and HDAC3 and/or other in vivo cellular factors that may be influencing the gene-expression signatures.
Taking SAR information into account can increase our confidence in profiling assay results. Only 6 out of the 14 OAA DOS compounds in the cluster had sufficient replicate agreement to be considered ‘hits’ in the GE assay, i.e. compounds that induce a reproducible gene-expression change (see Methods). Relying on replicate agreement as an activity criterion alone would hence disregard the remaining 8 compounds, and thus 55% of the HDAC2 hits in the cluster (5 of 9). This result provides an example of the overall utility of our method for guiding the selection of initial hits for follow-up biological studies and chemical synthesis.
The OAA rule is an example of a single structural motif whose presence is sufficient to elicit a relatively defined bioactivity. Although in principle one could have predicted such compounds to have HDAC inhbitory activity by structure alone, these results help validate the method for prediction of less well-known features. More commonly, combinations of features determine a compound’s biological effect. One such example is a set of related DOS compounds that co-cluster with known microtubule destabilizers (Figure 3). The corresponding rule specifies the core, one of two R-groups, and, importantly, all stereocenters for this compound class, effectively describing a series of analog structures. Stereochemistry is a major determinant of specificity for this compound series. Omitting stereochemistry from the rule causes the confidence to drop from 0.5 (3 rule matches out of 6 structure matches) to 0.065 (3 out of 46). The validity of this rule is further supported by the fact that it occurs at the top of both GE (rank 6) and MC (rank 12) rule lists. Microtubule inhibitors co-cluster with the DOS compounds in both the GE and MC rule (Figure 3). Unlike the OAA case, the known bioactive compounds are not structurally related to the DOS compounds, making this an interesting rule to study for lead-hopping purposes. Using structural features that directly match physical DOS building blocks allows rapidly testing such hypotheses as analogs and stereoisomers can be synthesized quickly (if they do not already exist).
Figure 3. Both GE and MC identify the same rule for DOS compounds that co-cluster with microtubule inhibitors.
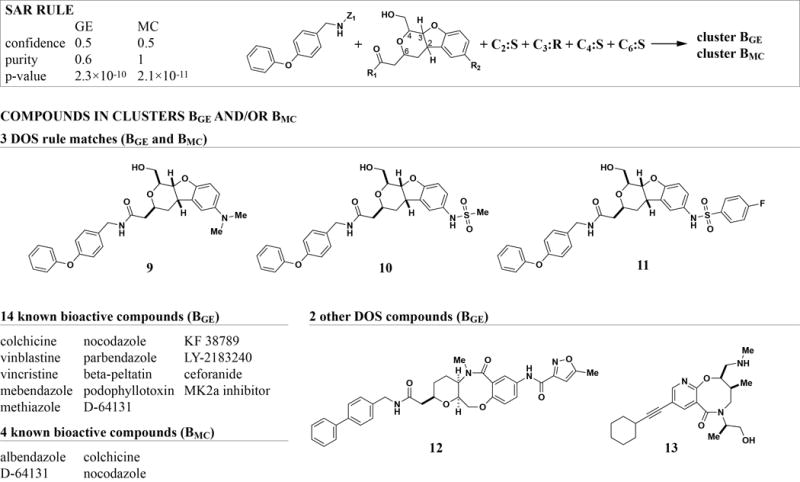
A series of three DOS analogs was identified based on both GE and MC profile clusters, yielding high-scoring rules in both cases. Interestingly, the rule is highly stereo-specific, constraining all four stereocenters in these compounds to one configuration. Known microtubule inhibitors were present in both clusters, though the exact set of bioactives differed. For clarity of presentation, structures for bioactive compounds are omitted (see Figure S1 for detailed structure information).
General structure descriptors allow rule generation for arbitrary compound collections
Not all libraries are designed to include compounds with defined structural relationships like the DOS collection. However, arbitrary libraries can be mined by our method by replacing the chemical structural descriptors. We used this approach to analyze MC profile data for a collection of 10,226 compounds from the Molecular Libraries Small Molecule Repository (MLSMR). We used extended connectivity fingerprints (ECFP422) as a generic structure descriptor that can be used with any compound collection. While any binary fingerprint can readily be used with our method, we chose ECFPs as a reference for this study because they are widely applied, allow direct mapping of features to structural fragments, and were specifically designed for SAR studies.22 They achieve high structural resolution by encoding a very large number of features and thus present a good test for the ability of ARM to mine large feature spaces.
We used clusters based on MC profiles as biological attributes. Due to the versatility of ECFP4, we were able to include our set of known bioactive compounds in the rule-mining step. We found 14,198 rules (7,328 after redundancy filtering) of which 2,176 contained known bioactive compounds. Unlike the DOS-FP features, ECFP4 substructures can describe arbitrary parts of the molecule through combinations of overlapping substructures (Figure 4). This description allows a more fine-grained and unbiased mapping of relevant substructures. The downside is a reduction of interpretability as rules cannot be directly mapped to existing analogs or straightforward synthesis strategies. In addition, a large number of features are usually needed to achieve high resolution and generality. Even though ARM can handle such large data sets, the number of rules can increase as a result and complicate downstream analyses. Therefore, each compound collection and project requires balancing generality, complexity, and interpretability when choosing a chemical descriptor.
Figure 4. ECFP4 features map arbitrary parts of molecules with overlapping substructures.
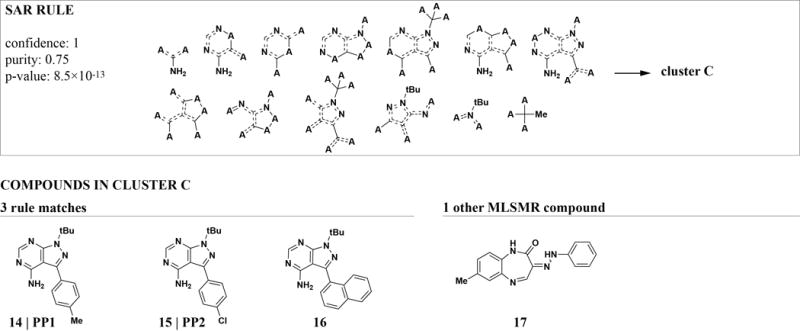
The highest-scoring ECFP4-based rule that involves known-bioactive compounds describes a set of structurally and functionally related kinase inhibitors. While ECFP4 fragments correctly identify their overlapping substructures, feature redundancy and abstractness makes them harder to interpret than synthesis-oriented substructures like DOS-FP (Figure 2 and 3).
Direct mining of attributes identifies biological signatures for sets of related compounds
Clustering biological profiles captures global similarities and differences between the biological effects of compounds. However, information on individual features (e.g., genes from a GE profile) is lost in this process. Since ARM is designed to operate on high-dimensional data, it can be used to mine biological features without intermediate aggregation. Useful applications include mining compound-target profiles or GE signatures, i.e., sets of genes that change expression levels in response to compound treatment.
We generated a signature of up- and down-regulated genes for each compound by applying a z-score threshold of 2 and −2 to GE profiles, respectively (relative to DMSO-treated controls). The signatures were combined with DOS-FP features and subjected to ARM. The top-scoring rule is again the occurrence of an OAA residue already found with GE clusters as biological attributes (confidence=0.3, purity=1, p=1.68×10⁻²⁶, SAR score=0.98). The associated GE signature consists of only three genes: CASP3:down, IER3:up, TERF2IP:down. This relatively low number of common features leads to important differences in specificity compared to the analogous clustering-based rule. In addition to mocetinostat and tacedinaline, compounds that do not target HDACs are also found to regulate these genes (15D-prostaglandin J2, withaferin A, thioridazine, and aminopurvalanol A). However, more specific rules can be found that achieve only slightly lower SAR scores due to their reduced confidence. For example, the signature CASP3:down, IER3:up, TBPL1:up, TERF2IP:down is only found in benzamide-carrying DOS compounds and mocetinostat and tacedinaline (SAR score 0.95, rank 4 in the full set of rules).
The second-ranked rule is highly specific for a small set of compounds with a signature of 13 up-regulated genes (Figure 5). A functional analysis strongly related the 13-member gene set to sterol and cholesterol synthesis (Table S2). Interestingly, sirolimus and fulvestrant are also found to change the expression of these genes. Irrespective of their distinct mechanisms of action, each has been linked to cholesterol levels and metabolism.31,32 A corresponding rule found by clustering full-length profiles as described above achieved high ranks for both GE (rank 8) and MC (rank 11). However, neither of the known bioactive compounds co-clusters with the DOS compounds in both assays. This finding supports the view that gene-signatures capture subsets of the global biological effects of perturbagens.33 We therefore hypothesize that the DOS compounds identified by this rule have related biological effects connected to cholesterol metabolism. This example illustrates how the combination of profiling and automated SAR analysis can aid data mining and quickly lead to testable hypothesis.
Figure 5. ARM can identify biological signatures for groups of structurally related compounds.
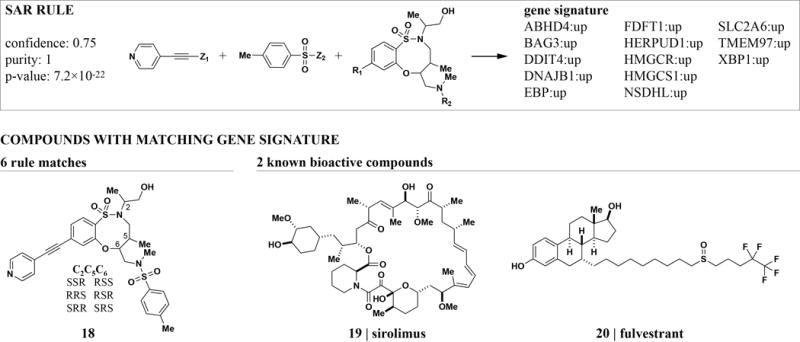
A set of DOS stereoisomers was found to regulate 13 genes enriched for functions in cholesterol metabolism. The same genes are regulated as part of the signatures of sirolimus and fulvestrant, two mechanistically unrelated compounds that have both been linked to cholesterol metabolism.31,32
Discussion
Small-molecule profiling datasets are promising resources for the elucidation of SARs with high granularity. We have illustrated in several examples that association-rule mining can identify interpretable SAR rules from large sets of high-dimensional profiling data.
Our method is designed to support compound selection and synthesis decisions in early-stage drug- and probe-discovery projects. The data in such projects often consist of high-throughput measurements for large compound libraries. Such data are expected to be noisy and contain only small groups of related compounds with similar biological effects. Acknowledging these limitations, we chose a data-mining approach to analyzing such data. Rather than attempting automated classification, our method supports hypothesis generation and human decision making.
These goals further led us to choose interpretable structural fragments as chemical features to obtain rules that can directly inform synthesis decisions. However, our method is not limited to structural descriptors. ARM can be used with any descriptor that can be expressed through binary attributes. Categorical, ordinal, or continuous attributes like physicochemical properties or calculated descriptors can usually be represented by binning and proper encoding without too much loss of information. In any case, a balance between generality and interpretability of chemical attributes needs to be found. Custom synthesis-oriented representations like DOS-FP are highly interpretable but not applicable to all libraries. By contrast, generic fingerprints like ECFP4 rely on more abstract features that usually do not directly relate to synthetically accessible building blocks.
Similar considerations apply to the biological descriptors. First, different experimental methods will likely capture and emphasize different biological effects. We found that, even though several top-scoring rules were identified by both GE and MC, the particular composition of compound groups often differed. However, a comprehensive comparison between such methods has not yet been performed. Second, the computational representation of biological profiles and measures for their comparison will influence the quality of the resulting rules. Global similarity measures like correlation to cluster profiles before SAR mining can be more suitable for compounds that elicit subtle effects across a wide range of features. By contrast, if a phenotype results from strong effects on only a few features, signature-based approaches, i.e., methods that use lists of the most strongly altered features for a perturbation,33 are likely to perform better than whole-profile similarity methods. The generality of the ARM approach allows using arbitrary combinations of chemical and biological features, and comparing different feature choices can greatly increase the confidence in individual results.
Finally, the scoring function can be tailored toward individual needs. A number of objective measures of interestingness have been suggested that can be used with any attributes.16 More domain-specific measures like intra-cluster distances, for example, can easily be integrated into the score as addends. Weighting individual features gives control over their relative importance to each other and allows different rule types to be prioritized. For example, putting high weight on the purity of a rule would lead to preferential selection of rare bioactivity patterns over common ones. We believe that these features make ARM an efficient and versatile approach for automated SAR mining of biological profiling data.
Supplementary Material
Acknowledgments
Cheminformatics and data-mining work was supported by National Institute of General Medical Sciences (P50-GM069721 awarded to S.L.S.), as part of the Center of Excellence for Chemical Methodology and Library Development. Profiling measurements were supported as part of the NIH RoadMap Molecular Libraries Initiative (U54-HG005032 awarded to S.L.S.). Associated data can be accessed at http://www.broadinstitute.org/scientific-community/science/programs/csoft/therapeutics-platform/mlpcn/accessing-mlpcn-data. D.M.F. and S.J.H. were supported through funding from the NIH (R01DA028301) and the Stanley Medical Research Institute. S.L.S. is an investigator at the Howard Hughes Medical Institute.
References
- 1.Feng Y, Mitchison TJ, Bender A, et al. Multi-parameter phenotypic profiling: using cellular effects to characterize small-molecule compounds. Nat Rev Drug Discov. 2009;8:567–578. doi: 10.1038/nrd2876. [DOI] [PubMed] [Google Scholar]
- 2.Scherf U, Ross DT, Waltham M, et al. A gene expression database for the molecular pharmacology of cancer. Nat Genet. 2000;24:236–244. doi: 10.1038/73439. [DOI] [PubMed] [Google Scholar]
- 3.Young DW, Bender A, Hoyt J, et al. Integrating high-content screening and ligand-target prediction to identify mechanism of action. Nat Chem Biol. 2008;4:59–68. doi: 10.1038/nchembio.2007.53. [DOI] [PubMed] [Google Scholar]
- 4.Wagner BK, Clemons PA. Connecting synthetic chemistry decisions to cell and genome biology using small-molecule phenotypic profiling. Curr Opin Chem Biol. 2009;13:539–548. doi: 10.1016/j.cbpa.2009.09.018. [DOI] [PMC free article] [PubMed] [Google Scholar]
- 5.Garnett MJ, Edelman EJ, Heidorn SJ, et al. Systematic identification of genomic markers of drug sensitivity in cancer cells. Nature. 2012;483:570–575. doi: 10.1038/nature11005. [DOI] [PMC free article] [PubMed] [Google Scholar]
- 6.Basu A, Bodycombe NE, Cheah JH, et al. An interactive resource to identify cancer genetic and lineage dependencies targeted by small molecules. Cell. 2013;154:1151–1161. doi: 10.1016/j.cell.2013.08.003. [DOI] [PMC free article] [PubMed] [Google Scholar]
- 7.Petrone PM, Simms B, Nigsch F, et al. Rethinking molecular similarity: comparing compounds on the basis of biological activity. ACS Chem Biol. 2012;7:1399–1409. doi: 10.1021/cb3001028. [DOI] [PubMed] [Google Scholar]
- 8.Wassermann AM, Bajorath J. BindingDB and ChEMBL: online compound databases for drug discovery. Expert Opin Drug Discov. 2011;6:683–687. doi: 10.1517/17460441.2011.579100. [DOI] [PubMed] [Google Scholar]
- 9.Seiler KP, George GA, Happ MP, et al. ChemBank: a small-molecule screening and cheminformatics resource database. Nucleic Acids Res. 2008;36:D351–359. doi: 10.1093/nar/gkm843. [DOI] [PMC free article] [PubMed] [Google Scholar]
- 10.Peck D, Crawford ED, Ross KN, et al. A method for high-throughput gene expression signature analysis. Genome Biol. 2006;7:R61. doi: 10.1186/gb-2006-7-7-r61. [DOI] [PMC free article] [PubMed] [Google Scholar]
- 11.Gustafsdottir SM, Ljosa V, Sokolnicki KL, et al. Multiplex cytological profiling assay to measure diverse cellular states. PLoS One. 2013;8:e80999. doi: 10.1371/journal.pone.0080999. [DOI] [PMC free article] [PubMed] [Google Scholar]
- 12.Wawer M, Bajorath J. Extraction of structure-activity relationship information from high-throughput screening data. Curr Med Chem. 2009;16:4049–4057. doi: 10.2174/092986709789378189. [DOI] [PubMed] [Google Scholar]
- 13.Medina-Franco JL, Yongye AB, Perez-Villanueva J, et al. Multitarget structure-activity relationships characterized by activity-difference maps and consensus similarity measure. J Chem Inf Model. 2011;51:2427–2439. doi: 10.1021/ci200281v. [DOI] [PubMed] [Google Scholar]
- 14.Wassermann AM, Peltason L, Bajorath J. Computational analysis of multi-target structure-activity relationships to derive preference orders for chemical modifications toward target selectivity. Chem Med Chem. 2010;5:847–858. doi: 10.1002/cmdc.201000064. [DOI] [PubMed] [Google Scholar]
- 15.Iyer P, Dimova D, Vogt M, et al. Navigating high-dimensional activity landscapes: design and application of the ligand-target differentiation map. J Chem Inf Model. 2012;52:1962–1969. doi: 10.1021/ci3002765. [DOI] [PubMed] [Google Scholar]
- 16.Tan P, Steinbach M, Kumar V. Introduction to Data Mining. Addison-Wesley; 2005. pp. 327–414. [Google Scholar]
- 17.Borgelt C, Berthold MR. Mining molecular fragments: finding relevant substructures of molecules; Proceedings of the 2002 IEEE International Conference on Data Mining; Maebashi, Japan. 2002; Piscataway, NJ, USA: IEEE Press; 2002. pp. 51–58. [Google Scholar]
- 18.Borgelt C, Berthold M, Patterson D. In: Symbolic and Quantitative Approaches to Reasoning with Uncertainty. Godo L, editor. Vol. 3571. Springer; Berlin Heidelberg: 2005. pp. 1002–1013. [Google Scholar]
- 19.Lounkine E, Auer J, Bajorath J. Formal concept analysis for the identification of molecular fragment combinations specific for active and highly potent compounds. J Med Chem. 2008;51:5342–5348. doi: 10.1021/jm800515r. [DOI] [PubMed] [Google Scholar]
- 20.Burke MD, Schreiber SL. A planning strategy for diversity-oriented synthesis. Angew Chem Int Ed Engl. 2004;43:46–58. doi: 10.1002/anie.200300626. [DOI] [PubMed] [Google Scholar]
- 21.Nielsen TE, Schreiber SL. Towards the optimal screening collection: a synthesis strategy. Angew Chem Int Ed Engl. 2008;47:48–56. doi: 10.1002/anie.200703073. [DOI] [PMC free article] [PubMed] [Google Scholar]
- 22.Rogers D, Hahn M. Extended-connectivity fingerprints. J Chem Inf Model. 2010;50:742–754. doi: 10.1021/ci100050t. [DOI] [PubMed] [Google Scholar]
- 23.Li H, Wang Y, Zhang D, et al. Pfp: Parallel Fp-growth for Query Recommendation; Proceedings of the 2008 ACM Conference on Recommender Systems; Lausanne, Switzerland. 2008; New York, NY, USA: ACM; 2008. pp. 107–114. [Google Scholar]
- 24.Hahsler Michael, G B, Hornik Kurt. arules – A Computational Environment for Mining Association Rules and Frequent Item Sets. J Stat Softw. 2005;14:1–25. [Google Scholar]
- 25.Box GEP, Cox DR. An Analysis of Transformations. J R Stat Soc Ser B Stat Methodol. 1964;26:211–252. [Google Scholar]
- 26.Agresti A. A Survey of Exact Inference for Contingency Tables. Statistical Science. 1992;7:131–153. [Google Scholar]
- 27.Bolden JE, Peart MJ, Johnstone RW. Anticancer activities of histone deacetylase inhibitors. Nat Rev Drug Discov. 2006;5:769–784. doi: 10.1038/nrd2133. [DOI] [PubMed] [Google Scholar]
- 28.Marcaurelle LA, Comer E, Dandapani S, et al. An aldol-based build/couple/pair strategy for the synthesis of medium- and large-sized rings: discovery of macrocyclic histone deacetylase inhibitors. J Am Chem Soc. 2010;132:16962–16976. doi: 10.1021/ja105119r. [DOI] [PMC free article] [PubMed] [Google Scholar]
- 29.Bradner JE, West N, Grachan ML, et al. Chemical phylogenetics of histone deacetylases. Nat Chem Biol. 2010;6:238–243. doi: 10.1038/nchembio.313. [DOI] [PMC free article] [PubMed] [Google Scholar]
- 30.Frumm SM, Fan ZP, Ross KN, et al. Selective HDAC1/HDAC2 inhibitors induce neuroblastoma differentiation. Chem Biol. 2013;20:713–725. doi: 10.1016/j.chembiol.2013.03.020. [DOI] [PMC free article] [PubMed] [Google Scholar]
- 31.Sibonga JD, Dobnig H, Harden RM, et al. Effect of the high-affinity estrogen receptor ligand ICI 182,780 on the rat tibia. Endocrinology. 1998;139:3736–3742. doi: 10.1210/endo.139.9.6172. [DOI] [PubMed] [Google Scholar]
- 32.Ma KL, Ruan XZ, Powis SH, et al. Sirolimus modifies cholesterol homeostasis in hepatic cells: a potential molecular mechanism for sirolimus-associated dyslipidemia. Transplantation. 2007;84:1029–1036. doi: 10.1097/01.tp.0000286095.55685.e9. [DOI] [PubMed] [Google Scholar]
- 33.Lamb J, Crawford ED, Peck D, et al. The Connectivity Map: using gene-expression signatures to connect small molecules, genes, and disease. Science. 2006;313:1929–1935. doi: 10.1126/science.1132939. [DOI] [PubMed] [Google Scholar]
Associated Data
This section collects any data citations, data availability statements, or supplementary materials included in this article.