

Abstract
Mutations within LRRK2, most notably p.G2019S, cause Parkinson’s disease (PD) in rare monogenic families, and sporadic occurrences in diverse populations. We investigated variation throughout LRRK2 (84 SNPs; genotype or diplotype found for 49 LD blocks) for 275 cases (European ancestry, onset at age 60 or older) and 275 neurologically healthy control subjects (NINDS Neurogenetics Repository). Three grade-of-membership groups, i.e. genetic risk sets, were identified that exactly matched many subjects (cases: 46, 4, 137; controls: 0, 178, 0), and distinguished 94% of the subjects (i.e. > 50% likeness to one set). Set I, affected, carried certain low frequency alleles located in multiple functional domains. Set II was unaffected. Set III, also affected, resembled II except for slightly elevated frequencies of minor alleles not defining set I. We conclude that certain low frequency alleles distributed throughout LRRK2 are a genetic background to a third of cases, defining a distinct subset.
Introduction
Parkinson’s disease (PD, OMIM #168600) is a chronic neurodegenerative disease with a cumulative prevalence of greater than one per thousand people1. It is well characterized clinically (resting tremor, bradykinesia, postural instability, rigidity) and pathologically (loss of dopaminergic neurons in the pars compacta of the substantia nigra). Genetically, rare monogenic families have identified five causative genes, the most common (~7%)2 being leucine-rich repeat kinase 2 (LRRK2; OMIM *609007) located on chromosome 12q12. Candidate gene studies have to date been less successful in demonstrating the genetic background to sporadic PD.
Our interest focused on the LRRK2 gene as both familial and sporadic cases in diverse populations are known to carry the p.G2019S mutation, e.g. ~1% of sporadic cases with European ancestry2. The gene is large, spanning 1.4 Mb, consisting of 51 exons and multiple functional domains (Leucine-rich repeats (LRR), Roc, COR, RAS, Kinase, WD40 motif). The encoded protein dardarin is thought to play a role in intracellular signaling3. It is expressed in multiple brain regions, particularly in the substantia nigra, consistent with direct involvement in dopaminergic cell death.
Nonetheless, a genome-wide search4 did not identify any SNP within (51 SNPs), or close to, LRRK2 as relevant to PD in the NINDS Neurogenetic Repository sample of 275 cases of European ancestry with onset at age 60 or older & 275 neurologically healthy control subjects applying a rather stringent criterion (uncorrected P-value < 0.0001). These negative findings were not likely related to differing population structure for case and control subjects as comparison of the two groups demonstrated no appreciable differences (STRUCTURE; http://pritch.bsd.uchicago.edu/structure.html)4,5.
Paisan-Ruiz et al. then sequenced all 51 exons, and at least 50 bp of flanking intronic sequence, for the sample6. Twelve patients were found to carry coding variants (4 cases carried p.G2019S) as well as seven control subjects (no p.G2019S mutations). A total of 135 variants were identified in the sample including SNPs from the genome-wide study and those identified by sequencing, many were unique to one or several subjects. Considering the 84 SNPs having minor allele frequency of 5 or more, six SNPs scattered throughout the gene were associated with PD by chi-square testing using a weaker criterion (p < 0.05), indicated by an asterisk throughout this paper: rs1157655* (A allele, intron 2), rs1907632* (T, intron 11), rs11564205* (G, intron 34), rs11564203* (A, intron 39), rs11829088* (G, intron 39), and rs11564173* (A, intron 46)6.
Our goal was to take this information a step further by first identifying linkage disequilibrium blocks (LD) to simplify the data and render it more meaningful, and then, by identifying genetic risk sets for PD, each defined by genotype/diplotype frequencies for the LD blocks. This was accomplished by grade-of-membership analysis (GoM)7–10.
GoM is a form of latent classification analysis that incorporates large amounts of information to identify major patterns within the data. It allows individuals to resemble one of the identified patterns, or GoM groups, here, genetic risk sets, or more often, to partly resemble two or more groups. The degree of likeness of individuals to each GoM group is given by membership scores in the groups, like weights, which range from zero (no likeness of the subject to the GoM group) to one (an exact match), summing to one for each subject. This fuzziness with respect to individuals minimizes the number of groups needed to represent the sample. Unlike other forms of latent classification, it operates efficiently in L1 space (linear differences), rather than L2 space (sum of squares differences), providing 5-fold better ability to identify patterns according to the signal detection literature, i.e. high power compared to more usual genetic epidemiologic approaches11. Importantly, the GoM groups (represented here by frequencies for genotypes/diplotypes), and the likeness of individuals to the groups (represented by membership scores), are jointly estimated using maximum likelihood (see Methods section), closely defining the space concerning LRRK2, avoiding multiple comparisons. The best number of groups is decided according to an information criterion or empirically, as in this instance when three groups were sufficient to distinguish most (94%) case and control subjects, also identifying a distinct subset, about a third, of cases.
Methods
Study subjects
The 275 sporadic PD cases age 60 or older, and 275 neurologically healthy control subjects having a similar age-sex distribution, are members of a NINDS cohort hosted by the Coriell Institute (http://ccr.coriell.org/Sections/Collections/NINDS/). Initially, 51 SNPs tagging each intron were investigated for the subjects in a genome-wide association analysis using HumanHap317 SNP arrays4. Subsequently, all 51 exons were sequenced for the subjects including at least 50 bp of flanking intronic sequence to identify additional mutations and SNPs. This identified 12 cases who carried mutations (p.H275H, p.M712V, p.A1430A, p.R1728L, p.R1728H, p.G2019S (n=4), p.T2141M, p.R2143H, p.L2466H) as well as 7 controls LRRK2 variants (p.C228S, p.Y707Y, p.A716V, p.K871E, p.L1870F, p.E2395K, p.G2432G)6. Information on age and sex was available for cases.
Coding of the data for entry into GoM analysis
GoM evaluates categorical data, usually 2 to 6 possible outcomes for each variable. PD status: 0=control, 1=onset < age 65, 2=onset age 65 to 74, 3=onset age 75 to 88. Sex: 0=control, 1=male (case), 2=female (case). Mutation status: 0=no mutation, 1=mutation (case), 2=mutation (control). Number of very low frequency alleles found at 34 loci (minor allele count ≤ 5 at each locus): 0, 1, or 2 (at 2 to 5 of these loci).
A total of 84 SNPs had minor allele counts of 5 or more. These loci were in strong LD6. Thus, we created relatively independent variables and facilitated the identification of relevant low frequency alleles by the identification of LD blocks. The LD blocks were identified using the Carlson method (HelixTree Software) specifying the minor allele frequency threshold as 0.01 (not the default value of 0.10) and the R^2 LD threshold as 0.80.
There were 49 LD blocks, labeled from B0 to B48 (Table 1). B0 had minor allele frequency 0.009, I.e. < 0.01. B1 to B12 consisted of multiple loci usually dispersed over a large section of the gene, and overlapping each other. Three of these LD blocks contained the six SNPs previously associated with PD in the sample: B15*, rs1157655* (intron 2); B4*, rs1907632* (intron 11) + rs11564205* (intron 34) + rs11564203* (intron 39) + rs11829088* (intron 39); and, B43*, rs11564173* (intron 46)6. Thus B4* contained four of the six associated SNPs distributed across functional domains including LRR, Roc, COR and Kinase domains.
Table 1. LD blocks located within the LRRK2 gene.
49 LD blocks (B0 to B48) were identified from 84 SNPs located within the LRRK2 gene having minor allele count of 5 or more (Carlson method, R^2 minimum LD threshold 0.80, minimum allele frequency threshold 0.01, HelixTree Software). The SNPs are listed in map order from 5′ to 3′ except for non-contiguous SNPs belonging to B1 to B12 consisting of multiple SNPs. SNPs previously associated with PD [B15* (rs1157655), B4* (rs1907632, rs11564205, rs11564203, rs11829088), B43* (rs11564173); p < 0.05 in chi-sq testing]6 and those identified here according to a less stringent criterion [B28* (rs10784498), B31* (rs33958906); p < 0.10 in an additive co-dominant model] are highlighted in red, and tagged with an asterisk.
| Block Number |
SNP Name | Minor Allele Freq. |
Location |
|---|---|---|---|
| 13 | rs1388587 | 0.294 | 5′ near gene |
| 7 | rs2201144 | 0.081 | 5′ near gene |
| 7 | rs2131088 | 0.068 | Intron 4 |
| 7 | rs1388596 | 0.067 | Intron 7 |
| 14 | rs12230685 | 0.156 | Intron 2 |
| 15* | rs11175655* | 0.144 | Intron 2 |
| 16 | rs10878245 | 0.399 | Exon 5 |
| 17 | rs10878246 | 0.163 | Intron 5 |
| 18 | rs10878247 | 0.291 | Intron 5 |
| 8 | rs10878249 | 0.399 | Intron 5 |
| 8 | c.839-160C>T | 0.354 | Intron 7 |
| 8 | rs7955902 | 0.361 | Intron 9 |
| 19 | rs11564187 | 0.027 | Intron 5 |
| 20 | rs7134379 | 0.273 | Intron 8 |
| 21 | rs1491938 | 0.433 | Intron 10 |
| 22 | rs7969677 | 0.194 | Intron 11 |
| 4* | rs1907632* | 0.166 | Intron 11 |
| 4* | rs11564205* | 0.164 | Intron 34 |
| 4* | rs11564203* | 0.164 | Intron 39 |
| 4* | rs11829088* | 0.164 | Intron 39 |
| 23 | rs2723264 | 0.209 | Intron 12 |
| 3 | rs10784461 | 0.467 | Intron 13 |
| 3 | rs10784462 | 0.463 | Intron 14 |
| 3 | rs11175847 | 0.460 | Intron 18 |
| 3 | rs36220740 | 0.468 | Intron 19 |
| 3 | rs12820920 | 0.461 | Intron 21 |
| 2 | rs7308720 | 0.066 | Exon 14 |
| 2 | rs7133914 | 0.068 | Exon 30 |
| 2 | rs11175964 | 0.066 | Exon 30 |
| 2 | rs11176022 | 0.063 | Intron 37 |
| 2 | rs10878386 | 0.069 | Intron 39 |
| 2 | rs11176195 | 0.069 | Intron 47 |
| 2 | rs12426498 | 0.066 | Intron 50 |
| 9 | rs10784470 | 0.285 | Intron 15 |
| 9 | rs11564148 | 0.283 | Exon 34 |
| 9 | rs4768230 | 0.282 | Intron 35 |
| 10 | rs11564129 | 0.093 | Intron 16 |
| 10 | rs11564149 | 0.095 | Intron 28 |
| 24 | rs10506151 | 0.138 | Intron 16 |
| 25 | rs10878307 | 0.068 | Exon 18 |
| 26 | c.2680+11insA | 0.075 | Intron 20 |
| 27 | rs7966550 | 0.138 | Exon 22 |
| 28* | rs10784498* | 0.357 | Intron 26 |
| 29 | c.4309+12delT | 0.025 | Intron 30 |
| 1 | rs10650388 | 0.368 | Intron 30 |
| 1 | rs7302503 | 0.362 | Intron 31 |
| 1 | rs1427267 | 0.362 | Intron 32 |
| 1 | rs1427263 | 0.364 | Exon 34 |
| 1 | rs7137665 | 0.362 | Intron 36 |
| 1 | rs4768236 | 0.366 | Intron 47 |
| 1 | rs3761863 | 0.368 | Exon 49 |
| 1 | rs12426362 | 0.370 | Intron 49 |
| 30 | rs11175985 | 0.134 | Intron 31 |
| 31* | rs33958906* | 0.026 | Exon 32 |
| 5 | rs1896252 | 0.461 | Intron 33 |
| 5 | rs11176013 | 0.455 | Exon 34 |
| 5 | rs10878371 | 0.459 | Exon 37 |
| 5 | rs7298930 | 0.457 | Intron 39 |
| 32 | rs35303786 | 0.014 | Exon 34 |
| 33 | rs17444054 | 0.028 | Intron 37 |
| 34 | rs10878372 | 0.218 | Intron 37 |
| 0 | c.5656+7C>T | 0.009 | Intron 38 |
| 35 | c.5656+35G>A | 0.027 | Intron 38 |
| 36 | rs12370996 | 0.040 | Intron 39 |
| 11 | rs11176052 | 0.262 | Intron 39 |
| 11 | rs11176053 | 0.262 | Intron 39 |
| 37 | rs7307562 | 0.378 | Intron 39 |
| 38 | rs2404835 | 0.329 | Intron 40 |
| 6 | rs1427271 | 0.165 | Intron 40 |
| 6 | rs7307310 | 0.138 | Intron 43 |
| 6 | rs4768238 | 0.137 | Intron 50 |
| 6 | rs1465527 | 0.137 | 3′ near gene |
| 39 | rs10735934 | 0.494 | Intron 40 |
| 40 | rs10506155 | 0.328 | Intron 41 |
| 41 | rs33995883 | 0.021 | Exon 42 |
| 12 | rs10878405 | 0.312 | Exon 43 |
| 12 | rs10467147 | 0.317 | 3′ near gene |
| 42 | rs11176143 | 0.113 | Intron 43 |
| 43* | rs11564173* | 0.114 | Intron 46 |
| 44 | c.7029-8(8>9T) | 0.369 | Intron 47 |
| 45 | rs33962975 | 0.130 | Exon 48 |
| 46 | rs11835105 | 0.184 | Intron 48 |
| 47 | rs3789329 | 0.029 | Intron 49 |
| 48 | rs1820545 | 0.438 | 3′ near gene |
Next, diplotype for individuals was inferred for LD blocks B1 to B12 using the E-M algorithm. Each value had > 99% probability, with 9 exceptions (> 92% probability). Diplotype was not inferred when there was missing genotype information as this would misidentify infrequent alleles, if present. The data was nearly complete (648 missing values among the 49 blocks). Missing values did not substantially represent untyped very low frequency alleles: the majority of missing data was limited to 5 case and 8 control subjects. Diplotype for B1 to B12, and genotype for B0, B13 to B48 were coded numerically, grouping low frequency values < 5% together (Table 2).
Table 2. Haplotype frequencies for B1 to B12 consisting of multiple SNPs.
Haplotype frequencies for LD blocks B1 to B12 consisting of multiple SNPs.
| Block | Haplotype | Frequency |
|---|---|---|
| 7 | TAT | 0.910 |
| CTC | 0.060 | |
| CAT | 0.010 | |
| CTT | 0.002 | |
| TAC | 0.002 | |
| TTC | 0.001 | |
| 8 | TCC | 0.590 |
| CTA | 0.350 | |
| CCC | 0.040 | |
| CCA | 0.010 | |
| TTA | 0.003 | |
| CTC | 0.003 | |
| TTC | 0.002 | |
| 4* | CAGT | 0.830 |
| TGAG | 0.160 | |
| TAAG | 0.008 | |
| CGGT | 0.004 | |
| TGGT | 0.002 | |
| TAGT | 0.002 | |
| CGAG | 0.001 | |
| CGGG | 0.001 | |
| 3 | ACGCA | 0.510 |
| GGTAG | 0.450 | |
| GGGCA | 0.010 | |
| ACGAA | 0.010 | |
| ACTAG | 0.050 | |
| GCTAG | 0.050 | |
| GGGAA | 0.003 | |
| GGTCG | 0.003 | |
| ACTCG | 0.002 | |
| AGGCA | 0.002 | |
| ACGCG | 0.001 | |
| GCGCA | 0.001 | |
| 2 | CGGTAAT | 0.930 |
| GAACTGC | 0.060 | |
| GAATTGC | 0.004 | |
| CAACTGC | 0.003 | |
| CAGTAAT | 0.002 | |
| GAACAGT | 0.002 | |
| CGGTAAC | 0.001 | |
| CGGTAGC | 0.001 | |
| 9 | GTG | 0.700 |
| TAA | 0.270 | |
| TTG | 0.020 | |
| GAA | 0.006 | |
| GAG | 0.005 | |
| 10 | TC | 0.900 |
| CT | 0.090 | |
| TT | 0.004 | |
| CC | 0.002 | |
| 1 | CAGATACA | 0.590 |
| AGACCCTT | 0.330 | |
| CAGATCTT | 0.020 | |
| AGACCACA | 0.020 | |
| CAGATATT | 0.006 | |
| CGACCCTT | 0.004 | |
| AAGATACA | 0.003 | |
| CAGATCCA | 0.003 | |
| CAGACACA | 0.003 | |
| CGAATCCT | 0.002 | |
| AGACCATA | 0.002 | |
| AGACTCTT | 0.002 | |
| CAGCTACA | 0.002 | |
| AGACCCCT | 0.002 | |
| AAGCCATA | 0.002 | |
| CGACCACA | 0.001 | |
| CGACTCTT | 0.001 | |
| CAGACACT | 0.001 | |
| AAGCTACA | 0.001 | |
| CAGATCCT | 0.001 | |
| AAGATCCT | 0.000 | |
| AAGATCTT | 0.000 | |
| 5 | CGCC | 0.530 |
| TATA | 0.450 | |
| TGCC | 0.005 | |
| CGCA | 0.003 | |
| TGTA | 0.003 | |
| CGTC | 0.003 | |
| CATA | 0.002 | |
| TATC | 0.001 | |
| CACC | 0.001 | |
| TACC | 0.001 | |
| 11 | CC | 0.740 |
| TT | 0.260 | |
| 6 | CCGT | 0.830 |
| TTAC | 0.140 | |
| TCGT | 0.030 | |
| TTGC | 0.005 | |
| CCAT | 0.002 | |
| CCAC | 0.001 | |
| TTGT | 0.001 | |
| TCAC | 0.001 | |
| 12 | GG | 0.670 |
| AA | 0.300 | |
| GA | 0.020 | |
| AG | 0.010 |
Grade-of membership analysis
Patterns of polymorphisms associated with high and low risk were identified by grade-of-membership analysis (GoM), alluding to the graded membership scores of individuals in the identified GoM groups, here, patterns of polymorphisms. These scores reflect the resemblance of an individual to the groups. Each group is represented by a set of outcome probabilities for the variables, e.g. being male or female.
More formally, the GoM model likelihood can be described after first identifying four indices. One is the number of subjects I (i = 1,2,…, I). Here, I = 550. The second index is the number of variables J (j = 1, 2,…, J). There are J = 9 variables (final model). Our third index is Lj: the set of response levels for the Jth variable. This leads to the definition of the basic GoM model where the probability that the ith subject has the Ljth level of the Jth variable is defined by a binary variable (ie, yijl = 0, 1). The model with these definitions is
| (1) |
where the gik are convexly constrained scores (i.e., 0.0 ≤ gik ≤ 1.0; Σk gik = 1.0) for subjects and the λkjl are probabilities that, for the Kth latent group, the Ljth level is found for the Jth variable. The procedure thus uses this expression to identify K profiles representing the pattern of J × Lj responses found for I subjects.
The parameters gik and λkjl are estimated simultaneously using the likelihood function (in its most basic form).
| (2) |
In the likelihood yijl is 1.0 if the Ljth level is present and 0.0 if it is not present.
Variables used to define the GoM groups are termed “internal” variables. Initially, each facet of the data was used to construct models specifying K = 2, 3, 4, 5, or 6 groups. These models, despite efforts to minimize LD, reflected relationships among the variables unrelated to PD status. Thus a second set of models was constructed employing a reduced set of “internal” variables: PD status, sex, mutation status, number of very low frequency alleles, and information on five SNP blocks that demonstrated a modicum of association with PD (B15*, B4*, B28*, B31*, B43*) (Armitage trend test, p < 0.10, HelixTree Software).
Information on the other LD blocks further characterized the groups as “external” variables. One option in the likelihood is to separate calculations for “internal” and “external” (here, LD blocks not demonstrating evidence of association) variables. For internal variables, maximum likelihood estimations [MLE] of gik and λkjl are generated and the information in internal variables is used to define the K groups. For external variables the likelihood is evaluated (and MLE of λkj; generated) but the information is not used to redefine the K groups, that is, the likelihood calculations for likelihood equations involving the gik are disabled for external variables so that the gik, and the definition of the K groups, is not changed. The model 7 presented here represents three patterns of polymorphisms that distinguish parsimoniously between high and low risk, and identifies two patterns associated with risk, one concise and the other diverse.
Results
Overview
Three patterns of genetic variation were identified that represent 94% of the subjects. The number of very low frequency alleles and the occurrence of mutation played very limited roles in defining the patterns and distinguishing the subjects. Pattern I represented a specific set of minor alleles as a background to PD among about a third of cases. Pattern II was unaffected. Pattern III represented PD associated with a more diverse occurrence of other low frequency alleles. Age at the time of diagnosis ranged from age 60 to the late 80’s for both I and III, but occurrence before age 65 was more likely for I (22% vs 11%).
Pattern I
A specific set of minor alleles scattered throughout LRRK2 was a common background to sporadic PD (Table 3). A core set of minor alleles was found: Minor alleles were the rule for B15* (GA, not GG), for B4* (CAGT:TGAG – or else diverse minor diplotypes, not the common diplotype CAGT:CAGT) and for B43* (GA or AA, not GG). These three LD blocks include all six of the SNPs individually associated with PD in the sample6, and were the most informative blocks (B4*, H=0.55; B15*, H=0.53; B43*, H=0.52). The H statistic (Shannon Labs) describes the extent that outcomes for the variable differ for I, II, and III. Values above 0.50 denote strong differences among the GoM groups for the variable.
Table 3. Patterns of risk (I, II, III) for sporadic PD involving LRRK2.
Patterns of risk for PD are displayed (I, II, III). Each pattern is defined by the displayed probabilities. Pattern I is affected and carries a set of minor alleles for B15*, B17, B4* (most notably), B28*, B31*, B11, B43* and B46. Pattern II is unaffected and at low risk with respect to genetic variation within LRRK2. Pattern III is affected and has slightly elevated minor allele frequencies at locations not found for pattern I. Variables used to identify the patterns are shown in bold. The GoM maximum likelihood method automatically generates outcome probabilities for other variables based on the membership of individuals in the identified sets. Most subjects matched (100% membership) or closely resembled (> 50% membership) one of these patterns: I: 46 cases were exact matches (91 were close matches); II: 178 control subjects were exact matches (250 were close matches); III: 137 cases were exact matches (178 were close matches). None of the control subjects were exact matches to I or III; 10% of control subjects resembled I. Information content for each variable is denote by ‘H’ (Shannon, Bell Labs): Values near zero indicate similar outcome frequencies similar for each set; higher values indicate greater information content.
| Variable | Outcome | I | II | III | H |
|---|---|---|---|---|---|
| PD status | Control | 0 | 100 | 0 | 0.71 |
| Onset age 59 to 64 | 22 | 0 | 11 | ||
| Onset age 65 to 74 | 43 | 0 | 55 | ||
| Onset age 75 to 88 | 35 | 0 | 34 | ||
|
| |||||
| Sex | Control | 0 | 100 | 0 | 0.70 |
| Male | 68 | 0 | 59 | ||
| Female | 32 | 0 | 41 | ||
|
| |||||
| Mutation | No | 98 | 97 | 95 | 0.02 |
| Yes, case | 2 | 0 | 5 | ||
| Yes, control | 0 | 3 | 0 | ||
|
| |||||
| Number of very low freq. alleles | 0 | 74 | 80 | 73 | 0.004 |
| 1 | 22 | 16 | 20 | ||
| 2 to 5 | 4 | 4 | 7 | ||
|
| |||||
| B13 | CC | 47 | 50 | 52 | 0.004 |
| CG | 46 | 44 | 37 | ||
| GG | 7 | 7 | 11 | ||
|
| |||||
| B7 | TAT:TAT | 90 | 85 | 86 | 0.03 |
| TAT:CTC | 0 | 12 | 13 | ||
| Low freq. | 10 | 4 | 1 | ||
|
| |||||
| B14 | CC | 91 | 67 | 67 | 0.03 |
| CT | 9 | 33 | 33 | ||
|
| |||||
| B15* | GG | 0 | 100 | 100 | 0.53 |
| GA | 100 | 0 | 0 | ||
|
| |||||
| B16 | CC | 62 | 30 | 26 | 0.07 |
| CT | 38 | 52 | 51 | ||
| TT | 0 | 18 | 23 | ||
|
| |||||
| B17 | TT | 0 | 92 | 98 | 0.42 |
| TG | 100 | 8 | 2 | ||
|
| |||||
| B18 | CC | 72 | 47 | 39 | 0.04 |
| CT | 28 | 46 | 47 | ||
| TT | 0 | 8 | 14 | ||
|
| |||||
| B8 | TCC:TCC | 60 | 28 | 29 | 0.07 |
| TCC:CTA | 38 | 43 | 42 | ||
| CTA:CTA | 0 | 17 | 15 | ||
| Low freq. | 2 | 13 | 14 | ||
|
| |||||
| B19 | AA | 98 | 95 | 93 | 0.004 |
| AG or GG | 2 | 5 | 7 | ||
|
| |||||
| B20 | CC | 76 | 50 | 41 | 0.05 |
| CT | 24 | 43 | 47 | ||
| TT | 0 | 8 | 12 | ||
|
| |||||
| B21 | TT | 61 | 25 | 19 | 0.09 |
| TC | 39 | 53 | 54 | ||
| CC | 0 | 22 | 27 | ||
|
| |||||
| B22 | GG | 90 | 59 | 57 | 0.04 |
| GA | 10 | 41 | 43 | ||
|
| |||||
| B4* | CAGT:CAGT | 0 | 100 | 100 | 0.55 |
| CAGT:TGAG | 86 | 0 | 0 | ||
| Low freq. | 14 | 0 | 0 | ||
|
| |||||
| B23 | CC | 87 | 53 | 58 | 0.04 |
| CT | 13 | 47 | 42 | ||
|
| |||||
| B3 | ACGCA:ACGCA | 0 | 36 | 38 | 0.10 |
| ACGCA:GGTAG | 48 | 39 | 45 | ||
| GGTAG:GGTAG | 45 | 15 | 11 | ||
| Low freq. | 7 | 10 | 6 | ||
|
| |||||
| B2 | CGGTAAT:CGGTAAT | 95 | 82 | 83 | 0.01 |
| Low freq. | 5 | 18 | 17 | ||
|
| |||||
| B9 | GTG:GTG | 70 | 45 | 43 | 0.04 |
| GTG:TAA | 25 | 41 | 42 | ||
| TAA:TAA | 0 | 11 | 9 | ||
| Low freq. | 5 | 4 | 6 | ||
|
| |||||
| B10 | TC:TC | 85 | 83 | 77 | 0.01 |
| TC:CT | 12 | 16 | 20 | ||
| Low freq. | 3 | 1 | 3 | ||
|
| |||||
| B24 | CC | 90 | 70 | 70 | 0.02 |
| CA | 10 | 30 | 30 | ||
|
| |||||
| B25 | AA | 95 | 84 | 85 | 0.005 |
| AG or GG | 5 | 16 | 15 | ||
|
| |||||
| B26 | AA | 92 | 85 | 83 | 0.005 |
| AC or CC | 8 | 15 | 17 | ||
|
| |||||
| B27 | TT | 89 | 70 | 71 | 0.02 |
| TC | 11 | 30 | 29 | ||
|
| |||||
| B28* | GG | 0 | 58 | 58 | 0.25 |
| AG | 62 | 42 | 42 | ||
| AA | 38 | 0 | 0 | ||
|
| |||||
| B29 | AA | 98 | 95 | 93 | 0.03 |
| AC | 2 | 5 | 7 | ||
|
| |||||
| B1 | CAGATACA:CAGATACA | 59 | 27 | 32 | 0.06 |
| AGACCCTT:CAGATACA | 25 | 48 | 40 | ||
| AGACCCTT:AGACCCTT | 0 | 15 | 18 | ||
| Low freq. | 16 | 8 | 10 | ||
|
| |||||
| B30 | CC | 86 | 71 | 70 | 0.01 |
| CT or TT | 14 | 29 | 30 | ||
|
| |||||
| B31* | CC | 94 | 100 | 89 | 0.03 |
| CT or TT | 6 | 0 | 11 | ||
|
| |||||
| B5 | CGCC:CGCC | 49 | 20 | 21 | 0.08 |
| CGCC:TATA | 47 | 54 | 47 | ||
| TATA:TATA | 0 | 23 | 29 | ||
| Low freq. | 4 | 4 | 2 | ||
|
| |||||
| B32 | TT | 93 | 99 | 98 | 0.01 |
| CT | 7 | 1 | 2 | ||
|
| |||||
| B33 | TT | 98 | 94 | 93 | 0.003 |
| GT or GG | 2 | 6 | 7 | ||
|
| |||||
| B34 | AA | 80 | 54 | 57 | 0.02 |
| AG | 20 | 46 | 43 | ||
|
| |||||
| B35 | GG | 98 | 94 | 94 | 0.003 |
| AG or AA | 2 | 6 | 6 | ||
|
| |||||
| B00 | AA | 99 | 98 | 98 | 0.001 |
| AG | 1 | 2 | 2 | ||
|
| |||||
| B36 | CC | 98 | 92 | 89 | 0.01 |
| CT | 2 | 8 | 11 | ||
|
| |||||
| B11 | CC:CC | 1 | 72 | 78 | 0.24 |
| CC:TT | 99 | 28 | 22 | ||
|
| |||||
| B37 | GG | 65 | 29 | 31 | 0.07 |
| GT | 35 | 52 | 51 | ||
| TT | 0 | 19 | 18 | ||
|
| |||||
| B38 | CC | 70 | 42 | 38 | 0.05 |
| CT | 30 | 42 | 42 | ||
| TT | 0 | 15 | 19 | ||
|
| |||||
| B6 | CCGT:CCGT | 87 | 69 | 62 | 0.02 |
| CCGT:TTAC | 8 | 22 | 28 | ||
| Low freq. | 4 | 8 | 11 | ||
|
| |||||
| B39 | AA | 46 | 20 | 16 | 0.09 |
| AC | 54 | 50 | 50 | ||
| CC | 0 | 31 | 34 | ||
|
| |||||
| B40 | GG | 65 | 38 | 36 | 0.04 |
| AG | 34 | 50 | 51 | ||
| AA | 1 | 12 | 13 | ||
|
| |||||
| B41 | AA | 98 | 96 | 94 | 0.003 |
| AG | 2 | 4 | 6 | ||
|
| |||||
| B12 | GG:GG | 48 | 46 | 43 | 0.02 |
| GG:AA | 41 | 40 | 41 | ||
| AA:AA | 1 | 12 | 13 | ||
| Low freq. | 9 | 3 | 3 | ||
|
| |||||
| B42 | GG | 86 | 77 | 77 | 0.005 |
| GA | 14 | 23 | 23 | ||
|
| |||||
| B43* | GG | 0 | 100 | 100 | 0.52 |
| GA or AA | 100 | 0 | 0 | ||
|
| |||||
| B44 | AA | 65 | 32 | 34 | 0.05 |
| AC | 33 | 52 | 47 | ||
| CC | 1 | 17 | 19 | ||
|
| |||||
| B45 | AA | 86 | 74 | 73 | 0.01 |
| AG | 14 | 26 | 27 | ||
|
| |||||
| B46 | TT | 5 | 80 | 85 | 0.24 |
| TG | 95 | 20 | 15 | ||
|
| |||||
| B47 | TT | 95 | 95 | 94 | 0.0003 |
| TC or CC | 5 | 5 | 6 | ||
|
| |||||
| B48 | TT | 51 | 25 | 24 | 0.06 |
| CT | 50 | 50 | 52 | ||
| CC | 0 | 25 | 24 | ||
The two LD blocks that demonstrated weaker evidence of association when considered individually contributed minor alleles to pattern I with some probability: B28*, AA (38% chance) or AG (H=0.25); B31* CT or TT (6% chance) (H=0.03). Values of H above 0.05 might be considered notable, while lower values indicate that the groups differ only slightly in genotypic frequency. However, it might be noted that SNPs with low frequency minor alleles can vary in frequency of the minor allele e.g. 3-fold and still have a low H-value.
Other LD blocks, not providing evidence of association when considered individually, also contributed minor alleles to pattern I: B17 carried TG, while II & III carried TT almost exclusively (H=0.42); B3 carried ACGCA:GGTAG – or else diverse minor diplotypes, while II & III often carried ACGCA:ACGCA (H=0.10); B11 carried CC:TT, while II & III often carried CC:CC (H=0.24); and, B46 usually carried usually TG, while II & III usually carried TT (H=0.46). This extends the pattern of association of minor alleles from intron 2 to intron 48 as representing a subset of PD.
Finally, diverse low frequency diplotypes were more likely for B7 (10%; 5′ near gene, intron 4, intron 7) (H=0.03), B1 (16%; introns 30, 31, & 32, exon 34, introns 36 & 47, exon 49, intron 49) (H=0.06), and B12 (9%; exon 43, 3′ near gene) (H=0.02). Therefore, pattern I, taking the broadest definition, extends from the 5′ near gene region to the 3′ near gene region.
Pattern II
Unaffected. Minor alleles had low frequency. Four case subjects unexpectedly matched this low risk pattern with respect to LRRK2. Thus, PD was possible, if infrequent, when neither high-risk pattern for LRRK2 was present.
Pattern III
This typology also represents sporadic PD at age 60 and older. However, it does not follow the pattern of minor alleles found together for pattern I, and was more diverse. Minor alleles were slightly more likely for LD blocks not part of pattern I: B13, B16, B18, B8, B19, B20, B21, B22, B9, B26, B29, B33, B35, B00, B36, B38, B6, B40, B41, B42, B44, B45, and B47. Again, this pattern involved essentially the whole gene. Curiously, minor genotype frequencies at B19, B29, B33, B35 and B41 were essentially identical – higher for III than for I or II, suggesting that they might be found together for a small subset of cases. Both affected patterns had some chance of carrying minor alleles at B31* – this being the only point of overlap between the relatively distinct pattern found for I and the less distinct pattern of low frequency alleles found for III.
Resemblance of individuals to the patterns
This data analytic approach does not force individuals into discrete groups. Instead, individuals divide membership among model-based idealized groups, essentially stereotypes, here labeled, I, II or III, depending on the degree of resemblance. Subjects who match a particular group have a membership score of one in that group, and scores of zero in the other groups. Other subjects have positive scores in two or three groups, summing to one.
Here, the size of group I was 120.044, summing the membership of subjects in I – clearly smaller than the number of case subjects. The size of group II was 242.766, less than the number of control subjects – indicating that some control subjects carry risk factors for PD. Group III was larger than group I, size 187.19 – the sum of I and III being larger than the number of case subjects.
These model-based groups exactly matched many subjects: cases – 46 (17% of all cases), 4, 137; controls – 0, 178, 0. Most (94%) subjects resembled (> 50% match) one of these patterns: cases – 91 (33% of all cases), 4, 178; controls – 27, 250, 0. Each case carrying p.G2019S had membership in III (1.00, 0.47, 0.83, 1.00) and, possibly, membership in I (0.00, 0.53, 0.17, 0.00), suggesting that the pattern of minor alleles found for I was not required for causation when the mutation was present.
Multiple minor alleles found together for I
To verify that multiple minor alleles were found together for a subset of cases, we went back to the data. All 46 cases who matched I carried minor alleles for the core LD blocks B4* (“TGAG” or diverse minor alleles), B15* (AG), and B43* (AG or AA), whereas all 178 control subjects matching II (65% of all control subjects) and 137 cases matching III (50% of all cases) carried two copies of the common alleles for B4* (“CAGT”), B15* (GG), and B43* (GG).
The core set of minor alleles was usually found with minor alleles at B17 and B46. All 46 cases matching I carried TG or GG at B17, while the common TT genotype was usually found for controls matching II (166 of 178) and cases matching III (134 of 137). Almost all (45 of 46) cases matching I carried TG or GG at B46, whereas the common TT genotype was usually found for controls matching II (146 of 178) and cases matching III (118 of 137). Therefore, alterations in LRRK2 were often occurring together from intron 2 to intron 48 among a subset of 17% of the cases.
We then considered the 94% of cases who resembled (> 50% match) one of the patterns (Figure 1): Minor alleles were much more likely for all the SNPs comprising these mentioned LD blocks for the third of cases like pattern I than for other cases or the control subjects. This was most evident for each of the four loci that composed B4* (> 95% probability at each locus).
Figure 1. Minor allele frequencies.
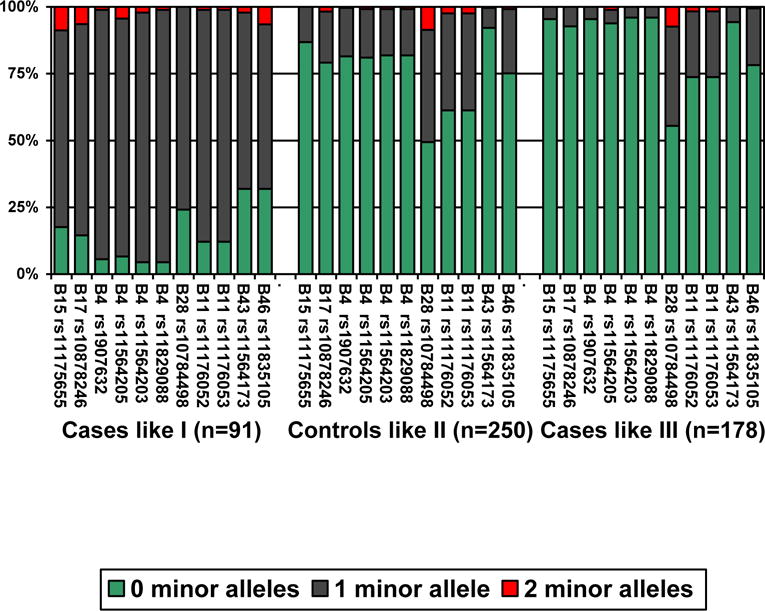
The frequency of minor alleles is shown for PD cases like (> 50% match, i.e. a membership score of 0.50 or higher) pattern I (n=91), control subjects like pattern II (n=250), and PD cases like pattern III (n=178).
Discussion
There is ample evidence that the LRRK2 gene is a determinant of PD in certain families and for the general population, involving the p.G2019S mutation2 and allelic associations of SNPS located within LRRK26. We sought to identify patterns of polymorphisms within the gene that more fully describe the genetic background of sporadic PD in relation to LRRK2. To accomplish this aim we identified LD blocks to simplify the data and allow identification of low frequency alleles. Information on genotype/diplotype for these blocks identified three patterns of risk represented by GoM groups (I, II, and III). GoM has been employed in a similar way to reduce complex data to a tractable number of patterns in previous medical and genetic studies – to define subtypes of disease and patterns of disease progression, endophenotypes, genetic risk sets for disease, and as a form of sibpair linkage analysis having apparently high statistical power11–26.
The three patterns distinguished between high (I, III) and low (II) risk with respect to LRRK2, also defining a distinct subset of minor alleles found together – distributed widely throughout the gene across functional domains (I). These stereotypic backgrounds effectively partitioned the subjects into three groups: 94% of the subjects resembled one of the patterns, and a third of the cases carried most of the minor alleles characteristic of pattern I.
To emphasize that a distinct subset of cases was characterized by a set of minor alleles found together distributed throughout the LRRK2 locus, the 46 cases who matched I, did, in fact, carry one or two copies of minor alleles at all six loci previously identified as associated with sporadic PD in the dataset, here, represented by B4*, B15*, and B43*. These cases usually carried additional minor alleles also identified as part of pattern I. None of the subjects matching patterns II (65% of all controls) or III (50% of all cases) carried minor alleles at these locations. Four of the six associated loci6 were located in one LD block (B4*), rs1907632_T (intron 11), rs11564205_G (intron 34), rs11564203_A (intron 39) and rs11829088_G (intron 39) (I.e. “TGAG” or other very minor alleles), that extends from intron 11 to intron 39 across several functional domains of dardarin, including LRR, Roc, COR and Kinase domains.
The minor alleles at high probability for pattern I, taking the broadest definition, were located in non-coding regions throughout the gene region from the 5′ near gene region to the 3′ near gene region, except for B31* located in exon 32. Thus, alterations within introns located throughout the gene may appear to alter LRRK2 function especially when they are found together possibly defining a distinct very high risk allele. This information might possibly be used in the future to identify persons at very high risk before the onset of symptoms, when preventive interventions might be undertaken. It might also motivate focused cell culture studies of LRRK2 function.
Moreover, when evaluated in this way, diverse low frequency diplotypes were more likely for I than for II or III at B7 (which provided no statistically significant evidence of association on its’ own) (10%; 3 SNPS extending from the 5′UTR to intron 7), B1 (16%; 7 SNPs extending from intron 30 to intron 49), and B12 (9%; 1 SNP located within the 3′ UTR). These low frequency variants were also scattered throughout the LRRK2 locus and most of them were located within intronic sequences, with the exception of rs1427263 and rs3761863 at B1 spanning functional domains such as Roc, COR, Kinase and WD40 domains. Thus, LRRK2 alterations were dispersed from the 5′ UTR to the 3′ UTR regions, involving essentially the whole gene.
Taking a weaker criterion, namely, at least 50% match to pattern I, 91 cases (33%) had a relatively distinct genetic background to PD involving minor alleles at the LRRK2 locus: > 95% of these cases carried minor alleles at all four loci that comprise LD block B4*. In contrast, none of the control subjects matched pattern I, although 27 had > 50% resemblance to pattern I and might, possibly, be at elevated risk for PD.
Pattern III representing the majority of cases had only slight elevations in the frequencies of minor alleles at other locations. Many cases matched (n=137) or resembled (n=178) this pattern. None of the control subjects matched or resembled pattern III. Possibly, pattern III is a mixture of many patterns of vulnerability involving LRRK2. The only point of overlap between I and III was that both patterns involved the possible occurrence of minor alleles at B31*. The stereotypic groups had the following probability of carrying a minor allele at B31*: 6% chance, 0%, 11%. Thus the minor allele was associated with high risk. However, eight control subjects (3%) carried B31* TC; three of whom resembled pattern I and might be considered to be at elevated risk for PD, and five who had limited resemblance to I and/or III having membership scores of from 0.33 to 0.41, and might be considered to be at lesser risk.
The conclusion that we draw is that a well-defined subset of PD occurring at ages 60 and older in populations with European ancestries has a pattern of multiple minor alleles found together. This information might be useful to define risk for presently healthy individuals. Whether these findings apply to other populations is an open question. None of the six SNPs included in a core set of matches to pattern I (B15*, B4*, B43*)6 would be useful when investigating Asian populations (Table 4); therefore, the investigated set of SNPs are not relevant to all other populations.
Table 4. Core SNP frequencies in diverse populations.
Core SNP frequencies in diverse populations. Analysis performed by Haploview 4.1 software (http://www.broad.mit.edu/haploview/haploview) with HapMap data http://www.hapmap.org/. YRI: Yoruba in Ibadan, Nigeria; JPT: Japanese in Tokyo, Japan; CHB: Han Chinese in Beijing, China; CEU: CEPH (Utah residents with ancestry from northern and western Europe).
| CEU | SNP | Position | ObsHET | PredHET | HWpval | MAF | Alleles |
|---|---|---|---|---|---|---|---|
| rs11175655 | 38909994 | 0.183 | 0.193 | 1 | 0.108 | G:A | |
| rs1907632 | 38936769 | 0.233 | 0.231 | 1 | 0.133 | G:A | |
| rs11564205 | 39000276 | 0.233 | 0.231 | 1 | 0.133 | A:G | |
| rs11564203 | 39010848 | 0.233 | 0.231 | 1 | 0.133 | G:A | |
| rs11829088 | 39014046 | 0.233 | 0.231 | 1 | 0.133 | T:G | |
| rs11564173 | 39036738 | 0.15 | 0.167 | 0.79 | 0.092 | G:A | |
| YRB | SNP | Position | ObsHET | PredHET | HWpval | MAF | Alleles |
| rs11175655 | 38909994 | 0.117 | 0.139 | 0.55 | 0.075 | G:A | |
| rs1907632 | 38936769 | 0.217 | 0.219 | 1 | 0.125 | G:A | |
| rs11564205 | 39000276 | 0.333 | 0.339 | 1 | 0.217 | A:G | |
| rs11564203 | 39010848 | 0.317 | 0.289 | 0.87 | 0.175 | G:A | |
| rs11829088 | 39014046 | 0.333 | 0.32 | 1 | 0.2 | T:G | |
| rs11564173 | 39036738 | 0.333 | 0.299 | 0.75 | 0.183 | G:A | |
| CHB-JPT | SNP | Position | ObsHET | PredHET | HWpval | MAF | Alleles |
| rs11175655 | 38909994 | 0 | 0 | 0 | 0 | G:G | |
| rs1907632 | 38936769 | 0.011 | 0.011 | 1 | 0.006 | G:A | |
| rs11564205 | 39000276 | 0.011 | 0.011 | 1 | 0.006 | A:G | |
| rs11564203 | 39010848 | 0.011 | 0.011 | 1 | 0.006 | G:A | |
| rs11829088 | 39014046 | 0.011 | 0.011 | 1 | 0.006 | T:G | |
| rs11564173 | 39036738 | 0 | 0 | 0 | 0 | G:G |
Mutations were not a major background to sporadic PD (< 5%). The four case subjects who carried p.G2019S resembled III more than I, suggesting that the pattern of multiple minor alleles found for I was not needed for the mutation to be penetrant. The phenotypic variability, and incomplete penetrance, found in some p.G2019S carriers may depend on specific alterations found for LRRK2 and contributions of interacting proteins. Very low frequency alleles, mostly found in flanking intronic regions, played only a small role.
One limitation of many genetic studies is that controls subjects are drawn from persons who are not yet affected rather than persons established to be at low risk. Here, 10% of the control subjects who resembled I may not have displayed any clinical features because of their age at the sample collection, or the absence of other important risk factors. The data analytic approach taken here tends to minimize the problem of control subjects at high-risk when identifying the genetic background relevant to disease.
No significant association between disease and common variability in LRRK2 has been previously reported in samples of European ancestry27–29; however, these data suggest that LRRK2 variations may contribute to the risk for sporadic PD in the North American population and that this contribution is triggered, mainly, by multiple low frequency minor alleles scattered throughout the LRRK2 locus. One speculation is that low frequency alleles as a class are less robust compared to the more common alleles. These results are cautionary suggesting that information on low frequency alleles should not be ignored in data analysis, e.g. they can be grouped together, that stringent p-values in genome-wide studies may ignor what might later turn out to be important risk factors, and that where possible the use of LD and higher dimensional data analysis may be needed to establish a pattern(s) of risk.
These findings indicate the importance of specific multiple minor alleles within the LRRK2 gene as a background to perhaps one-third of sporadic PD occurring at ages 60 and older, and that, a second pattern of risk involving minor alleles at alternate loci might, in part, be a background to sporadic PD among the majority of cases. However, further analyses in the LRRK2 gene and additional molecular approaches – such as gene-gene interactions and gene-environment-interactions – are probably necessary in order to assess the role of minor alleles within the LRRK2 locus in the idiopathic PD and to gain molecular insights into the biochemical pathway that underlies this complex disorder.
Acknowledgments
All samples used here were from the National Institute of Neurological Disorders and Stroke– supported Neurogenetics Repository hosted by the Coriell Institute for Research (Camden, NJ; http://ccr.coriell.org/Sections/Collections/NINDS/). This work was supported in part by the Intramural Research Program of the National Institute on Aging, National Institutes of Health, Department of Health and Human Services, project Z01 AG000957-06.
References
- 1.Kuopio AM, Marttila RJ, Helenius H, Rinne UK. Changing epidemiology of Parkinson’s disease in southwestern Finland. Neurology. 1999;52:302–308. doi: 10.1212/wnl.52.2.302. [DOI] [PubMed] [Google Scholar]
- 2.Healy DG, Falchi M, O’Sullivan SS, Bonifati V, Durr A, Bressman S, Brice A, Aasly J, Zabetian CP, Goldwurm S, Ferreira JJ, Tolosa E, Kay DM, Klein C, Williams DR, Marras C, Lang AE, Wszolek ZK, Berciano J, Schapira AH, Lynch T, Bhatia KP, Gasser T, Lees AJ, Wood NW, International LRRK2 Consortium Phenotype, genotype, and worldwide genetic penetrance of LRRK2-associated Parkinson’s disease: a case-control study. Lancet Neurol. 2008 Jul;7(7):583–90. doi: 10.1016/S1474-4422(08)70117-0. Epub 2008 Jun 6. [DOI] [PMC free article] [PubMed] [Google Scholar]
- 3.Marín I, van Egmond WN, van Haastert PJ. The Roco protein family: a functional perspective. FASEB J. 2008 Sep;22(9):3103–10. doi: 10.1096/fj.08-111310. Epub 2008 Jun 3. [DOI] [PubMed] [Google Scholar]
- 4.Fung HC, Scholz S, Matarin M, Simon-Sanchez J, Hernandez D, Britton A, Gibbs JR, Langefeld C, Stiegert ML, Schymick J, Okun MS, Mandel RJ, Fernandez HH, Foote KD, Rodriguez RL, Peckham E, De Vrieze FW, Gwinn-Hardy K, Hardy JA, Singleton A. Genome-wide genotyping in Parkinson’s disease and neurologically normal controls: first stage analysis and public release of data. Lancet Neurol. 2006b;5:911–916. doi: 10.1016/S1474-4422(06)70578-6. [DOI] [PubMed] [Google Scholar]
- 5.Falush D, Stephens M, Pritchard JK. Inference of population structure using multilocus genotype data: linked loci and correlated allele frequencies. Genetics. 2003;164:1567–87. doi: 10.1093/genetics/164.4.1567. [DOI] [PMC free article] [PubMed] [Google Scholar]
- 6.Paisan-Ruiz C, Nath P, Washecka N, Gibbs JR, Singleton AB. Comprehensive analysis of LRRK2 in publicly available Parkinson’s disease cases and neurologically normal controls. Hum Mutation. 2008;0:1–6. doi: 10.1002/humu.20668. [DOI] [PubMed] [Google Scholar]
- 7.Woodbury MA, Clive J. Clinical pure types as a fuzzy partition. J Cybernetics. 1974;4:111–121. [Google Scholar]
- 8.Woodbury MA, Clive J, Garson A. Mathematical Typology: A Grade of Membership Technique for Obtaining Disease Definition. Comput Biomed Res. 1978;11:277–298. doi: 10.1016/0010-4809(78)90012-5. [DOI] [PubMed] [Google Scholar]
- 9.Clive J, Woodbury MA, Siegler IC. Fuzzy and crisp set-theoretic-based classification of health and disease. A qualitative and quantitative comparison. J Med Syst. 1983;7:317–332. doi: 10.1007/BF01080688. [DOI] [PubMed] [Google Scholar]
- 10.Woodbury MA, Manton KG, Tolley DH. A general model for statistical analysis using fuzzy sets: sufficient conditions for identifiability and statistical properties. Information Sciences. 1994;1:149–180. [Google Scholar]
- 11.Corder EH, Woodbury MA, Field LL. Grade-of-Membership sibpair linkage analysis maps the IDDM11 locus to chromosome 14q24.3-q31: A pattern recognition approach to linkage. Ann Hum Genet. 2001;65:387–94. doi: 10.1017/S0003480001008685. [DOI] [PubMed] [Google Scholar]
- 12.Corder EH, Woodbury MA. Genetic heterogeneity in Alzheimer’s disease: A grade of membership analysis. Genet Epidemiol. 1993;10:495–499. doi: 10.1002/gepi.1370100628. [DOI] [PubMed] [Google Scholar]
- 13.Corder EH, Woodbury MA, Volkmann I, Madsen DK, Bogdanovic N, Winblad B. Density profiles of Alzheimer disease regional brain pathology for the Huddinge Brain Bank: pattern recognition emulates and expands upon Braak staging. Exp Gerontol. 2000;35:851–864. doi: 10.1016/s0531-5565(00)00147-9. [DOI] [PubMed] [Google Scholar]
- 14.Iivonen S, Corder E, Lehtovirta M, Helisalmi S, Mannermaa A, Vepsäläinen S, Hänninen T, Soininen H, Hiltunen M. Polymorphisms in the CYP19 gene confer increased risk for Alzheimer’s disease. Neurology. 2004;62:1170–1176. doi: 10.1212/01.wnl.0000118208.16939.60. [DOI] [PubMed] [Google Scholar]
- 15.Helisalmi S, Hiltunen M, Vepsäläinen S, Iivonen S, Corder E, Lehtovirta M, Mannermaa A, Koivisto AM, Soininen H. Genetic variation in apolipoprotein D and Alzheimer’s disease. J Neurol. 2004;251:951–957. doi: 10.1007/s00415-004-0470-8. [DOI] [PubMed] [Google Scholar]
- 16.Hallmayer JF, Kalaydjieva L, Badcock J, Dragovic M, Howell S, Michie PT, Rock D, Vile D, Williams R, Corder EH, Hollingsworth K, Jablensky Genetic evidence for a distinct subtype of schizophrenia characterized by pervasive cognitive deficit. Am J Hum Genet. 2005;77:468–476. doi: 10.1086/432816. [DOI] [PMC free article] [PubMed] [Google Scholar]
- 17.Corder EH, Ervin JF, Falls E, Szymanski MH, Schmechel DE, Hulette CM. Cardiovascular damage in Alzheimer Disease: Autopsy findings from the Bryan ADRC. J Biomed Biotechnol. 2005;2005:189–197. doi: 10.1155/JBB.2005.189. [DOI] [PMC free article] [PubMed] [Google Scholar]
- 18.Corder EH, Huang R, Cathcart HM, Lanham IS, Parker GR, Cheng D, Smith S, Poduslo SE. Membership in genetic groups predicts Alzheimer’s Disease. Rejuvenation Res. 2006;9:89–93. doi: 10.1089/rej.2006.9.89. [DOI] [PubMed] [Google Scholar]; Corder EH, Hefler LA. Multilocus genotypes spanning estrogen metabolism associated with breast cancer and fibroadenoma. Rejuvenation Res. 2006;9:56–60. doi: 10.1089/rej.2006.9.56. [DOI] [PubMed] [Google Scholar]
- 19.Corder EH, Mellick GD. Parkinson’s disease in relation to pesticide exposure and nuclear encoded mitochondrial complex I gene variants. J Biomed Biotechnol. 2006;2006(3):27601. doi: 10.1155/JBB/2006/27601. [DOI] [PMC free article] [PubMed] [Google Scholar]
- 20.Licastro F, Porcellini E, Caruso C, Lio D, Corder EH. Genetic risk profiles for Alzheimer’s disease: Integration of APOE genotype and variants that up-regulate inflammation. Neurobiol Aging. 2007;28:1637–43. doi: 10.1016/j.neurobiolaging.2006.07.007. Epub 2006 Aug 22. [DOI] [PubMed] [Google Scholar]
- 21.Corder EH, Beaumont H. Susceptibility groups for Alzheimer’s disease (OPTIMA cohort): Integration of gene variants and biochemical factors. Mech Ageing Dev. 2007;128:76–82. doi: 10.1016/j.mad.2006.11.014. [Epub 2006 Nov 20] [DOI] [PubMed] [Google Scholar]
- 22.Corder EH, Galeazzi L, Franceschi C, Cossarizza A, Paganelli R, Pinti M, Mussini C, Borghi V, Pinter E, De Cristofaro R, Galeazzi R, Perini M, Aiuti F, Giunta S. Differential course of HIV-1 infection and apolipoprotein E polymorphism. Cent Eur J Med. 2007;4:404–410. [Google Scholar]
- 23.Licastro F, Chiapelli M, Caldarera CM, Caruso C, Lio D, Corder EH. Acute myocardial infarction and pro-inflammatory gene variants. Ann N Y Acad Sci. 2007;1119:227–242. doi: 10.1196/annals.1404.004. [DOI] [PubMed] [Google Scholar]
- 24.Corder EH, Blennow K, Prince JA. Genetic susceptibility sets for Alzheimer’s disease identified from diverse candidate loci. Rejuvenation Res. 2008;11(3):667–79. doi: 10.1089/rej.2008.0742. [DOI] [PubMed] [Google Scholar]
- 25.Corder E, Pirskanen M, Hiltunen M, Helisalmi S, Mannermaa A, Koivisti A, Soininen H, Lehtovirta M, Hartikainen P, Ropponen K, Pirinen R, Böhm J, Alafuzoff I. Alzheimer disease and vascular dementia have distinct genetic profiles for APOE, A2M, & IL-1α. New Trends in Alzheimer and Parkinson Disorders; 8th International Conference on Alzheimer’s and Parkinson’s Diseases AD/PD; March 14–18, 2007; Salzburg, Austria. Medimond Press; 2008. pp. 13–17. [Google Scholar]
- 26.Golanska E, Hulas-Bigoszewska K, Sieruta M, Zawlik I, Sobow T, Witusik M, Styczynska M, Peplonska B, Barcikowska M, Rieske P, Liberski PP, Corder EH. Earlier onset of AD: higher density of risk alleles within PRNP, PRND, CYP46 & APOE. Journal of Alzheimer’s Disease. doi: 10.3233/JAD-2009-1055. In press. [DOI] [PubMed] [Google Scholar]
- 27.Biskup S, Mueller JC, Sharma M, Lichtner P, Zimprich A, Berg D, Wullner U, Illig T, Meitinger T, Gasser T. Common variants of LRRK2 are not associated with sporadic Parkinson’s disease. Ann Neurol. 2005;58:905–908. doi: 10.1002/ana.20664. [DOI] [PubMed] [Google Scholar]
- 28.Paisán-Ruíz C, Lang AE, Kawarai T, Sato C, Salehi-Rad S, Fisman GK, Al-Khairallah T, St George-Hyslop P, Singleton A, Rogaeva E. LRRK2 gene in Parkinson disease: mutation analysis and case control association study. Neurology. 2005;65:696–700. doi: 10.1212/01.wnl.0000167552.79769.b3. [DOI] [PubMed] [Google Scholar]
- 29.Paisán-Ruíz C, Evans EW, Jain S, Xiromerisiou G, Gibbs JR, Eerola J, Gourbali V, Hellstrom O, Duckworth J, Papadimitriou A, Tienari PJ, Skipper L, Shen H, Chua E, Bonnard C, Kolatkar P, Tan LC, Jamora RD, Puvan K, Puong KY, Zhao Y, Pavanni R, Wong MC, Yuen Y, Farrer M, Liu JJ, Tan EK. Analysis of LRRK2 functional domains in nondominant Parkinson disease. Neurology. 2005;65:1319–1321. doi: 10.1212/01.wnl.0000180517.70572.37. [DOI] [PubMed] [Google Scholar]