

Summary
Recent studies in human populations and mouse models reveal notable congruences in gut microbial taxa whose abundances are partly regulated by host genotype. Host genes associating with these taxa are related to diet sensing, metabolism, and immunity. These broad patterns are further validated in similar studies of non-mammalian microbiomes. The next generation of genome-wide association studies will expand the size of the datasets and refine the microbial phenotypes to fully capture these intriguing signatures of host-microbiome co-evolution.
Introduction
Microbes coat the surfaces of the human body in highly adapted microbiomes. The vast majority of human-associated microbial cells are bacterial, with archaeal and eukaryotic cells also present in lower numbers. Together they reach their highest biomass in the distal gut. These microbial communities vary in composition across the body depending on niches defined physically, chemically, and immunologically. Although a handful of animal species have been reared germfree under highly artificial axenic conditions, germfree animals are physiologically abnormal in several fundamental ways (1). Human biology and health assume the presence of a “healthy” microbiome, one whose interactions with its host are generally beneficial.
The gut microbiome is said to encode a second genome, and its functions expand the host’s physiological potential. In the gut, microbes extend digestive capabilities, prime the immune system, produce vitamins, degrade xenobiotics and resist colonization by pathogens. In principle, selection for host genotypes that promote a beneficial microbiome is possible. This might be expected for microbial functions (e.g., production of metabolites) or taxa that encode functions beneficial to fitness. When functions are restricted phylogenetically to specific taxa, such as methanogenesis to Euryarchaeota, associations between host alleles and specific taxonomic abundances could emerge. Conversely, functional gene counts or expression levels may associate with host genotypes when those functions are encoded across disparate taxa. There are examples of specific host genes whose variants are associated with different gut microbiomes, particularly for immune genes implicated in disease or secretor status (2, 3).
Genome-wide scans hold the promise of finding novel associations between host genes and the microbiome. A major concern with this approach in humans is that environmental factors, such as diet, can strongly and rapidly alter gut community composition and function (4). Nonetheless, recent studies highlight a select suite of taxa whose abundances are partially genetically influenced, as well as the human genes involved. Cross-study comparisons show some of the same taxa to be influenced by host genetics. Comparisons across species, including plants, reveal a common theme: Host genes associated with microbiome variation are involved in immune regulation and barrier defense. In human populations where the diet is unrestricted, genes related to diet preference and metabolism also emerge.
Heritability: Estimates of the strength of the host genetic effect on microbiota
Heritability is the proportion of variance in a host trait, such as height or BMI, measured across a population, that is explained by genetic rather than environmental effects. Note that heritability, a term widely used in genetics, is unrelated to the concept of inheritance (vertical transmission from parent to offspring). Height, for example, is highly heritable, meaning that variation in height across a population has strong genetic underpinnings. Components of the microbiome, such as taxa, can be quantified across subjects and treated as quantitative traits just like height or BMI in estimates of their heritability. Statistical models use the known genetic relatedness of twin pairs, or SNP genotype data that allows direct assessment of the genetic relatedness between individuals, to calculate the heritability (ranging from 0 to 1) for each microbial trait. For twins, the vertical transmission of microbes from parents is assumed to be equivalent and is thus controlled for.
For several decades twins served to address the question of whether host genetic variation is associated with the microbiome. Identical (monozygotic; MZ) twin pairs share 100% of the genes across their genome, whereas fraternal (dizygotic; DZ) twins share on average 50%. This, combined with the assumption that twins raised together experience similar environments, has formed the basis of twin heritability studies. For quantitative traits derived from the microbiome, such as bacterial relative abundances, greater similarity for MZ twins compared to DZ twins can be ascribed to shared genes, and by definition such bacteria are heritable. With a large enough population sample, the heritabilities of taxon abundances or other quantitative aspects of the microbiome, such as species richness, can be quantified.
Early studies in twins included small numbers of subjects and employed either culture or DNA fingerprinting-based techniques, and results suggested a genetic effect on the gross composition of the gut microbiome (5, 6). Later, studies using sequence-based techniques and larger cohorts reported a similar trend, albeit weaker. Turnbaugh et al. (2009) and Yatsunenko et al. (2012) sampled equivalent numbers of young-adult twin pairs (~50) from Missouri, and characterized their gut microbiomes by sequencing partial 16S rRNA genes amplified from fecal DNA (7, 8). Comparisons of microbiomes using the UniFrac metric in both studies showed the trend that MZ twin microbiomes were more similar than those of DZ twins, however this result was not statistically significant. Together these studies highlight a global impact of environmental factors on the composition of the microbiome. They also hinted at a host genetic effect on gut microbiome variation.
Accurate assessment of genetic effects requires larger sample sizes. The work of Goodrich and colleagues included an initial sample size of 416 twins pairs (9). The patterns from earlier twin studies were successfully replicated: MZ twin microbiomes were overall more similar than those of DZ twins, but with the increased sample size the difference reached statistical significance (9). More importantly, the larger sample size allowed heritability estimates for many individual taxa to be calculated.
The taxon with the highest heritability was Christensenellaceae, a family within the Firmicutes that forms a co-occurrence consortium with other heritable taxa including the dominant human gut methanogen Methanobrevibacter smithii. MZ twins were previously shown to have greater concordance for the carriage of M. smithii compared to DZ twins (10). Studies across mammalian species (11) and within bovine lines (12) have also shown that host genetics influence levels of gut methanogens. Previous work in humans has also associated methanogens and species richness with leanness (13), and Christensenellaceae with low serum triglyceride levels (14). Transplant experiments of feces from an obese human donor lacking this consortium to germfree mice were conducted with and without addition of Christensenella minuta. Addition of C. minuta resulted in reduced adiposity in the recipient mice (9), suggesting that host genes may influence phenotype via control of microbiome components.
Cross-study comparisons
Quantitative measures of the microbiome constitute a novel complex trait in human genome-wide association studies (GWAS). Microbiome data are costly and cumbersome to generate for large numbers of subjects. So far, compared to the accepted norm in the GWAS field, sample sizes for microbiome GWA studies have been small, and as a result findings may be spurious. Until sample sizes increase and meta-analyses are conducted, cross-validation is important to cement confidence in the results. Comparisons can be made for human and mouse studies that have (i) estimated taxon heritabilities directly, or (ii) identified taxa linked to host genes in genetic association analyses (human GWAS or quantitative trait locus (QTL) analysis in mice and plants). Cross-kingdom comparisons with similar studies in other genetic models are also possible. The advantage of model systems is that environmental conditions are controlled, however the extent of the genetic variation examined is less than the variation segregating in outbred populations (15) (Figure 1).
Figure 1. Environmental factors influence the gut microbiota and are controlled in model systems.
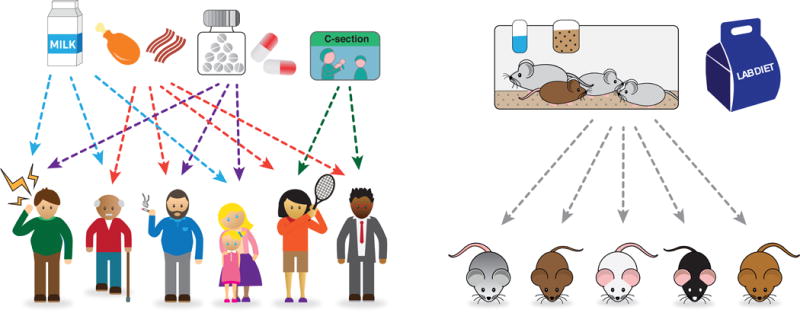
Many factors affect the human gut microbiome (Left), adding noise to quantitative measures. Mice are an attractive model for studying host genetic-microbiome interactions as environmental variation is more tightly controlled (Right).
Several of the same taxa have been estimated as heritable or linked to host genes in at least two human GWA or mouse QTL studies. The human-based studies include the UK Twins (9), the Human Microbiome Project (HMP) subjects (16), and the Hutterites (17); the mouse QTL studies include advanced intercrossed lines (18, 19), the Hybrid Mouse Diversity Panel (20), collaborative cross/diversity outbred mapping panels (21), and recombinant inbred strains (22). The majority of these heritable taxa belong to the phylum Firmicutes, while Bacteroidetes are generally not heritable. Technical issues preclude direct comparisons for some taxa, for instance, not all taxonomies presently include the Christensenellaceae. Also, heritability estimates tend to be higher on average for mice, most likely because environmental variability is controlled. Nevertheless, some of the same taxa are identified repeatedly across studies.
GWAS in humans
The HMP characterized microbiomes across body sites for 350 individuals using both 16S rRNA genes and metagenomes (23). Skin-derived metagenomes contained human DNA “contamination” that Blekhman and colleagues leveraged to obtain genotype data for 93 individuals (16). Without accounting for population structure, ethnicity or geographic stratification, a relationship emerged between host genotype and the overall composition of the fecal microbiome. This is likely due to differences in non-genetic factors (e.g. diet) that correlate with genetic ancestry, and this ancestry effect was again captured from an analysis that used HMP mitochondrial haplotype data (24). Gut microbiome differences between populations are often ascribed to differences in diet (8), but genetic differences may be more important than previously thought (and indeed, genetic differences may in part drive differences in dietary preferences).
Underpowered for GWAS, Blekhman et al. performed a pathway-based analysis and examined associations with genic SNPs. Significant enrichment in genes related to immunity were driven by nose, oral and skin associations. One notable association with stool microbiota emerged: Relative abundance of the genus Bifidobacterium was related to loci within the LCT gene region (discussed below).
Immune genes also came to the fore in a study of gut microbiota in the Hutterites (17). The North American Hutterites descended from a small European founder population in the late 1800s and reside in independent farming communities. Notably for microbiome research, they live and eat communally, which reduces the effect of inter-individual differences in diet on microbiome composition. Genetic analysis of the Hutterite fecal microbiota in two seasons revealed ~15 taxa heritable in winter, summer, or both (17). Interestingly, some taxa were only heritable in one season, suggesting diet dependence of gene-microbe associations. Most of the heritable bacteria identified in the Hutterites belong to the Proteobacteria and Firmicutes phyla. Additionally, the top GWAS hits for a member of the heritable family Clostridiaceae were enriched near genes related to immune processes, and top hits for several taxa, including Bifidobacterium, were enriched near olfactory receptor genes, leading us to speculate about the possibility of genetic differences in dietary preferences.
We have performed GWA on an expanded number (1,126 twin pairs) of UK twins. GWA studies of the microbiome are a challenge because they entail simultaneous testing for upwards of 1000 phenotypes versus millions of SNPs. Starting with a focus restricted to candidate gene sets and heritable microbiota, the number of tests was greatly reduced, and these yielded many significant results. As in the Blekhman study, Bifidobacterium was strongly associated with the LCT gene region (Figure 2). Other associations were with genes implicated in immunity and barrier function. When the study was broadened to assess associations genome-wide and microbiome-wide, none attained study-wide significance (this effort entailed 109 tests).
Figure 2. Lactase persistence and Bifidobacterium.
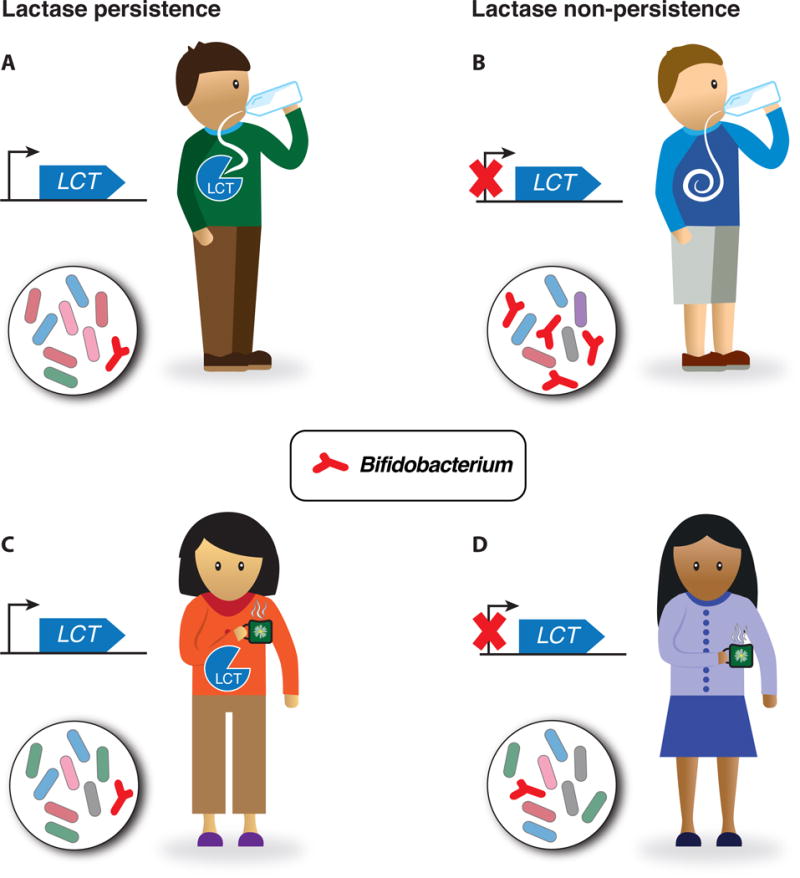
LCT gene loci are linked to the relative abundances of Bifidobacteria. The direction of the effect indicates that lactase-persisters harbor fewer Bifidobacteria compared to lactase-non-persisters, which suggests the following hypothesis: (A) Lactase-persisters who ingest lactose (shown as milk) digest it directly, reducing lactose availability to Bifidobacterium and its relative levels. (B) Non-persisters consuming dairy products allow for lactose utilization by Bifidobacterium, thereby promoting its abundance. When no lactose is consumed (shown as espresso), Bifidobacterium is low regardless of lactase persistence status (C and D).
QTL studies of gut microbiota in mice
QTL mapping in laboratory mice has the advantage that environmental conditions are tightly controlled (Figure 1). It should be noted that linkage intervals around identified QTL can be large and encompass many genes, hampering interpretation and comparisons across studies. The four murine gut microbiome GWAS conducted to date yielded a number of consistent results. First, four of 18 QTL identified by Benson et al. (18) were replicated in a follow-up study using a further generation of the same mouse breeding regime (19). In addition, several studies identified genes involved in immune function within linkage intervals. Both Benson et al. (18) and Org et al. (20) identified associations between members of the phylum Firmicutes and variants in or the expression of host genes involved in the Toll-like receptor and T-cell receptor pathways (IRAK4 and IRAK3, respectively). Additionally, a region encompassing IRAK4 was associated to Rikenellaceae by McKnite et al. (22), who further identified an association between Prevotellaceae abundance and TGFB3, a cytokine that modulates barrier function of the intestine. Host genes involved in barrier integrity have also been implicated in fly (25) and plant (26) microbiome GWAS.
GWAS of plant and fly microbiomes
As in mammals, plant-associated microbiomes are environmentally acquired and a selection process occurs when microbiota assemble on their surfaces (27–29). Several studies within a plant species have noted genotypic effects on microbiome composition (26, 27, 30–32). Horton and colleagues examined bacteria and fungi that compose the leaf endophyte microbiome in 196 accessions of Arabidopsis thaliana and identified QTL for both species richness and the abundances of individual taxa (26). Peiffer et al. examined the soil rhizosphere microbiota of 27 maize lines grown in five different fields in two distinct geographical regions and found that ~19% of the inter-line variation of species richness could be attributed to host genotype (31). Similarly, measures of alpha-diversity are heritable in the Hutterites (17). The mechanisms by which this occurs are unknown, but may include broad immune responses or differences in host physiology, such as variation in pH levels or gut length, surface area, or rate of peristalsis.
A subset of QTL identified in Horton et al. were associated with the abundances of multiple bacterial and fungal taxa (26). The top gene ontology (GO) categories associated with fungal and bacterial taxa were involved in host defense, and the top GO enrichment category for species richness was regulation of viral reproduction (26). Genes for cell wall components, also part of barrier defense, were also implicated in the GWAS (26). Thus, genetic control of species richness, and associations with immune genes, are common themes between mammal and plant studies.
Genes related to barrier defense and immunity were also detected in GWAS of the gut microbiomes of flies (Drosophila Genetic Reference Panel) raised germfree and then inoculated with five bacterial species (25, 33). Further analysis showed gene-bacterial interactions to influence the nutritional status of the fly. Overall, these results are broadly similar to those conducted in mice and humans.
Specific taxa related to host genotype across multiple studies
Bifidobacterium
The association between Bifidobacterium levels in stool and the LCT gene region was a strong signal in both the HMP and the TwinsUK datasets (16). Bifidobacterium is moderately heritable in both human studies and one mouse study (21). It is an important member of the gut microbiome and can utilize the primary milk sugar lactose. The host LCT gene encodes lactase, the enzyme that cleaves lactose, and its haplotypes are linked to lactase persistence and lactose tolerance in adults. In the UK twins, the haplotype of LCT associated with lactase non-persistence associates with higher levels of Bifidobacterium. A possible explanation for this pattern is presented in Figure 2. While the associations of Bifidobacterium abundance to the variant conferring lactase persistence did not reach genome-wide significance in the Hutterites, the same trend is apparent as in the UK twins: lactase non-persisters have higher levels of Bifidobacterium than persisters (P = 4 × 10⁻⁵). Additionally, the top genome-wide associations with Bifidobacterium in the Hutterites are enriched near genes encoding olfactory receptors (17).
Turicibacter and Peptostreptococcaceae
Both taxa are heritable across humans and mice, co-occur, and inhabit the small intestine. Turicibacter directly contacts host cells and is implicated in inflammation and cancer (34). Org et al. revealed associations between Turicibacter and tissue-specific eQTLs (20). Benson et al. (18) associated Turicibacter with a QTL on MMU7 that overlaps with the HCS1 QTL for susceptibility to murine hepatocellular carcinomas (35). How host genotype interacts with these taxa remains unclear.
Akkermansia
Akkermansia, a mucin-dwelling and degrading genus is enriched in lean individuals (14) and linked to improved glucose metabolism (36). In mice, Akkermansia associated with loci on chromosomes 2 and 7 (20). The locus on chromosome 7 was also detected as a QTL for triglyceride levels and gonadal fat, and lies near genes involved in glucose and insulin regulation. Davenport detected an association in Hutterites between Akkermansia and the UTR of PLD1, previously associated with obesity (17). In the TwinsUK dataset, Akkermansia associated with SIGLEC15, a sialic acid binding lectin. The outermost decoration of gut mucin is sialic acid, which Akkermansia can cleave. Both PLD1 and SIGLEC15 are expressed in villus tips in mice (37), suggesting a direct interaction with Akkermansia.
Improving GWAS in humans requires large sample sizes
Despite a sample size of ~3000 subjects, the TwinsUK study still fails to deliver study-wide significance in genome-wide and microbiome-wide association tests. While tests focused on a few candidate host genes or candidate microbes have produced encouraging results, genome-wide tests provide the best opportunity for new discoveries. While meta-analyses of human GWA studies have included pooled sample sizes exceeding 350,000 (38), such aggregation across multiple disparate microbiome studies will present its own set of challenges. But it appears inescapable that improved power for genome-wide tests requires increasing the sample size, and doing so with a unified sampling, sequencing and analysis pipeline will require sample processing infrastructures that include roboticized sample handling. Studies of skin and oral microbiota, which are more easily obtained compared to gut microbiota, may be the first to reach that mark.
The microbiome as a complex trait
What is the best microbiome “trait” for GWAS? The microbiome is a complex, high-dimensional trait that can be described in myriad ways. Specific functional interactions likely underlie host gene-microbe associations, and 16S rRNA gene data, which are used in GWAS now, are often a poor proxy for function. This problem is similar to modeling BMI – it is easy to obtain measurements in large numbers, but it is not the best measure for adiposity. Metagenomes provide functional gene counts, but are costly to generate. When predicted from 16S rRNA data, they are unreliable for genes that are variable among the genomes of strains, which may be the best phenotypes to model, along with their gene expression patterns. As sequencing and computational technologies continue to evolve, the goal of obtaining gene-specific and even strain-specific counts may soon be achievable.
To date gut microbiome GWAS have relied on stool samples. Fecal microbiota are a mix of mucosally-associated microbes, mostly from the colon, and lumenal microbes (39). At least half of the cells may be dead, and many are enriched in stool compared to farther up the GI tract. Small intestinal microbiota are rare in stool, and important stomach microbes such as H. pylori may be undetectable. Thus, small-scale interactions between the microbiome and mucosal surfaces that underlie genetic associations may not be detectable from stool data. Studies using alternative sampling techniques, such as ingested capsules that capture small intestinal biopsies, might reveal associations lost in stool.
Prospectus
Environmental factors are more influential than host genetics in shaping the overall composition of the gut microbiome. However, across host species, a handful of Bacteria and Archaea, with known importance for health, have emerged as heritable and associate with host genes related to immunity and diet. These interactions may be fairly sensitive to diet, making the gut microbiome a tractable therapeutic target. The field of microbiome GWAS is in its infancy - developments in sample acquisition, data generation and analysis will continue to reveal informative and biologically significant associations between taxa and host genetic variants. These associations, which underlie novel interactions yet to be described, are the signatures of an ongoing co-evolution between host and microbiome.
Acknowledgments
This work was funded by NIH RO1 DK093595, a David and Lucile Packard Foundation Fellowship (R.E.L.), The Cornell Center for Comparative Population Genomics (R.E.L., J.K.G.), a National Science Foundation Graduate Fellowship (J.K.G.)
References
- 1.Smith K, McCoy KD, Macpherson AJ. Semin Immunol. 2007;19:59–69. doi: 10.1016/j.smim.2006.10.002. [DOI] [PubMed] [Google Scholar]
- 2.Spor A, Koren O, Ley R. Nat Rev Microbiol. 2011;9:279–290. doi: 10.1038/nrmicro2540. [DOI] [PubMed] [Google Scholar]
- 3.Kostic AD, Howitt MR, Garrett WS. Genes Dev. 2013;27:701–718. doi: 10.1101/gad.212522.112. [DOI] [PMC free article] [PubMed] [Google Scholar]
- 4.David LA, et al. Nature. 2014;505:559–563. doi: 10.1038/nature12820. [DOI] [PMC free article] [PubMed] [Google Scholar]
- 5.Van de Merwe JP, Stegeman JH, Hazenberg MP. Antonie Van Leeuwenhoek. 1983;49:119–124. doi: 10.1007/BF00393669. [DOI] [PubMed] [Google Scholar]
- 6.Zoetendal EG, Akkermans ADL, Akkermans-van Vliet WM, de Visser JAGM, de Vos WM. Microb Ecol Health Dis. 2001;13:129–134. [Google Scholar]
- 7.Turnbaugh PJ, et al. Nature. 2009;457:480–484. doi: 10.1038/nature07540. [DOI] [PMC free article] [PubMed] [Google Scholar]
- 8.Yatsunenko T, et al. Nature. 2012;486:222–227. doi: 10.1038/nature11053. [DOI] [PMC free article] [PubMed] [Google Scholar]
- 9.Goodrich JK, et al. Cell. 2014;159:789–799. doi: 10.1016/j.cell.2014.09.053. [DOI] [PMC free article] [PubMed] [Google Scholar]
- 10.Hansen EE, et al. Proc Natl Acad Sci USA. 2011;108(Suppl 1):4599–4606. doi: 10.1073/pnas.1000071108. [DOI] [PMC free article] [PubMed] [Google Scholar]
- 11.Hackstein Johannes HP, van Alen TA. Evolution. 1996;50:559–572. doi: 10.1111/j.1558-5646.1996.tb03868.x. [DOI] [PubMed] [Google Scholar]
- 12.Roehe R, et al. PLoS Genet. 2016;12:e1005846. doi: 10.1371/journal.pgen.1005846. [DOI] [PMC free article] [PubMed] [Google Scholar]
- 13.Le Chatelier E, et al. Nature. 2013;500:541–546. doi: 10.1038/nature12506. [DOI] [PubMed] [Google Scholar]
- 14.Fu J, et al. Circ Res. 2015;117:817–824. doi: 10.1161/CIRCRESAHA.115.306807. [DOI] [PMC free article] [PubMed] [Google Scholar]
- 15.Davenport ER. Gut Microbes. 2016:00–00. doi: 10.1080/19490976.2016.1155022. [DOI] [PMC free article] [PubMed] [Google Scholar]
- 16.Blekhman R, et al. Genome Biol. 2015;16:191. doi: 10.1186/s13059-015-0759-1. [DOI] [PMC free article] [PubMed] [Google Scholar]
- 17.Davenport ER, et al. PLoS One. 2015;10:e0140301. doi: 10.1371/journal.pone.0140301. [DOI] [PMC free article] [PubMed] [Google Scholar]
- 18.Benson AK, et al. Proc Natl Acad Sci USA. 2010;107:18933–18938. doi: 10.1073/pnas.1007028107. [DOI] [PMC free article] [PubMed] [Google Scholar]
- 19.Leamy LJ, et al. Genome Biol. 2014;15:552. doi: 10.1186/s13059-014-0552-6. [DOI] [PMC free article] [PubMed] [Google Scholar]
- 20.Org E, et al. Genome Res. 2015;25:1558–1569. doi: 10.1101/gr.194118.115. [DOI] [PMC free article] [PubMed] [Google Scholar]
- 21.O’Connor A, Quizon PM, Albright JE, Lin FT, Bennett BJ. Mamm Genome. 2014;25:583–599. doi: 10.1007/s00335-014-9540-0. [DOI] [PMC free article] [PubMed] [Google Scholar]
- 22.McKnite AM, et al. PLoS One. 2012;7:e39191. doi: 10.1371/journal.pone.0039191. [DOI] [PMC free article] [PubMed] [Google Scholar]
- 23.HMP Consortium. Nature. 2012;486:207–214. [Google Scholar]
- 24.Ma J, et al. BMC Genomics. 2014;15:257. doi: 10.1186/1471-2164-15-257. [DOI] [PMC free article] [PubMed] [Google Scholar]
- 25.Chaston JM, Dobson AJ, Newell PD, Douglas AE. Appl Environ Microbiol. 2015;82:671–679. doi: 10.1128/AEM.03301-15. [DOI] [PMC free article] [PubMed] [Google Scholar]
- 26.Horton MW, et al. Nat Commun. 2014;5:5320. doi: 10.1038/ncomms6320. [DOI] [PMC free article] [PubMed] [Google Scholar]
- 27.Lundberg DS, et al. Nature. 2012;488:86–90. doi: 10.1038/nature11237. [DOI] [PMC free article] [PubMed] [Google Scholar]
- 28.Bulgarelli D, et al. Nature. 2012;488:91–95. doi: 10.1038/nature11336. [DOI] [PubMed] [Google Scholar]
- 29.Hacquard S, et al. Cell Host Microbe. 2015;17:603–616. doi: 10.1016/j.chom.2015.04.009. [DOI] [PubMed] [Google Scholar]
- 30.Bokulich NA, Thorngate JH, Richardson PM, Mills DA. Proc Natl Acad Sci USA. 2014;111:E139–48. doi: 10.1073/pnas.1317377110. [DOI] [PMC free article] [PubMed] [Google Scholar]
- 31.Peiffer JA, et al. Proc Natl Acad Sci USA. 2013;110:6548–6553. doi: 10.1073/pnas.1302837110. [DOI] [PMC free article] [PubMed] [Google Scholar]
- 32.Bodenhausen N, Bortfeld-Miller M, Ackermann M, Vorholt JA. PLoS Genet. 2014;10:e1004283. doi: 10.1371/journal.pgen.1004283. [DOI] [PMC free article] [PubMed] [Google Scholar]
- 33.Dobson AJ, et al. Nat Commun. 2015;6:6312. doi: 10.1038/ncomms7312. [DOI] [PMC free article] [PubMed] [Google Scholar]
- 34.Zackular JP, et al. MBio. 2013;4:e00692–13. doi: 10.1128/mBio.00692-13. [DOI] [PMC free article] [PubMed] [Google Scholar]
- 35.Gariboldi M, et al. Cancer Res. 1993;53:209–211. [PubMed] [Google Scholar]
- 36.Everard A, et al. Proc Natl Acad Sci USA. 2013;110:9066–9071. doi: 10.1073/pnas.1219451110. [DOI] [PMC free article] [PubMed] [Google Scholar]
- 37.Sommer F, Nookaew I, Sommer N, Fogelstrand P, Bäckhed F. Genome Biol. 2015;16:62. doi: 10.1186/s13059-015-0614-4. [DOI] [PMC free article] [PubMed] [Google Scholar]
- 38.Joshi PK, et al. Nature. 2015;523:459–462. doi: 10.1038/nature14618. [DOI] [PMC free article] [PubMed] [Google Scholar]
- 39.Eckburg PB, et al. Science. 2005;308:1635–1638. doi: 10.1126/science.1110591. [DOI] [PMC free article] [PubMed] [Google Scholar]