

Abstract
Background
No study has quantified trends in the prevalence of cardiovascular disease risk factors and cardiovascular health metrics among obese people in the United States in recent years.
Methods and Results
We examined the secular changes in cardiovascular health metrics and key cardiovascular disease risk factors among obese adults (aged ≥20 years) in the United States. We included 18 626 obese adults (body mass index ≥30) from the National Health and Nutrition Examination Survey (NHANES) III and NHANES 1999–2014. Among those obese adults, there were decreases in mean systolic blood pressure, diastolic blood pressure, and total cholesterol levels and increases in mean high‐density lipoprotein cholesterol levels and mean hemoglobin A1c levels. Prevalence of blood pressure health and lipid health remained stable during the period 1988–2014, whereas prevalence of blood glucose health decreased significantly during this period. Prevalence of freedom from cardiovascular disease risk factors remained stable at ≈15% among the adult obese population during the period 1988–2014, whereas prevalence of presence of all 3 risk factors increased from 16.4% to 22.4% during this period, commensurate with a decline in those with 1 to 2 risk factors (from 69.6% to 62.4%).
Conclusions
During the past 3 decades, blood pressure health and blood lipid health remained stable or improved, whereas blood glucose health deteriorated among adult obese population. This resulted in an overall decrease in cardiovascular health status among obese adults and greater risk of type 2 diabetes mellitus. The data argue for interventions targeted to those obese persons who are metabolically unhealthy to stem rising rates of diabetes mellitus.
Keywords: blood pressure, glucose, lipids, obesity, risk factor
Subject Categories: Obesity, Risk Factors, Epidemiology
Introduction
Obesity is associated with elevated risk of morbidity and mortality1 and has become an epidemic both in the United States and worldwide.2, 3 Obese persons who are free from cardiovascular disease (CVD) risk factors, such as hypertension, dyslipidemia, and hyperglycemia, are relatively insulin sensitive.4, 5, 6, 7, 8, 9 Epidemiological data indicate low risk of progression to diabetes mellitus and CVD outcomes among such people compared with obese persons with risk factors10, 11, 12, 13, 14 but increased risk of diabetes mellitus compared with healthy lean persons. These people experience low rates of incident diabetes mellitus and CVD, and their CVD risks are substantially reduced in comparison with either lean or obese persons who have the metabolic syndrome.10, 11, 12
Prevalence of obesity in the United States has leveled off in recent years.2, 15 It was reported that during the period 1960–2000, except for diabetes mellitus, prevalence of CVD risk factors declined in obese people in the United States16; however, no study has quantified trends in the prevalence of individual CVD risk factors together with cardiovascular health status among obese people in the United States in recent years. Using nationally representative data from National Health and Nutrition Examination Survey (NHANES) 1988–2014, we examined secular changes in cardiovascular health and CVD risk factors among obese adults (aged ≥20 years) during the past 3 decades in the United States.
Methods
National Health and Nutrition Examination Survey
NHANES is a serial cross‐sectional study involving nationally representative samples of the civilian noninstitutionalized US population. NHANES III was conducted during the period 1988–1994, and the continuous NHANES study has been conducted since 1999 with data released in 2‐year cycles. The survey is conducted by National Center for Health Statistics (NCHS) using a complex, stratified, multistage probability cluster design.17 The NCHS ethics review board approved all NHANES protocols before data collection, and all adult participants provided written informed consent.17 The participant response rate has consistently been ≈75% for interviews and ≈70% for examinations at mobile examination centers among adults (aged ≥20 years). This study was exempt from full board review by the institutional review boards at the University of Texas Medical Branch and the University of Alabama at Birmingham.
Race and ethnicity were self‐reported and classified as non‐Hispanic white, non‐Hispanic black, Mexican American, other Hispanic, and other. Standardized blood pressures were obtained by sphygmomanometer,18 and mean blood pressures from the last 3 measurements were used in this study. Blood lipids were measured enzymatically; hemoglobin A1c (HbA1c) was measured by high‐performance liquid chromatography. Detailed specimen collection and processing instructions are described in the NHANES Laboratory Procedures Manual.19 Obesity was defined according to body mass index (BMI; in kg/m2) status (BMI ≥30).
Cardiovascular Health Metrics
Cardiovascular health metrics included blood pressure, blood glucose, and lipid profile based on criteria modified from the American Heart Association (AHA)20 and the National Cholesterol Education Program Expert Panel on Detection, Evaluation, and Treatment of High Blood Cholesterol in Adults (Adult Treatment Panel III)21 and the American College of Cardiology and AHA guidelines expert panel.22 Abnormal blood pressure status included systolic blood pressure ≥130 mm Hg, diastolic blood pressure ≥85 mm Hg, or use of antihypertensive medication; blood glucose status included HbA1c ≥5.7% or use of antidiabetic medication; and blood lipids status included total cholesterol ≥240 mg/dL, high‐density lipoprotein (HDL) cholesterol <40 mg/dL in men and <50 mg/dL in women, or use of lipid‐lowering medications. Participants with blood pressure health, blood glucose health, and blood lipid health were free from the above corresponding risk factors, according to these metrics. We also assessed trends in overall cardiovascular health status (presence of all 3 risk factors, presence of 1 or 2 risk factors, and freedom from all 3 risk factors). Ideal cardiovascular health was defined by the strict definition of the AHA: Blood pressure measured as untreated systolic <120 mm Hg and diastolic <80, blood glucose measured as untreated HbA1c <5.7%, and blood lipids measured as untreated total cholesterol <200 mg/dL and HDL ≥60 mg/dL.20
Statistical Analysis
Data from NHANES 1988–2014 were used to determine secular trends in the prevalence of each CVD risk factors and cardiovascular health status in the United States during the past 3 decades. All analyses using NHANES data took into account differential probabilities of selection and the complex sample design and nonresponse and noncoverage by using sample weights and SAS (SAS Institute) survey analysis procedures, following NHANES analytic and reporting guidelines.23, 24 Standard errors were calculated using Taylor series linearization. Age‐adjusted values25 were adjusted by the direct method to the year 2010 census population using the age groups 20 to 39, 40 to 59, and ≥60 years. Regression models were used to assess linear trends in the prevalence of healthy obese persons among obese adults during the period 1988–2014. Statistical analyses were carried out with SAS for Windows version 9.4 (SAS Institute). A 2‐sided P<0.05 was determined to be statistically significant.
Results
Characteristics
The characteristics of participants from NHANES are provided in Table 1 for each of the sequential cross‐sectional surveys from 1988 to 2014. The study population over this time frame was composed of 18 626 obese adults. By way of illustration, the characteristics of obese participants from the most recent NHANES study, from 2011 to 2014, included a mean age of 47.2 years, mean systolic blood pressure of 124.4 mm Hg and diastolic blood pressure of 72.5 mm Hg, mean HbA1c of 5.9%, mean HDL cholesterol of 47.4 mg/dL, mean total cholesterol of 193.7 mg/dL, mean BMI of 36.0, and mean waist circumference of 114.8 cm. In examining trends in BMI and waist circumference in the analyses of participants with obesity, mean BMI was observed to significantly increase from 34.7 in 1988–1992 to 36.0 in 2011–2014 (Table 2), and waist circumference increased from 110.1 to 114.8 cm (Table 3).
Table 1.
The Characteristics of Participants From NHANES 1988–2014 (N=18 626)
| Participants | 1988–1992 | 1999–2002 | 2003–2006 | 2007–2010 | 2011–2014 |
|---|---|---|---|---|---|
| All | 4297 (100) | 2854 (100) | 3185 (100) | 4334 (100) | 3956 (100.0) |
| Aged 20–39 y | 1505 (37.5) | 939 (34.8) | 1084 (33.6) | 1309 (34.1) | 1240 (32.3) |
| Aged 40–59 y | 1468 (39.3) | 980 (42.1) | 1083 (44.7) | 1522 (40.2) | 1468 (41.3) |
| Aged ≥60 y | 1324 (23.2) | 935 (23.1) | 1018 (21.8) | 1503 (25.7) | 1248 (26.4) |
| Men | 1603 (41.7) | 1134 (42.6) | 1367 (46.1) | 1938 (46.6) | 1695 (45.4) |
| Women | 2694 (58.3) | 1720 (57.4) | 1818 (53.9) | 2396 (53.4) | 2261 (54.6) |
| Non‐Hispanic white | 1492 (72.1) | 1262 (69.1) | 1472 (69.5) | 1888 (66.4) | 1541 (63.8) |
| Non‐Hispanic black | 1434 (14.9) | 673 (13.8) | 877 (15.3) | 1027 (15.3) | 1184 (15.0) |
| Mexican American | 1224 (6.2) | 709 (7.3) | 662 (8.2) | 846 (9.7) | 576 (10.6) |
| Other | 147 (6.8) | 210 (9.8) | 174 (6.9) | 573 (8.7) | 655 (10.6) |
| Age, y | 47.3 (47.0–47.6) | 47.0 (46.7–47.3) | 47.1 (46.8–47.3) | 47.4 (47.2–47.6) | 47.2 (46.9–47.4) |
| Mean SBP, mm Hg | 126.1 (125.2–127.0) | 126.6 (125.5–127.7) | 125.7 (124.7–126.7) | 123.2 (122.4–123.9) | 124.4 (123.6–125.2) |
| Mean DBP, mm Hg | 76.6 (76.0–77.2) | 74.4 (73.4–75.3) | 72.5 (71.9–73.0) | 71.5 (70.6–72.4) | 72.5 (71.9–73.1) |
| HbA1c (%) | 5.7 (5.6–5.8) | 5.7 (5.7–5.7) | 5.7 (5.6–5.7) | 5.8 (5.8–5.9) | 5.9 (5.8–5.9) |
| HDL, mg/dL | 45.4 (44.7–46.2) | 46.0 (45.2–46.8) | 48.7 (48.0–49.3) | 46.4 (45.7–47.0) | 47.4 (46.8–48.1) |
| TC, mg/dL | 214.5 (212.7–216.3) | 206.7 (204.6–208.7) | 201.8 (200.0–203.5) | 196.9 (195.1–198.7) | 193.7 (192.3–195.1) |
| BMI, kg/m2 | 34.7 (34.4–35.1) | 35.5 (35.2–35.8) | 35.6 (35.3–35.8) | 35.7 (35.5–35.9) | 36.0 (35.7–36.3) |
| WC, cm | 110.1 (109.5–110.7) | 112.4 (111.6–113.1) | 113.3 (112.7–114.0) | 114.0 (113.4–114.7) | 114.8 (114.1–115.4) |
| On antihypertensive drugs (%) | 23.2 (21.1–25.4) | 27.1 (24.9–29.2) | 30.3 (28.4–32.2) | 33.2 (31.6–34.8) | 32.1 (30.3–33.9) |
| On antidiabetic drugs (%) | 8.0 (6.8–9.3) | 9.4 (8.4–10.5) | 7.8 (6.4–9.1) | 9.7 (8.6–10.8) | 14.3 (12.8–15.7) |
| On lipid‐lowering drugs (%) | 3.9 (3.0–4.8) | 11.5 (10.3–12.7) | 17.9 (16.4–19.4) | 21.0 (19.7–22.4) | 22.0 (19.8–24.2) |
Data are shown as n (weighted %), mean (95% CI), or proportion (95% CI). BMI indicates body mass index; HbA1c, hemoglobin A1c; HDL, high‐density lipoprotein cholesterol; DBP, diastolic blood pressure; NHANES, National Health and Nutrition Examination Survey; SBP, systolic blood pressure; TC, total cholesterol; WC, waist circumference.
Table 2.
Secular Trends in BMI in Obese Adults During NHANES 1988–2014 (n=18 626)
| Participants | 1988–1992 (n=4297) | 1999–2002 (n=2854) | 2003–2006 (n=3185) | 2007–2010 (n=4334) | 2011–2014 (n=3956) | P Valuea |
|---|---|---|---|---|---|---|
| All | 34.7 (34.4–35.1) | 35.5 (35.2–35.8) | 35.6 (35.3–35.8) | 35.7 (35.5–35.9) | 36.0 (35.7–36.3) | <0.001 |
| Aged 20–39 y | 35.1 (34.6–35.6) | 35.8 (35.4–36.3) | 35.7 (35.4–36.1) | 36.0 (35.6–36.5) | 36.5 (36.0–36.9) | <0.001 |
| Aged 40–59 y | 34.9 (34.4–35.4) | 35.8 (35.3–36.4) | 35.9 (35.4–36.4) | 35.8 (35.6–36.1) | 36.0 (35.6–36.4) | 0.055 |
| Aged ≥60 y | 34.0 (33.8–34.3) | 34.6 (34.3–35.0) | 34.8 (34.5–35.2) | 35.1 (34.8–35.4) | 35.3 (34.8–35.9) | <0.001 |
| Men | 33.9 (33.4–34.4) | 34.7 (34.3–35.2) | 34.7 (34.4–34.9) | 34.9 (34.7–35.1) | 35.1 (34.6–35.6) | 0.021 |
| Women | 35.4 (34.9–35.8) | 36.1 (35.8–36.5) | 36.3 (35.9–36.7) | 36.5 (36.3–36.8) | 36.8 (36.4–37.1) | <0.001 |
| Non‐Hispanic white | 34.7 (34.3–35.1) | 35.4 (35.1–35.7) | 35.4 (35.1–35.8) | 35.6 (35.3–35.9) | 36.0 (35.5–36.5) | <0.001 |
| Non‐Hispanic black | 35.8 (35.4–36.1) | 36.9 (36.3–37.4) | 36.8 (36.5–37.1) | 37.1 (36.6–37.6) | 37.1 (36.7–37.6) | 0.004 |
| Mexican American | 34.3 (34.0–34.6) | 34.9 (34.4–35.3) | 35.0 (34.6–35.3) | 35.0 (34.6–35.4) | 35.4 (35.1–35.7) | 0.002 |
BMI indicates body mass index; NHANES, National Health and Nutrition Examination Survey.
Data are shown as mean (95% CI). BMI is shown in kg/m2.
P value for trends, adjusted for age group, sex, and race/ethnicity, as appropriate.
Table 3.
Secular Trends in Waist Circumference in Obese Adults During NHANES 1988–2014 (n=17 661)
| Participants | 1988–1992 (n=4015) | 1999–2002 (n=2783) | 2003–2006 (n=3037) | 2007–2010 (n=4087) | 2011–2014 (n=3739) | P Valuea |
|---|---|---|---|---|---|---|
| All | 110.1 (109.5–110.7) | 112.4 (111.6–113.1) | 113.3 (112.7–114.0) | 114.0 (113.4–114.7) | 114.8 (114.1–115.4) | <0.001 |
| Aged 20–39 y | 108.1 (107.1–109.1) | 111.0 (110.1–112.0) | 111.7 (110.8–112.6) | 112.4 (111.3–113.5) | 113.9 (112.8–115.0) | <0.001 |
| Aged 40–59 y | 111.1 (110.3–112.0) | 113.0 (111.9–114.1) | 113.9 (112.8–114.9) | 114.7 (113.8–115.5) | 114.9 (113.9–115.9) | <0.001 |
| Aged ≥60 y | 111.4 (110.6–112.1) | 113.3 (112.5–114.1) | 114.9 (114.3–115.5) | 115.5 (114.6–116.3) | 115.7 (114.7–116.7) | <0.001 |
| Men | 113.2 (112.2–114.2) | 116.5 (115.3–117.6) | 116.4 (115.7–117.1) | 116.3 (115.5–117.1) | 117.1 (116.0–118.2) | 0.008 |
| Women | 107.9 (107.1–108.6) | 109.3 (108.5–110.2) | 110.8 (110.0–111.6) | 112.1 (111.2–112.9) | 112.8 (112.2–113.5) | <0.001 |
| Non‐Hispanic white | 110.6 (109.7–111.5) | 112.9 (112.0–113.8) | 114.1 (113.3–114.8) | 114.9 (114.2–115.6) | 115.7 (114.8–116.6) | <0.001 |
| Non‐Hispanic black | 110.1 (109.3–110.8) | 112.0 (110.9–113.2) | 112.8 (112.0–113.5) | 113.7 (112.5–114.9) | 114.6 (113.7–115.6) | <0.001 |
| Mexican American | 108.3 (107.7–108.9) | 109.5 (108.4–110.7) | 110.3 (109.0–111.5) | 111.1 (110.2–112.1) | 112.6 (111.5–113.8) | <0.001 |
NHANES indicates National Health and Nutrition Examination Survey.
Data are shown as mean (95% CI). Waist circumference is shown in centimeters.
P value for trends, adjusted for age group, sex, and race/ethnicity when appropriate.
Blood Pressure Health
Mean systolic blood pressure decreased from 126.1 mm Hg in 1988–1992 to 124.4 mm Hg in 2011–2014 (P for trend <0.001). The decrease was observed in all age groups, for both sexes, and in all racial and ethnic groups except for young adults (Table S1). Mean diastolic blood pressure also decreased from 76.6 to 72.5 mm Hg over the period 1988–2014 (Table S2). Prevalence of blood pressure health was stable during the 1988–2014 period and characterized just below 50% of the population (Table 4). In 2011–2014, 44.1% of men and 51.5% of women were below the threshold for the blood pressure risk factor. Prevalence of blood pressure health decreased as a function of age; >70% of young adults (aged 20–39 years) exhibited healthy blood pressure metrics, whereas only 20.4% of older adults (aged ≥60 years) did. Non‐Hispanic black participants had the lowest prevalence of blood pressure health, whereas Mexican American participants had the highest prevalence. For the prevalence of ideal blood pressure health (untreated systolic blood pressure <120 mm Hg and diastolic <80), we observed similar patterns, and the prevalence was stable, slightly above 30% (Table S3).
Table 4.
Secular Trends in Blood Pressure Health in Obese Adults During NHANES 1988–2014 (N=18 626)
| Participants | 1988–1992 (n=4297) | 1999–2002 (n=2854) | 2003–2006 (n=3185) | 2007–2010 (n=4334) | 2011–2014 (n=3956) | P Valuea |
|---|---|---|---|---|---|---|
| All | 49.8 (47.5–52.2) | 48.4 (45.7–51.0) | 49.2 (47.1–51.2) | 49.4 (47.3–51.5) | 48.1 (45.9–50.3) | 0.71 |
| Aged 20–39 y | 70.8 (66.4–75.3) | 73.0 (68.1–77.8) | 76.7 (73.0–80.3) | 74.4 (71.1–77.6) | 72.0 (68.7–75.3) | 0.96 |
| Aged 40–59 y | 44.1 (39.8–48.3) | 43.9 (41.0–46.8) | 43.2 (39.5–46.9) | 44.4 (41.5–47.3) | 43.4 (39.8–47.0) | 0.86 |
| Aged ≥60 y | 27.9 (24.4–31.4) | 19.3 (14.7–23.9) | 18.2 (15.8–20.7) | 20.6 (17.9–23.2) | 20.4 (17.0–23.9) | 0.64 |
| Men | 44.6 (39.6–49.6) | 45.2 (40.9–49.4) | 45.3 (42.4–48.1) | 45.7 (42.4–48.9) | 44.1 (40.8–47.4) | 0.62 |
| Women | 53.6 (51.2–56.0) | 50.7 (48.2–53.2) | 52.7 (50.1–55.2) | 52.8 (50.7–54.9) | 51.5 (48.6–54.3) | 0.98 |
| Non–Hispanic white | 49.2 (46.1–52.4) | 48.9 (45.5–52.3) | 49.8 (47.0–52.6) | 49.4 (46.1–52.7) | 48.1 (45.0–51.2) | 0.75 |
| Non‐Hispanic black | 42.8 (40.3–45.2) | 41.0 (37.7–44.3) | 41.6 (38.5–44.6) | 40.7 (37.5–43.9) | 39.7 (37.1–42.2) | 0.42 |
| Mexican American | 57.8 (54.0–61.5) | 55.2 (51.7–58.6) | 55.9 (51.0–60.7) | 54.9 (51.7–58.1) | 54.4 (50.9–58.0) | 0.91 |
NHANES indicates National Health and Nutrition Examination Survey.
Data are shown as prevalence percentage (95% CI). Blood pressure health: untreated systolic <130 mm Hg and diastolic <85 mm Hg. Prevalence was age‐adjusted by the direct method to the year 2010 census population using age groups 20–39, 40–59, and ≥60 years.
P value for trends, adjusted for age group, sex, and race/ethnicity, as appropriate.
Blood Glucose Health
Mean HbA1c increased from 5.7% in 1988–1992 to 5.9% in 2011–2014 (P for trend <0.001). All age, sex, and racial and ethnic groups showed increases except non‐Hispanic black participants (Table S4). Prevalence of blood glucose health declined from 67.0% to 56.2% during the period 1988–2010 (P<0.001) but leveled off at ≈57% during 2011–2014 (Table 5). In 2011–2014, men and women had similar prevalence of ideal glucose health (57.4% versus 57.1%), and the prevalence declined by age (P<0.001); non‐Hispanic white participants had the highest prevalence, at 62.6%, whereas non‐Hispanic black participants had the lowest prevalence, at 44.2%.
Table 5.
Secular Trends in Blood Glucose Health in Obese Adults During NHANES 1988–2014 (N=18 626)
| Participants | 1988–1992 (n=4297) | 1999–2002 (n=2854) | 2003–2006 (n=3185) | 2007–2010 (n=4334) | 2011–2014 (n=3956) | P Valuea |
|---|---|---|---|---|---|---|
| All | 67.0 (64.2–69.9) | 68.4 (66.2–70.7) | 66.7 (65.0–68.5) | 56.2 (54.2–58.1) | 57.3 (54.7–59.9) | <0.001 |
| Aged 20–39 y | 84.4 (80.5–88.4) | 87.3 (84.9–89.8) | 85.7 (83.3–88.1) | 78.6 (76.4–80.9) | 77.4 (74.2–80.7) | <0.001 |
| Aged 40–59 y | 63.5 (59.3–67.8) | 64.7 (60.2–69.2) | 63.8 (60.5–67.2) | 50.8 (47.4–54.1) | 54.6 (50.5–58.8) | <0.001 |
| Aged ≥60 y | 47.0 (43.5–50.5) | 46.6 (42.4–50.9) | 43.6 (40.1–47.1) | 31.7 (28.0–35.5) | 32.1 (28.1–36.1) | <0.001 |
| Men | 66.0 (61.5–70.6) | 67.4 (63.8–71.0) | 67.4 (64.6–70.1) | 55.0 (52.5–57.4) | 57.4 (53.9–61.0) | <0.001 |
| Women | 67.7 (65.2–70.3) | 69.3 (66.7–71.9) | 66.3 (63.8–68.7) | 57.2 (54.2–60.2) | 57.1 (54.7–59.5) | <0.001 |
| Non‐Hispanic white | 71.9 (68.4–75.5) | 71.6 (68.4–74.9) | 71.2 (69.3–73.1) | 60.6 (58.3–62.9) | 62.6 (59.1–66.1) | <0.001 |
| Non‐Hispanic black | 48.7 (45.4–52.0) | 56.2 (53.5–59.0) | 56.1 (53.0–59.2) | 46.1 (41.7–50.4) | 44.2 (40.9–47.6) | <0.001 |
| Mexican American | 57.6 (53.5–61.7) | 64.5 (60.5–68.4) | 55.8 (51.5–60.0) | 49.6 (44.5–54.7) | 50.4 (47.4–53.4) | <0.001 |
NHANES indicates National Health and Nutrition Examination Survey.
Data are shown as prevalence percentage (95% CI). Blood glucose health: untreated hemoglobin A1c <5.7%. Prevalence was age‐adjusted by the direct method to the year 2010 census population using age groups 20–39, 40–59, and ≥60 years.
P value for trends, adjusted for age group, sex, and race/ethnicity, as appropriate.
An increase in the prevalence of diabetes mellitus (self‐reported or HbA1c ≥6.5%) contributed to declining rates of blood glucose health. Diabetes prevalence increased from 11.3% to 19.0% during the 1988–2014 period (Table S5). The prevalence increased with aging. A significant increase was observed in all age groups, for both sexes, and in all racial and ethnic groups except for young adults (aged 20–39 years).
Blood Lipid Health
Mean blood total cholesterol in obese adults decreased markedly by 20.8 mg/dL, from 214.5 mg/dL in the period 1988–1992 to 193.7 mg/dL in 2011–2014 (P<0.001). All subgroups experienced substantial decrements in mean total cholesterol during 1988–2014 (Table S6). In contrast, mean HDL cholesterol increased from 45.4 to 47.4 mg/dL during 1988–2014 (P<0.001 for trend) (Table S7). Prevalence of blood lipid health status changed little during the period 1988–2014 (Table 6). In 2011–2014, men had higher prevalence of lipids health than women (38.0% versus 31.7%), and the non‐Hispanic black group was the racial/ethnic group with the highest prevalence of lipids health (33.7%). In all constituencies, the prevalence of lipids health declined as a function of age; however, the prevalence of ideal blood cholesterol health (untreated total cholesterol <200 mg/dL and HDL ≥60 mg/dL) increased from 1988 to 2006 (3.3–5.2%) and then leveled off during 2007–2014 (Table S8).
Table 6.
Secular Trends in Blood Lipid Health in Obese Adults During NHANES 1988–2014 (N=18 626)
| Participants | 1988–1992 (n=4297) | 1999–2002 (n=2854) | 2003–2006 (n=3185) | 2007–2010 (n=4334) | 2011–2014 (n=3956) | P Valuea |
|---|---|---|---|---|---|---|
| All | 29.8 (27.2–32.4) | 30.8 (28.4–33.2) | 37.1 (34.8–39.4) | 31.2 (29.2–33.2) | 34.6 (32.1–37.1) | 0.19 |
| Aged 20–39 y | 32.9 (28.0–37.7) | 33.2 (30.3–36.1) | 44.4 (40.5–48.2) | 36.0 (32.8–39.2) | 41.0 (36.8–45.2) | 0.04 |
| Aged 40–59 y | 28.1 (24.3–32.0) | 29.8 (25.4–34.1) | 33.8 (30.1–37.5) | 29.7 (26.0–33.3) | 33.6 (29.6–37.6) | 0.31 |
| Aged ≥60 y | 27.9 (23.6–32.2) | 28.8 (25.5–32.2) | 31.3 (28.3–34.4) | 26.6 (23.8–29.4) | 26.7 (23.1–30.4) | 0.18 |
| Men | 35.0 (30.6–39.3) | 32.2 (29.4–35.1) | 39.1 (36.2–42.0) | 33.3 (30.8–35.8) | 38.0 (34.7–41.3) | 0.17 |
| Women | 26.3 (23.6–29.0) | 29.9 (26.5–33.3) | 35.4 (31.9–38.9) | 29.4 (26.7–32.1) | 31.7 (28.8–34.5) | 0.46 |
| Non–Hispanic white | 27.9 (24.3–31.4) | 27.9 (24.8–31.0) | 35.5 (32.6–38.3) | 29.2 (26.6–31.9) | 33.3 (29.9–36.7) | 0.11 |
| Non‐Hispanic black | 35.8 (33.1–38.6) | 39.8 (35.4–44.3) | 46.9 (43.9–49.9) | 37.7 (34.8–40.6) | 39.6 (36.4–42.7) | 0.67 |
| Mexican American | 30.3 (26.4–34.2) | 34.1 (30.2–37.9) | 36.5 (31.7–41.4) | 32.5 (29.3–35.6) | 33.7 (30.1–37.2) | 0.79 |
NHANES indicates National Health and Nutrition Examination Survey.
Data are shown as prevalence percentage (95% CI). Blood lipid health: untreated total cholesterol <240 mg/dL and high‐density lipoprotein cholesterol ≥40 mg/dL in men and ≥50 in women. Prevalence was age‐adjusted by the direct method to the year 2010 census population using age groups 20–39, 40–59, and ≥60 years.
P value for trends, adjusted for age group, sex, and race/ethnicity, as appropriate.
Presence of All 3 CVD Risk Factors
Table 7 shows the trends in prevalence of the presence of all 3 risk factors among obese adults. Prevalence increased by 37% from 16.4% to 22.4% during the period 1988–2014. An increase was noted in all ages, sexes, and racial/ethnic subgroups. The increase occurred in parallel with a decline in the prevalence of healthy blood glucose, which is the predominant explanation accounting for the rise in the prevalence of presence of all 3 risk factors.
Table 7.
Secular Trends in Prevalence of the Presence of All 3 Cardiovascular Risk Factors in Obese Adults During NHANES 1988–2014 (N=18 626)
| Participants | 1988–1992 (n=4297) | 1999–2002 (n=2854) | 2003–2006 (n=3185) | 2007–2010 (n=4334) | 2011–2014 (n=3956) | P Valuea |
|---|---|---|---|---|---|---|
| All | 16.4 (14.8–17.9) | 16.7 (15.0–18.3) | 17.1 (15.7–18.5) | 22.4 (21.2–23.6) | 22.4 (20.8–24.0) | <0.001 |
| Aged 20–39 y | 4.5 (2.9–6.0) | 4.7 (2.8–6.6) | 4.2 (3.0–5.5) | 6.0 (4.3–7.6) | 6.0 (4.5–7.4) | 0.013 |
| Aged 40–59 y | 18.7 (15.9–21.4) | 16.7 (14.1–19.3) | 17.2 (15.1–19.3) | 24.4 (22.3–26.5) | 22.9 (19.8–25.9) | <0.001 |
| Aged ≥60 y | 30.2 (27.7–32.7) | 34.0 (30.9–37.1) | 35.7 (31.7–39.6) | 43.2 (39.7–46.7) | 45.5 (41.8–49.3) | <0.001 |
| Men | 15.4 (12.8–18.1) | 15.4 (12.5–18.3) | 17.2 (15.4–18.9) | 23.1 (21.4–24.8) | 22.1 (20.0–24.2) | <0.001 |
| Women | 16.8 (15.2–18.5) | 17.5 (15.5–19.4) | 17.0 (15.2–18.8) | 21.8 (19.7–23.9) | 22.7 (20.7–24.7) | <0.001 |
| Non‐Hispanic white | 15.3 (13.4–17.2) | 15.3 (13.2–17.5) | 15.8 (14.0–17.5) | 21.5 (19.7–23.4) | 20.6 (18.6–22.6) | <0.001 |
| Non‐Hispanic black | 24.6 (22.3–26.9) | 23.5 (20.8–26.2) | 20.5 (18.0–22.9) | 26.7 (23.3–30.2) | 28.0 (25.2–30.8) | 0.003 |
| Mexican American | 16.3 (13.3–19.3) | 16.2 (13.4–19.0) | 18.4 (15.1–21.6) | 23.2 (21.2–25.3) | 23.0 (20.3–25.7) | 0.002 |
NHANES indicates National Health and Nutrition Examination Survey.
Data are shown as prevalence percentage (95% CI). Participants with the presence of all 3 cardiovascular risk factors: (1) blood pressure: systolic blood pressure ≥130 mm Hg, diastolic blood pressure ≥85 mm Hg, or on antihypertensive medication; (2) blood glucose: hemoglobin A1c ≥5.7% or on antidiabetic medication; (3) blood lipids: total cholesterol ≥240 mg/dL, high‐density lipoprotein cholesterol <40 mg/dL in men and <50 mg/dL in women, or on lipid‐lowering medications. Prevalence was age‐adjusted by the direct method to the year 2010 census population using age groups 20–39, 40–59, and ≥60 years.
P value for trends, adjusted for age group, sex, and race/ethnicity, as appropriate.
Presence of 1 to 2 CVD Risk Factors
Table 8 shows the trends in the prevalence of presence of 1 to 2 risk factors among obese adults. The prevalence decreased significantly from 69.6% to 62.4% during the 1988–2014 period. Only young adults (aged 20–39 years) and non‐Hispanic black participants did not see a decrease trend in prevalence over this time frame.
Table 8.
Secular Trends in the Prevalence of 1 to 2 Cardiovascular Disease Risk Factors in Obese Adults During NHANES 1988–2014 (N=18 626)
| Participants | 1988–1992 (n=4297) | 1999–2002 (n=2854) | 2003–2006 (n=3185) | 2007–2010 (n=4334) | 2011–2014 (n=3956) | P Valuea |
|---|---|---|---|---|---|---|
| All | 69.6 (67.9–71.3) | 69.3 (67.5–71.1) | 65.5 (63.5–67.6) | 64.2 (62.8–65.6) | 62.4 (60.2–64.6) | <0.001 |
| Aged 20–39 y | 73.9 (70.2–77.7) | 71.4 (68.2–74.6) | 64.5 (60.9–68.0) | 69.9 (66.7–73.1) | 68.4 (64.4–72.5) | 0.37 |
| Aged 40–59 y | 69.8 (66.4–73.2) | 71.5 (68.1–74.8) | 70.5 (67.0–73.9) | 65.9 (63.1–68.7) | 65.5 (62.3–68.7) | 0.002 |
| Aged ≥60 y | 63.1 (59.5–66.7) | 63.0 (60.0–66.0) | 59.7 (55.8–63.6) | 53.4 (50.0–56.9) | 49.0 (45.0–53.1) | <0.001 |
| Men | 70.4 (67.4–73.3) | 71.0 (67.9–74.1) | 65.8 (63.0–68.6) | 64.3 (62.1–66.5) | 62.6 (59.8–65.4) | <0.001 |
| Women | 69.3 (66.4–72.1) | 68.2 (65.7–70.7) | 65.3 (61.8–68.7) | 64.1 (62.2–66.0) | 62.3 (59.9–64.7) | <0.001 |
| Non‐Hispanic white | 70.7 (68.7–72.7) | 71.7 (69.3–74.1) | 66.5 (63.5–69.4) | 65.0 (63.0–67.0) | 64.2 (60.6–67.8) | <0.001 |
| Non‐Hispanic black | 63.6 (61.2–65.9) | 61.6 (57.4–65.9) | 62.7 (58.5–66.9) | 61.5 (57.7–65.3) | 59.4 (56.1–62.6) | 0.27 |
| Mexican American | 71.4 (68.1–74.7) | 68.1 (64.6–71.6) | 66.1 (62.4–69.8) | 62.8 (60.3–65.3) | 61.5 (57.6–65.4) | 0.017 |
NHANES indicates National Health and Nutrition Examination Survey.
Data are shown as prevalence percentage (95% CI). Cardiovascular risk factors: (1) blood pressure: systolic blood pressure ≥130 mm Hg, diastolic blood pressure ≥85 mm Hg, or on antihypertensive medication; (2) blood glucose: hemoglobin A1c ≥5.7% or on antidiabetic medication; (3) blood lipids: total cholesterol ≥240 mg/dL, high‐density lipoprotein cholesterol <40 mg/dL in men and <50 mg/dL in women, or on lipid‐lowering medications. Prevalence was age‐adjusted by the direct method to the year 2010 census population using age groups 20–39, 40–59, and ≥60 years.
P value for trends, adjusted for age group, sex, and race/ethnicity, as appropriate.
Freedom From CVD Risk Factors
As can be seen in Table 9, the prevalence of participants free from all 3 CVD risk factors remained stable at ≈15% among the general adult obese population and in all sex and racial/ethnic subgroups during the period 1988–2014. The prevalence remained highest in participants aged 20 to 39 years and declined progressively in the subgroups aged 40 to 59 and ≥60 years. Very few adult obese participants met the criteria for ideal cardiovascular health, and the prevalence of ideal cardiovascular health remained stable at ≈2% during the 1988–2014 period (Table 10).
Table 9.
Secular Trends in Prevalence of Freedom From Cardiovascular Disease Risk Factors in Obese Adults During NHANES 1988–2014 (N=18 626)
| Participants | 1988–1992 (n=4297) | 1999–2002 (n=2854) | 2003–2006 (n=3185) | 2007–2010 (n=4334) | 2011–2014 (n=3956) | P Valuea |
|---|---|---|---|---|---|---|
| All | 14.0 (12.1–15.9) | 14.1 (12.7–15.4) | 17.3 (15.7–19.0) | 13.4 (12.1–14.7) | 15.2 (13.3–17.0) | 0.93 |
| Aged 20–39 y | 21.6 (17.7–25.5) | 24.0 (21.3–26.6) | 31.3 (27.6–35.0) | 24.1 (21.0–27.2) | 25.6 (21.9–29.3) | 0.79 |
| Aged 40–59 y | 11.6 (8.4–14.7) | 11.9 (9.4–14.3) | 12.3 (9.8–14.8) | 9.7 (8.0–11.4) | 11.6 (9.0–14.3) | 0.66 |
| Aged ≥60 y | 6.7 (4.2–9.3) | 3.0 (1.4–4.6) | 4.6 (2.9–6.3) | 3.4 (2.3–4.5) | 5.4 (3.7–7.1) | 0.41 |
| Men | 14.2 (10.9–17.5) | 13.6 (11.3–15.9) | 17.0 (14.6–19.5) | 12.6 (10.9–14.3) | 15.3 (12.3–18.2) | 0.98 |
| Women | 13.9 (11.2–16.6) | 14.4 (12.6–16.2) | 17.7 (14.9–20.5) | 14.1 (12.3–16.0) | 15.1 (13.3–16.8) | 0.91 |
| Non‐Hispanic white | 14.0 (11.5–16.6) | 13.0 (11.2–14.8) | 17.8 (15.5–20.1) | 13.5 (11.6–15.4) | 15.2 (12.1–18.2) | 0.64 |
| Non‐Hispanic black | 11.8 (9.8–13.8) | 14.8 (12.2–17.5) | 16.8 (13.7–19.9) | 11.8 (9.8–13.8) | 12.7 (10.8–14.6) | 0.11 |
| Mexican American | 12.3 (9.8–14.8) | 15.7 (13.2–18.3) | 15.5 (11.8–19.2) | 14.0 (11.2–16.8) | 15.5 (12.9–18.1) | 0.63 |
NHANES indicates National Health and Nutrition Examination Survey.
Data are shown as prevalence percentage (95% CI). Participants who were free from cardiovascular disease risk factors did not cross the threshold for any of the 3 risk factors (exhibit normal values for all 3 risk factors): (1) blood pressure, untreated systolic <130 mm Hg and diastolic <85; (2) blood glucose, untreated fasting <100 mg/dL or hemoglobin A1c <5.7%; (3) blood lipids, untreated total cholesterol <240 mg/dL and high‐density lipoprotein cholesterol ≥40 mg/dL in men and ≥50 in women).
P value for trends, adjusted for age group, sex, and race/ethnicity, as appropriate.
Table 10.
Secular Trends in Prevalence of Ideal Cardiovascular Health in Obese Adults During NHANES 1988–2014 (N=18 626)
| Participants | 1988–1992 (n=4297) | 1999–2002 (n=2854) | 2003–2006 (n=3185) | 2007–2010 (n=4334) | 2011–2014 (n=3956) | P Valuea |
|---|---|---|---|---|---|---|
| All | 1.8 (0.9–2.6) | 1.7 (1.3–2.2) | 1.6 (1.1–2.0) | 1.7 (1.2–2.2) | 1.7 (1.4–2.1) | 0.62 |
| Aged 20–39 y | 3.3 (1.1–5.6) | 3.0 (1.7–4.4) | 3.7 (2.6–4.8) | 2.8 (1.7–3.8) | 2.7 (2.0–3.3) | 0.43 |
| Aged 40–59 y | 1.2 (0.4–1.9) | 1.2 (0.5–1.9) | 0.3 (0.0–0.6) | 1.7 (0.9–2.6) | 1.7 (0.8–2.7) | 0.057 |
| Aged ≥60 y | 0.4 (0.0–1.0) | 0.7 (0.0–1.6) | 0.4 (0.0–0.8) | 0.2 (0.0–0.5) | 0.4 (0.0–0.8) | 0.53 |
| Men | 0.3 (0.0–0.6) | 0.1 (0.0–0.4) | 0.4 (0.0–0.8) | 0.3 (0.0–0.6) | 0.6 (0.0–1.2) | 0.27 |
| Women | 2.8 (1.4–4.2) | 2.9 (2.1–3.8) | 2.6 (1.9–3.3) | 3.0 (2.2–3.8) | 2.7 (2.2–3.3) | 0.98 |
| Non‐Hispanic white | 1.9 (0.6–3.2) | 1.1 (0.5–1.7) | 1.4 (0.9–1.9) | 1.5 (0.9–2.0) | 1.6 (1.0–2.2) | 0.55 |
| Non‐Hispanic black | 2.3 (1.5–3.2) | 1.7 (0.9–2.5) | 2.3 (1.3–3.2) | 2.1 (1.0–3.2) | 1.9 (1.1–2.6) | 0.95 |
| Mexican American | 1.1 (0.4–1.7) | 1.5 (0.7–2.4) | 1.4 (0.2–2.6) | 2.2 (0.9–3.6) | 2.8 (1.5–4.1) | 0.03 |
NHANES indicates National Health and Nutrition Examination Survey.
Data are shown as prevalence percentage (95% CI). Participants meeting ideal cardiovascular health had normal values for all 3 factors: (1) blood pressure, untreated systolic <120 mm Hg and diastolic <80; (2) blood glucose, untreated fasting <100 mg/dL or hemoglobin A1c <5.7%; (3) blood lipids, untreated total cholesterol <200 mg/dL and high‐density lipoprotein cholesterol ≥60 mg/dL.
P value for trends, adjusted for age group, sex, and race/ethnicity, as appropriate.
We summarized the trends in cardiovascular health status in obese adults during NHANES 1988–2014 in Figure. Prevalence of freedom from all 3 CVD risk factors remained stable at ≈15% during 1988–2014, whereas prevalence of the presence of all 3 risk factors was greatly increased during this period. In addition, prevalence of ideal cardiovascular health remained very low at <2% over the period 1988–2014.
Figure 1.
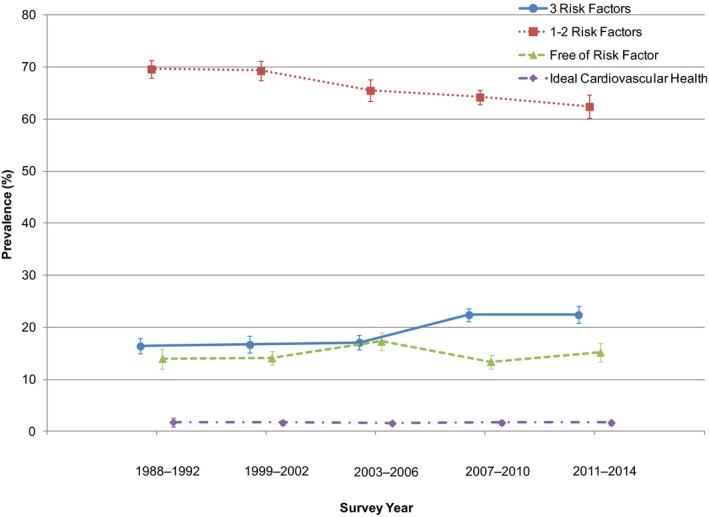
Secular trends in cardiovascular health status in obese adults in NHANES 1988–2014. Data are plotted as prevalence (95% CI). Prevalence was age‐adjusted by the direct method to the year 2010 census population using the age groups 20 to 39, 40 to 59, and ≥60 years. NHANES indicates National Health and Nutrition Examination Survey.
Discussion
Using data from NHANES III and NHANES 1999–2014, we assessed the secular trends in the prevalence of CVD risk factors and in cardiovascular health status in an adult obese population in the United States over the past 3 decades. Among 18 626 obese adults from NHANES 1988–2014, mean systolic blood pressure, diastolic blood pressure, total cholesterol, and HDL cholesterol levels all showed improvement. In contrast, mean HbA1c levels increased during this period. Healthy status was ascribed to each factor based on accepted risk thresholds. During the period 1988–2014, the prevalence of participants meeting criteria for blood pressure health and blood cholesterol health remained stable, whereas the prevalence of blood glucose health decreased significantly. Prevalence of freedom from all 3 CVD risk factors remained stable at ≈15% among the adult obese population during the 1988–2014 period. Prevalence of the presence of all 3 risk factors was greatly increased by 37%, from 16.4% to 22.4% during this period; commensurately, prevalence of the presence of 1 to 2 risk factors declined significantly from 69.6% to 62.4% during the 1988–2014 period. Finally, a definition of ideal cardiovascular health was applied; however, prevalence rates of ideal cardiovascular health remained very low, at <2% over the period 1988–2014. Prevalence of ideal blood lipid health improved from 1988 to 2006 and then leveled off during the 2007–2014 period but remained extremely low (<5%).
Cardiometabolic Health in People With Obesity
Obese participants who are free from cardiometabolic disease risk factors are termed “metabolically healthy obese.”9, 26 The existence of the metabolically healthy obese condition has been controversial27, 28, 29, 30; however, we have recently added some clarification to this issue by pointing out that conclusions rest heavily on the definition of metabolically healthy obese.31 We4, 5, 10 and others12, 13, 14 have shown that 1 or 2 metabolic syndrome traits confer increased risk of diabetes mellitus and CVD outcomes and that such persons are relatively insulin resistant. The problem with many reports minimizing the importance of the metabolically healthy obese condition is the inclusion of participants with 1 or 2 risk factors among metabolically healthy participants. When “metabolically healthy” is defined as the absence of all metabolic syndrome risk factors, there is minimal or no contribution of BMI to CVD events or mortality, and cumulative rates of diabetes mellitus remain quite low regardless of BMI. Obese participants with metabolic syndrome consistently have much greater risks for diabetes mellitus and CVD than their counterparts assigned to the metabolically healthy subgroup.12, 13, 14 We have also defined a subgroup of patients with suboptimal metabolic health who have 1 or 2 risk factors but who do not meet criteria for metabolic syndrome, and those persons have intermediate risks of incident diabetes mellitus and CVD outcomes.10, 31 BMI interacts with metabolic status to significantly augment diabetes risks such that progressive increments in BMI augment the risk of diabetes mellitus; however, the impact of BMI on rates of diabetes mellitus is greater among those with metabolic syndrome (ie, metabolically unhealthy obese), less so in those with suboptimal metabolic health, and least in metabolically healthy obese persons. In any event, cardiometabolic risk factors confer much higher risk of diabetes mellitus, CVD, stroke, and mortality than BMI per se.
Our finding that the prevalence of metabolically healthy obese participants who are free from all CVD risk factors has remained relatively stable at ≈15% during the past 3 decades in the United States agrees with a large collaborative study in Europe encompassing 163 517 participants (the BioSHaRE‐EU Healthy Obese Project). This European study demonstrated that the frequency of metabolically healthy obesity was 7% to 28% in women and 2% to 19% in men in various European countries.32 Although these persons have lower risks of total and CVD mortality and type 2 diabetes mellitus, the proportion of metabolically healthy persons among all obese adults is relatively low. We also observed that the prevalence of ideal cardiovascular health among obese people was extremely low over the past 3 decades, remaining consistently <2%, and that very few adult obese participants met the criteria for ideal blood cholesterol health (<5%). These results are consistent with previously reported very low prevalence of meeting cardiovascular health among the general adult population in the United States.33 Consistent with a previous report on the prevalence of CVD risk factors in US adults from 1960 to 2000,16 our results indicated that blood glucose health continued to deteriorate in obese people during the period 1988–2014. Further studies are need to unravel the underlying causes of this troubling phenomena. The improvements in mean blood pressure and blood cholesterol may reflect the healthy trends in the US population, including decreases in the proportion of dietary saturated fat; increases in fruits and vegetables and the proportion of polyunsaturated and monounsaturated fats in the diet34, 35, 36, 37; decreased smoking38, 39, 40; and increased awareness, identification, and pharmacological treatment of high cholesterol and blood pressure levels.25, 41
Obese participants with metabolic syndrome are at greater risk of diabetes and CVD outcomes.12, 13, 14 In our study, the prevalence of obese people with all 3 CVD risk factors kept increasing over the past 3 decades in the United States. The increasing trend of obese people with all 3 CVD risk factors, commensurate with a decline in those with 1 to 2 risk factors, suggested an overall deterioration in health among people with obesity. In recent years, almost 1 in 4 obese adults had all 3 CVD risk factors. During the period 1988–2010, adults in the United States experienced a significant decrease in diet quality and an increase in the prevalence of sedentary lifestyles.33 Those changes may partially explain our findings regarding the increasing trend in prevalence of presence of all 3 CVD risk factors in obese adults.
Implications
Although some data point to a leveling off of prevalence rates of obesity in recent years, our data indicate that overall metabolic health is declining among people with obesity in the United States. Furthermore, deteriorating metabolic health can be attributed primarily to worsening glycemic health because mean values of HbA1c have been increasing, whereas mean blood pressure and lipid metrics have been improving. These patterns of worsening metabolic health constitute an increase in risk of type 2 diabetes mellitus and underlie increasing prevalence rates for diabetes mellitus. Without intensive interventions, obese people do not lose sufficient body weight to become lean, regardless of their age31; however, moderate weight loss of 10% of body weight is sufficient to dramatically reduce progression to diabetes among high‐risk persons.42, 43 The deteriorated blood glucose health among obese adults in the United States calls for lifestyle interventions (diet and exercise) on a national scale. Community‐based public health intervention programs may help increase physical activity and diet quality to alleviate the problem.44, 45 Obese adults at high risk of diabetes and CVD may require more intense approaches to achieve weight loss using lifestyle interventions alone or in combination with weight loss medications.42, 43, 46, 47 A complication‐centric approach may be adopted to guide the selection of weight loss therapy options (eg, more aggressive treatment in those obese patients with complications or at higher risk of complications to optimize outcomes, the benefit–risk ratio of the intervention, and the cost‐effectiveness of care).48, 49 In the context of the current data, those obese adults who are metabolically unhealthy or perhaps those with suboptimal metabolic health represent patients who will benefit most from intensive obesity management. As suggested by Yang et al,33 coordinated efforts aligning CVD prevention and control activities across the public and private sectors in the United States are needed reduce the burden of CVD among the obese population.50
Strengths and Limitations
The main strengths of this study involve the use of sequential surveys over time, consisting of nationally representative data from NHANES. These data from the past 3 decades enabled us to assess the secular trends of prevalence of individual CVD risk factors and overall CVD health status among obese people in a nationally representative sample. Limitations of this study include the sample size, which may not be large enough to permit extensive subgroup analyses of each age, sex, and racial or ethnic group. In addition, we were able to assess only the trends in major racial and ethnic groups (eg, non‐Hispanic black, non‐Hispanic white, and Mexican American); we could not further differentiate other racial and ethnic groups because of the sample size limit. Furthermore, because the duration of physical activity (in minutes) changed substantially since the 2007–2008 cycle, we did not assess physical activity among obese adults during the 1988–2014 period.
Conclusions
During past 3 decades, blood pressure health and blood lipid health remained stable, whereas blood glucose health deteriorated among adults with obesity. During the period 1988–2014, the prevalence of freedom from all 3 CVD risk factors remained stable at ≈15% among the adult obese population, whereas prevalence of the presence of all 3 risk factors greatly increased from 16.4% to 22.4%. In 2011–2014, almost 1 in 4 obese people had all 3 risk factors. The increase in the number of obese people with all 3 risk factors was largely the result of worsening glycemic status. The data support continuing efforts to target obese people who are at risk with weight loss therapy to improve cardiometabolic disease health and to prevent progression to diabetes mellitus.
Sources of Funding
Dr Guo is currently a postdoctoral fellow supported by an institutional training grant (National Research Service Award T32HD055163) from the Eunice Kennedy Shriver National Institute of Child Health & Human Development (NICHD) at the National Institutes of Health (NIH). This study is supported by the Merit Review program of the Department of Veterans Affairs, National Institutes of Health (DK‐038765 and DK‐083562), and the UAB Diabetes Research Center (P60‐DK079626). Role of the Sponsors: All data from NHANES used in this study were collected by the National Center for Health Statistics Centers for Disease Control and Prevention.
Disclosures
Dr Garvey is an advisor for Astra Zeneca, Boehringer‐Ingelheim, Daiichi‐Sankyo, Inc., Eisai, Janssen Pharmaceuticals, LipoScience, Novo Nordisk, Takeda, and VIVUS, Inc.; is a stockholder for Bristol‐Myers Squibb Company, Eli Lilly and Company, Isis/Genzyme, Merck, Novartis, and Pfizer, Inc.; and has received research support from Astra Zeneca, Eisai, Lexicon, Merck & Co., Pfizer, Inc., Sanofi, and Weight Watchers International, Inc. Dr Guo has no conflict of interest or financial disclosure to declare.
Supporting information
Table S1. Secular Trends in Systolic Blood Pressure in Obese Adults During NHANES 1988–2014 (n=17 393)
Table S2. Secular Trends in Diastolic Blood Pressure in Obese Adults During NHANES 1988–2014 (n=17 325)
Table S3. Secular Trends in Ideal Blood Pressure Health in Obese During NHANES 1988–2014 (N=18 626)
Table S4. Secular Trends in Hemoglobin A1c in Obese Adults During NHANES 1988–2014 (N=17 773)
Table S5. Secular Trends in Prevalence of Diabetes in Obese Adults During NHANES 1988–2014 (N=18 626)
Table S6. Secular Trends in Total Cholesterol in Obese Adults During NHANES 1988–2014 (n=17 560)
Table S7. Secular Trends in High‐Density Lipoprotein Cholesterol in Obese Adults During NHANES 1988–2014 (n=17 525)
Table S8. Secular Trends in Ideal Blood Lipid Health in Obese Adults During NHANES 1988–2014 (N=18 626)
(J Am Heart Assoc. 2016;5:e003619 doi: 10.1161/JAHA.116.003619)
The findings and conclusions in this paper are those of the authors and do not necessarily represent the views of the National Center for Health Statistics, or the Centers for Disease Control and Prevention.
References
- 1. Hu FB. Obesity and mortality: watch your waist, not just your weight. Arch Intern Med. 2007;167:875–876. [DOI] [PubMed] [Google Scholar]
- 2. Flegal KM, Carroll MD, Kit BK, Ogden CL. Prevalence of obesity and trends in the distribution of body mass index among US adults, 1999–2010. JAMA. 2012;307:491–497. [DOI] [PubMed] [Google Scholar]
- 3. Finucane MM, Stevens GA, Cowan MJ, Danaei G, Lin JK, Paciorek CJ, Singh GM, Gutierrez HR, Lu Y, Bahalim AN, Farzadfar F, Riley LM, Ezzati M; Global Burden of Metabolic Risk Factors of Chronic Diseases Collaborating G . National, regional, and global trends in body‐mass index since 1980: systematic analysis of health examination surveys and epidemiological studies with 960 country‐years and 9.1 million participants. Lancet. 2011;377:557–567. [DOI] [PMC free article] [PubMed] [Google Scholar]
- 4. Lara‐Castro C, Garvey WT. Diet, insulin resistance, and obesity: zoning in on data for Atkins dieters living in South Beach. J Clin Endocrinol Metab. 2004;89:4197–4205. [DOI] [PubMed] [Google Scholar]
- 5. Liao Y, Kwon S, Shaughnessy S, Wallace P, Hutto A, Jenkins AJ, Klein RL, Garvey WT. Critical evaluation of adult treatment panel III criteria in identifying insulin resistance with dyslipidemia. Diabetes Care. 2004;27:978–983. [DOI] [PubMed] [Google Scholar]
- 6. Bogardus C, Lillioja S. Pima Indians as a model to study the genetics of NIDDM. J Cell Biochem. 1992;48:337–343. [DOI] [PubMed] [Google Scholar]
- 7. Ferrannini E, Natali A, Bell P, Cavallo‐Perin P, Lalic N, Mingrone G. Insulin resistance and hypersecretion in obesity. European group for the study of insulin resistance (EGIR). J Clin Invest. 1997;100:1166–1173. [DOI] [PMC free article] [PubMed] [Google Scholar]
- 8. Carey DG, Jenkins AB, Campbell LV, Freund J, Chisholm DJ. Abdominal fat and insulin resistance in normal and overweight women: direct measurements reveal a strong relationship in subjects at both low and high risk of NIDDM. Diabetes. 1996;45:633–638. [DOI] [PubMed] [Google Scholar]
- 9. Wildman RP, Muntner P, Reynolds K, McGinn AP, Rajpathak S, Wylie‐Rosett J, Sowers MR. The obese without cardiometabolic risk factor clustering and the normal weight with cardiometabolic risk factor clustering: prevalence and correlates of 2 phenotypes among the US population (NHANES 1999–2004). Arch Intern Med. 2008;168:1617–1624. [DOI] [PubMed] [Google Scholar]
- 10. Guo F, Moellering DR, Garvey WT. The progression of cardiometabolic disease: validation of a new cardiometabolic disease staging system applicable to obesity. Obesity (Silver Spring). 2014;22:110–118. [DOI] [PMC free article] [PubMed] [Google Scholar]
- 11. Kip KE, Marroquin OC, Kelley DE, Johnson BD, Kelsey SF, Shaw LJ, Rogers WJ, Reis SE. Clinical importance of obesity versus the metabolic syndrome in cardiovascular risk in women: a report from the women's ischemia syndrome evaluation (WISE) study. Circulation. 2004;109:706–713. [DOI] [PubMed] [Google Scholar]
- 12. Meigs JB, Wilson PW, Fox CS, Vasan RS, Nathan DM, Sullivan LM, D'Agostino RB. Body mass index, metabolic syndrome, and risk of type 2 diabetes or cardiovascular disease. J Clin Endocrinol Metab. 2006;91:2906–2912. [DOI] [PubMed] [Google Scholar]
- 13. Yusuf S, Hawken S, Ounpuu S, Bautista L, Franzosi MG, Commerford P, Lang CC, Rumboldt Z, Onen CL, Lisheng L, Tanomsup S, Wangai P Jr, Razak F, Sharma AM, Anand SS; Investigators IS . Obesity and the risk of myocardial infarction in 27,000 participants from 52 countries: a case‐control study. Lancet. 2005;366:1640–1649. [DOI] [PubMed] [Google Scholar]
- 14. Wilson PW, D'Agostino RB, Parise H, Sullivan L, Meigs JB. Metabolic syndrome as a precursor of cardiovascular disease and type 2 diabetes mellitus. Circulation. 2005;112:3066–3072. [DOI] [PubMed] [Google Scholar]
- 15. Ogden CL, Carroll MD, Kit BK, Flegal KM. Prevalence of childhood and adult obesity in the United States, 2011–2012. JAMA. 2014;311:806–814. [DOI] [PMC free article] [PubMed] [Google Scholar]
- 16. Gregg EW, Cheng YJ, Cadwell BL, Imperatore G, Williams DE, Flegal KM, Narayan KM, Williamson DF. Secular trends in cardiovascular disease risk factors according to body mass index in US adults. JAMA. 2005;293:1868–1874. [DOI] [PubMed] [Google Scholar]
- 17. National Center for Health Statistics . The National Health and Nutrition Examination Survey (NHANES) analytic and reporting guidelines. Available at: http://www.Cdc.Gov/nchs/data/nhanes/nhanes_03_04/nhanes_analytic_guidelines_dec_2005.Pdf. Accessed December 20, 2011.
- 18. Survey questionnaires, examination components and laboratory components 2009–2010. Available at: http://www.Cdc.Gov/nchs/nhanes/nhanes2009-2010/questexam09_10.Htm. Accessed December 20, 2011.
- 19. The National Health and Nutrition Examination Survey (NHANES) laboratory procedures manual. Available at: http://www.Cdc.Gov/nchs/data/nhanes/nhanes_09_10/lab.Pdf. Accessed December 20, 2011.
- 20. Lloyd‐Jones DM, Hong Y, Labarthe D, Mozaffarian D, Appel LJ, Van Horn L, Greenlund K, Daniels S, Nichol G, Tomaselli GF, Arnett DK, Fonarow GC, Ho PM, Lauer MS, Masoudi FA, Robertson RM, Roger V, Schwamm LH, Sorlie P, Yancy CW, Rosamond WD. Defining and setting national goals for cardiovascular health promotion and disease reduction: the American Heart Association's strategic impact goal through 2020 and beyond. Circulation. 2010;121:586–613. [DOI] [PubMed] [Google Scholar]
- 21. Expert Panel on Detection Evaluation, Treatment of High Blood Cholesterol in Adults . Executive summary of the third report of the national cholesterol education program (NCEP) expert panel on detection, evaluation, and treatment of high blood cholesterol in adults (adult treatment panel III). JAMA. 2001;285:2486–2497. [DOI] [PubMed] [Google Scholar]
- 22. Stone NJ, Robinson JG, Lichtenstein AH, Bairey Merz CN, Blum CB, Eckel RH, Goldberg AC, Gordon D, Levy D, Lloyd‐Jones DM, McBride P, Schwartz JS, Shero ST, Smith SC, Watson K, Wilson PW; Guidelines ACoCAHATFoP . 2013 ACC/AHA guideline on the treatment of blood cholesterol to reduce atherosclerotic cardiovascular risk in adults: a report of the American College of Cardiology/American Heart Association Task Force on Practice Guidelines. J Am Coll Cardiol. 2014;63:2889–2934. [DOI] [PubMed] [Google Scholar]
- 23. Analytic and reporting guidlines: the third National Health and Nutrition Examination Survey, NHANES III (1988–94). Available at: http://www.Cdc.Gov/nchs/data/nhanes/nhanes3/nh3gui.Pdf. Accessed December 5, 2012.
- 24. The National Health and Nutrition Examination Survey (NHANES III) linked mortality file analytic guidelines. Available at: http://www.Cdc.Gov/nchs/data/datalinkage/nh3_mort_analytic_guidelines.Pdf. Accessed December 5, 2012.
- 25. Guo F, He D, Zhang W, Walton RG. Trends in prevalence, awareness, management, and control of hypertension among United States adults, 1999 to 2010. J Am Coll Cardiol. 2012;60:599–606. [DOI] [PubMed] [Google Scholar]
- 26. Stefan N, Kantartzis K, Machann J, Schick F, Thamer C, Rittig K, Balletshofer B, Machicao F, Fritsche A, Haring HU. Identification and characterization of metabolically benign obesity in humans. Arch Intern Med. 2008;168:1609–1616. [DOI] [PubMed] [Google Scholar]
- 27. Arnlov J, Ingelsson E, Sundstrom J, Lind L. Impact of body mass index and the metabolic syndrome on the risk of cardiovascular disease and death in middle‐aged men. Circulation. 2010;121:230–236. [DOI] [PubMed] [Google Scholar]
- 28. Thomsen M, Nordestgaard BG. Myocardial infarction and ischemic heart disease in overweight and obesity with and without metabolic syndrome. JAMA Intern Med. 2014;174:15–22. [DOI] [PubMed] [Google Scholar]
- 29. Appleton SL, Seaborn CJ, Visvanathan R, Hill CL, Gill TK, Taylor AW, Adams RJ; Team NWAHS . Diabetes and cardiovascular disease outcomes in the metabolically healthy obese phenotype: a cohort study. Diabetes Care. 2013;36:2388–2394. [DOI] [PMC free article] [PubMed] [Google Scholar]
- 30. Chang Y, Ryu S, Suh BS, Yun KE, Kim CW, Cho SI. Impact of BMI on the incidence of metabolic abnormalities in metabolically healthy men. Int J Obes (Lond). 2012;36:1187–1194. [DOI] [PubMed] [Google Scholar]
- 31. Guo F, Garvey WT. Cardiometabolic disease risk in metabolically healthy and unhealthy obesity: stability of metabolic health status in adults. Obesity (Silver Spring). 2016;24:516–525. [DOI] [PMC free article] [PubMed] [Google Scholar]
- 32. van Vliet‐Ostaptchouk JV, Nuotio ML, Slagter SN, Doiron D, Fischer K, Foco L, Gaye A, Gögele M, Heier M, Hiekkalinna T, Joensuu A, Newby C, Pang C, Partinen E, Reischl E, Schwienbacher C, Tammesoo ML, Swertz MA, Burton P, Ferretti V, Fortier I, Giepmans L, Harris JR, Hillege HL, Holmen J, Jula A, Kootstra‐Ros JE, Kvaløy K, Holmen TL, Männistö S, Metspalu A, Midthjell K, Murtagh MJ, Peters A, Pramstaller PP, Saaristo T, Salomaa V, Stolk RP, Uusitupa M, van der Harst P, van der Klauw MM, Waldenberger M, Perola M, Wolffenbuttel BH. The prevalence of metabolic syndrome and metabolically healthy obesity in Europe: a collaborative analysis of ten large cohort studies. BMC Endocr Disord. 2014;14:9. [DOI] [PMC free article] [PubMed] [Google Scholar]
- 33. Yang Q, Cogswell ME, Flanders WD, Hong Y, Zhang Z, Loustalot F, Gillespie C, Merritt R, Hu FB. Trends in cardiovascular health metrics and associations with all‐cause and CVD mortality among US adults. JAMA. 2012;307:1273–1283. [DOI] [PMC free article] [PubMed] [Google Scholar]
- 34. Centers for Disease Control and Prevention (CDC) . Trends in intake of energy and macronutrients—United States, 1971–2000. MMWR Morb Mortal Wkly Rep. 2004;53:80–82. [PubMed] [Google Scholar]
- 35. Ernst ND, Sempos CT, Briefel RR, Clark MB. Consistency between US dietary fat intake and serum total cholesterol concentrations: the National Health and Nutrition Examination Surveys. Am J Clin Nutr. 1997;66:965S–972S. [DOI] [PubMed] [Google Scholar]
- 36. Li R, Serdula M, Bland S, Mokdad A, Bowman B, Nelson D. Trends in fruit and vegetable consumption among adults in 16 US states: behavioral risk factor surveillance system, 1990–1996. Am J Public Health. 2000;90:777–781. [DOI] [PMC free article] [PubMed] [Google Scholar]
- 37. Sijtsma FP, Meyer KA, Steffen LM, Shikany JM, Van Horn L, Harnack L, Kromhout D, Jacobs DR. Longitudinal trends in diet and effects of sex, race, and education on dietary quality score change: the Coronary Artery Risk Development in Young Adults study. Am J Clin Nutr. 2012;95:580–586. [DOI] [PMC free article] [PubMed] [Google Scholar]
- 38. Centers for Disease Control and Prevention (CDC) . Tobacco use—United States, 1900–1999. MMWR Morb Mortal Wkly Rep. 1999;48:986–993. [PubMed] [Google Scholar]
- 39. Bilano V, Gilmour S, Moffiet T, d'Espaignet ET, Stevens GA, Commar A, Tuyl F, Hudson I, Shibuya K. Global trends and projections for tobacco use, 1990–2025: an analysis of smoking indicators from the who comprehensive information systems for tobacco control. Lancet. 2015;385:966–976. [DOI] [PubMed] [Google Scholar]
- 40. Agaku IT, Alpert HR. Trends in annual sales and current use of cigarettes, cigars, roll‐your‐own tobacco, pipes, and smokeless tobacco among US adults, 2002–2012. Tob Control. 2015. doi: 10.1136/tobaccocontrol‐2014‐052125. [DOI] [PubMed] [Google Scholar]
- 41. Egan BM, Li J, Hutchison FN, Ferdinand KC. Hypertension in the United States, 1999 to 2012: progress toward healthy people 2020 goals. Circulation. 2014;130:1692–1699. [DOI] [PMC free article] [PubMed] [Google Scholar]
- 42. Gadde KM, Allison DB, Ryan DH, Peterson CA, Troupin B, Schwiers ML, Day WW. Effects of low‐dose, controlled‐release, phentermine plus topiramate combination on weight and associated comorbidities in overweight and obese adults (CONQUER): a randomised, placebo‐controlled, phase 3 trial. Lancet. 2011;377:1341–1352. [DOI] [PubMed] [Google Scholar]
- 43. Garvey WT, Ryan DH, Bohannon NJ, Kushner RF, Rueger M, Dvorak RV, Troupin B. Weight‐loss therapy in type 2 diabetes: effects of phentermine and topiramate extended release. Diabetes Care. 2014;37:3309–3316. [DOI] [PubMed] [Google Scholar]
- 44. Bazzano AT, Zeldin AS, Diab IR, Garro NM, Allevato NA, Lehrer D, Team WPO. The healthy lifestyle change program: a pilot of a community‐based health promotion intervention for adults with developmental disabilities. Am J Prev Med. 2009;37:S201–S208. [DOI] [PubMed] [Google Scholar]
- 45. Jackson L. Translating the diabetes prevention program into practice: a review of community interventions. Diabetes Educ. 2009;35:309–320. [DOI] [PubMed] [Google Scholar]
- 46. Smith SR, Weissman NJ, Anderson CM, Sanchez M, Chuang E, Stubbe S, Bays H, Shanahan WR; Behavioral M, Lorcaserin for O, Obesity Management Study G . Multicenter, placebo‐controlled trial of lorcaserin for weight management. N Engl J Med. 2010;363:245–256. [DOI] [PubMed] [Google Scholar]
- 47. Diabetes Prevention Program Research G , Knowler WC, Fowler SE, Hamman RF, Christophi CA, Hoffman HJ, Brenneman AT, Brown‐Friday JO, Goldberg R, Venditti E, Nathan DM. 10‐year follow‐up of diabetes incidence and weight loss in the diabetes prevention program outcomes study. Lancet. 2009;374:1677–1686. [DOI] [PMC free article] [PubMed] [Google Scholar]
- 48. Garvey WT, Garber AJ, Mechanick JI, Bray GA, Dagogo‐Jack S, Einhorn D, Grunberger G, Handelsman Y, Hennekens CH, Hurley DL, McGill J, Palumbo P, Umpierrez G; On Behalf Of The Aace Obesity Scientific Committee . American Association of Clinical Endocrinologists and American College of Endocrinology position statement on the 2014 advanced framework for a new diagnosis of obesity as a chronic disease. Endocr Pract. 2014;20:977–989. [DOI] [PMC free article] [PubMed] [Google Scholar]
- 49. Garvey WT. New tools for weight‐loss therapy enable a more robust medical model for obesity treatment: rationale for a complications‐centric approach. Endocr Pract. 2013;19:864–874. [DOI] [PMC free article] [PubMed] [Google Scholar]
- 50. Tomaselli GF, Harty MB, Horton K, Schoeberl M. The American Heart Association and the million hearts initiative: a presidential advisory from the American Heart Association. Circulation. 2011;124:1795–1799. [DOI] [PubMed] [Google Scholar]
Associated Data
This section collects any data citations, data availability statements, or supplementary materials included in this article.
Supplementary Materials
Table S1. Secular Trends in Systolic Blood Pressure in Obese Adults During NHANES 1988–2014 (n=17 393)
Table S2. Secular Trends in Diastolic Blood Pressure in Obese Adults During NHANES 1988–2014 (n=17 325)
Table S3. Secular Trends in Ideal Blood Pressure Health in Obese During NHANES 1988–2014 (N=18 626)
Table S4. Secular Trends in Hemoglobin A1c in Obese Adults During NHANES 1988–2014 (N=17 773)
Table S5. Secular Trends in Prevalence of Diabetes in Obese Adults During NHANES 1988–2014 (N=18 626)
Table S6. Secular Trends in Total Cholesterol in Obese Adults During NHANES 1988–2014 (n=17 560)
Table S7. Secular Trends in High‐Density Lipoprotein Cholesterol in Obese Adults During NHANES 1988–2014 (n=17 525)
Table S8. Secular Trends in Ideal Blood Lipid Health in Obese Adults During NHANES 1988–2014 (N=18 626)