

ABSTRACT
Sirtuins (SIRT) belonging to the NAD+ dependent histone deacetylase III class of enzymes have emerged as master regulators of metabolism and longevity. However, their role in prevention of organismal aging and cellular senescence still remains controversial. In the present study, we now report upregulation of SIRT2 as a specific feature associated with stress induced premature senescence but not with either quiescence or cell death. Additionally, increase in SIRT2 expression was noted in different types of senescent conditions such as replicative and oncogene induced senescence using multiple cell lines. Induction of SIRT2 expression during senescence was dependent on p53 status as depletion of p53 by shRNA prevented its accumulation. Chromatin immunoprecipitation revealed the presence of p53 binding sites on the SIRT2 promoter suggesting its regulation by p53, which was also corroborated by the SEAP reporter assay. Overexpression or knockdown of SIRT2 had no effect on stress induced premature senescence, thereby indicating that SIRT2 increase is not a cause of senescence; rather it is an effect linked to senescence-associated changes. Overall, our results suggest SIRT2 as a promising marker of cellular senescence at least in cells with wild type p53 status.
KEYWORDS: doxorubicin, p53, senescence, Sirtuins, SIRT2
Introduction
Cellular senescence is a process of irreversible growth arrest. Typically primary cells undergo replicative senescence due to attrition of telomeres which is a slow process.1 In contrast, premature senescence is an accelerated process resulting due to oxidative stress and DNA damage.2,3 Additionally, oncogenes such as ras, raf, myc etc. can also cause premature senescence, this is commonly referred as oncogene induced senescence.4 Yet, another form of cellular senescence known as Pten-loss-induced cellular senescence (PICS) is activated in absence of DNA damage due to loss of a tumor suppressor.5 Activation of p53-p21 or p16-pRb pathways are the two well-known mechanisms leading to cell cycle arrest during senescence.6 In addition a role of chromatin modifiers has been also highlighted recently.7 Generally, senescent cells are considered to be permanently arrested in the G1 phase of the cell cycle, however few other studies are supportive of a role of G2 arrest as well.8,9
Senescent cells at least under in vitro conditions can be identified by enlarged and flattened morphology. Senescence-associated β-galactosidase staining was the first biomarker reported for the identification of senescent cells.10 Despite having limitations, it is still considered to be the most accepted marker of senescence. Molecular markers such as p21WAF1, p27Kip1 and p53 are considered general growth arrest markers associated with conditions of not only senescence but also differentiation and quiescence. Recently loss of Lamin B1 and staining for α-fucosidase have been used for identification of senescent cells.11,12 Markers such as γH2AX, and senescence-associated heterochromatin foci have also been used as surrogate markers but are not very specific.13
Accumulation of senescent cells has been linked to the process of aging which also intricately involves deregulation of cellular metabolism.14 Sirtuins belonging to the NAD+ dependent histone deacetylase III enzyme class have not only emerged as master regulators of metabolism, but are also reported to extend the lifespan of lower organisms like yeast, flies and worms.15–17 In mammals, there are 7 distinct isoforms (SIRT1-7) with distinct subcellular compartmentalization.18 SIRT1, closest homolog of the yeast Sir2 protein upon overexpression in primary fibroblasts (MEFs) prevented PML-mediated premature cellular senescence by p53 deacetylation.19 However, in response to chronic genotoxic stress, SIRT1 promoted replicative senescence in MEFs via the p19ARF pathway.20 SIRT6 functions to promote normal DNA repair and thus, SIRT6 knockout mice showed signs of premature aging.21 Earlier we had reported loss of nucleolar SIRT7 during replicative senescence, but not in stress induced premature senescence.22 Recently, we showed that overexpression of SIRT7 could alleviate DNA damage induced premature senescence.23
The existing data from lower organisms and knockout mice in general is suggestive of role of Sirtuins in reversion of cellular aging. On the other hand, few studies have contradicted the role of Sirtuins in increasing longevity and prevention of aging.24,25 Further, there is no clarity with respect to expression of various Sirtuins isoforms in different conditions of senescence such as replicative, oncogene induced and stress induced. Using an in vitro cell culture system we now report a specific increase in SIRT2 levels in all modes of cellular senescence, which in turn is dependent on the p53 status. Additionally, the present work revealed that increased SIRT2 expression is specific only to senescence and not associated with either quiescence or DNA damage induced cell death.
Results
Doxorubicin induces premature senescence in U2OS cells and this is accompanied with increased expression of SIRT2 and SIRT4
Doxorubicin, a widely used topoisomerase II inhibitor is an inducer of premature senescence at low doses and is highly cytotoxic at higher doses.26 The osteosarcoma cell line, U2OS cells were treated for short duration with doxorubicin (1 µM dose for 2 h) followed by change to fresh medium. Cells were then monitored up to 120 h. By 72 h of treatment, the cells appeared larger in size and by 120 h most of the cells presented with enlarged and flattened morphology. Further the cells were positive for senescence-associated β-galactosidase (SA-βgal) activity, as detected by 5-bromo-4-chloro-3-indolyl β-D-galactosidase (X-gal) staining at pH 6.0 (Fig. 1A and B). The enlarged senescent morphology was associated with increase in expression levels of growth arrest markers such as p53 and p21 along with higher expression of plasminogen activator inhibitor-1 (PAI-1), a marker of senescent secretory phenotype14 (Fig. 1C). The loss of nuclear membrane protein Lamin B1 was recently described as a senescent-associated marker11 and indeed it was noted that doxorubicin induced senescent cells showed significant loss of Lamin B1. The doxorubicin induced senescent cells showed G2/M arrest which was accompanied by expression of Cyclin B1, a G2 specific marker27 (Fig. 1D; Supplemental Fig. S1).
Figure 1.

Doxorubicin induced premature senescence and expression of Sirtuin isoforms. (A) U2OS cells were treated with doxorubicin (Dox, 1 µM, 2 h), grown in fresh culture medium for 120 h and assayed for SA-βgal (blue). Untreated cells served as control. (B) Bar diagram showing percentage SA-βgal positive cells in control and doxorubicin treated U2OS cells at 120 h (*P < 0.05). (C) Immunoblots showing expression of senescence-associated markers viz., p53, p21, PAI-1 and Lamin B1 in control and senescent cells at 120 h. (D) Time kinetics showing cell cycle distribution of control and doxorubicin treated cells. (E) Bar diagram showing relative fold change in expression levels of various Sirtuin transcripts in control and senescent U2OS cells at 120 h. The transcript levels of SIRT1-SIRT7 were quantified by real-time PCR and normalized to GAPDH mRNA (*P < 0.05). (F) Immunoblots showing expression of various Sirtuin isoforms in control vs. senescent cells at 120 h. (G) Bar diagram showing the fold increase in expression levels of Sirtuin proteins in senescent cells in comparison to control cells. Note the presence of 2 distinct isoforms for both SIRT2 (39 and 43 kDa) and SIRT7 (45 and 47.5 kDa) on the immunoblot. To calculate the total fold change, the corresponding increase in both the isoforms were normalized first to GAPDH and the values obtained were averaged together to represent the total pool of either SIRT2 or SIRT7 in the bar graph (*P < 0.05).
To evaluate the role of Sirtuins during premature senescence, the expression level of various Sirtuin isoforms (SIRT1-7) was checked at both RNA and protein levels. In comparison to the untreated cells, the doxorubicin treated senescent U2OS cells, at 120 h, showed higher transcript levels of SIRT2, SIRT4, SIRT5 and SIRT6 (Fig. 1E). However, the expression level of SIRT1 decreased, while that of SIRT3 and SIRT7 remained unchanged. Next, the expression of several Sirtuin isoforms, with different subcellular localizations [SIRT1 (nuclear), SIRT2 (cytoplasmic), SIRT4 (mitochondrial), SIRT6 (nuclear) and SIRT7 (nucleolar)], were evaluated at protein level by immunoblot analysis (Fig. 1F). A significant increase in protein levels of both SIRT2 and SIRT4 was noted in doxorubicin induced senescent cells as compared to control non-senescent cells. These results agreed well with the increase in the transcript levels of both SIRT2 and SIRT4. SIRT2 mainly exists in 2 different isoforms [Isoform 1 (389 aa: 43 kDa) and isoform 2 (352 aa: 39 kDa)] and both these isoforms showed increased expression during senescence.28 It has to be noted that SIRT2 antibody identified both the isoforms on the immunoblot with almost similar intensity. For quantification, the fold increase for both the isoforms were calculated and their average was taken as the total increase in SIRT2 pool which was approximately 3 fold higher in senescent cells compared to the control (Fig. 1G). A significant decrease in the expression level of SIRT1 was noted in the senescent cells, while that of SIRT7 remained unchanged. In addition nuclear SIRT6 showed a subtle increase in senescent cells which was not significant.
Increased expression of SIRT2 is specific to senescence only and not associated with cell cycle arrest or cell death
The above results indicated that SIRT2 and SIRT4 increase as a general feature associated with stress induced premature senescence. We therefore inquired if increase in SIRT2 and SIRT4 can also occur under conditions of growth arrest other than senescence. Serum starvation can induce cell cycle arrest at G0/G1 phase also termed as quiescence. Hence, U2OS cells were cultured in the presence of 0.1% of serum for 96 h which resulted in G0/G1 arrest, in almost 80% of cells (Supplemental Fig. S2). Interestingly, the total levels of SIRT2 remained unaffected in conditions of serum starvation-induced growth arrest (Fig. 2A–C). However, the SIRT4 levels remained high under growth arrest conditions of both senescence and quiescence. Since expression of SIRT2, and not SIRT4, was specific to senescence, the latter part of the present work is focused only on SIRT2.
Figure 2.

Increased expression of SIRT2 is specific only to stress-induced premature senescence but not to conditions of quiescence, cell death, or G2/M phase cell cycle arrest. (A) Representative immunoblots showing expression levels of SIRT2, SIRT4 and p21 in control, doxorubicin (Dox) induced senescent cells (1 µM, 120 h) and serum starved growth arrested quiescent U2OS cells (0.1% serum, 96 h). (B, C) Bar diagram showing fold change in expression levels of total SIRT2 and SIRT4 in control, senescent and quiescent cells (*P < 0.05). (D) Flow cytometry analysis showing cell cycle phase distribution of U2OS cells treated with doxorubicin (Dox) and nocodazole (Noc), a specific mitotic inhibitor. Following nocodazole treatment (300 ng/ml, 16 h), the loosely attached cells were collected by shake off (Noc-F) method and adherent cells (Noc-A) by trypsinization. (E) Immunoblots showing expression of SIRT2 in doxorubicin induced senescent cells (72 h) and nocodazole (Noc-F and Noc-A) treated G2/M arrested cells (16 h). Note a mobility shift of SIRT2 isoforms (indicated by arrow) in nocodazole arrested G2/M cells. (F) SA-βgal staining of control and doxorubicin treated (0.1 µM, 1 µM and 10 µM) U2OS cells at 72 h. (G) Immunoblot showing expression of SIRT2, p21 and PARP cleavage in senescent inducing doses (0.1 µM, 1 µM) and cell death inducing dose (10 µM) of doxorubicin. Paclitaxel was used as positive control to induce programmed cell death. (H) Bar diagram showing fold change in expression level of total SIRT2 in control, doxorubicin and paclitaxel treated U2OS cells at 72 h (*P < 0.05).
The doxorubicin induced senescent cells were mostly growth arrested at G2/M phase of cell cycle, hence we investigated if increased levels of SIRT2 is dependent or independent of mitotic arrest. Cells were treated with nocodazole, which is a well-known inducer of mitotic arrest. When analyzed by flow cytometry both the adherent and loosely attached nocodazole treated cells showed considerable increase in G2/M arrest as did the doxorubicin-induced senescent cells (Fig. 2D). However an increase in SIRT2 protein levels was noted only in the doxorubicin induced senescent cells but not nocodazole arrested cells (Fig. 2E). Interestingly, the nocodazole treated cells showed slower mobility of SIRT2 when analyzed by SDS-PAGE, indicative of its change in phosphorylation status as reported earlier.29 This experiment clearly indicated that increased level of SIRT2 in doxorubicin treated cells is independent of G2/M arrest and specific for senescence. We next explored whether doxorubicin-mediated cell death is also associated with SIRT2 increase. Cells were treated with higher dose of doxorubicin (10 µM) which induced cell death (Fig. 2F) or a toxic dose of paclitaxel. Under both these conditions PARP cleavage was noted indicative of cell death and this in turn was accompanied with decline in SIRT2 levels (Fig. 2G and H). These results indicated increased expression of SIRT2 only during senescence, but not in other conditions of growth arrest or cell death.
The senescence-associated increase in SIRT2 levels was not limited to only U2OS cells alone, but could also be seen in doxorubicin-induced senescent cells of different origins such A375 (a human melanoma cell line) and A549 cells (a NSCLC cell line) (Supplemental Fig. S3).
Increase in SIRT2 level is associated with induction of stress-induced premature senescence but does not coincide with early induction of DNA damage
To check if SIRT2 expression coincides with induction of DNA damage, U2OS cells were treated with varying doses of doxorubicin for 4 h and levels of both SIRT2 and γH2AX were quantified (Fig. 3A). The levels of γH2AX increased significantly as early as 4 h after but not that of SIRT2, indicating that SIRT2 expression is not an early event following the genomic insult.
Figure 3.

SIRT2 increase in doxorubicin treated cells does not coincide with early DNA damage but associated with induction of senescence and correlates with expression of Lamin B1. (A) Immunoblots showing expression of SIRT2 and γH2AX at early time (4 h) point following treatment of U2OS cells with varying doses of doxorubicin (Dox). (B-D) Quantitative analysis of the time course of SIRT2, Lamin B1 and p21 expression levels during the induction of senescence following doxorubicin treatment. The bar graph represents the results of 3 independent experiments (*P < 0.05). (E) Increase in SIRT2 expression in doxorubicin induced senescent cells is accompanied with decrease in acetylation (Ac) status of its well-known targets, tubulin, p65 and histone H4, at their respective lysine residues. GAPDH and total histone H3 served as loading controls. (F-H) Bar graph showing fold change in acetylation status of tubulin, p65 and histone H4 following doxorubicin treatment at varying time intervals (*P < 0.05).
Next, to evaluate how early the SIRT2 expression is induced during the process of stress-induced premature senescence, a time course study was performed (Fig. 3B). Expression of SIRT2, Lamin B1 and SA-βgal positivity was monitored from 24 h to 120 h. A subtle increase in total SIRT2 and decline in Lamin B1 was discernible within 48 h of doxorubicin treatment (Fig. 3B–D). However, a maximal change in total SIRT2 level was noted at 72 h which also correlated with maximum cells showing positivity for SA-βgal assay (Supplemental Fig. S4). These changes persisted until 120 h by which time the cells had attained typical senescent morphology.
SIRT2 overexpression leads to deacetylation of its substrates in senescent U2OS cells
SIRT2 is a NAD+ dependent deacetylase and has many substrates which it can deacetylate.30 Hence, we evaluated whether increase in SIRT2 levels during senescence is also accompanied by changes in acetylation status of its downstream targets. As expected, the increase in SIRT2 levels during senescence was also associated with deacetylation of its targets, α-tubulin at lysine 40, histone H4 at lysine 16 (H4K16) and p65 at lysine 310 (Fig. 3E–H).
Increased expression of SIRT2 is associated with multiple conditions of senescence such as stress, replicative and oncogene-induced
Next, we determined whether elevated levels of SIRT2 are also associated with stress-associated senescence caused by DNA damaging agents, other than doxorubicin. U2OS cells were treated with camptothecin, etoposide and oxidative stress agent, H2O2. These agents too induced senescent morphology and this in turn was accompanied by an increase in expression levels of total SIRT2 at 120 h (Fig. 4A–C).
Figure 4.
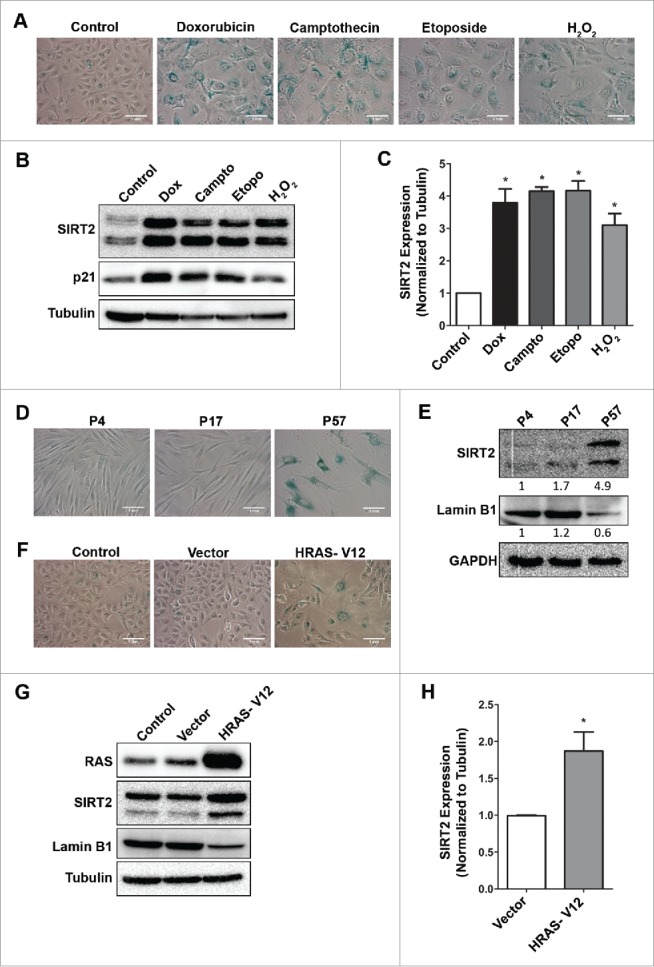
SIRT2 expression in various modes of senescent conditions viz., stress-, replicative- and oncogene- induced. (A) SA-βgal staining of U2OS cells at 120 h following treatment with DNA damaging agents such as doxorubicin (Dox, 1 µM, 2 h), camptothecin (Campto, 1 µM, 2 h), etoposide (Etopo, 1 µM, 72 h) or oxidative stress agent, H2O2 (200 µM, 2 h). (B) Immunoblots showing expression of SIRT2 and p21 in U2OS control and senescent cells (120 h) induced by various agents. (C) Bar diagram showing fold change in expression level of SIRT2 in stress-induced senescence by different agents (*P < 0.05). (D) SA-βgal activity in human primary adult dermal fibroblasts undergoing replicative senescence. (E) Immunoblots showing expression of SIRT2 and Lamin B1 in young (passage 4, 17) and senescent fibroblasts (passage 57). The values below the blots indicate the relative fold change in total SIRT2 and Lamin B1 levels. (F) SA-βgal staining in untransfected U2OS cells and transfected with either vector alone or mutant RAS (HRAS-V12). (G) Immunoblots showing expression of RAS, SIRT2 and Lamin B1 in the untransfected cells (U2OS) and those transfected with either vector or HRAS-V12. (H) Bar graph showing relative change in total SIRT2 levels in oncogene-induced senescent cells compared to vector control cells (*P < 0.05).
Replicative senescence in primary cell cultures and oncogene-induced senescence are two other modes by which cells undergo irreversible growth arrest. Does increased expression of SIRT2 also coincide with these two forms of senescence? An early passage (P4), of Human adult dermal fibroblasts (HADF) was passaged more than 50 times, until they stopped growing and showed typical senescence morphology of enlarged cells with SA-βgal positivity (P57) (Fig. 4D). HDAF cells undergoing replicative senescence showed increased SIRT2 levels with concomitant decline in Lamin B1 (Fig. 4E). Earlier it had been shown that U2OS cells expressing mutant RAS (HRAS-V12) undergoes oncogene-induced senescence.31 Indeed U2OS cells transfected with HRAS-V12 showed premature senescence (40-50% cells) accompanied with increased SIRT2 expression and concomitant decline in Lamin B1 (Fig. 4F–H). These results clearly indicated that increase in SIRT2 is a general feature associated with all modes of senescence.
Doxorubicin induced senescence is rescued by treatment with N-acetyl cysteine (NAC) which also restores SIRT2 levels toward normal
The doxorubicin mediated DNA damage has been previously shown to be abrogated by an antioxidant, N-acetyl cysteine (NAC).32 We therefore tested if NAC can rescue the cells from the effects of doxorubicin mediated premature senescence and thereby prevent increase in SIRT2 levels. Pre-treatment with NAC could effectively rescue U2OS cells from both doxorubicin and H2O2 induced senescence (Fig 5A and B). In addition, NAC treatment also attenuated the accumulation of SIRT2 due to stress-induced premature senescence (Fig 5C and D).
Figure 5.

Treatment with antioxidant NAC alleviated stress induced premature senescence by doxorubicin and hydrogen peroxide. (A) SA-βgal staining (blue) of cells treated with doxorubicin (0.2 µM) and H2O2 (200 µM) alone or in combination with NAC (50mM). Note fewer senescent cells in NAC treated cells. (B) Bar diagram showing percentage SA-βgal positive cells in various treatment conditions: control, doxorubicin (0.2 µM), H2O2 (200 µM) and in combination with NAC (50 mM). (C) Representative immunoblots showing expression of SIRT2 and p21 in doxorubicin (0.2 µM) and H2O2 (200 µM) treated U2OS cells alone or in combination with NAC (50 mM). Tubulin served as a loading control. Values below the blot indicate fold change in levels of p21 normalized to tubulin. (D) Bar diagram showing quantification of levels of SIRT2 in various treatment conditions. (*P <0.05).
SIRT2 expression in stress induced premature senescence is dependent on p53
The p53-p21 axis plays an important role in initiation of premature senescence and as noted in Fig. 1C, senescent U2OS cells showed accumulation of both p53 and its downstream target p21. Does p53 play a role in regulation of SIRT2 accumulation? Saos-2, a p53 null cell when treated with lower doses of doxorubicin [0.5 µM or 50 nM as described earlier by Chang et al., (1999) 33] also underwent growth arrest with morphological features similar to senescence such as enlarged morphology and SA-βgal positivity (Fig. 6A). The senescent Saos-2 cells did not show any increase in SIRT2 level thereby indicating a role of p53 in induction of SIRT2 (Fig. 6B).
Figure 6.

p53 regulates expression of SIRT2. (A) SA-βgal staining in p53 null cells (Saos-2) treated with doxorubicin (0.5 µM, 1 h or 50 nM, 48 h) at 120 h. (B) Immunoblots showing expression of total SIRT2 in control and senescent Saos-2 cells at 120 h. Values below the blot indicate fold change in total level of SIRT2 normalized to GAPDH. (C) U2OS cells transfected with either p53 shRNA or non-target shRNA (NT shRNA) were treated with doxorubicin (1 µM, 2 h) and SA-βgal staining was performed at 120 h. (D) Immunoblots showing expression of p53, SIRT2 and p21 in U2OS cells with or without p53 depletion (p53 shRNA) treated with varying doses of doxorubicin. (E) Quantification of fold change in expression of SIRT2 in NT shRNA and p53 depleted cells (*P < 0.05). (F) SA-βgal staining of U2OS cells treated with doxorubicin, and nutlin either alone or in combination. (G) Immunoblot analysis of p53, SIRT2 and p21 in U2OS cells treated with doxorubicin (0.2 µM, 2 h) and nutlin (5 µM) either alone or in combination. (H) Quantification of fold change of total SIRT2 in doxorubicin and nutlin treated U2OS cells either alone or together.
To further confirm the role of p53, U2OS cells were treated with shRNA for depletion of p53. The p53 shRNA treated cells showed almost 50% knockdown of p53 in comparison to the non-target shRNA treated U2OS cells (NT shRNA) which served as control (Fig. 6D). Surprisingly, p53 depleted cells and NT shRNA cells when treated with doxorubicin showed induction of premature senescence to similar extent as noted by morphology and SA-βgal positivity (Fig. 6C; Supplemental Fig. S5A). However, the knockdown of p53 largely prevented the doxorubicin induced SIRT2 expression in U2OS cells thereby establishing a role of p53 in induction of SIRT2 (Fig. 6D and E ).
Earlier we had shown that nutlin, a well-known inhibitor of p53-mdm2 interaction can abrogate the effects of SIRT7 by activating p53 levels.23 Hence, we asked the question whether nutlin can modulate p53 levels thereby regulating expression of during stress induced premature senescence. Treatment with nutlin not only stabilized p53 levels but also induced premature senescence which was accompanied with increase in levels of SIRT2 (Fig. 6F–H; Supplemental Fig. S5B). In addition, combined treatment with both doxorubicin and nutlin not only accelerated senescence but also showed higher level SIRT2 compared to treatment with nutlin or doxorubicin alone. Next, we overexpressed p53 in U2OS cells which lead to a subtle increase in SIRT2 levels (Supplemental Fig. S6). The above results clearly indicated that increased expression of SIRT2 in senescent cells is dependent on the p53 status.
As SIRT2 increase was specific only to senescence and not to quiescence or apoptosis, we checked the expression level of p53 in all these conditions and found that p53 level was high in senescence as compared to quiescence or apoptosis (Supplemental Fig. S7A and S7B). Additionally, p53 was more stabilized in senescence as indicated by its increased phosphorylation status, unlike in quiescence or apoptosis (Supplemental Fig. S7A). We also performed a dose and time kinetic experiment to evaluate if there is any difference in the expression of p53 and its phosphorylation levels in senescence and apoptosis. For this, U2OS cells were treated with either 1µM or 10 µM dose of doxorubicin to induce senescence or apoptosis respectively. At early time points (2-24 h) the total p53 level was significantly higher in 10 µm dose of doxorubicin compared to 1 µM dose (Supplemental Fig. S7C–S7E). On the other hand, the phosphorylated status of p53 remained similar for both 1 µm and 10 µm dose of doxorubicin at the early time points. At later time point, starting at 48 h, a decrease in the expression of total p53 level was observed as cells underwent apoptosis (10 µM dose) and this in turn was evident by PARP cleavage. Intriguingly, at later time point of 72 h, both the total and phosphoryated p53 level appeared maximum and significantly higher at the senescence inducing dose of 1µm compared to the 10 µM dose. Further the high levels of total p53 and its phosphorylation were sustained till 120 h during senescence (Supplemental Fig. S7A). It has to be noted that SIRT2 increase coincided with maximum p53 levels, at late time point of 72 h and persisted till 120 h (Figure 3B and C). Hence, we surmise a possible role of phosphorylated p53 together with high threshold level of total p53 in regulation of SIRT2 expression during senescence.
SIRT2 promoter has a p53 binding responsive site
It is well established that p53 acts a transcriptional regulator by binding to distinct promoter sites of the target genes. To elucidate whether p53 can also induce transcriptional activation of the SIRT2 gene, SIRT2 promoter region was screened for putative p53 response elements and indeed we found a p53 binding site (+ 348 to + 368 from transcription start site) in the SIRT2 promoter (Fig. 7A). Next, chromatin immunoprecipitation (ChIP) was done for this p53 target on SIRT2 promoter in control and senescent U2OS cells. p53-immunoprecipitated DNA was PCR amplified using SIRT2 primers that flanked the response elements and Real time PCR was performed for quantification of p53 binding. As a control, we also performed ChIP assay for p53 binding on the p21 promoter. Chromatin isolated from doxorubicin induced senescent cells showed a significant twofold increase in p53 immunocomplex at the SIRT2 promoter compared to control (Fig. 7B). Similarly a fourfold increase in the PCR product of p21 promoter region was noted in senescent cells (Fig. 7C). In addition to the ChIP assay, we also performed the SEAP assay (secreted alkaline phosphatase reporter gene) to evaluate the p53 binding on SIRT2 promoter. For this, we made use of 2 different promoter constructs into the SEAP reporter plasmid: one having the SIRT2 promoter site with intact p53 binding consensus region and another with SIRT2 promoter in which the p53 binding site was deleted. U2OS cells were treated with or without doxorubicin to induce senescence and after 72 h of treatment, cells were transfected with the SEAP reporter plasmid with SIRT2 promoter. The SEAP reporter with intact p53 binding site of SIRT2 promoter showed about two fold increase in alkaline phosphatase inducibility in senescent cells as compared to control cells. Intriguingly, the SEAP reporter with SIRT2 promoter lacking the p53 binding site showed only a poor response to SEAP activity in doxorubicin induced senescent cells. The reporter assay thus clearly indicated that binding of p53 to SIRT2 promoter site influences its transcription efficiency (Fig. 7D).
Figure 7.
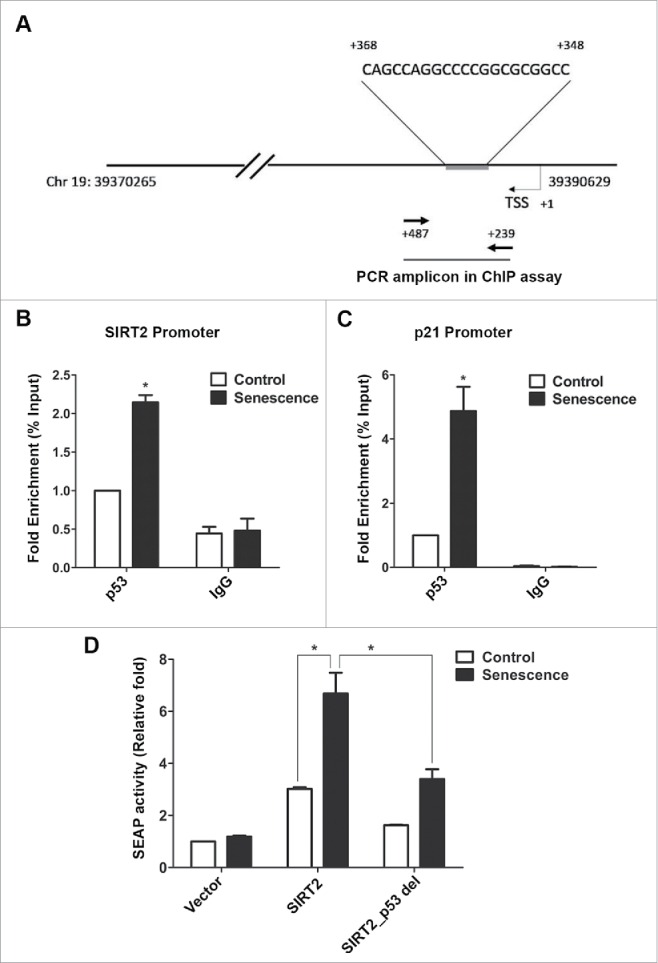
SIRT2 promoter has a p53 binding site. (A) Schematic representation of chromosome 19 showing location of SIRT2 gene (39370265-39390629 bp) and p53 binding site at its promoter region [+348 bp to +368 bp from transcription start site (TSS)]. Positions of primers used in ChIP assay are indicated by the arrows (+239 bp to +487 bp from TSS). (B, C) ChIP assay was performed in control and senescent U2OS cells using a p53 specific antibody or mouse IgG as control, followed by quantitative PCR with primers specific for SIRT2 and p21 promoter regions. Bar diagram indicates the fold enrichment of p53 binding at SIRT2/p21 promoter in control and doxorubicin induced senescent cells (*P < 0.05). (D) U2OS control and doxorubicin induced senescent cells were transfected with either SEAP plasmid alone (Vector) or with SEAP plasmid containg SIRT2 promoter with intact p53 binding site (SIRT2) or with deletion of p53 binding region (SIRT2_p53 del). Later at 24 h post transfection, SEAP assay was performed using the culture-conditioned medium from both control and senescent cells. Bar diagram indicates the SEAP activity (plotted as fold change over control) in control and senescent U2OS cells (* P < 0.05).
Overexpression or knockdown of SIRT2 in U2OS cells does not affect doxorubicin induced premature senescence
Next, it was tested if overexpression or depletion of SIRT2 in U2OS cells would have any consequences on doxorubicin-mediated stress-induced premature senescence? U2OS cells with stable overexpression of SIRT2 (SIRT2-GFP) and stable knockdown of SIRT2 (SIRT2 shRNA) were generated. The selection of the stable cell clones was confirmed by checking the expression levels of SIRT2 and the acetylation status of tubulin, a SIRT2 target. Indeed overexpression of SIRT2 showed a significant decrease in acetylation of tubulin (Fig. 8A). More than 50% reduction in SIRT2 occurred in depleted cells as compared to non-target control cells (NT shRNA) and was accompanied by increase in acetylation of tubulin (Fig. 8D). Cells showing stable overexpression or knockdown of SIRT2 were treated with various concentration of doxorubicin and senescence was monitored by morphology, SA-βgal positivity as well as expression of Lamin B1 and p21.
Figure 8.

Effect of SIRT2 overexpression or knockdown in regulation of stress induced premature senescence in U2OS cells. (A) Immunoblot showing expression of endogenous and exogenously overexpressed SIRT2 in U2OS cells transfected with either GFP or SIRT-GFP vector. Note a specific deacetylation of tubulin in SIRT2-GFP cells. (B) Bar graph represents the SA-βgal positive cells treated with varying doses doxorubicin (0.2 µM – 1 µM) in U2OS cells expressing either GFP or SIRT2-GFP, at 120 h. (C) Immunoblot showing expression of LaminB1 and p21 in SIRT2-GFP and GFP overexpressing cells treated with different doses of doxorubicin (Dox) at 120 h. (D) Immunoblot showing knockdown of SIRT2 following transfection of U2OS cells with specific shRNA for SIRT2 which was accompanied by increase in levels of acetylated (Ac) tubulin. Non target shRNA (NT shRNA) was used as a control. Values below the blot indicate fold change in levels of SIRT2 and acetylated tubulin normalized to GAPDH. (E) Percentage SA-βgal positive cells after doxorubicin treatment in non-target shRNA and SIRT2 shRNA U2OS cells at 120 h. (F) Immunoblots showing expression of Lamin B1 and p21 in SIRT2 depleted cells (SIRT2 shRNA) and control non target shRNA transfected cells (NT shRNA) treated with different doses of doxorubicin at 120 h. (G) Immunoblot showing SIRT2 expression at 120 h following doxorubicin treatment in control (NT shRNA) and SIRT2 depleted cells (SIRT2 shRNA). (H) Quantification of SIRT2 levels after doxorubicin treatment (0.1 µM and 1 µM) in control (NT shRNA) and SIRT2 depleted cells (SIRT2 shRNA) at 120 h (*P < 0.05).
The number of SA-βgal positive senescent cells were similar in SIRT2-GFP and control GFP cells treated with doxorubicin (Fig. 8B; Supplemental Fig. S8A). Further, there was no appreciable difference in level of senescence-associated marker, Lamin B1 in the SIRT2-GFP and control GFP senescent cells (Fig. 8C; Supplemental Fig. S8B and S8C). The doxorubicin treated SIRT2 overexpressing cells showed a considerable decrease in p21 levels which was unable to prevent the induction of senescence. Similarly, the number of SA-βgal positive cells were similar in both the NT shRNA and SIRT2 depleted cells treated with doxorubicin (Fig. 8E; Supplemental Fig. S8D). This was corroborated by immunoblots which showed unchanged levels of senescent markers, Lamin B1 and p21 (Fig. 8F; Supplemental Fig. S8E and S8F). Further, the SIRT2 depleted cells showed increase in SIRT2 levels in doxorubicin treated cells albeit at lower level compared to non-target control cells (Fig. 8G and H). The above results clearly indicated that SIRT2 overexpression or its depletion had no consequence as such on stress induced premature senescence in doxorubicin treated U2OS cells. Additionally, it was also noted that cells treated with HDAC inhibitor, sodium butyrate showed no modulation in reversal of senescence (Supplemental Fig. S9).
Discussion
Sirtuins can deacetylate many targets involved in various biological processes such as transcriptional control, cellular signaling, chromatin remodeling. DNA repair, cell survival etc. At least in lower organisms Sirtuins have been shown to promote longevity although this effect is controversial.24,25 In general loss of Sirtuin is considered a phenomenon associated with aging, while its activation prevents the process of aging. Contrary to this generality, the present work demonstrates increase level of SIRT2 as a bonafide marker associated with senescent cells. Using a doxorubicin induced model of stress induced premature senescence, we found that the induction of the senescence phenotype is accompanied not only by increased expression of SIRT2 but also by a concomitant decline in the acetylation status of its downstream targets such as tubulin, NF-κB and H4K16. The senescence-associated increase in SIRT2 was not limited to DNA damage induced senescence, but was also a marked feature of replicative and oncogene (RAS) induced senescence under in vitro conditions.
Senescence-associated SIRT2 expression is independent of G2/M phase of cell cycle arrest
SIRT2 is predominantly a cytoplasmic protein, however it actively shuttles into the nucleus.34 It had been previously reported that SIRT2 immunoreactivity increased in the G2/M phase of the cell cycle and this in turn was attributed to its increased phosphorylation status. Closer examination of immunoblots in our study revealed that indeed both the SIRT2 isoforms run as a doublet indicative of phosphorylation. As doxorubicin induced senescent cells were predominantly in G2/M state of cell cycle, one can argue SIRT2 levels increased because of cell cycle arrest and not due to senescence. However, we ruled this out as synchronization of cells in G2/M phase following nocodazole treatment resulted in no increase in total SIRT2 levels. However, we did find that nocodazole treatment caused a mobility shift of SIRT2 bands on immunoblots, indicative of changes in its phosphorylation status. Additionally, cells undergoing either replicative- or oncogene- induced senescence, which were mostly arrested in the G0/G1 phase of the cell cycle, also showed increased levels of SIRT2. This indicates that SIRT2 accumulation during senescence is not due to cell cycle phase dependent growth arrest. Further, cells subjected to serum starvation and arrested in quiescence (G0/G1) did not show increased SIRT2 levels, thereby supporting the conclusion that SIRT2 accumulation is a senescence specific feature.
Senescence-associated SIRT2 expression does not coincide with the early event of DNA damage but instead associated with the onset of senescence and dependent on p53 status
Increase in levels of DNA damage marker, γH2AX, preceded the appearance of SIRT2 in doxorubicin-induced premature senescence. Thereby indicating that it is not an early event associated with DNA damage. Instead, the increased expression of SIRT2 levels coincided well with the decrease in Lamin B1, a senescent-associated marker at later time points. Further, cells treated with a high dose of doxorubicin which induced massive DNA damage did not exhibit an increase in SIRT2. The time kinetics experiment with doxorubicin clearly demonstrated that increased level of SIRT2 was a specific event associated with onset of senescence. Further, induction of senescence could be rescued efficiently by pre-treatment with NAC which also lowered the SIRT2 levels. In addition a link between SIRT2 induction and p53 status emerged in the present study. Chromatin immunoprecipitation assay proved that p53 regulates SIRT2 transcriptional activation during senescence. Additionally, the SEAP reporter assay showed that presence of p53 binding site on SIRT2 promoter strongly regulated SIRT2 expression. An interesting observation in the present study was that, while p53 induction occurred during doxorubicin induced cell death and cell cycle arrest, an increase in SIRT2 level was specific only to conditions of premature senescence. A dose and time kinetics experiment on induction and phosphorylation status of p53 indicated that unlike the early time points, both the total and phosphoryated p53 level were maximum and significantly higher at the late time points in the senescence inducing dose compared to apoptotic dose of doxorubicin. We therefore surmise that a maximum threshold expression of the p53 may be needed for SIRT2 promoter occupancy and hence a specific expression of SIRT2 at the late time points coincided with induction of senescence.
Is SIRT2 induction a cause or effect of senescence?
The increase in SIRT2 levels in replicative-, stress- and oncogene-induced senescence raised the question of whether induction of SIRT2 is a primary cause or merely a downstream effect of the senescence-associated process. Experimental evidence indicated that SIRT2 overexpression or its depletion affected neither promotion nor alleviation of doxorubicin induced premature senescence. However, an underlying feature of doxorubicin mediated premature senescence was induction of SIRT2 in cells with partial knockdown of endogenous SIRT2. These results clearly indicated that SIRT2 in general does not influence senescence but that its induction is an event concomitant with the process of senescence. Our results are partly similar to work reported by Dreesen et al., (2013)35 where loss of Lamin B1 was not a cause of senescence but only a consequence associated with process of aging.
Previous reports on the role of SIRT2 expression in aging or senescence have been contradictory. In mouse brain 3 different isoforms of SIRT2 have been detected, SIRT2.1, 2.2. and 2.3, of which the 2.3 isoform showed an increase with age in the central nervous system.28 However, a recent report indicated that increase in SIRT2 levels in aged rat brain is specific only to occipital region and no other regions.36 In contrast to the results of our study, a recent report by Kilic Eren et al., (2015) 37 showed decrease in SIRT2 levels in resveratrol induced premature senescence in human fibroblasts. Thus, the reports are contradictory and in general the published reports till now point toward role of SIRT2 loss or overexpression as a cause for senescence induction.
However, an in depth analysis in the present work revealed that SIRT2 is neither responsible for induction or prevention of senescence, instead it is a protein abundantly expressed during the onset of senescent phenomenon. In such a scenario, what is the role of SIRT2 in senescence? Our results have clearly demonstrated that increase in SIRT2 in senescence is associated with changes in acetylation status of its downstream targets such as tubulin, NF-κB and H4K16 levels. In fact, H4K16 deacetylation has been reported earlier in senescent cells.38 Thus, we surmise that increase in SIRT2 might help in maintaining the senescent state by regulating (a) the tubulin dynamics for the enlarged senescent morphology and (b) the chromatin dynamics, by deacetylation of histone H4/ NF-κB for senescent-associated gene expression. Further, it has to be seen if SIRT2 induction has any role in later process of senescence such as the clearing of the senescent cell itself.
In conclusion, whatever the functional significance of the increase in SIRT2, the data supports the identification of SIRT2 as a novel senescence-associated marker which can be used in conjunction with Lamin B1 to identify senescent cells with wild type p53 status.
Materials and methods
Cell lines
U2OS (p53+/+) and Saos-2 cells (p53−/−) were a kind gift by Dr. Renu Wadhwa (AIST, Japan) and primary dermal fibroblasts (p53 wild type) of human origin were purchased from HiMedia, India. The cells were maintained in DMEM supplemented with 10% FBS, 100 mg/ml penicillin and 100 mg/ml streptomycin and 2.5 mM L-glutamine at 37°C with 5% CO2 in a humidified incubator.
Reagents and treatment of cells
U2OS cells were treated with either 1 µM or 10 µM for 2 h to induce senescence or cell death respectively. Cells were also treated with nocodazole (300 ng/ml) and nutlin (5 µM). U2OS cells were pretreated with nutlin for 1 h, then in combination with doxorubicin (0.2 µM) for 2 h. Later, doxorubicin was replaced by fresh media with or without nutlin for 120 h. For the rescue of doxorubicin induced premature senescence, U2OS cells were pretreated with 50 mM NAC for 1 h, then in combination with doxorubicin (0.2 µM) for 2 h. Cells were further treated with NAC for 1 h without doxorubicin followed by cultured in fresh media for 120 h. Saos-2 cells were treated with doxorubicin (0.5 µM or 50 nM) to induce senescence. U2OS control and doxorubicin induced senescent cells (after 72 h of doxorubicin treatment) were treated with different concentrations of HDAC inhibitor, sodium butyrate (NaB) for 6 h before cell lysates were prepared. All the reagents were obtained from Sigma-Aldrich.
Cell cycle analysis using flow cytometry
Cells were fixed with 70% ethanol-methanol solution (1:1), stained with propidium iodide solution containing 50 µg/ml RNAase A and analyzed using a flow cytometer (Accuri C6 cytometer, BD Biosciences).
Senescence-associated β-galactosidase (SA-βgal) assay
Staining for SA-βgal activity was performed as described previously by Dimri et al., (1995).10 Cell stained with characteristic blue color after staining with the X-gal substrate solution was observed microscopically and counted.
RNA extraction and quantitative Real-Time Polymerase Chain Reaction (Q-RT-PCR)
RNA was isolated from the control and senescent U2OS cells by the TRIzol (Invitrogen) method according to manufacturer's protocol. 2 µg of the isolated RNA was taken for cDNA preparation using Superscript III (Invitrogen). Quantitative RT-PCR was performed using “MESA GREEN qPCR MasterMix Plus” (Eurogentec) and detected on an ABI PRISM 7500 detection system (Applied Biosystems). Relative fold change was calculated using the formula 2-ΔΔCt.39 The primer sequences are provided in Supplemental Table S1.
Cell lysates preparation and immunoblotting
Briefly the cellular homogenate was prepared in Nonidet P-40 lysis buffer containing protease inhibitors (1mM PMSF, 1 µg/ml aprotinin, 1 µg/ml leupeptin) and phosphatase inhibitors (1 mM sodium orthovanadate, 10 mM sodium fluoride). Equal amount of protein was separated on 10 – 12% SDS–polyacrylamide gels, transferred to PVDF membrane, blocked in 5% milk and incubated with respective primary antibodies (Supplemental Table S2). Blots were then probed with secondary antibody conjugated with Horse-Radish Peroxidase (HRP) (Bangalore Genei) and signals were detected using femtoLUCENT™ PLUS-HRP kit (G-Biosciences) on chemiluminescence detection system (Proteinsimple).
Plasmid constructs, transfections and generation of stable cell clones
Full length SIRT2 was PCR amplified from a pcDNADEST47-SIRT2 construct obtained from Dr. I. Horikawa (NIH, USA). The PCR amplified full length SIRT2 was then cloned into plasmid EGFP-C3 (Clonetech, Mountain View, CA, USA), followed by recloning into a pCX4Neo vector (kind gift of Dr. Renu Wadhwa, AIST, Japan). The HRAS-V12 plasmid was a kind gift of Dr. A.Rangarajan (IISc, Banglaore, India) which too was recloned in pCX4Neo vector. Total RNA from U2OS cell was prepared, cDNA was synthesized and full length TP53 gene was PCR amplified and cloned in pCX4Neo vector. For SIRT2 and p53 knockdown, shRNA plasmids targeting various regions of gene (Mission shRNA, Sigma, USA) were pooled together. All the transfections were performed as described earlier (Kiran et al., 2015). Single cell clones were selected for stable overexpression and knockdown after dilution plating.
Chromatin immunoprecipitation (ChIP)
ChIP assay was done as described in Chromatin Immunoprecipitation (ChIP) Assay Kit (Millipore, Catalog # 17-295) with few modifications. Briefly, chromatin from control and doxorubicin-induced senescent U2OS cells were incubated with p53 (Santa Cruz, sc-126 X) and IgG (Sigma) antibodies overnight at 4°C with rotation followed by incubation with Protein A/G beads (Santa Cruz) for 3 h at 4°C. The precipitated DNA fragments were analyzed by Real Time PCR using primers containing the p53 binding sites at SIRT2 promoter. Binding sites for p53 on SIRT2 promoter were obtained from Qiagen website. p21 promoter was used as positive control for p53 binding.40 Primers used in the assay were as follows: SIRT2 (AACCCACCAGCCTAGCGAT and ACACAGTGGTTGGTGACGGG); p21 (CTGGACTGGGCACTCTTGTC and CTCCTACCATCCCCTTCCTC).
Secretory alkaline phosphatase (SEAP) reporter assay
The promoter region of SIRT2 (−50 to +487) including the p53 binding site was cloned into pSEAP2-basic vector between KpnI and XhoI restriction sites. Additionally, we also cloned in the pSEAP vector the SIRT2 promoter with deletion of p53 binding site (+348 to +368, SIRT2_p53 del). The primers used for cloning of SIRT2 promoter in SEAP plasmid were as follows: 5′-CATGGTACCCCTGACCAATCAGAGTATTCG-3′ (forward) and 5′- CTACTCGAGAACCCACCAGCCTAGCGATAC −3′ (reverse). U2OS cells were treated with doxorubicin (1 μM, 2 h) to induce senescence. After 72 h of treatment, U2OS cells were transfected with SIRT2 promoter-SEAP plasmid, SIRT2_p53 del promoter-SEAP plasmid or vector control (1 μg/well in a 24-well plate) using lipofectamine 2000 for 6 h. After culturing the cells for another 24 h in fresh media, culture-conditioned medium was collected and 25 μl of medium was analyzed with 4-methyl umbelliferyl phosphate as substrate, for alkaline phosphatase activity as per CLONTECH protocol.
Quantification of blots and statistical analysis
The immunoblots were quantified by densitometry using ImageQuant TL software (GE Healthcare) and ImageJ software (NIH) on the basis of band intensities. All experiments were done in triplicate and results were presented as mean ± SD. P-values were calculated by 2 tailed Student's t-test in GraphPad and differences were considered statistically significant for p-value less than 0.05.
Supplementary Material
Disclosure of potential conflicts of interest
No potential conflicts of interest were disclosed.
Acknowledgments
We acknowledge the help of Dr Lucy M Anderson in critically reading and editing the manuscript. We thank the anonymous reviewers for their comments which helped in improving the manuscript.
Author contributions
GR conceived the concept and designed experiments with TA. All the experiments were performed by TA. SK provided inputs for ChIP experiments. TA and GR wrote the manuscript together.
Funding
TA is the recipient of Junior and Senior Research Fellowships of the University Grants Commission toward the pursuit of a PhD degree of the Manipal University. GR's and SK's laboratories are supported by extramural grant from the Department of Biotechnology, India (BT/PR4062/MED9/97/48/2011).
References
- [1].Harley CB, Futcher AB, Greider CW. Telomeres shorten during ageing of human fibroblasts. Nature 1990; 345:458-60; PMID:2342578; http://dx.doi.org/ 10.1038/345458a0 [DOI] [PubMed] [Google Scholar]
- [2].Chen J-H, Ozanne SE, Hales CN. Methods of cellular senescence induction using oxidative stress. Methods Mol Biol 2007; 371:179-89; PMID:17634582; http://dx.doi.org/ 10.1007/978-1-59745-361-5_14 [DOI] [PubMed] [Google Scholar]
- [3].Di Leonardo A, Linke SP, Clarkin K, Wahl GM. DNA damage triggers a prolonged p53-dependent G1 arrest and long-term induction of Cip1 in normal human fibroblasts. Genes Dev 1994; 8:2540-51; PMID:7958916; http://dx.doi.org/ 10.1101/gad.8.21.2540 [DOI] [PubMed] [Google Scholar]
- [4].Serrano M, Lin AW, McCurrach ME, Beach D, Lowe SW. Oncogenic ras provokes premature cell senescence associated with accumulation of p53 and p16INK4a. Cell 1997; 88:593-602; PMID:9054499; http://dx.doi.org/ 10.1016/S0092-8674(00)81902-9 [DOI] [PubMed] [Google Scholar]
- [5].Alimonti A, Nardella C, Chen Z, Clohessy JG, Carracedo A, Trotman LC, Cheng K, Varmeh S, Kozma SC, Thomas G, et al.. A novel type of cellular senescence that can be enhanced in mouse models and human tumor xenografts to suppress prostate tumorigenesis. J Clin Invest 2010; 120:681-93; PMID:20197621; http://dx.doi.org/ 10.1172/JCI40535 [DOI] [PMC free article] [PubMed] [Google Scholar]
- [6].Campisi J, d'Adda di Fagagna F. Cellular senescence: when bad things happen to good cells. Nat Rev Mol Cell Biol 2007; 8:729-40; PMID:17667954; http://dx.doi.org/ 10.1038/nrm2233 [DOI] [PubMed] [Google Scholar]
- [7].Dimauro T, David G. Chromatin modifications: the driving force of senescence and aging? Aging (Albany NY) 2009; 1:182-90; PMID:20157508; http://dx.doi.org/ 10.18632/aging.100023 [DOI] [PMC free article] [PubMed] [Google Scholar]
- [8].Prieur A, Besnard E, Babled A, Lemaitre J-M. p53 and p16(INK4A) independent induction of senescence by chromatin-dependent alteration of S-phase progression. Nat Commun 2011; 2:473; PMID:21915115; http://dx.doi.org/ 10.1038/ncomms1473 [DOI] [PubMed] [Google Scholar]
- [9].Mao Z, Ke Z, Gorbunova V, Seluanov A. Replicatively senescent cells are arrested in G1 and G2 phases. Aging (Albany NY) 2012; 4:431-5; PMID:22745179; http://dx.doi.org/ 10.18632/aging.100467 [DOI] [PMC free article] [PubMed] [Google Scholar]
- [10].Dimri GP, Lee X, Basile G, Acosta M, Scott G, Roskelley C, Medrano EE, Linskens M, Rubelj I, Pereira-Smith O. A biomarker that identifies senescent human cells in culture and in aging skin in vivo. Proc Natl Acad Sci U S A 1995; 92:9363-7; PMID:7568133; http://dx.doi.org/ 10.1073/pnas.92.20.9363 [DOI] [PMC free article] [PubMed] [Google Scholar]
- [11].Freund A, Laberge R-M, Demaria M, Campisi J. Lamin B1 loss is a senescence-associated biomarker. Mol Biol Cell 2012; 23:2066-75; PMID:22496421; http://dx.doi.org/ 10.1091/mbc.E11-10-0884 [DOI] [PMC free article] [PubMed] [Google Scholar]
- [12].Hildebrand DG, Lehle S, Borst A, Haferkamp S, Essmann F, Schulze-Osthoff K. α-Fucosidase as a novel convenient biomarker for cellular senescence. Cell Cycle 2013; 12:1922-7; PMID:23673343; http://dx.doi.org/ 10.4161/cc.24944 [DOI] [PMC free article] [PubMed] [Google Scholar]
- [13].Kosar M, Bartkova J, Hubackova S, Hodny Z, Lukas J, Bartek J. Senescence-associated heterochromatin foci are dispensable for cellular senescence, occur in a cell type- and insult-dependent manner and follow expression of p16(ink4a). Cell Cycle 2011; 10:457-68; PMID:21248468; http://dx.doi.org/ 10.4161/cc.10.3.14707 [DOI] [PubMed] [Google Scholar]
- [14].Rodier F, Campisi J. Four faces of cellular senescence. J Cell Biol 2011; 192:547-56; PMID:21321098; http://dx.doi.org/ 10.1083/jcb.201009094 [DOI] [PMC free article] [PubMed] [Google Scholar]
- [15].Kaeberlein M, McVey M, Guarente L. The SIR2/3/4 complex and SIR2 alone promote longevity in Saccharomyces cerevisiae by two different mechanisms. Genes Dev 1999; 13:2570-80; PMID:10521401; http://dx.doi.org/ 10.1101/gad.13.19.2570 [DOI] [PMC free article] [PubMed] [Google Scholar]
- [16].Rogina B, Helfand SL. Sir2 mediates longevity in the fly through a pathway related to calorie restriction. Proc Natl Acad Sci U S A 2004; 101:15998-6003; PMID:15520384; http://dx.doi.org/ 10.1073/pnas.0404184101 [DOI] [PMC free article] [PubMed] [Google Scholar]
- [17].Tissenbaum HA, Guarente L. Increased dosage of a sir-2 gene extends lifespan in Caenorhabditis elegans. Nature 2001; 410:227-30; PMID:11242085; http://dx.doi.org/ 10.1038/35065638 [DOI] [PubMed] [Google Scholar]
- [18].Michishita E, Park JY, Burneskis JM, Barrett JC, Horikawa I. Evolutionarily conserved and nonconserved cellular localizations and functions of human SIRT proteins. Mol Biol Cell 2005; 16:4623-35; PMID:16079181; http://dx.doi.org/ 10.1091/mbc.E05-01-0033 [DOI] [PMC free article] [PubMed] [Google Scholar]
- [19].Langley E, Pearson M, Faretta M, Bauer U-M, Frye RA, Minucci S, Pelicci PG, Kouzarides T. Human SIR2 deacetylates p53 and antagonizes PML/p53-induced cellular senescence. EMBO J 2002; 21:2383-96; PMID:12006491; http://dx.doi.org/ 10.1093/emboj/21.10.2383 [DOI] [PMC free article] [PubMed] [Google Scholar]
- [20].Chua KF, Mostoslavsky R, Lombard DB, Pang WW, Saito S, Franco S, Kaushal D, Cheng H-L, Fischer MR, Stokes N, et al.. Mammalian SIRT1 limits replicative life span in response to chronic genotoxic stress. Cell Metab 2005; 2:67-76; PMID:16054100; http://dx.doi.org/ 10.1016/j.cmet.2005.06.007 [DOI] [PubMed] [Google Scholar]
- [21].Mostoslavsky R, Chua KF, Lombard DB, Pang WW, Fischer MR, Gellon L, Liu P, Mostoslavsky G, Franco S, Murphy MM, et al.. Genomic instability and aging-like phenotype in the absence of mammalian SIRT6. Cell 2006; 124:315-29; PMID:16439206; http://dx.doi.org/ 10.1016/j.cell.2005.11.044 [DOI] [PubMed] [Google Scholar]
- [22].Kiran S, Chatterjee N, Singh S, Kaul SC, Wadhwa R, Ramakrishna G. Intracellular distribution of human SIRT7 and mapping of the nuclear/nucleolar localization signal. FEBS J 2013; 280:3451-66; PMID:23680022; http://dx.doi.org/ 10.1111/febs.12346 [DOI] [PubMed] [Google Scholar]
- [23].Kiran S, Oddi V, Ramakrishna G. Sirtuin 7 promotes cellular survival following genomic stress by attenuation of DNA damage, SAPK activation and p53 response. Exp Cell Res 2015; 331:123-41; PMID:25445786; http://dx.doi.org/ 10.1016/j.yexcr.2014.11.001 [DOI] [PubMed] [Google Scholar]
- [24].Burnett C, Valentini S, Cabreiro F, Goss M, Somogyvári M, Piper MD, Hoddinott M, Sutphin GL, Leko V, McElwee JJ, et al.. Absence of effects of Sir2 overexpression on lifespan in C. elegans and Drosophila. Nature 2011; 477:482-5; PMID:21938067; http://dx.doi.org/ 10.1038/nature10296 [DOI] [PMC free article] [PubMed] [Google Scholar]
- [25].Kaeberlein M, McDonagh T, Heltweg B, Hixon J, Westman EA, Caldwell SD, Napper A, Curtis R, DiStefano PS, Fields S, et al.. Substrate-specific activation of sirtuins by resveratrol. J Biol Chem 2005; 280:17038-45; PMID:15684413; http://dx.doi.org/ 10.1074/jbc.M500655200 [DOI] [PubMed] [Google Scholar]
- [26].Eom Y-W, Kim MA, Park SS, Goo MJ, Kwon HJ, Sohn S, Kim W-H, Yoon G, Choi KS. Two distinct modes of cell death induced by doxorubicin: apoptosis and cell death through mitotic catastrophe accompanied by senescence-like phenotype. Oncogene 2005; 24:4765-77; PMID:15870702; http://dx.doi.org/ 10.1038/sj.onc.1208627 [DOI] [PubMed] [Google Scholar]
- [27].Scott IS, Morris LS, Bird K, Davies RJ, Vowler SL, Rushbrook SM, Marshall AE, Laskey RA, Miller R, Arends MJ, et al.. A novel immunohistochemical method to estimate cell-cycle phase distribution in archival tissue: implications for the prediction of outcome in colorectal cancer. J Pathol 2003; 201:187-97; PMID:14517835; http://dx.doi.org/ 10.1002/path.1444 [DOI] [PubMed] [Google Scholar]
- [28].Maxwell MM, Tomkinson EM, Nobles J, Wizeman JW, Amore AM, Quinti L, Chopra V, Hersch SM, Kazantsev AG. The Sirtuin 2 microtubule deacetylase is an abundant neuronal protein that accumulates in the aging CNS. Hum Mol Genet 2011; 20:3986-96; PMID:21791548; http://dx.doi.org/ 10.1093/hmg/ddr326 [DOI] [PMC free article] [PubMed] [Google Scholar]
- [29].North BJ, Verdin E. Mitotic regulation of SIRT2 by cyclin-dependent kinase 1-dependent phosphorylation. J Biol Chem 2007; 282:19546-55; PMID:17488717; http://dx.doi.org/ 10.1074/jbc.M702990200 [DOI] [PubMed] [Google Scholar]
- [30].De Oliveira RM, Sarkander J, Kazantsev AG, Outeiro TF. SIRT2 as a Therapeutic Target for Age-Related Disorders. Front Pharmacol 2012; 3:82; PMID:22563317; http://dx.doi.org/ 10.3389/fphar.2012.00082 [DOI] [PMC free article] [PubMed] [Google Scholar]
- [31].Singh R, Kalra RS, Hasan K, Kaul Z, Cheung CT, Huschtscha L, Reddel RR, Kaul SC, Wadhwa R. Molecular characterization of collaborator of ARF (CARF) as a DNA damage response and cell cycle checkpoint regulatory protein. Exp Cell Res 2014; 322:324-34; PMID:24485912; http://dx.doi.org/ 10.1016/j.yexcr.2014.01.022 [DOI] [PubMed] [Google Scholar]
- [32].Kurz EU, Douglas P, Lees-Miller SP. Doxorubicin activates ATM-dependent phosphorylation of multiple downstream targets in part through the generation of reactive oxygen species. J Biol Chem 2004; 279:53272-81; PMID:15489221; http://dx.doi.org/ 10.1074/jbc.M406879200 [DOI] [PubMed] [Google Scholar]
- [33].Chang BD, Broude E V, Dokmanovic M, Zhu H, Ruth A, Xuan Y, Kandel ES, Lausch E, Christov K, Roninson IB. A senescence-like phenotype distinguishes tumor cells that undergo terminal proliferation arrest after exposure to anticancer agents. Cancer Res 1999; 59:3761-7; PMID:10446993 [PubMed] [Google Scholar]
- [34].North BJ, Verdin E. Interphase nucleo-cytoplasmic shuttling and localization of SIRT2 during mitosis. PLoS One 2007; 2:e784; PMID:17726514; http://dx.doi.org/ 10.1371/journal.pone.0000784 [DOI] [PMC free article] [PubMed] [Google Scholar]
- [35].Dreesen O, Chojnowski A, Ong PF, Zhao TY, Common JE, Lunny D, Lane EB, Lee SJ, Vardy LA, Stewart CL, et al.. Lamin B1 fluctuations have differential effects on cellular proliferation and senescence. J Cell Biol 2013; 200:605-17; PMID:23439683; http://dx.doi.org/ 10.1083/jcb.201206121 [DOI] [PMC free article] [PubMed] [Google Scholar]
- [36].Braidy N, Poljak A, Grant R, Jayasena T, Mansour H, Chan-Ling T, Smythe G, Sachdev P, Guillemin GJ. Differential expression of sirtuins in the aging rat brain. Front Cell Neurosci 2015; 9:167; PMID:26005404; http://dx.doi.org/ 10.3389/fncel.2015.00167 [DOI] [PMC free article] [PubMed] [Google Scholar]
- [37].Kilic Eren M, Kilincli A, Eren Ö. Resveratrol Induced Premature Senescence Is Associated with DNA Damage Mediated SIRT1 and SIRT2 Down-Regulation. PLoS One 2015; 10:e0124837; PMID:25924011; http://dx.doi.org/ 10.1371/journal.pone.0124837 [DOI] [PMC free article] [PubMed] [Google Scholar]
- [38].Contrepois K, Thuret J-Y, Courbeyrette R, Fenaille F, Mann C. Deacetylation of H4-K16Ac and heterochromatin assembly in senescence. Epigenetics Chromatin 2012; 5:15; PMID:22932127; http://dx.doi.org/ 10.1186/1756-8935-5-15 [DOI] [PMC free article] [PubMed] [Google Scholar]
- [39].Livak KJ, Schmittgen TD. Analysis of relative gene expression data using real-time quantitative PCR and the 2(−Delta Delta C(T)) Method. Methods 2001; 25:402-8; http://dx.doi.org/ 10.1006/meth.2001.1262 [DOI] [PubMed] [Google Scholar]
- [40].Sen N, Satija YK, Das S. PGC-1α, a key modulator of p53, promotes cell survival upon metabolic stress. Mol Cell 2011; 44:621-34; PMID:22099309; http://dx.doi.org/ 10.1016/j.molcel.2011.08.044 [DOI] [PubMed] [Google Scholar]
Associated Data
This section collects any data citations, data availability statements, or supplementary materials included in this article.