

Abstract
Background
The geometric organization of myocytes in the ventricular wall comprises the structural underpinnings of cardiac mechanical function. Cardiac myosin binding protein‐C (MYBPC3) is a sarcomeric protein, for which phosphorylation modulates myofilament binding, sarcomere morphology, and myocyte alignment in the ventricular wall. To elucidate the mechanisms by which MYBPC3 phospho‐regulation affects cardiac tissue organization, we studied ventricular myoarchitecture using generalized Q‐space imaging (GQI). GQI assessed geometric phenotype in excised hearts that had undergone transgenic (TG) modification of phospho‐regulatory serine sites to nonphosphorylatable alanines (MYBPC3AllP−/(t/t)) or phospho‐mimetic aspartic acids (MYBPC3AllP+/(t/t)).
Methods and Results
Myoarchitecture in the wild‐type (MYBPC3WT) left‐ventricle (LV) varied with transmural position, with helix angles ranging from −90/+90 degrees and contiguous circular orientation from the LV mid‐myocardium to the right ventricle (RV). Whereas MYBPC3AllP+/(t/t) hearts were not architecturally distinct from MYBPC3WT, MYBPC3AllP−/(t/t) hearts demonstrated a significant reduction in LV transmural helicity. Null MYBPC3(t/t) hearts, as constituted by a truncated MYBPC3 protein, demonstrated global architectural disarray and loss in helicity. Electron microscopy was performed to correlate the observed macroscopic architectural changes with sarcomere ultrastructure and demonstrated that impaired phosphorylation of MYBPC3 resulted in modifications of the sarcomere aspect ratio and shear angle. The mechanical effect of helicity loss was assessed through a geometric model relating cardiac work to ejection fraction, confirming the mechanical impairments observed with echocardiography.
Conclusions
We conclude that phosphorylation of MYBPC3 contributes to the genesis of ventricular wall geometry, linking myofilament biology with multiscale cardiac mechanics and myoarchitecture.
Keywords: basic studies, echocardiography, genetically altered mice, heart failure, magnetic resonance imaging, quantitative modeling
Subject Categories: Cardiomyopathy, Magnetic Resonance Imaging (MRI), Animal Models of Human Disease, Genetically Altered and Transgenic Models
Introduction
Geometric alignment of cardiac myocytes (architectural phenotype) in the ventricular wall constitutes an anatomical template upon which myocyte contractility and electrical conductivity are believed to occur. Accordingly, altered geometric patterns across the ventricular wall (pathological architectural phenotype) may constitute a novel metric predictive of pump failure in the setting of cardiomyopathy. A feature common to many forms of heart failure is impairment of the regulatory machinery affecting the mechanics1 and spatial organization2, 3 of the cardiac sarcomere. Mutations of the cardiac myosin binding protein‐C (MYBPC3), for example, are associated with congenital and acquired cardiac disease4, 5, 6 characterized by increased left ventricle (LV) mass and myofibrillar disarray.7 A point of convergence for multiple signaling events in the cardiac sarcomere is the MYBPC3 phosphoregulatory locus, believed to affect tissue myogenesis and pump mechanics.4, 8, 9 It remains unknown how changes of sarcomere structure and function create a functional association with muscular architecture and cardiac mechanics.
MYBPC3 phosphorylation has been studied in transgenic (TG) mice, in which 3 phospho‐regulatory serine sites (Ser‐273, Ser‐282, and Ser‐302) were either mutated to nonphosphorylatable alanines (MYBPC3AllP−/(t/t)), phenotypically displaying systolic and diastolic dysfunction as well as cardiac hypertrophy,8, 10 or to phospho‐mimetic aspartic acids (MYBPC3AllP+/(t/t)), displaying a nonpathological phenotype.9 These phospho‐mutant models were further compared with MYBPC3(t/t), a null TG model in which truncated MYBPC3 is degraded and unstable.11 TG cross‐breeding with MYBPC3(t/t) background resulted in recovery with phospho‐mimetic MYBPC3AllP+/(t/t), similar to wild‐type (WT) cross (MYBPC3WT/(t/t)), and also conferred capacity to prevent proteolytic cleavage of MYBPC3 during ischemia‐reperfusion injury, thereby mitigating infarction.9 Conversely, rescue was not observed with the phospho‐ablated MYBPC3AllP−/(t/t) cross from the pathological phenotype, indicating the importance of these phospho‐regulatory serine sites, and guiding insight into the role of MYBPC3 in heart failure.8, 9, 11
The organization of cardiac myocytes within the ventricular wall in the intact heart can be derived with diffusion‐weighted magnetic resonance imaging (DW‐MRI) techniques.12, 13, 14 Previous work has demonstrated that the transmural transition of LV fiber helix angles measured with DW‐MRI emulate the findings of Streeter et al.,13, 15 and that these transmural patterns were disrupted post‐MYBPC3 ablation.14 Generalized Q‐space imaging (GQI) is a novel form of DW‐MRI, developed to resolve architectural details in muscular and neural structures with enhanced subvoxel angular resolution.16 Building on the template of cardiac architectural patterns,13, 14, 17 GQI (further described in Figure S1) was employed to determine the relationship between constitutive MYBPC3 phospho‐regulation and myoarchitecture. We observed that the loss of MYBPC3 is associated with global impairment of the transmural distribution of LV fiber helicity, whereas site‐specific ablation of phosphorylation sites constituted a pathological phenotype characterized by circular‐oriented (ie, nonhelical) fibers. Circular fiber architecture was compared to helically oriented fibers through a geometric model depicting ejection fraction (EF), and the output was related to a loss of mechanical pump function through echocardiography. Our goal was to elucidate multiscale links between genotypic and phenotypic variations of the cardiac sarcomere, macroscale architectural disarray, and cardiac mechanics.
Methods
The TG model preparations employed in this study, and the methods associated with the imaging and mechanical assays used, are described in detail in Data S1. These methods are briefly summarized below.
TG Models of Cardiomyopathy Associated With Modifications of MYBPC3
Generation and phenotypic expression in TG mouse lines expressing modified phospho‐regulatory serine sites (Ser‐273, Ser‐282, and Ser‐302) to nonphosphorylatable alanines (MYBPC3AllP−) or phospho‐mimetic aspartic acids (MYBPC3AllP+) has been previously described.4, 8, 9 MYBPC3(t/t) (Provided by Drs Christine E. Seidman and Jonathan G. Seidman, Harvard Medical School, Boston, MA) demonstrated replacement of myosin and titin binding domains (exon 30) in MYBPC3 by novel residues and expressed less than 10% of normal MYBPC3 level.11 The small amount of protein that is present in these animals was considered truncated and thereby unstable. Homozygous MYBPC3(t/t) mice displayed a dilated cardiomyopathy phenotype with contractile dysfunction, low systolic stiffness, arrhythmia, impaired Ca2+ cycling, and disordered myofibrils. Mice were in the FVB/N background and were between 10 and 12 weeks of age. The present animal experiments were approved by the institutional animal care and use committees at Loyola University Chicago (Maywood, IL) and followed the policies of the Guide for the Use and Care of Laboratory Animals published by the National Institutes of Health.
Echocardiography to Assess Cardiac Mechanics
Cardiac mechanical function and organ morphology were characterized using a Visual Sonics Vevo2100 echocardiography station with an MS550D 22‐ to 55‐MHz transducer (FujiFilm, Toronto, Canada).18, 19 Statistics were performed on echocardiography data using a 1‐way repeat‐measure ANOVA with Tukey's multiple comparison post‐test using Prism software (version 6.0; GraphPad Software Inc., La Jolla, CA), with significance defined as P<0.05. Echo parameters were compared on the basis of ranks (Kruskal–Wallis test) with CIs for the median of slope differences computed (Wilcoxon rank sum).
Imaging Cardiac Myoarchitecture With GQI
The theory and methods associated with the use of GQI for imaging myoarchitecture in humans (in vivo) and rodents (ex vivo) were previously described.16 Restricted nuclear magnetic resonance diffusion can be used to resolve anisotropy at the voxel scale, based largely on the influence of impediments to random translational motion of protons.20 The net outcome of these measurements is a probability distribution function (PDF) that displays diffusion in terms of a three‐dimensional (3D) orientation function multiplied by the quantitative spin density, derived from the Fourier transform of diffusion‐weighted image data.21 Employing GQI, multiple gradient pulses were applied with varying orientations and diffusion sensitivities in order to evaluate signal attenuation in 3D space (Figure S1). Imaging experiments were conducted at 7 Tesla using a Bruker Biospec equipped with a CryoProbe (Bruker Corp, Billerica, MA) utilizing closed‐cycle radiofrequency coil refrigeration. MR scanning was accomplished on thawed mouse hearts (n=3–5 samples for each condition) in fluorinated oil (Krytox; Dupont, Wilmington, DE) by a multishot echo planar imaging pulse sequence with the following imaging parameters, obtained through simulations,16 to achieve optimal angular separation: 512 gradient directions; B value of 750 s/mm2; 8 k‐space segments; and voxel size of 100×100×300 μm, with scan times of ≈8 hours/sample depending on the number of slices required to achieve complete sampling. The resulting PDF was assessed to discern the orientation and magnitude of the dominant fiber populations, with 3D directionality of the fiber populations encoded to a red‐green‐blue scale. Intervoxel fiber tracts were constructed employing streamline methods based on the alignment of the maximal diffusion vectors in the PDF.
Quantitative Analysis of Cardiac Myoarchitecture
The insertion of particular pdfs into user‐defined regions of interest (ROIs) was performed in individual slices and in multislice arrays using an anisotropy map (DSI Studio).21 Larger ROIs were drawn and positioned in the LV at multiple transmural depths (ie, endocardium, mid‐wall, and epicardium) or in the right ventricle (RV). Multivoxel tract generation was carried out using a trilinear streamlining algorithm under Eulerian integration, modified to make use of multiple fiber orientations.21, 22 Myofiber tracts were generated that intersected ROIs through intervoxel angular coherence at a range of ±17.5 degrees as derived from PDF maxima. This approach has been substantively validated through correlation with microscopic imaging methods.14, 23 Tractography coherence (ie, tract length) was then compared between MYBPC3WT and MYBPC3 mutants. For this analysis, the common maximum tract length was identified (50 mm) and then set as a length constraint to spatially identify the longest coherent tracts in individual hearts. The longest coherent tracts were extracted from data sets of normal and mutant hearts and colored coded on the basis of 3D orientation. These common maximum tracts were then overlaid in red onto fibers measured from the respective heart data sets (overall tract length variation of 2–55 mm; displayed in silver). Macroscopic cardiac fiber orientation was analyzed for helix angle as a function of depth of the myocardium sampled employing TrackVis. For helix‐angle analysis, ROIs were placed transmurally along the depth of the heart, and helix angle at specific locations was quantified and plotted for each heart category and samples (n=3–5 hearts for each genetic type). Relative transmural depth (RTD) was calculated for each ROI in a sample using the ratio of the number of ROI positions from the innermost tissue wall divided by the total number of ROIs required to traverse the cardiac wall. RTD for each ROI in a sample was consequently calculated and displayed as a percentage. Statistical comparisons were performed employing the t test and ANOVA of the helical orientation data, and through comparison of slopes following linear regression. The computed RTD to helix angle slopes were compared on the basis of ranks (Kruskal–Wallis test) with CIs for the median of slope differences computed (Wilcoxon rank sum).
Analysis of Sarcomere Morphology Through Electron Microscopy
We analyzed sarcomeric morphology using a Hitachi 7600 transmission electron microscope, equipped with an Advanced Microscopy Techniques digital camera (Hitachi, Tokyo, Japan).24 Sections were cut from 2 to 3 mice of mixed sexes, and 50 to 100 fields were observed for each TG condition. Methods of geometric analysis were adapted from past studies of cardiac sarcomere anisotropy25 and morphology.26
Geometric Model of LV Pump Efficiency Derived From an Analysis of Myofiber Helicity
An analytic model of LV pump efficiency as a function of fiber helicity was developed based on the method of Grosberg et al., where EF is related to energy expenditure (nondimensionalized work).27 This model considers a cylinder with n=4 fibers, under the constraints of either circumferential or helical fiber geometry. A combined model, incorporating both circular and helically aligned fibers, was developed, assuming that circular and helically aligned fibers are equally weighted and that these fibers do not interact mechanically (eg, they slide past one another without resistance).
Results
Normal Cardiac Myoarchitecture Derived Through GQI
We employed GQI to track the myoarchitecture of excised MYBPC3WT mouse hearts (Figure 1A). Through this approach, we observed that the LV possessed helical fibers with a prototypical transmural distribution, with fiber angulation ranging from −90/+90 degrees, whereas the RV principally displayed largely circularly oriented fibers (Figure 1B). We further examined these patterns by reducing the number of tracts to display a “wire‐frame” outline of the myoarchitecture (Figure S2), confirming LV helical fiber patterns, with RV circular fibers inserting into the LV. Tracking these insertions, we identified intravoxel crossing branch points present in the wall of the septum (S) and at the interface of the LV and RV, with a close‐up view of this branch point. The demonstrated LV and RV fiber coalignment at the point of the mid‐myocardium is further described in Figure S3, implying whole‐heart functional connectivity.
Figure 1.
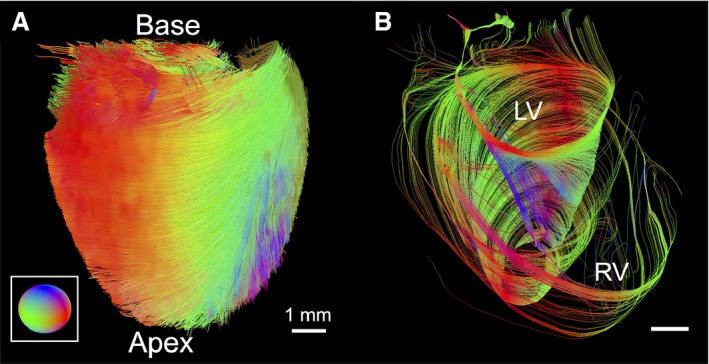
Imaging the myoarchitecture of the typical ventricular wall with GQI (wild‐type mouse). A, GQI tractography depicting the myoarchitecture of the intact excised mouse heart with directional color coding (three‐dimensional fiber orientation described by inset). B, Image demonstrating the variably aligned fiber architecture originating from the base of the heart with helical alignment of the LV compared to circular fibers aligned in the RV. Continuity between the LV and RV is shown, where fiber angle (0 degrees) of the LV mid‐myocardium coaligned with fibers of the RV. GQI indicates generalized q‐sampling imaging; LV, left ventricle; RV, right ventricle.
Effect of the Constituitive Modification of MYBPC3 Phosphorylation on Cardiac Myoarchitecture
We compared cardiac morphology and function for TG mice using echocardiography, as shown in Table. The MYBPC3WT, along with the phospho‐mimetic MYBPC3AllP+/(t/t), demonstrated a normal anatomic and mechanical phenotype, whereas the MYBPC3AllP−/(t/t) and the homozygous MYBPC3(t/t) TG models displayed moderate and severe reduction of cardiac mechanics, respectively.
Table 1.
Cardiac Mechanical Function From Echocardiography
| Genotype | EF (%) | FS (%) |
|---|---|---|
| WT | 64.2±2.5 | 34.3±1.9 |
| Null (t/t) | 21.6±2.7* | 10.0±1.3* |
| WT/(t/t) | 53.4±1.4† | 27.2±0.9† |
| AllP+/(t/t) | 54.4±3.9† | 28.0±2.7† |
| AllP−/(t/t) | 47.2±1.7*, † | 23.3±0.7*, † |
The mean from at least 3 cardiac cycles is displayed ±SE with N=5. Echo parameters were compared on the basis of ranks (ejection fraction, P=0.00078; fractional shortening, P=0.00088).
Significance was then defined as P<0.05 with asterisk (*) vs MYBPC3WT and dagger (†) vs MYBPC3(t/t) by 1‐way ANOVA using Tukey's multiple comparison post‐test. Nonparametric CIs for the median of ejection fraction (%) were computed (Wilcoxon rank sum) in MYBPC3WT with: MYBPC3(t/t), 42.8; MYBPC3WT/(t/t), 10.9; MYBPC3AllP+/(t/t), 11.1; or MYBPC3AllP−/(t/t), 17.2; and fractional shortening (%) in MYBPC3WT with: MYBPC3(t/t), 24.1; MYBPC3WT/(t/t), 7.6; MYBPC3AllP+/(t/t), 7.3; or MYBPC3AllP−/(t/t), 11.5. EF indicates ejection fraction; FS, fractional shortening; WT, wild type.
We performed a phenotypic comparison of MYBPC3AllP−/(t/t) and MYBPC3WT hearts in relation to an architectural template of fiber orientation and helix angle employing GQI (Figure 2). Intervoxel fiber coherence was depicted with selection of long (50 mm) tracts. In so doing, the transmural variation of fiber tract helicity in MYBPC3WT was substituted by a loss of helicity in the MYBPC3AllP−/(t/t) and conversion to a set of circularly orientated fiber tracts, similar to those observed in MYBPC3WT mouse RV. This resulted in red and green encoded X‐Y orientated fibers (Figure 2E) and a loss in the blue‐color Z‐transmitting fiber orientations, as observed in MYBPC3WT (Figure 2C), and modeled by reducing the helix angle over parametric equations (Figure 2A). Helicity loss in the MYBPC3AllP−/(t/t) mutant was confirmed by mapping helix angles in the transverse section of the LV with rotations displayed to enable visualization of the transmural wall (Figure 2G through 2J). MYBPC3AllP+/(t/t) hearts analyzed employing models of long‐tract coherence, fiber orientation, and LV transmural helix angle (Figure S4) were equivalent to MYBPC3WT, with long coherence tracts distributed throughout the heart from apex to base, established coalignment between the LV and RV, and the subtle difference of thickening at the mid‐myocardium of the LV. The MYBPC3(t/t), a homozygous mutation resulting in unstable protein targeted for degradation, displayed minimal organ‐scale architectural organization and abnormal transmural helical transitions (Figure 3). Architectural analysis depicted myofiber tracts that traversed the heart in a coiled manner, without a consistent transmural pattern. Interestingly, the effective absence of MYBPC3 protein was associated with formation of local helical transitions, as observed in the transverse section of the LV wall (Figure S5), and at various locations throughout the LV wall.
Figure 2.
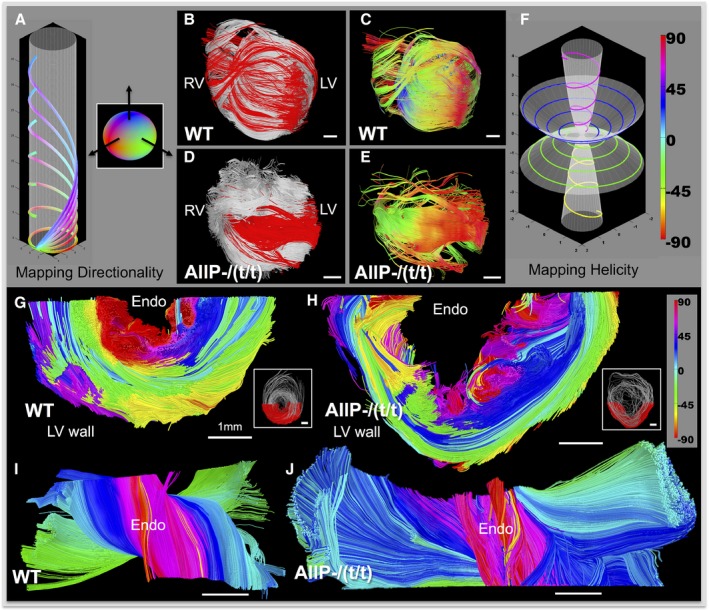
Architectural phenotype associated with constitutively impaired MYBPC3 phosphorylation was mapped with directionality (A through E) and helix angle (F through J). Simulated fibers with variable helix angle (A), demonstrating the effect of helicity on increased Z‐transmission over a fixed radius cylinder; circular fibers transmitted in X‐Y directions (red‐green), whereas greater helix angle increases Z transmission (blue). The inset sphere in (A) describes the color coding in three dimensions. MYBPC3WT (WT; B and C) was compared with the phospho‐ablation mutation, MYBPC3AllP−/(t/t) (AllP−/(t/t); D and E), in terms of myoarchitecture derived with GQI tractography. Coherence was displayed in terms of fiber architecture (B and D) by overlaying long tracts (tract length, 50 mm; red) selected from the overall cardiac tract dataset (silver background). Long tracts are displayed (C and E) with directional color coding (described in A) to discriminate fiber orientation. Helix angle progression in fiber models (F), encoded as purple 60 degrees, blue 30 degrees, green −30 degrees, and yellow −60 degrees. Transverse sections through the LV wall were encoded to helix angle (as in F). MYBPC3WT (G and I) and MYBPC3AllP−/(t/t) (H and J) are compared; inset figures (G and H) provide the section locations colored red with the complete transverse in silver. LV sections are rotated toward the viewer (I and J), enabling visualization of the endocardium wall (labeled as Endo). The MYBPC3AllP−/(t/t) phenotype displayed dominant circular fiber alignment (blue and green colors approaching 0 degres) with abrupt transition to vertical fibers at the endocardial and epicardial walls (H and J). Scale bars are represented throughout with a relative size of 1 mm. GQI indicates generalized q‐sampling imaging; LV, left ventricle; RV, right ventricle; WT, wild type.
Figure 3.
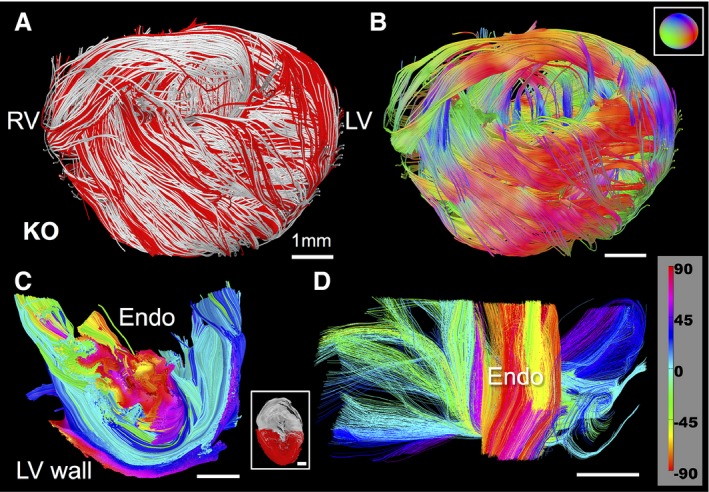
Myoarchitectural phenotype associated with the ablation of MYBPC3. GQI architectural analysis was performed in transgenic (TG) MYBPC3(t/t) hearts in which unstable MYBPC3 protein is truncated and targeted for degradation. These hearts demonstrated a high degree of disorder at the organ scale and an absence of transmural helical progression. Long tracts (A; shown in red with overall dataset in silver) display fiber coherence with disorder (B; directional color‐code for B is inset). Analysis of helix angle in LV sections demonstrated helical progression that varied greatly throughout the wall, with the dominant presence of near‐zero angle circular fibers (C and D; helical angle encoding inset in D). Inset in (C) is the location of the transverse LV section (red) with respect to an entire transverse LV section (silver) through the mouse hearts. LV indicates left ventricle; RV, right ventricle.
We performed a quantitative analysis of myocardial helix angle as a function of transmural depth through the use of a “pin‐wheel” display that depicted the entire array of helix angles from a single view oriented in the endocardium (Figure 4). Using this method, we observed fiber angle progression in MYBPC3WT hearts with a smooth transition and consistent presence of transmural helices from −90/+90 degrees, along with an equivalent transition in MYBPC3AllP+/(t/t), albeit at a slightly reduced degree of helix angle progression. In contrast, MYBPC3AllP−/(t/t) hearts displayed an abnormal helix angle progression, with the mid‐myocardium exhibiting horizontal fiber orientations (approximately circular with a helix angle of 0 degrees) and abrupt transitions. Quantification of the null phenotype, MYBPC3(t/t), demonstrated helical architectural disarray, and a loss in transmural helical transitions. Linear regression was performed to estimate transmural helix angle progression, along with statistical comparison of the data sets (Figure 5). We observed that the straight‐line slope of the null phenotype displayed a propensity toward the central mean, with reduced helicity. Employing the Student t test, MYBPC3(t/t) helical transitions were significantly reduced compared to MYBPC3WT and MYBPC3WT/(t/t) (Figure 5A). With MYBPC3AllP+/(t/t), helical transitions were significantly reduced, as mediated through the increased presence of circular‐oriented fibers at the mid‐myocardium, compared to MYBPC3WT and MYBPC3AllP−/(t/t) (Figure 5B).
Figure 4.
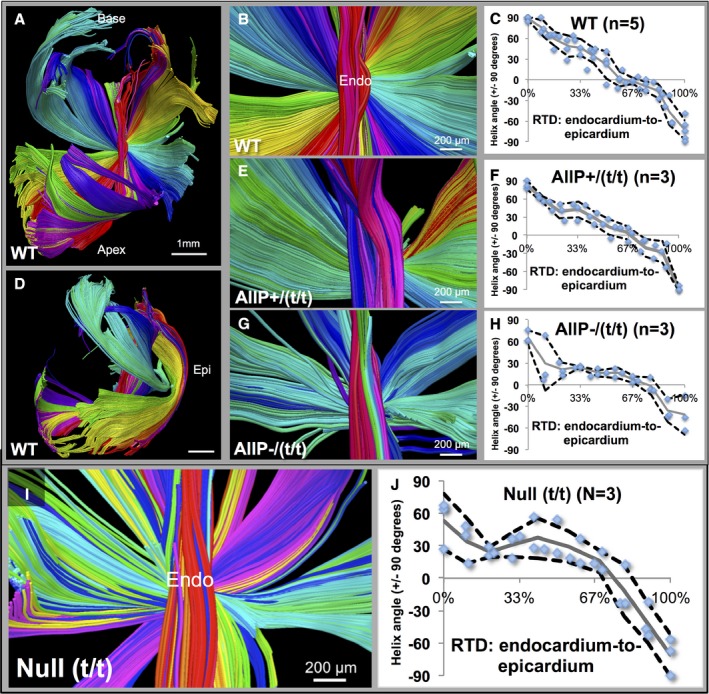
Quantification of helix angle transition in MYBPC3WT and MYBPC3 (TG) variants. Helix angle was quantified through placement of regions of interest (ROIs) throughout the LV (MYBPC3WT in A through D; WT), with demonstrated helix angle transition patterns (B, E, and G) and quantification in multiple hearts (C, F, and H). The smooth transition of +90/−90 degrees from endocardium to the epicardium (Epi) was demonstrated (A through D in WT) with myofibers (in A) rotating around the central axis (close‐up shown in B). Quantification of helix angle with ROIs at percentile depths (blue dots) in LV is shown with the mean data (gray line) and 90% CI (black dotted lines). The LV wall is shown in side view (in D) with the location of the epicardium. Quantification of helix angles was carried out in transgenic hearts in (E through H). The phospho‐mimetic MYBPC3AllP+/(t/t) mutation was similar to the MYBPC3WT, with continuous helical transitions, and no significant alterations (E and F; labeled AllP+/(t/t)). In the phospho‐ablated MYBPC3AllP−/(t/t) mutation, disruption of overall helical patterns resulted with abrupt transitions between vertical and circular fiber elements (G and H; labeled AllP−/(t/t)); significant alterations in helix angle measurements were found at the endocardium (0–33% wall depth) with P=0.0006 and 0.036 vs MYBPC3WT or MYBPC3AllP+/(t/t), respectively (by Student t test). I, Null (MYBPC3(t/t)) phenotype demonstrated architectural disarray, with irregular circular and helical progression (quantified in J). Scale bar size is 1 mm in part (A and D) and 200 μm in (B, E, G, and I). LV indicates left ventricle; RTD, relative transmural depth; WT, wild type.
Figure 5.
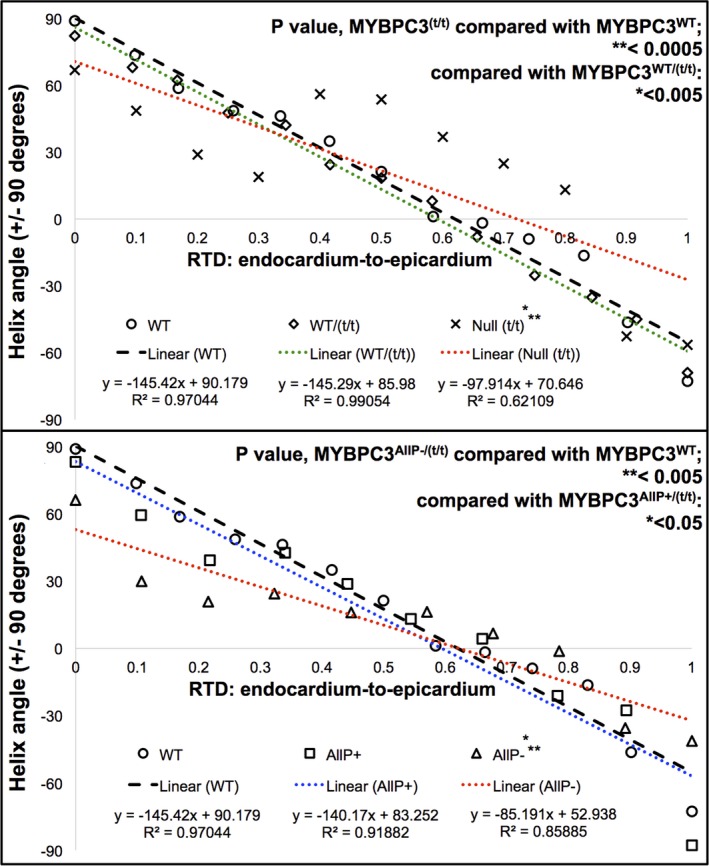
Comparison of cardiac fiber helicity between wild‐type (WT) and transgenic (TG) models. Mean data obtained from helix angle quantification by region of interest (ROI) analysis were compared with a linear regression. A, MYBPC3WT and MYBPC3WT/(t/t) had similar slopes (−145.42 and −145.29), whereas reduced slope of the null MYBPC3(t/t) mutation (−97.91) indicated loss in helicity and the increased presence of circular fibers. B, MYBPC3WT had a similar slope to MYBPC3AllP+/(t/t) (−140.17), whereas MYBPC3AllP−/(t/t) had a reduced slope (−85.191), demonstrating a more circular fiber orientation, because a greater slope implies progression through helix angles. Regression lines from MYBPC3WT or MYBPC3AllP+/(t/t) intersected with MYBPC3AllP−/(t/t) at 61.83% and 54.13% wall depth, respectively, implying similarity at the mid‐myocardium, where circular fibers are normally present. Significance of the computed relative transmural depth (RTD) to helix angle slopes was determined on the basis of ranks (P=0.00036). Comparisons were carried out for each respective cardiac genotype employing the Student t test, with significant difference in MYBPC3AllP−/(t/t) of P=0.0032 and 0.034 vs MYBPC3WT or MYBPC3AllP+/(t/t), respectively; comparing the MYBPC3(t/t) genotype, P=0.00016 and 0.0044 vs MYBPC3WT or MYBPC3WT/(t/t), respectively. Nonparametric CIs for the median of slope differences were computed in (A) with MYBPC3WT vs MYBPC3WT/(t/t), 1.815; or MYBPC3(t/t), 47.686; and in (B) with MYBPC3WT vs MYBPC3AllP−/(t/t), 65.873; or MYBPC3AllP+/(t/t), 7.01. Large deviations coincided with statistical significance in both the t test and unpaired Wilcoxon rank test (MYBPC3WT vs MYBPC3(t/t) or MYBPC3AllP−/(t/t)). WT indicates wild type.
Sarcomere Morphology as the Basis for Architectural Disarray
Genetic modifications of MYBPC3 were related with sarcomere ultrastructure utilizing electron microscopy (EM). Figure 6A depicts a schematic of myofilament elements of the cardiac sarcomere with respect to MYBPC3. Morphological features of the cardiac sarcomere analyzed were the aspect ratio (width to length ratio) and shear angle measured at the M‐line (Figure 6B). Using this method of analysis, we observed morphologic differences between TG variants and MYBPC3WT (representative EM shown in Figure 6C). Using violin plots of morphological differences (Figure 6D), we observed that MYBPC3WT and MYBPC3WT/(t/t) had normal aspect ratios, whereas tMYBPC3AllP+/(t/t) demonstrated reduced sarcomere length, and MYBPC3AllP−/(t/t) and null MYBPC3(t/t) demonstrated increased width, each resulting in reduced aspect ratios. MYBPC3AllP−/(t/t) and null MYBPC3(t/t) mutants demonstrated significantly increased sarcomere shear angles, whereas MYBPC3WT/(t/t) was structurally similar to MYBPC3WT, and MYBPC3AllP+/(t/t) was significantly decreased.
Figure 6.
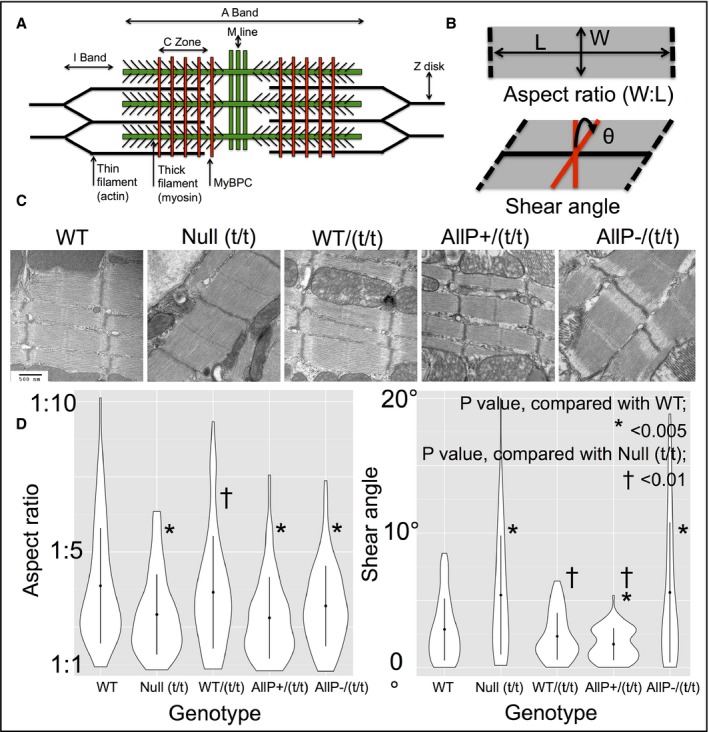
Comparison of sarcomere morphology in transgenic (TG) variants. A, Diagram of proposed structure of the cardiac sarcomere, displaying the hypothesized role of MYBPC3 in associating the thick and thin filaments, adapted from James and Robbins.28 B, Geometric components measured include the aspect ratio (width‐to‐length ratio [W:L]) and the shear angle (θ) at the M‐line. C, Representative transmission electron micrographs from TG variants demonstrating differential geometric features; scale bar size of 500 nm is consistent in all images. D, Measurements of aspect ratio (W:L) with violin plots; MYBPC3AllP+/(t/t), MYBPC3AllP−/(t/t), and Null MYBPC3(t/t) demonstrated abnormal sarcomere aspect ratios (respective W:L mean values of 595±58:1325±50 nm, n=92; 637±89:1662±51 nm, n=105; and 672±57:1636±34 nm, n=60), whereas MYBPC3WT and MYBPC3WT/(t/t) aspect ratios were statistically similar (respective W:L mean values of 547±71:1699±41 nm, n=120; and 688±91:1844±40 nm, n=80). Abnormal sarcomere aspect ratios were attributed to significantly increased widths with MYBPC3AllP−/(t/t) and Null MYBPC3(t/t) compared to MYBPC3WT,whereas MYBPC3AllP+/(t/t) sarcomeres displayed significantly decreased lengths. As determined by shear angles, MYBPC3WT and MYBPC3WT/(t/t) had statistically equivalent phenotypes, whereas the MYBPC3AllP−/(t/t) and Null MYBPC3(t/t) demonstrated significant increases. Shear angles with MYBPC3AllP+/(t/t) were significantly reduced compared to MYBPC3WT or MYBPC3(t/t). WT indicates wild type.
Discussion
We demonstrate a multiscale conceptualization of heart failure through depiction of structural associations linking MYBPC3 phospho‐regulation with the morphology of the cardiac sarcomere and whole‐organ myoarchitecture. We specifically studied whether loss of MYBPC3 phosphorylation attributed to the conversion of Ser‐273, Ser‐282, and Ser‐302 to the nonpolar amino acid, alanine, a modification associated with cardiomyopathy and impaired mechanical function in vivo,8 or complete deletion of the MYBPC3 protein through the MYBPC3(t/t) (null) mutation, affects myofiber organization in the walls of ventricles. Utilizing GQI, we observed that MYBPC3AllP−/(t/t) mouse hearts display a unique form of architectural disarray, characterized by loss of predicted transmural variation of fiber helicity, a loss in LV and RV myocardial coalignment, the exaggerated presence of circular‐oriented fibers, along with altered sarcomere shear angle and aspect ratio. The replacement of these same serine residues with charged aspartic acids conversely generates a phospho‐mimetic condition (MYBPC3AllP+/(t/t)), which displays nonpathological myoarchitecture.
The observed losses of myofiber helicity in MYBPC3AllP−/(t/t) and MYBPC3(t/t) hearts allowed for the emergence of a more disordered pattern in the LV, which may be associated with altered torsional mechanics and reduced z‐direction contraction.27, 29, 30 Contraction of the LV is characteristically associated with rotation relative to the base apex axis, resulting in twisting displacement, an action based on the shortening of helically aligned fibers.31 Circularly aligned fibers achieve cardiac ejection through a well‐defined work function related to reduction of the inner chamber radius, whereas helically aligned fibers achieve a change of z‐oriented length through twisting motion.27 In order to demonstrate the effect of fiber helicity on cardiac output, we present an analytical model (Figure 7), predicting that helically aligned fibers (represented with HA=45 degrees) are more efficient in terms of energy expenditure (dimensionless work) than circularly aligned fibers (HA=0 degrees; n=4 fibers per model) for achieving high LV EF percentages. Two combined models were also developed that embody more‐realistic conditions, including: (1) 50% circular fibers and 50% helical fibers (HA=45 degrees) and (2) 25% of circular fibers combined with a mixture of helical fibers (HA=30, 45, and 60 degrees). Using this analysis, we demonstrate that the second combined model is more energy efficient, generally consistent with the MYBPC3WT, MYBPC3WT/(t/t), and MYBPC3AllP+/(t/t) animal models, whereas the first combined model, generally consistent with the MYBPC3AllP−/(t/t) and MYBPC3(t/t) TG models, displays a loss of helicity and a loss of energy efficiency.
Figure 7.
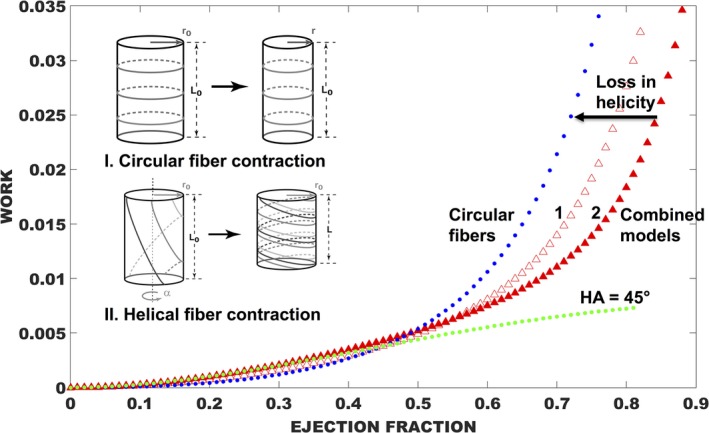
Modeling mechanics from LV wall geometry in the normal and pathological heart. A model of LV energy expenditure (nondimensionalized work) vs ejection fraction was developed with consideration of fiber geometry on a cylindrical shell (n=4 fibers in each model).27 Circular fibers work through radial constriction (Inset I), and the related work function is shown in blue. A representative model of helix angle energy expenditure is shown in green with HA of 45 degrees and where the ejection fraction is related to contraction of cylinder length through twisting (Inset II). Helical fibers demonstrated greater efficiency, in terms of energy expenditure, compared to circular fibers, particularly at higher ejection fractions. Combined models in red are weighted as in case 1: 50% circular fibers are shown and 50% helical fibers (HA=45 degrees); or case 2: equal weighting of circular fibers (25%) combined with helical fibers (HA=30, 45, and 60 degrees). Case 2, a model of normal myoarchitecture, is more efficient for achieving higher EF, whereas with case 1, a model of pathological loss in helicity, and efficiency is reduced. EF indicates ejection fraction; HA, helix angle; LV, left ventricle.
The chain of events associating specific modifications of MYBPC3 phosphorylation with sarcomere morphology and myoarchitectural patterns that emerge during organogenesis is currently unknown. The modifications of MYBPC3 phosphorylation studied in this report are likely to affect dynamic binding involving MYBPC3 and several myofilament proteins present in the cardiac sarcomere, along with various physiological factors.32, 33, 34 MYBPC3 extends perpendicular to the long axis of the thick filament by the N‐terminal domain. C‐terminal domains C7 to C10 are believed to be associated with titin binding,35 whereas the C10 domain may specifically be associated with binding of the myosin thick filament.36 MYBPC3 possesses phosphorylation sites at Ser‐273, Ser‐282, and Ser‐302 in the protein M domain that are targeted by protein kinase A (PKA),37, 38 protein kinase C,39 Ca2+/calmodulin‐dependent protein kinases II,40 protein kinase D,41 and ribosomal s6 kinase.42 In vitro studies show that PKA phosphorylates Ser‐273, Ser‐282, and Ser‐302, in a region of the N‐terminus (C1‐M‐C2 domains) that binds to actin43 and the S2 segment of myosin44, 45, 46, 47, 48 close to the lever arm domain. Dephosphorylation of MYBPC3 may promote tight interaction with myosin S2, whereas phosphorylation may abolish this interaction.44 In vitro studies suggest that the ability of PKA to phosphorylate Ser‐273 and Ser‐302 is markedly reduced when Ser‐282 is mutated to alanine, thus reducing subsequent phosphorylation.37, 40 Deletion or alanine mutation of Ser‐282 decreased total MYBPC3 phosphorylation,40 whereas in vitro studies demonstrated that sequential phosphorylation (Ser‐282 followed by Ser‐302) may play a role in myofilament protein interactions.49 Modified phosphorylation of MYBPC3 may also affect sarcomere mechanics such that myosin molecular motors, comprising the thick filaments, can interact with the thin filaments to generate force and motion.50 Such models predict that MYBPC3 is required to ensure rapid, uniform force development within the sarcomere during the early portion of the systolic phase of cardiac contraction,50 a capacity that would be reduced or lost in association with MYBPC3 haploinsufficiency.51 In contrast, MYBPC3 dephosphorylation, as observed in failing human hearts,52, 53 may sensitize the thin filament's activation state, hypersensitizing cardiac cells toward impaired cardiac relaxation and decreased ventricular filling; reduced ventricular filling limits stretch, thus further decreasing force generation through Frank–Starling mechanisms.50
Acknowledging observations reported here, and past MYBPC3 knowledge, we hypothesize that MYBPC3 acts as a switchable scaffold in the sarcomere, providing structural stability when phosphorylated (Figure 8) and allowing structural instability when dephosphorylated. In the phospho‐mimetic mutation, reduced myosin binding4 and enhanced thick and thin filament cross‐bridge kinetics10, 43 stabilize the sarcomere during force generation (Figure 8A). In the phospho‐ablation mutation, enhanced myosin binding and reduced cross‐bridge kinetics10 destabilize the sarcomere (Figure 8B). MYBPC3 thus constitutes a tunable structural and mechanical scaffold within the sarcomere.43, 50 Incorporating previous observations, such as the effects of altered myofilament proteins on cross‐bridge interactions,32, 34 myosin packing,54 myofibrillar stiffness,55 and myocyte contractility,56 in addition to other possible developmental and mechanical alterations associated with heart failure, such as the formation of fibrous or calcified noncontractile tissues,8 a model emerges linking MYBPC3 phosphoregulation with sarcomere morphology and organ‐scale myoarchitecture. The current study, linking changes of MYBPC3 phosphorylation with sarcomere structure and alignment of cardiac myocytes distributed across the ventricular wall, depicts the previously unexplored phenomenon of multiscale architecture in the failing heart (Figure 8C). Varied fiber layer alignment across the ventricular wall may furthermore affect the compatibility of displacement fields between these layers, for example, through torsional shear that acts to minimize the transmural gradient of fiber stretch,29 or through transmural strain matching57, 58 and interlayer stretch activation.59 Though it is expected that interlayer shear stress in the MYBPC3WT heart is minimal, it is possible that MYBPC3AllP−/(t/t) hearts exhibit significant shear stress, resulting in intersheet deformation, remodeling, and hypertrophy.60, 61
Figure 8.
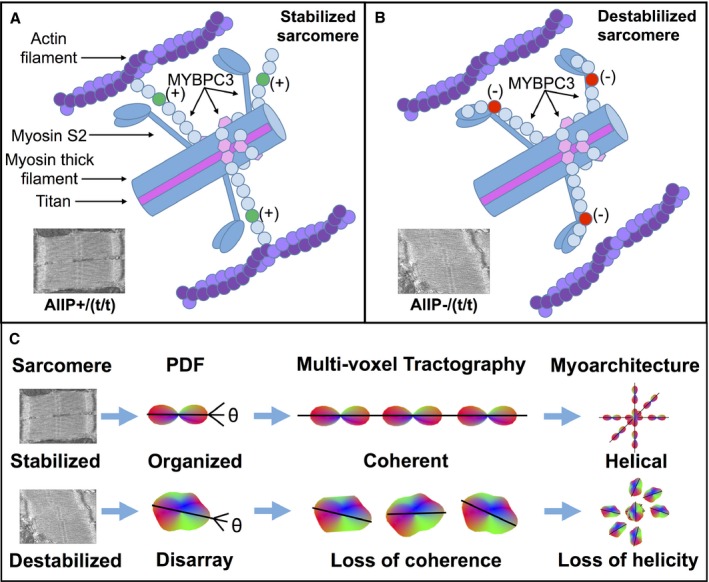
Mechanisms by which MYBPC3 phospho‐regulation affects sarcomere stability and cardiac myoarchitecture. We hypothesize that phosphorylation of MYBPC3 results in reduced myosin binding and enhanced thick and thin filament cross‐bridge kinetics, thus stabilizing the sarcomere during force generation (A; in MYBPC3 M‐domain labeled in green [+]). In the dephosphorylated state, enhanced myosin binding with reduced cross‐bridge kinetics destabilizes the sarcomere (B; in M‐domain labeled as red [−]). For transgenic animals, the phospho‐mimetic mutation (MYBPC3AllP+/(t/t)) sarcomere is constitutively stabilized, whereas in the phospho‐ablation mutation (MYBPC3AllP−/(t/t)), the sarcomere is constitutively destabilized. The destabilized sarcomere leads to the misshapen sarcomere (measured as high shear angle and increased sarcomere width), whereas phosphorylation stabilizes the sarcomere shape (low shear angle and reduced sarcomere length). In other cases, native MYBPC3WT or MYBPC3WT/(t/t) can be switched between phosphorylation states, whereas the MYBPC3(t/t) null mutation is constitutively destabilized, because of the truncation and loss of MYBPC3. C, Sarcomere morphology affects multiscale cardiac myoarchitecture. Voxel‐scale myocyte organization is measured with the diffusional probability distribution function (PDF) in GQI. Muscle fiber alignment between voxels results in coalignment between multiple PDF, as represented by tracts. Destabilization of sarcomere morphology leads to disarray, measured as altered PDF shape, along with the loss of coherence between multiple aligned myocytes, and thus losses in LV transmural myofiber helicity are observed with GQI in tractography. GQI indicates generalized q‐sampling imaging; LV, left ventricle.
We conclude that the loss of MYBPC3 phosphorylation, an effect believed to alter interactions of MYBPC3 with thick and thin filament proteins, results in a profound alteration of sarcomere morphology and a loss of tissue architectural integrity defined at the meso scale through GQI. The absence of architectural control affected by variations of MYBPC3 phosphorylation results in development of architectural disarray in the ventricular wall and may contribute to impairments in torsional mechanics that underlie heart failure.
Sources of Funding
The work represented herein was supported by National Institutes of Health RO1 DC 011528 (Gilbert), R01 HL105826 and K02 HL114749 (Sadayappan), and American Heart Association Midwest Affiliate Research Programs; 14GRNT20490025 (Sadayappan), 11PRE7240022 (Barefield), 13POST14720024 (Govindan), and 15PRE22430028 (Lynch).
Disclosures
None.
Supporting information
Data S1. Supplementary methods.
Figure S1. Generalized Q‐space imaging (GQI): MRI method to assess ventricular wall myoarchitecture. Simulations of the morphology of Q‐space using a shell configuration, with a single diffusion sensitivity (or B value), carried out to study the effect of MR gradient distribution on the angular resolution of GQI, with (A) net angular resolution in Q‐space displayed in terms of the number and size of continuous facets and (B) directionally coded gradient vectors (length scaled to B value), depicted for 512 directions in three‐dimensional space. GQI relates the diffusion signal to molecular displacement through the Fourier transform. Employing the convention of Q‐space as a mathematical description of the diffusion environment probed by the application of diffusion‐weighted gradients, GQI considers the morphology and distribution of MR field gradients and results in the generation of a voxel‐scale probability distribution function (PDF) for diffusivity based on the presence and orientation of diffusional boundaries in tissue. The principal fiber directions indicated with the shape of the diffusional PDF may be connected to coaligned diffusion vectors in adjacent voxels through streamlining methods in order to generate multivoxel myofiber tracts that depict macro‐scale fiber anatomy.
Figure S2. Defining angular separation with underlying anatomy. A, Demonstration with limited tracts of crossing helix angles in the LV and circular tracts in a parallel configuration in the RV. B, Coalignment at the mid‐myocardial depth between the LV free wall, septum (S), and RV, magnified in (C). Scale bars are represented in A and B with a relative size of 1 mm and in (C) with size of 200 μm.
Figure S3. Transmural variation of myocardial fiber helix angle in the normal ventricular wall (WT mouse). A, GQI was used to reveal myoarchitectural patterns in the wall of the left and right ventricles. This analysis showed a pattern of crossing helices in the LV oriented to the apex and ranging from −90 in the epicardium to 0 degrees in the mid‐myocardium to +90 degrees in the endocardium. GQI tractography of cardiac myoarchitecture is shown at varying depths through the walls of the RV and LV (B through D) in order to demonstrate coalignment between the 2. GQI tractography is shown for all layers of the myocardium (B), the epicardium and endocardium selectively (C), and the mid‐myocardium selectively (D). Coalignment between the LV and RV is most prominent at the mid‐ventricular wall, where the helix angle approximates zero. Scale bars are represented throughout (B through D) with a relative size of 1 mm.
Figure S4. Myoarchitectural phenotype associated with phospho‐mimetic MYBPC3. Coherence in excised mouse hearts from the MYBPC3AllP+/(t/t) phenotype analyzed by GQI tractography is displayed with fiber architecture (in A) by overlaying long tracts (tract length, 50 mm; red) selected from the overall data set (silver background). Long tracts are displayed (in B) with directional color coding (described by inset) to discriminate fiber transmission direction. Helix angle was compared in transverse section of the LV wall for MYBPC3AllP+/(t/t) hearts (C and D). Fiber orientations (C) are encoded to helix angle (inset shown at the top right of (C) indicates quantitative helix angle encoding). The location of the transverse section through the LV in (C) is shown in inset, where red indicates the selected section and silver is the entire transverse section. The LV section was rotated, enabling visualization of the endocardium wall (endo; D). Scale bars are represented throughout (A through D) with a relative size of 1 mm.
Figure S5. Unique myoarchitectural features associated with MYBPC3 ablation. GQI architectural analysis was performed in transgenic (TG) MYBPC3(t/t) hearts in which unstable MYBPC3 protein is truncated and targeted for degradation. A closer look at myofiber orientation in the LV transverse sections demonstrated the presence of microhelical fibers (in A), and with a close‐up view (in B). Scale bars are represented with a relative size of 1 mm (in A) and 200 μm (in B).
Acknowledgments
The authors acknowledge the assistance of the Brigham and Women's MRI Research Center (BWMRC).
(J Am Heart Assoc. 2016;5:e002836 doi: 10.1161/JAHA.115.002836)
Accompanying Data S1 and Figures S1 through S5 are available at http://jaha.ahajournals.org/content/5/3/e002836/suppl/DC1
References
- 1. Previs MJ, Previs SB, Gulick J, Robbins J, Warshaw DM. Molecular mechanics of cardiac myosin‐binding protein C in native thick filaments. Science. 2012;337:1215–1218. [DOI] [PMC free article] [PubMed] [Google Scholar]
- 2. Luther PK, Bennett PM, Knupp C, Craig R, Padrón R, Harris SP, Patel J, Moss RL. Understanding the organisation and role of myosin binding protein C in normal striated muscle by comparison with MyBP‐C knockout cardiac muscle. J Mol Biol. 2008;384:60–72. [DOI] [PMC free article] [PubMed] [Google Scholar]
- 3. Luther PK, Winkler H, Taylor K, Zoghbi ME, Craig R, Padrón R, Squire JM, Liu J. Direct visualization of myosin‐binding protein C bridging myosin and actin filaments in intact muscle. Proc Natl Acad Sci USA. 2011;108:11423–11428. [DOI] [PMC free article] [PubMed] [Google Scholar]
- 4. Barefield D, Sadayappan S. Phosphorylation and function of cardiac myosin binding protein‐C in health and disease. J Mol Cell Cardiol. 2010;48:866–875. [DOI] [PMC free article] [PubMed] [Google Scholar]
- 5. Dhandapany PS, Sadayappan S, Xue Y, Powell GT, Rani DS, Nallari P, Rai TS, Khullar M, Soares P, Bahl A, Tharkan JM, Vaideeswar P, Rathinavel A, Narasimhan C, Ayapati DR, Ayub Q, Mehdi SQ, Oppenheimer S, Richards MB, Price AL, Patterson N, Reich D, Singh L, Tyler‐Smith C, Thangaraj K. A common MYBPC3 (cardiac myosin binding protein C) variant associated with cardiomyopathies in South Asia. Nat Genet. 2009;41:187–191. [DOI] [PMC free article] [PubMed] [Google Scholar]
- 6. Van Driest SL, Vasile VC, Ommen SR, Will ML, Tajik AJ, Gersh BJ, Ackerman MJ. Myosin binding protein C mutations and compound heterozygosity in hypertrophic cardiomyopathy. J Am Coll Cardiol. 2004;44:1903–1910. [DOI] [PubMed] [Google Scholar]
- 7. Chung MW, Tsoutsman T, Semsarian C. Hypertrophic cardiomyopathy: from gene defect to clinical disease. Cell Res. 2003;13:9–20. [DOI] [PubMed] [Google Scholar]
- 8. Sadayappan S, Gulick J, Osinska H, Martin LA, Hahn HS, Dorn GW, Klevitsky R, Seidman CE, Seidman JG, Robbins J. Cardiac myosin‐binding protein‐C phosphorylation and cardiac function. Circ Res. 2005;97:1156–1163. [DOI] [PMC free article] [PubMed] [Google Scholar]
- 9. Sadayappan S, Osinska H, Klevitsky R, Lorenz JN, Sargent M, Molkentin JD, Seidman CE, Seidman JG, Robbins J. Cardiac myosin binding protein C phosphorylation is cardioprotective. Proc Natl Acad Sci USA. 2006;103:16918–16923. [DOI] [PMC free article] [PubMed] [Google Scholar]
- 10. Tong CW, Stelzer JE, Greaser ML, Powers PA, Moss RL. Acceleration of crossbridge kinetics by protein kinase a phosphorylation of cardiac myosin binding protein C modulates cardiac function. Circ Res. 2008;103:974–982. [DOI] [PMC free article] [PubMed] [Google Scholar]
- 11. McConnell BK, Jones KA, Fatkin D, Arroyo LH, Lee RT, Aristizabal O, Turnbull DH, Georgakopoulos D, Kass D, Bond M, Niimura H, Schoen FJ, Conner D, Fischman DH, Seidman CE, Seidman JG. Dilated cardiomyopathy in homozygous myosin‐binding protein‐C mutant mice. J Clin Invest. 1999;104:1235–1244. [DOI] [PMC free article] [PubMed] [Google Scholar]
- 12. Gilbert RJ, Magnusson LH, Napadow VJ, Benner T, Wang RP, Wedeen VJ. Mapping complex myoarchitecture in the bovine tongue with diffusion‐spectrum magnetic resonance imaging. Biophys J. 2006;91:1014–1022. [DOI] [PMC free article] [PubMed] [Google Scholar]
- 13. Sosnovik DE, Wang RP, Dai GP, Wang T, Aikawa E, Novikov M, Rosenzweig A, Gilbert RJ, Wedeen VJ. Diffusion spectrum MRI tractography reveals the presence of a complex network of residual myofibers in infarcted myocardium. Circ Cardiovasc Imaging. 2009;2:206–212. [DOI] [PMC free article] [PubMed] [Google Scholar]
- 14. Wang TT, Kwon HS, Dai GP, Wang RP, Mijailovich SM, Moss RL, So PTC, Wedeen VJ, Gilbert RJ. Resolving myoarchitectural disarray in the mouse ventricular wall with diffusion spectrum magnetic resonance imaging. Ann Biomed Eng. 2010;38:2841–2850. [DOI] [PMC free article] [PubMed] [Google Scholar]
- 15. Streeter DDJ, Spotnitz HM, Patel DP, Ross JJ, Sonnenblick EH. Fiber orientation in the canine left ventricle during diastole and systole. Circ Res. 1969;24:339–347. [DOI] [PubMed] [Google Scholar]
- 16. Taylor EN, Hoffman MP, Aninwene GE, Gilbert RJ. Patterns of intersecting fiber arrays revealed in whole muscle with generalized Q‐space imaging. Biophys J. 2015;108:2740–2749. [DOI] [PMC free article] [PubMed] [Google Scholar]
- 17. Torrent‐Guasp F, Kocica MJ, Corno AF, Komeda M, Carreras‐Costa F, Flotats A, Cosin‐Aguillar J, Wen H. Towards new understanding of the heart structure and function. Eur J Cardiothorac Surg. 2005;27:191–201. [DOI] [PubMed] [Google Scholar]
- 18. Barefield D, Kumar M, de Tombe PP, Sadayappan S. Contractile dysfunction in a mouse model expressing a heterozygous MYBPC3 mutation associated with hypertrophic cardiomyopathy. Am J Physiol Heart Circ Physiol. 2014;306:H807–H815. [DOI] [PMC free article] [PubMed] [Google Scholar]
- 19. Barefield D, Kumar M, Gorham J, Seidman JG, Seidman CE, de Tombe PP, Sadayappan S. Haploinsufficiency of MYBPC3 exacerbates the development of hypertrophic cardiomyopathy in heterozygous mice. J Mol Cell Cardiol. 2015;79:234–243. [DOI] [PMC free article] [PubMed] [Google Scholar]
- 20. Hagmann P, Jonasson L, Maeder P, Thiran JP, Wedeen VJ, Meuli R. Understanding diffusion MR imaging techniques: from scalar diffusion‐weighted imaging to diffusion tensor imaging and beyond. Radiographics. 2006;26(suppl 1):S205–S223. [DOI] [PubMed] [Google Scholar]
- 21. Yeh FC, Wedeen VJ, Tseng WYI. Generalized Q‐sampling imaging. IEEE Trans Med Imaging. 2010;29:1626–1635. [DOI] [PubMed] [Google Scholar]
- 22. Gilbert RJ, Wedeen VJ, Magnusson LH, Benner T, Wang RP, Dai G, Napadow VJ, Roche KK. Three‐dimensional myoarchitecture of the bovine tongue demonstrated by diffusion spectrum magnetic resonance imaging with tractography. Anat Rec A Discov Mol Cell Evol Biol. 2006;288A:1173–1182. [DOI] [PubMed] [Google Scholar]
- 23. Gaige TA, Kwon HS, Dai GP, Cabral VC, Wang RP, Nam YS, Engelward BP, Wedeen VJ, So PT, Gilbert RJ. Multiscale structural analysis of mouse lingual myoarchitecture employing diffusion spectrum magnetic resonance imaging and multiphoton microscopy. J Biomed Opt. 2008;13:064005. [DOI] [PubMed] [Google Scholar]
- 24. Razzaque MA, Gupta M, Osinska H, Gulick J, Blaxall BC, Robbins J. An endogenously produced fragment of cardiac myosin‐binding protein C is pathogenic and can lead to heart failure. Circ Res. 2013;113:553–561. [DOI] [PMC free article] [PubMed] [Google Scholar]
- 25. Bray MA, Sheehy SP, Parker KK. Sarcomere alignment is regulated by myocyte shape. Cell Motil Cytoskelet. 2008;65:641–651. [DOI] [PMC free article] [PubMed] [Google Scholar]
- 26. Beraldi R, Li X, Fernandez AM, Reyes S, Secreto F, Terzic A, Olson TM, Nelson TJ. Rbm20‐deficient cardiogenesis reveals early disruption of RNA processing and sarcomere remodeling establishing a developmental etiology for dilated cardiomyopathy. Hum Mol Genet. 2014;23:3779–3791. [DOI] [PMC free article] [PubMed] [Google Scholar]
- 27. Grosberg A, Gharib M, Kheradvar A. Effect of fiber geometry on pulsatile pumping and energy expenditure. Bull Math Biol. 2009;71:1580–1598. [DOI] [PubMed] [Google Scholar]
- 28. James J, Robbins J. Signaling and myosin‐binding protein C. J Biol Chem. 2011;286:9913–9919. [DOI] [PMC free article] [PubMed] [Google Scholar]
- 29. McCulloch AD, Smaill BH, Hunter PJ. Regional left‐ventricular epicardial deformation in the passive‐dog heart. Circ Res. 1989;64:721–733. [DOI] [PubMed] [Google Scholar]
- 30. Buckberg GD, Mahajan A, Jung B, Markl M, Hennig J, Ballester‐Rodes M. MRI myocardial motion and fiber tracking: a confirmation of knowledge from different imaging modalities. Eur J Cardiothorac Surg. 2006;29(suppl 1):S165–S177. [DOI] [PubMed] [Google Scholar]
- 31. Moon MR, Ingels NB, Daughters GT, Stinson EB, Hansen DE, Miller DC. Alterations in left‐ventricular twist mechanics with inotropic stimulation and volume loading in human‐subjects. Circulation. 1994;89:142–150. [DOI] [PubMed] [Google Scholar]
- 32. Gupta MK, Gulick J, James J, Osinska H, Lorenz JN, Robbins J. Functional dissection of myosin binding protein C phosphorylation. J Mol Cell Cardiol. 2013;64:39–50. [DOI] [PMC free article] [PubMed] [Google Scholar]
- 33. Finley NL, Cuperman TI. Cardiac myosin binding protein‐C: a structurally dynamic regulator of myocardial contractility. Pflugers Arch. 2014;466:433–438. [DOI] [PubMed] [Google Scholar]
- 34. Yin ZY, Ren J, Guo W. Sarcomeric protein isoform transitions in cardiac muscle: a journey to heart failure. Biochim Biophys Acta. 2015;1852:47–52. [DOI] [PMC free article] [PubMed] [Google Scholar]
- 35. Politou AS, Thomas DJ, Pastore A. The folding and stability of titin immunoglobulin‐like modules, with implications for the mechanism of elasticity. Biophys J. 1995;69:2601–2610. [DOI] [PMC free article] [PubMed] [Google Scholar]
- 36. Moolman‐Smook J, Flashman E, de Lange W, Li ZL, Corfield V, Redwood C, Watkins H. Identification of novel interactions between domains of myosin binding protein‐C that are modulated by hypertrophic cardiomyopathy missense mutations. Circ Res. 2002;91:704–711. [DOI] [PubMed] [Google Scholar]
- 37. Gautel M, Zuffardi O, Freiburg A, Labeit S. Phosphorylation switches specific for the cardiac isoform of myosin binding protein‐C: a modulator of cardiac contraction. EMBO J. 1995;14:1952–1960. [DOI] [PMC free article] [PubMed] [Google Scholar]
- 38. Mohamed AS, Dignam JD, Schlender KK. Cardiac myosin‐binding protein C (MyBP‐C): identification of protein kinase A and protein kinase C phosphorylation sites. Arch Biochem Biophys. 1998;358:313–319. [DOI] [PubMed] [Google Scholar]
- 39. Xiao L, Zhao Q, Du Y, Yuan C, Solaro RJ, Buttrick PM. PKC epsilon increases phosphorylation of the cardiac myosin binding protein C at serine 302 both in vitro and in vivo. Biochemistry. 2007;46:7054–7061. [DOI] [PMC free article] [PubMed] [Google Scholar]
- 40. Sadayappan S, Gulick J, Osinska H, Barefield D, Cuello F, Avkiran M, Lasko VM, Lorenz JN, Maillet M, Martin JL, Brown JH, Bers DM, Molkentin JD, James J, Robbins J. A critical function for Ser‐282 in cardiac myosin binding protein‐C phosphorylation and cardiac function. Circ Res. 2011;109:141–150. [DOI] [PMC free article] [PubMed] [Google Scholar]
- 41. Bardswell SC, Cuello F, Rowland AJ, Sadayappan S, Robbins J, Gautel M, Walker JW, Kentish JC, Avkiran M. Distinct sarcomeric substrates are responsible for protein kinase D‐mediated regulation of cardiac myofilament Ca2+ sensitivity and cross‐bridge cycling. J Biol Chem. 2010;285:5674–5682. [DOI] [PMC free article] [PubMed] [Google Scholar]
- 42. Cuello F, Bardswell SC, Haworth RS, Ehler E, Sadayappan S, Kentish JC, Avkiran M. Novel role for p90 ribosomal S6 kinase in the regulation of cardiac myofilament phosphorylation. J Biol Chem. 2011;286:5300–5310. [DOI] [PMC free article] [PubMed] [Google Scholar]
- 43. Shaffer JF, Kensler RW, Harris SP. The myosin‐binding protein C motif binds to F‐actin in a phosphorylation‐sensitive manner. J Biol Chem. 2009;284:12318–12327. [DOI] [PMC free article] [PubMed] [Google Scholar]
- 44. Garvey JL, Kranias EG, Solaro RJ. Phosphorylation of C‐protein, troponin‐I, and phospholamban in isolated rabbit hearts. Biochem J. 1988;249:709–714. [DOI] [PMC free article] [PubMed] [Google Scholar]
- 45. Gruen M, Gautel M. Mutations in beta‐myosin S2 that cause familial hypertrophic cardiomyopathy (FHC) abolish the interaction with the regulatory domain of myosin‐binding protein‐C. J Mol Biol. 1999;286:933–949. [DOI] [PubMed] [Google Scholar]
- 46. Weisberg A, Winegrad S. Alteration of myosin cross bridges by phosphorylation of myosin‐binding protein C in cardiac muscle. Proc Natl Acad Sci USA. 1996;93:8999–9003. [DOI] [PMC free article] [PubMed] [Google Scholar]
- 47. Winegrad S. Cardiac myosin binding protein C. Circ Res. 1999;84:1117–1126. [DOI] [PubMed] [Google Scholar]
- 48. Winegrad S. Myosin binding protein C, a potential regulator of cardiac contractility. Circ Res. 2000;86:6–7. [DOI] [PubMed] [Google Scholar]
- 49. Decker RS, Nakamura S, Decker ML, Sausamuta M, Sinno S, Harris K, Klocke FJ, Kulikovskaya I, Winegrad S. The dynamic role of cardiac myosin binding protein‐C during ischemia. J Mol Cell Cardiol. 2012;52:1145–1154. [DOI] [PubMed] [Google Scholar]
- 50. Previs MJ, Prosser BL, Mun JY, Previs SB, Gulick J, Lee K, Robbins J, Craig R, Lederer WJ, Warshaw DM. Myosin‐binding protein C corrects an intrinsic inhomogeneity in cardiac excitation‐contraction coupling. Sci Adv. 2015;1:e1400205. [DOI] [PMC free article] [PubMed] [Google Scholar]
- 51. Harris SP, Lyons RG, Bezold KL. In the thick of it HCM‐causing mutations in myosin binding proteins of the thick filament. Circ Res. 2011;108:751–764. [DOI] [PMC free article] [PubMed] [Google Scholar]
- 52. Copeland ON, Sadayappan S, Messer AE, Steinen GJM, van der Velden J, Marston SB. Analysis of cardiac myosin binding protein‐C phosphorylation in human heart muscle. J Mol Cell Cardiol. 2010;49:1003–1011. [DOI] [PubMed] [Google Scholar]
- 53. Jacques AM, Copeland ON, Messer AE, Gallon CE, King K, McKenna WJ, Tsang VT, Marston SB. Myosin binding protein C phosphorylation in normal, hypertrophic and failing human heart muscle. J Mol Cell Cardiol. 2008;45:209–216. [DOI] [PubMed] [Google Scholar]
- 54. Levine R, Weisberg A, Kulikovskaya I, McClellan G, Winegrad S. Multiple structures of thick filaments in resting cardiac muscle and their influence on cross‐bridge interactions. Biophys J. 2001;81:1070–1082. [DOI] [PMC free article] [PubMed] [Google Scholar]
- 55. Turnbull L, Hoh JFY, Ludowyke RI, Rossmanith GH. Troponin I phosphorylation enhances crossbridge kinetics during beta‐adrenergic stimulation in rat cardiac tissue. J Physiol. 2002;542:911–920. [DOI] [PMC free article] [PubMed] [Google Scholar]
- 56. Burghardt TP, Ajtai K. Heart brakes. Science. 2012;337:1182–1183. [DOI] [PubMed] [Google Scholar]
- 57. Moen CA, Salminen PR, Grong K, Matre K. Left ventricular strain, rotation, and torsion as markers of acute myocardial ischemia. Am J Physiol Heart Circ Physiol. 2011;300:H2142–H2154. [DOI] [PubMed] [Google Scholar]
- 58. Chen X, Nakatani S. Transmural myocardial strain gradient: a new and robust quantitative index of left ventricular wall motion based on myocardial strain imaging. Echocardiography. 2011;28:181–187. [DOI] [PubMed] [Google Scholar]
- 59. Cazorla O, Lacampagne A. Regional variation in myofilament length‐dependent activation. Pflugers Arch. 2011;462:15–28. [DOI] [PubMed] [Google Scholar]
- 60. Chuang JS, Zemljic‐Harpf A, Ross RS, Frank LR, McCulloch AD, Omens JH. Determination of three‐dimensional ventricular strain distributions in gene‐targeted mice using tagged MRI. Magn Reson Med. 2010;64:1281–1288. [DOI] [PMC free article] [PubMed] [Google Scholar]
- 61. Legrice IJ, Takayama Y, Covell JW. Transverse‐shear along myocardial cleavage planes provides a mechanism for normal systolic wall thickening. Circ Res. 1995;77:182–193. [DOI] [PubMed] [Google Scholar]
Associated Data
This section collects any data citations, data availability statements, or supplementary materials included in this article.
Supplementary Materials
Data S1. Supplementary methods.
Figure S1. Generalized Q‐space imaging (GQI): MRI method to assess ventricular wall myoarchitecture. Simulations of the morphology of Q‐space using a shell configuration, with a single diffusion sensitivity (or B value), carried out to study the effect of MR gradient distribution on the angular resolution of GQI, with (A) net angular resolution in Q‐space displayed in terms of the number and size of continuous facets and (B) directionally coded gradient vectors (length scaled to B value), depicted for 512 directions in three‐dimensional space. GQI relates the diffusion signal to molecular displacement through the Fourier transform. Employing the convention of Q‐space as a mathematical description of the diffusion environment probed by the application of diffusion‐weighted gradients, GQI considers the morphology and distribution of MR field gradients and results in the generation of a voxel‐scale probability distribution function (PDF) for diffusivity based on the presence and orientation of diffusional boundaries in tissue. The principal fiber directions indicated with the shape of the diffusional PDF may be connected to coaligned diffusion vectors in adjacent voxels through streamlining methods in order to generate multivoxel myofiber tracts that depict macro‐scale fiber anatomy.
Figure S2. Defining angular separation with underlying anatomy. A, Demonstration with limited tracts of crossing helix angles in the LV and circular tracts in a parallel configuration in the RV. B, Coalignment at the mid‐myocardial depth between the LV free wall, septum (S), and RV, magnified in (C). Scale bars are represented in A and B with a relative size of 1 mm and in (C) with size of 200 μm.
Figure S3. Transmural variation of myocardial fiber helix angle in the normal ventricular wall (WT mouse). A, GQI was used to reveal myoarchitectural patterns in the wall of the left and right ventricles. This analysis showed a pattern of crossing helices in the LV oriented to the apex and ranging from −90 in the epicardium to 0 degrees in the mid‐myocardium to +90 degrees in the endocardium. GQI tractography of cardiac myoarchitecture is shown at varying depths through the walls of the RV and LV (B through D) in order to demonstrate coalignment between the 2. GQI tractography is shown for all layers of the myocardium (B), the epicardium and endocardium selectively (C), and the mid‐myocardium selectively (D). Coalignment between the LV and RV is most prominent at the mid‐ventricular wall, where the helix angle approximates zero. Scale bars are represented throughout (B through D) with a relative size of 1 mm.
Figure S4. Myoarchitectural phenotype associated with phospho‐mimetic MYBPC3. Coherence in excised mouse hearts from the MYBPC3AllP+/(t/t) phenotype analyzed by GQI tractography is displayed with fiber architecture (in A) by overlaying long tracts (tract length, 50 mm; red) selected from the overall data set (silver background). Long tracts are displayed (in B) with directional color coding (described by inset) to discriminate fiber transmission direction. Helix angle was compared in transverse section of the LV wall for MYBPC3AllP+/(t/t) hearts (C and D). Fiber orientations (C) are encoded to helix angle (inset shown at the top right of (C) indicates quantitative helix angle encoding). The location of the transverse section through the LV in (C) is shown in inset, where red indicates the selected section and silver is the entire transverse section. The LV section was rotated, enabling visualization of the endocardium wall (endo; D). Scale bars are represented throughout (A through D) with a relative size of 1 mm.
Figure S5. Unique myoarchitectural features associated with MYBPC3 ablation. GQI architectural analysis was performed in transgenic (TG) MYBPC3(t/t) hearts in which unstable MYBPC3 protein is truncated and targeted for degradation. A closer look at myofiber orientation in the LV transverse sections demonstrated the presence of microhelical fibers (in A), and with a close‐up view (in B). Scale bars are represented with a relative size of 1 mm (in A) and 200 μm (in B).