

Abstract
Homozygous deletion of the survival motor neuron 1 gene (SMN1) causes spinal muscular atrophy (SMA), the most frequent genetic cause of early childhood lethality. In rare instances, however, individuals are asymptomatic despite carrying the same SMN1 mutations as their affected siblings, thereby suggesting the influence of modifier genes. We discovered that unaffected SMN1-deleted females exhibit significantly higher expression of plastin 3 (PLS3) than their SMA-affected counterparts. We demonstrated that PLS3 is important for axonogenesis through increasing the F-actin level. Overexpression of PLS3 rescued the axon length and outgrowth defects associated with SMN down-regulation in motor neurons of SMA mouse embryos and in zebrafish. Our study suggests that defects in axonogenesis are the major cause of SMA, thereby opening new therapeutic options for SMA and similar neuromuscular diseases.
Spinal muscular atrophy (SMA), a common autosomal recessive neuromuscular disease, is caused by homozygous mutations of the survival motor neuron 1 gene (SMN1), whereas the severity of the disease is primarily influenced by the number of SMN2 copies (1). SMN2, which usually occurs in one to four copies per genotype, produces insufficient full-length SMN transcript and protein to rescue the SMA phenotype (2–4). However, a small proportion of individuals homozygous for the absence of SMN1 are fully asymptomatic despite carrying an identical number of SMN2 copies as their affected siblings, suggesting the influence of modifier genes (5–8). Usually, SMA-affected siblings are very similar in terms of their age at onset and the progression of disease (9). Between families, however, the SMA phenotype varies between type I (most severe form, patients unable to sit or walk) and type IV (adult form, mild muscle weakness) (10, 11). Reduced levels of SMN cause degeneration of α motor neurons (MNs) in the spinal cord, leading to muscle weakness and atrophy in SMA patients (10). Moreover, SMN depletion causes several anomalies, including aberrant MN axon pathfinding, reduced growth velocity, reduced growth cone sizes, and anomalous calcium-channel clustering in the growth cone (12–14). SMN is a housekeeping protein involved in small nuclear ribonucleoprotein biogenesis and splicing (15, 16) that also plays a role in axonal growth, neuromuscular junction formation, and the transport of RNA along axons (12, 17, 18). The detailed molecular pathogenesis of SMA, however, is still unknown.
We identified six SMA-discordant families with eight fully asymptomatic females who had inherited the same SMN1 and SMN2 alleles as their affected siblings (Fig. 1A and table S1) (5, 19). To identify SMA modifier genes, we first carried out a transcriptome-wide differential expression analysis using total RNA from the lymphoblastoid cell lines (LBs) of four SMN1-deleted siblings from family no. 482 (Fig. 1A), together with two unrelated type I and two type III SMA patients. The unrelated type I and III SMA patients were included to exclude differentially expressed transcripts caused by different SMN levels. In total, 18 transcripts showed a greater than threefold difference in expression (table S2). However only plastin 3 (PLS3, T-plastin or T-fimbrin; MIM 300131, Xq23) exhibited statistically different transcription levels in the affected and unaffected siblings of all SMA-discordant families (Student’s t test = 5.560, resampling P < 10−4), thereby rendering PLS3 the sole candidate for modifying SMA. All unaffected SMN1-deleted siblings revealed high PLS3 expression (mean ± SEM = 1.298 ± 0.385), whereas all but one affected male showed no expression (Fig. 1B). Previous reports have implied that PLS3 is not expressed in the hematopoietic system at all, but only in solid tissues, including the spinal cord (20). We ruled out the possibility that PLS3 expression in LBs was induced by Epstein-Barr virus transformation by showing that it was also expressed in native white blood cells (individual 783 in Fig. 1B). The expression of PLS3 was also confirmed at the protein level (Fig. 1B and fig. S1).
Fig. 1.
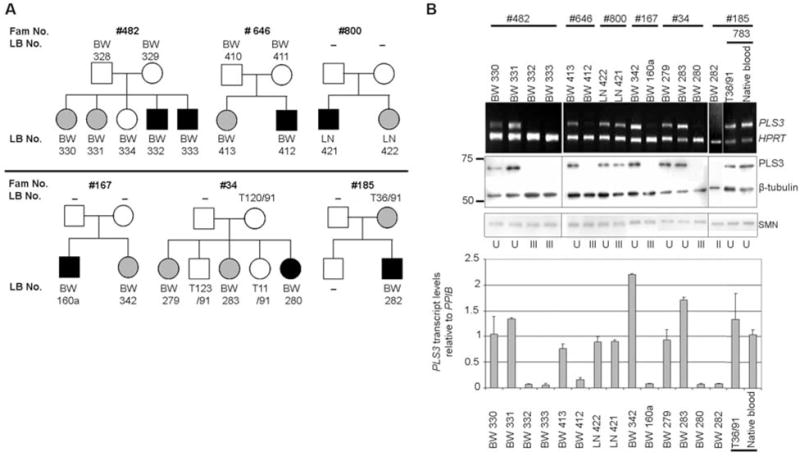
Analysis of PLS3 expression in SMA-discordant families. (A) Pedigrees of SMA-discordant families showing unaffected (gray) and affected (black) SMN1-deleted siblings. BW, LN, and T are internal lab codes. –, not available. (B) (Top) sqRT-PCR of PLS3 and HPRT (control) in SMA-discordant families. (Middle) Western blot analysis of PLS3 protein, SMN, and β-tubulin (control). (Bottom) qRT-PCR of PLS3 transcript relative to cyclophilin B (PPIB). Data are mean ± SEM (error bars). U, unaffected; II, type II SMA; III, type III SMA. Equal PLS3 expression was observed in both native blood and LBs (exemplified by individual 783).
To test whether PLS3 expression was unique to SMA-discordant families, we used both semi-quantitative reverse transcription polymerase chain reaction (sqRT-PCR) and quantitative RT-PCR (qRT-PCR) to analyze 98 RNA samples from the native blood of healthy controls and 101 RNA samples from LBs of unrelated type I to III SMA patients. PLS3 was highly expressed in only 5% of the healthy controls (three females and two males), confirming that PLS3 expression in blood is rare (fig. S2 and table S3A). However, 16% of type I to III SMA patients (six females and ten males) highly expressed PLS3 (fig. S2 and table S3B), and the difference between controls and SMA patients was highly significant (Fisher’s exact P = 0.0018). Three of the six highly expressing female patients for whom clinical data were available had only very mild and slowly progressing SMA, despite carrying only two SMN2 copies (table S4A). In contrast, the disease phenotype of the 10 highly expressing SMA males correlated with the SMN2 genotype as expected (table S4B). These findings suggest that PLS3 is a gender-specific SMA modifier whose protective effect may not be fully penetrant, thereby pointing toward an interaction with additional unknown factors.
All our attempts to identify the molecular basis of the differential PLS3 expression observed in blood (supporting online material text and figs. S3 to S5) provided no unequivocal answer as to whether the expression of PLS3 in blood is regulated by cis- or transacting factor(s).
PLS3 was highly expressed in the human fetal and adult spinal cord (fig. S6). In rat pheochromocytoma 12 (PC12) cells, Pls3 expression significantly increased during neuronal differentiation (fig. S7), suggesting a role for Pls3 in this process. At the protein level, PLS3 and SMN associated in vivo in both human embryonic kidney–293 (HEK293) cells and the mouse spinal cord (Fig. 2A). However, no direct interaction was detected in an in vitro pull-down assay between the recombinant PLS3 and SMN proteins (Fig. 2B), suggesting the involvement of other proteins. Blue-native–polyacrylamide gel electrophoresis (BN-PAGE), followed by a second-dimension SDS-PAGE, from murine spinal cord extracts revealed that Pls3, Smn, and actin are part of a ~500-kilodalton complex and that Pls3 and Smn alone were also present in a second complex of ~200 kilodaltons that was not visible on the Western blot after first-dimension BN-PAGE (Fig. 2C).
Fig. 2.
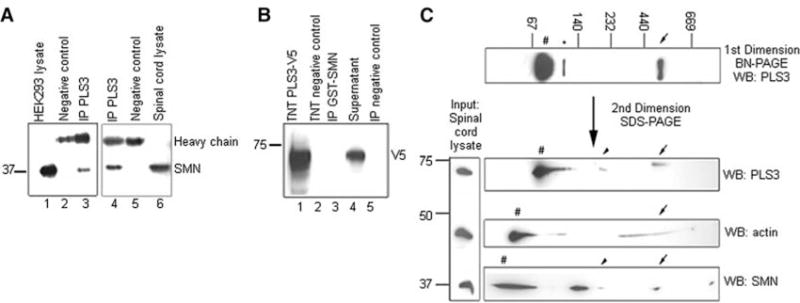
PLS3 and SMN associate in a large protein complex. (A) HEK293 total cell lysates (lane 1 at left) and murine spinal cord (lane 6 at right) were immunoprecipitated (IP) with anti-PLS3 antibody (lanes 3 and 4) and Western blotted with anti-SMN antibody. (B) Recombinant PLS3-V5 protein produced in vitro using TnT Quick Coupled Transcription/Translation System (Promega) system (lane 1) was incubated with glutathione S-transferase (GST)–SMN, immunoprecipitated with anti-GST beads (lane 3), and analyzed by Western blotting with anti-V5 antibody. (C) Total murine spinal cord lysates were resolved onto BN-PAGE gels and stained with anti-PLS3 antibody. The first-dimension gel was followed by a second SDS-PAGE and Western blot (WB) analysis, allowing the identification of proteins belonging to common protein complexes. Arrows denote the ~500-kilodalton Pls3-Smn-actin complex, and arrowheads denote the ~200-kilodalton Pls3-Smn complex. Number signs indicate monomeric form, and the asterisk indicates putative Pls3 dimer.
PLS3 binds and bundles actin filaments (21). Monomeric globular G-actin subunits assemble into filamentous F-actin polymers. Bundled F-actin accumulates at the distal extensions of growth cones and filopodia (22). Actin cytoskeleton dynamics [G-actin/F-actin (G/F-actin) ratio] plays a major role in axon growth, pathfinding, and branching (22). To investigate the potential function of PLS3 in axonal growth and pathfinding, we examined the relation between the G/F-actin ratio and the PLS3 level. Unaffected SMN1-deleted siblings who highly expressed PLS3 had significantly increased F-actin levels (P < 10−4) in LBs, as compared with their affected siblings who lacked PLS3 expression (Fig. 3A). A comparison between type I and type III SMA patients who either do or do not express PLS3 revealed that only PLS3 (but not SMN) has a significant effect on F-actin levels (P = 0.0029) (Fig. 3B). Similar results were obtained by knocking down and/or overexpressing PLS3 or SMN in HEK293 cells (Fig. 3C). These data support the view that PLS3 modifies SMA pathogenesis through stabilizing the growth cones by elevating the F-acting level, as is required for axonogenesis (22).
Fig. 3.
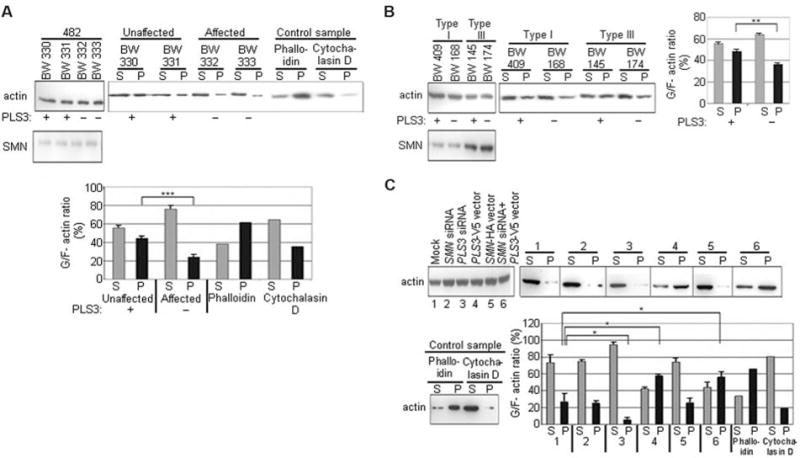
PLS3 influences the G/F-actin ratio in vivo. G/F-actin levels in (A) SMA-discordant family no. 482, (B) SMA patients, and (C) HEK293 cells after overexpression or knockdown of PLS3 and/or SMN as indicated. (A) to (C) (Left) actin input. (Right) Western blot analysis of G-actin fractions in the supernatant (S) and F-actin fractions in the pellet (P). A phalloidin-treated sample served as a positive control for F-actin; a cytochalasin D–treated sample served as a negative control. +, PLS3 expression; −, no expression. The bar charts show the quantification of G/F-actin levels. Data are mean ± SD (error bars). *P < 0.05; **P < 0.01; ***P < 0.001.
In neuronal differentiated PC12 cells, both endogenous Pls3 and Smn showed diffuse staining in the cytoplasm (especially under the membrane cortex) and accumulated in growth cones and varicosities along the neurites (fig. S8, A and B). Triple-label experiments with Pls3, Smn, and actin in primary murine MNs revealed that endogenous Pls3 and SMN colocalize and are enriched in granules throughout the axons of MNs and accumulate at F-actin–rich growth cones (fig. S8C).
When the functional role of Pls3 was investigated in neuronal-like PC12 cells, both a Pls3 and an Smn knockdown had a dramatic effect on maximum neurite length, compared with control-treated cells (both P < 10−5) (Fig. 4A). Overexpression or knockdown of PLS3 in PC12 cells had no effect on SMN expression levels or on the cellular location of SMN (Fig. 4A and fig. S10). Furthermore, the growth cone morphology was affected by Pls3 depletion (column 3 and inset in Fig. 4A). In contrast, PC12 cells overexpressing PLS3 exhibited significantly longer neurites (P < 10−5) than did control cells (Fig. 4A). Some 10% of neurites overexpressing PLS3 were markedly elongated, and 30% of them showed cytoplasmic hairlike projections (fig. S9). Simultaneous overexpression of PLS3 and knockdown of Smn led to a highly significant rescue (P < 10−5) of average neurite lengths as compared with Smn-deficient cells (Fig. 4A).
Fig. 4.
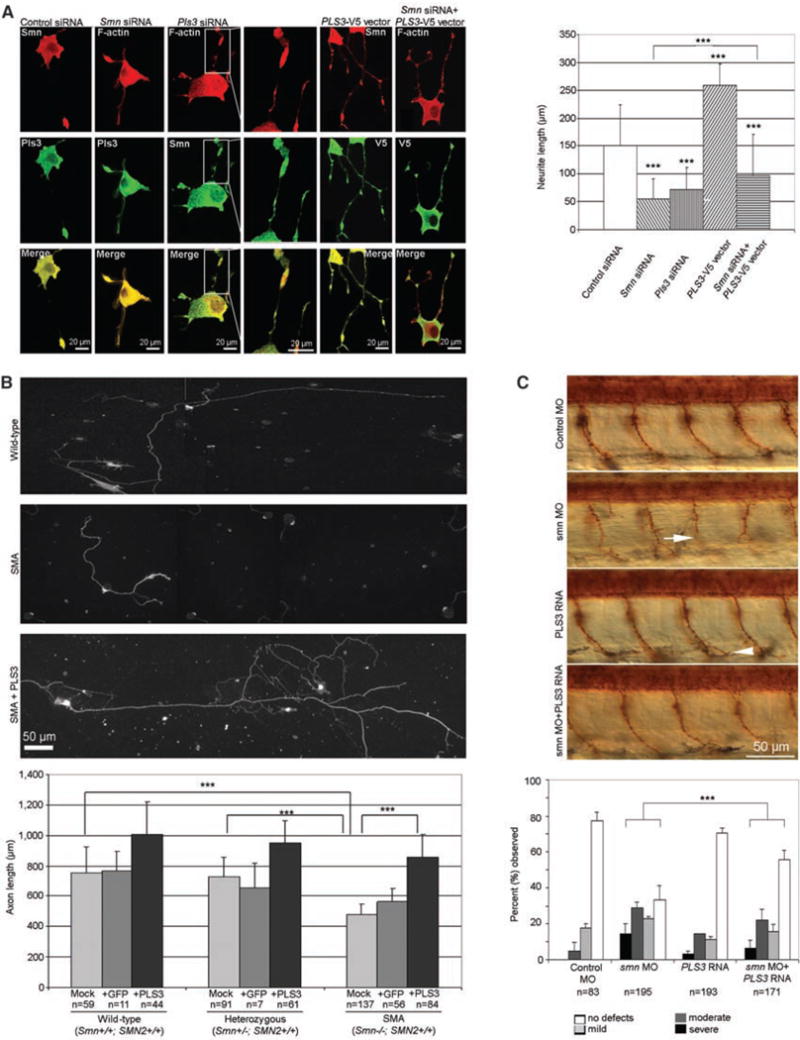
PLS3 is involved in axonogenesis and rescues the axon length in SMA MNs. (A) (Left) Confocal microscopy of neuronal differentiated PC12 cells after transfection as indicated above the panel (see fig. S10 for efficiency). The antibodies that were used are indicated. (Right) Measurements of maximum neurite length in PC12 cells (n = 100 neurites) after transfection and nerve growth factor differentiation for three days. (B) (Top) Primary MNs isolated at day E13.5 from WT (Smn+/+; SMN2+/+), heterozygous (Smn+/−; SMN2+/+), and SMA (Smn−/−; SMN2+/+) embryos, cultured for 7 days and immunostained with anti-Tau. (Bottom) The bar chart shows the measurement of axon length from WT, heterozygous, and SMA mouse embryos, which were mock-, GFP-, or PLS3-transduced. (C) (Top) Lateral view of zebrafish embryos treated with control MO, smn MO, PLS3 RNA, and smn MO + PLS3 RNA. Motor axons were visualized with znp1 antibody at 36 hours post fertilization. The arrow indicates a severely truncated motor axon in an smn morphant, and the arrowhead indicates a mild ventral branch in a PLS3 injected embryo. The bar chart illustrates that embryos were classified as severe, moderate, mild, or no defects, as previously described (24), and the percentage for each group is shown. (A) to (C) Data are mean ± SD (error bars). ***P < 10−4.
To further assess the modifying role of PLS3 in SMA pathogenesis, we used a mouse model for severe SMA carrying two human SMN2 copies on a null Smn background (23). MNs were isolated from SMA (Smn−/−;SMN2+/+), heterozygous (Smn+/−;SMN2+/+), and wild-type (WT) (Smn+/+;SMN2+/+) E13.5 embryos, transduced with a lentivirus expressing either green fluorescent protein (GFP) or PLS3-GFP, cultured for 7 days, and assessed for axonal length with antibodies to Tau (anti-Tau) (Fig. 4B). SMA MNs exhibited a significant reduction in axon length compared with cells from either WT or heterozygous embryos (both P < 10−5), confirming previous findings (13). The detrimental effect of a reduced SMN level on axonal length was significantly rescued (P < 10−5) by PLS3 overexpression, and axons reached lengths comparable to nontransduced or Pls3-transduced MNs from WT and heterozygous embryos (Fig. 4B). However, as shown in humans, a certain amount of SMN seems to be required for full rescue.
Finally, we investigated the modifying effect of PLS3 in vivo by knocking down zebrafish smn with antisense morpholino (MO) and by co-overexpression of human PLS3. Human and zebrafish PLS3 are 86% identical. It has been shown that decreased levels of smn result in motor axon–specific outgrowth defects (such as truncations and ectopic branches, that can only be rescued by WT SMN, but not by mutated Δ7SMN) (12, 24), and perturbations due to reduced levels of smn can be clearly visualized (24). Whereas PLS3 overexpression in zebrafish embryos using 200 pg of PLS3 RNA revealed a slight but nonsignificant increase in mild and moderate axon defects compared with controls, the co-injection of smn MO (9 ng) and PLS3 RNA (200 pg) significantly rescued the aberrant axonal outgrowth (P < 10−4) in comparison with smn MO alone (9 ng) (Fig. 4C), suggesting that PLS3 plays a modifying role in the zebrafish SMA model as well. To further elucidate its functional role, we also knocked down pls3 in zebrafish embryos. Whereas 9 ng of pls3 MO resulted in only 40% knockdown, without a phenotypic effect on motor axons, a higher dose of pls3 MO (12 ng) resulted in 90% lethality. This detrimental effect was partially rescued by co-injection of human PLS3 RNA, indicating that the knockdown was specific and that pls3 plays an essential role in early zebrafish development. Co-injection of both smn and pls3 MO (9 ng each) also led to full embryonic lethality, suggesting a synergistic effect of the two proteins.
Taken together, our data provide evidence that PLS3 acts as a protective modifier of SMA. The capability of PLS3 to rescue the detrimental effects of reduced SMN levels on axon growth supports the view that axon biology is crucial for SMA pathogenesis and that proteins stabilizing the axon can modify the disease phenotype. As yet, we neither know the cause of the rare PLS3 expression in blood, nor do we understand the gender-specificity of the SMA protective effect of PLS3, but we may speculate that the same regulatory elements that are active in blood are responsible for the modified expression of PLS3 in the spinal cords of unaffected SMN1-deleted females. The fact that PLS3 can protect against SMA provides an opportunity to identify regulatory mechanisms that influence the PLS3-SMN complex in MNs. Such knowledge would add insights into the molecular pathogenesis of SMA, as well as that of other related MN diseases, and may help to identify targets for the therapy of these devastating disorders.
Supplementary Material
Acknowledgments
We thank SMA families and genetic counselors, especially S. Rudnik-Schöneborn and K. Zerres; J. L. Schultze, S. Debey, P. Nürnberg, M. Reza-Toliat, F. Rivero-Crespo, and F.G. Hanisch at the Univ. of Cologne for allowing us to use their facilities and for helpful advice; G. Morris (Oswestry, UK) for the mouse anti-survival motor neurons proteins 1 antibody; and B. Wollnik, C. Kubisch, and R. Heller for critical reading of the manuscript. This work was supported by the Center for Molecular Medicine Cologne and the Deutsche Forschungsgemeinschaft (B.W.), families of SMA (W.R. and M.L.M.), and NIH grants RO1NS50414 (C.E.B.) and HD055835 (G.J.B.).
Footnotes
Supporting Online Material
www.sciencemag.org/cgi/content/full/320/5875/524/DC1
Materials and Methods
SOM Text
References and Notes
References and Notes
- 1.Lefebvre S, et al. Cell. 1995;80:155. doi: 10.1016/0092-8674(95)90460-3. [DOI] [PubMed] [Google Scholar]
- 2.Lorson CL, Hahnen E, Androphy EJ, Wirth B. Proc Natl Acad Sci USA. 1999;96:6307. doi: 10.1073/pnas.96.11.6307. [DOI] [PMC free article] [PubMed] [Google Scholar]
- 3.Lefebvre S, et al. Nat Genet. 1997;16:265. doi: 10.1038/ng0797-265. [DOI] [PubMed] [Google Scholar]
- 4.Feldkotter M, Schwarzer V, Wirth R, Wienker TF, Wirth B. Am J Hum Genet. 2002;70:358. doi: 10.1086/338627. [DOI] [PMC free article] [PubMed] [Google Scholar]
- 5.Hahnen E, et al. Hum Mol Genet. 1995;4:1927. doi: 10.1093/hmg/4.10.1927. [DOI] [PubMed] [Google Scholar]
- 6.Cobben JM, et al. Am J Hum Genet. 1995;57:805. [PMC free article] [PubMed] [Google Scholar]
- 7.Wang CH, et al. Hum Mol Genet. 1996;5:359. doi: 10.1093/hmg/5.3.359. [DOI] [PubMed] [Google Scholar]
- 8.Prior TW, Swoboda KJ, Scott HD, Hejmanowski AQ. Am J Med Genet. 2004;130A:307. doi: 10.1002/ajmg.a.30251. [DOI] [PMC free article] [PubMed] [Google Scholar]
- 9.Rudnik-Schöneborn S, Rohrig D, Morgan G, Wirth B, Zerres K. Am J Med Genet. 1994;51:70. doi: 10.1002/ajmg.1320510115. [DOI] [PubMed] [Google Scholar]
- 10.Munsat T, Davies K. Neuromuscul Disord. 1996;6:125. doi: 10.1016/0960-8966(95)00032-1. [DOI] [PubMed] [Google Scholar]
- 11.Zerres K, Rudnik-Schoneborn S. Arch Neurol. 1995;52:518. doi: 10.1001/archneur.1995.00540290108025. [DOI] [PubMed] [Google Scholar]
- 12.McWhorter ML, Monani UR, Burghes AH, Beattie CE. J Cell Biol. 2003;162:919. doi: 10.1083/jcb.200303168. [DOI] [PMC free article] [PubMed] [Google Scholar]
- 13.Rossoll W, et al. J Cell Biol. 2003;163:801. doi: 10.1083/jcb.200304128. [DOI] [PMC free article] [PubMed] [Google Scholar]
- 14.Jablonka S, Beck M, Lechner BD, Mayer C, Sendtner M. J Cell Biol. 2007;179:139. doi: 10.1083/jcb.200703187. [DOI] [PMC free article] [PubMed] [Google Scholar]
- 15.Liu Q, Fischer U, Wang F, Dreyfuss G. Cell. 1997;90:1013. doi: 10.1016/s0092-8674(00)80367-0. [DOI] [PubMed] [Google Scholar]
- 16.Pellizzoni L, Kataoka N, Charroux B, Dreyfuss G. Cell. 1998;95:615. doi: 10.1016/s0092-8674(00)81632-3. [DOI] [PubMed] [Google Scholar]
- 17.Zhang HL, et al. J Neurosci. 2003;23:6627. doi: 10.1523/JNEUROSCI.23-16-06627.2003. [DOI] [PMC free article] [PubMed] [Google Scholar]
- 18.Murray LM, et al. Hum Mol Genet. 2008;17:949. doi: 10.1093/hmg/ddm367. [DOI] [PubMed] [Google Scholar]
- 19.Materials and methods are available as supporting material on Science Online.
- 20.Lin CS, Lau A, Huynh T, Lue TF. DNA Cell Biol. 1999;18:27. doi: 10.1089/104454999315592. [DOI] [PubMed] [Google Scholar]
- 21.Delanote V, Vandekerckhove J, Gettemans J. Acta Pharmacol Sin. 2005;26:769. doi: 10.1111/j.1745-7254.2005.00145.x. [DOI] [PubMed] [Google Scholar]
- 22.Dent EW, Gertler FB. Neuron. 2003;40:209. doi: 10.1016/s0896-6273(03)00633-0. [DOI] [PubMed] [Google Scholar]
- 23.Monani UR, et al. Hum Mol Genet. 2000;9:333. doi: 10.1093/hmg/9.3.333. [DOI] [PubMed] [Google Scholar]
- 24.Carrel TL, et al. J Neurosci. 2006;26:11014. doi: 10.1523/JNEUROSCI.1637-06.2006. [DOI] [PMC free article] [PubMed] [Google Scholar]
Associated Data
This section collects any data citations, data availability statements, or supplementary materials included in this article.