Abstract
Progressive kidney diseases and renal fibrosis are associated with endothelial injury and capillary rarefaction. However, our understanding of these processes has been hampered by the lack of tools enabling the quantitative and noninvasive monitoring of vessel functionality. Here, we used micro-computed tomography (µCT) for anatomical and functional imaging of vascular alterations in three murine models with distinct mechanisms of progressive kidney injury: ischemia-reperfusion (I/R, days 1–56), unilateral ureteral obstruction (UUO, days 1–10), and Alport mice (6–8 weeks old). Contrast-enhanced in vivo µCT enabled robust, noninvasive, and longitudinal monitoring of vessel functionality and revealed a progressive decline of the renal relative blood volume in all models. This reduction ranged from −20% in early disease stages to −61% in late disease stages and preceded fibrosis. Upon Microfil perfusion, high-resolution ex vivo µCT allowed quantitative analyses of three-dimensional vascular networks in all three models. These analyses revealed significant and previously unrecognized alterations of preglomerular arteries: a reduction in vessel diameter, a prominent reduction in vessel branching, and increased vessel tortuosity. In summary, using µCT methodology, we revealed insights into macro-to-microvascular alterations in progressive renal disease and provide a platform that may serve as the basis to evaluate vascular therapeutics in renal disease.
Keywords: chronic kidney disease, fibrosis, imaging, capillary rarefaction, computed tomography, noninvasive
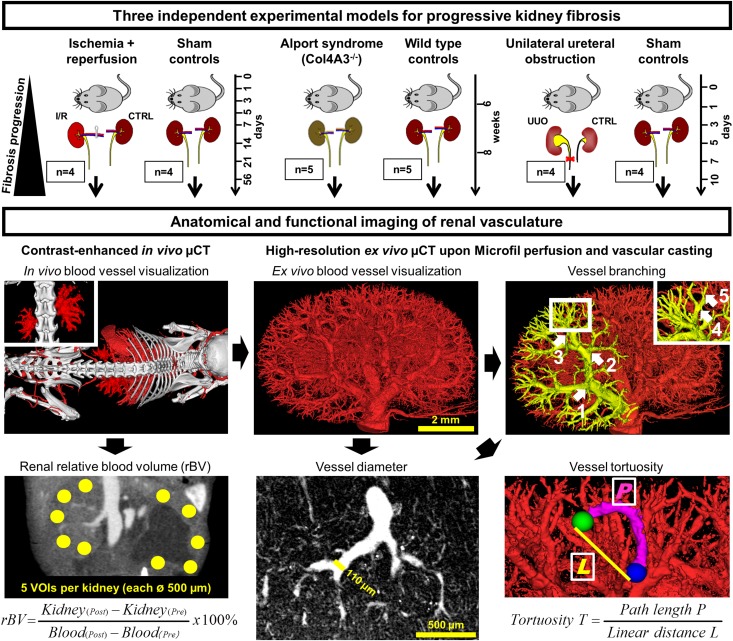
Capillary rarefaction and endothelial injury are important pathophysiological processes promoting renal fibrosis and CKD.1–7 Several recent studies suggested that restoring the renal microvasculature, via targeting of endothelial cells or their cross-talk with other renal cells, may provide a novel therapeutic approach in CKD.8–12 Some imaging techniques, e.g., magnetic resonance imaging or microscopy, have been employed for monitoring kidney function and capillary rarefaction during CKD.13–16 Thus far, however, no methods have been described for noninvasive and quantitative analyses of anatomical and functional changes in the renal vasculature during the progression of CKD. We have recently shown that contrast-enhanced flat-panel volumetric µCT can be employed for visualizing and quantifying vascular changes in tumors and in liver fibrosis.17–19 Here, we show that the combination of functional in vivo µCT with high-resolution anatomical ex vivo µCT enables a detailed, robust, and accurate assessment of macro-to-microvascular changes during early-to-late-stage progressive kidney disease. We applied contrast-enhanced in vivo µCT to determine the renal relative blood volume (rBV), which is defined as the percentage of the blood volume to the total organ volume.20 Subsequently, we performed Microfil perfusion and high-resolution ex vivo µCT imaging to determine branching, size and tortuosity of renal blood vessels (Figure 1). To model a broad spectrum of renal diseases, address potential disease-specific differences and describe the time-dependent dynamics of vascular alterations and their association with renal fibrosis, we have used three distinct models: unilateral ischemia-reperfusion-induced progressive kidney injury (I/R), a primary model of interstitial fibrosis, namely unilateral ureteral obstruction (UUO) and a model of progressive glomerulonephritis, namely Col4a3-deficient (Alport) mice (Figure 1).
Figure 1.
Experimental outline for anatomical and functional imaging of the renal vasculature during progressive kidney diseases. Three different murine models were investigated: I/R, Col4A3-deficient (Alport) mice and UUO. Using contrast-enhanced in vivo µCT, the renal relative blood volume (rBV) was determined noninvasively by quantifying the radiodensity of five spherical volumes of interests (VOIs) per kidney cortex. Upon Microfil perfusion, the 3D microarchitecture of the renal vasculature was visualized by high-resolution ex vivo µCT at a spatial resolution of 3 µm voxel side length, enabling the quantitative assessment of vessel branching, diameter and tortuosity in strict hierarchical order from the hilus (Aa. segmentales) to the periphery (afferent arterioles). Arrows demonstrate the order of rising branching points along the course of blood vessels. Vessel tortuosity was calculated as a ratio of the vessel length between two nearby branching points and the linear distance between those. CTRL, contralateral kidney.
RESULTS
Peritubular Capillary Rarefaction Correlates with Fibrosis in Chronic Kidney Disease Models
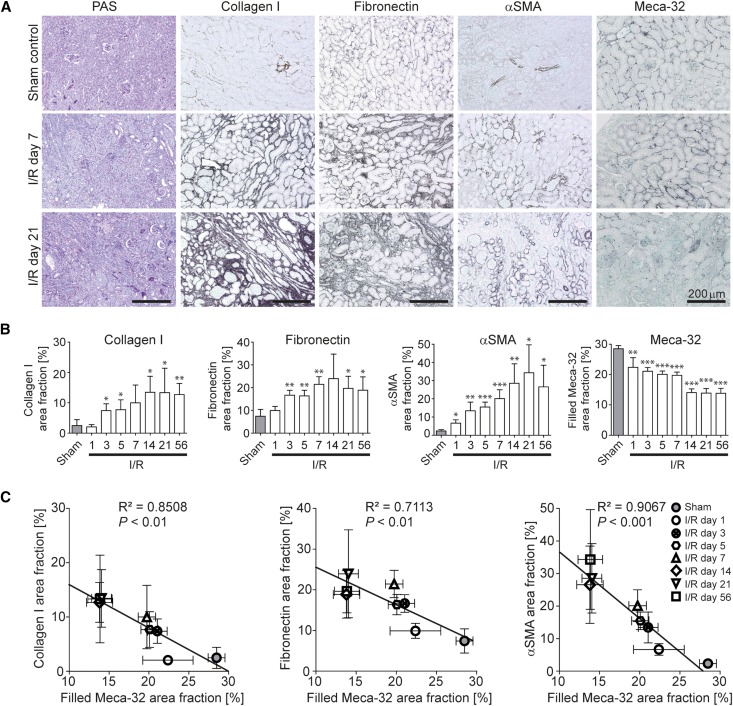
First, we analyzed mice with I/R-induced injury and monitored the entire time course from acute ischemic injury (day 1) to late-stage renal fibrosis (day 56).14,21 Histologically, a continuous increase of collagen I, fibronectin, and α-smooth muscle actin (αSMA)-positive fibroblasts confirmed the development of progressive fibrosis and was paralleled by a continuous decrease of Meca-32-positive capillaries (Figure 2, A and B). Significant correlations between these parameters demonstrated an association between progressive fibrosis and capillary loss (Figure 2, B and C). Importantly, the prominent early reduction of Meca-32 positive peritubular capillaries in I/R injury, found already on day 1, preceded the onset of fibrosis.
Figure 2.
Capillary rarefaction is closely associated with renal fibrosis in I/R-induced progressive kidney fibrosis. (A) PAS staining as well as collagen I, fibronectin, αSMA and Meca-32 immunohistochemistry of I/R kidneys or sham controls. (B) Time course of quantified positively stained area fractions for collagen I, fibronectin, αSMA, and of the filled Meca-32 area fraction representing the reconstructed vascular volume on 2D histologic slices. (C) Significant correlations were found between the computationally filled Meca-32 area fraction and quantified area fractions for collagen I (left panel), fibronectin (middle panel), and αSMA (right panel) demonstrating a close association between renal fibrosis and capillary rarefaction. *P<0.05; **P<0.01; ***P<0.001. Correlation analyses were performed by calculating R2 (square of Pearson correlation coefficient). PAS, periodic acid-Schiff.
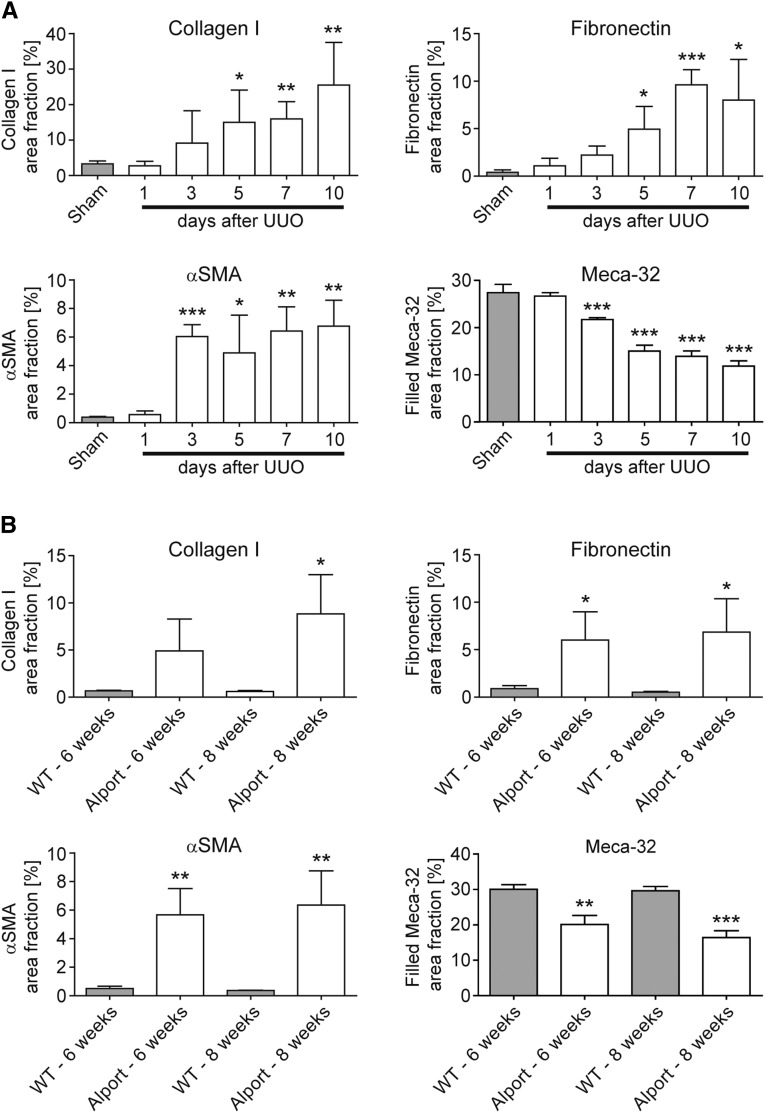
In order to exclude model-specific effects related to I/R-induced progressive kidney injury, the correlation between progressive fibrosis and continuous vessel rarefaction was histologically confirmed in UUO (days 1–10) and Alport mice (6–8 weeks). Comparable to the time-course findings obtained in the I/R model, a prominent early reduction of Meca-32 positive cortical peritubular capillaries on day 3 also preceded the onset of significant fibrosis, as found on day 5 in the UUO model (Figure 3A). Analogously, also in Alport mice, progressive loss of Meca-32 positive capillaries was paralleled by fibrosis development (Figure 3B).
Figure 3.
Capillary rarefaction is closely associated with renal fibrosis in UUO and in Alport mice. (A) Time course of quantified positively stained area fractions for collagen I, fibronectin, αSMA and of the filled Meca-32 area fraction in UUO kidneys using immunohistochemistry. (B) Time course of the same parameters in kidneys of Alport versus wild type (WT) mice. *P<0.05; **P<0.01; ***P<0.001.
Functional In Vivo µCT Imaging Allows Accurate Assessment of Reduced Vessel Functionality in Chronic Kidney Disease Models
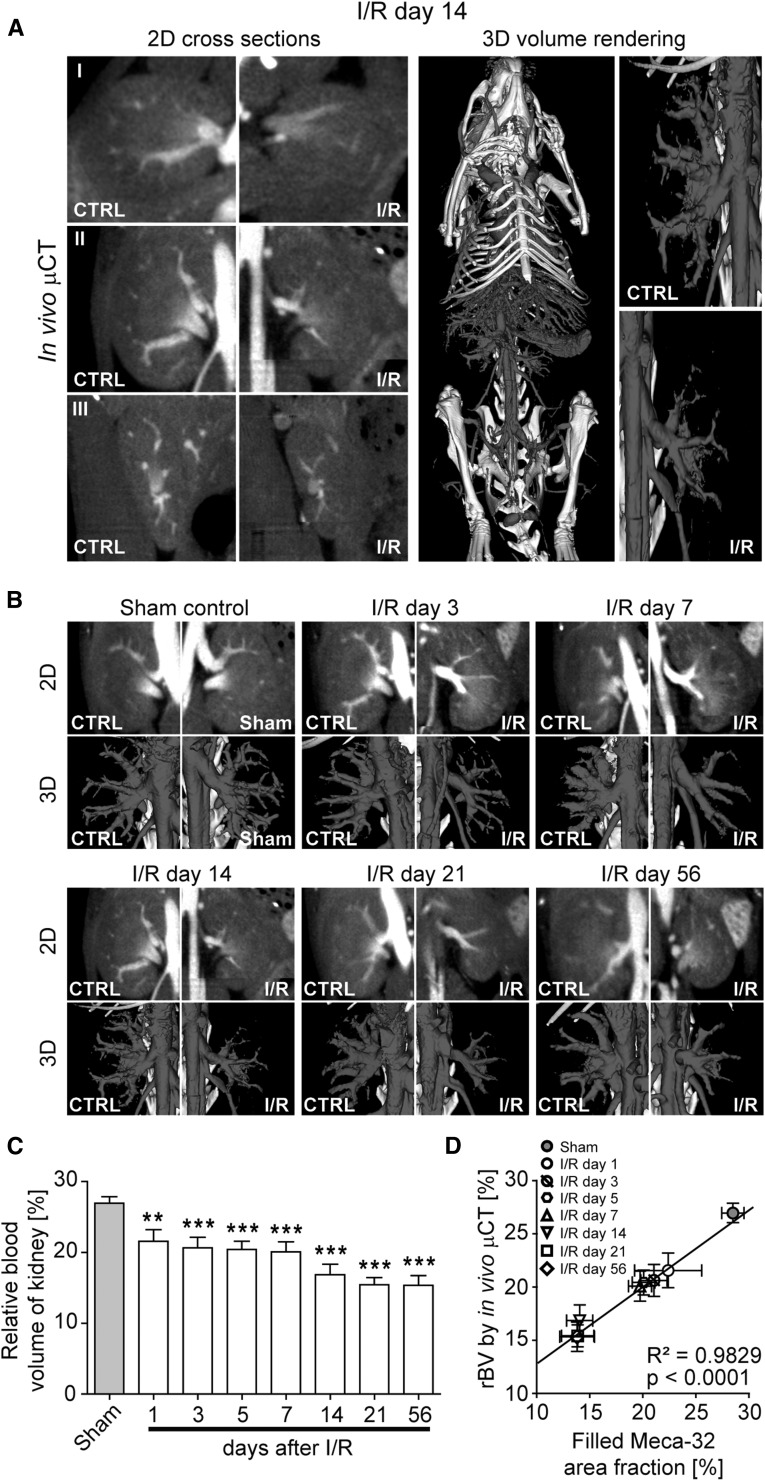
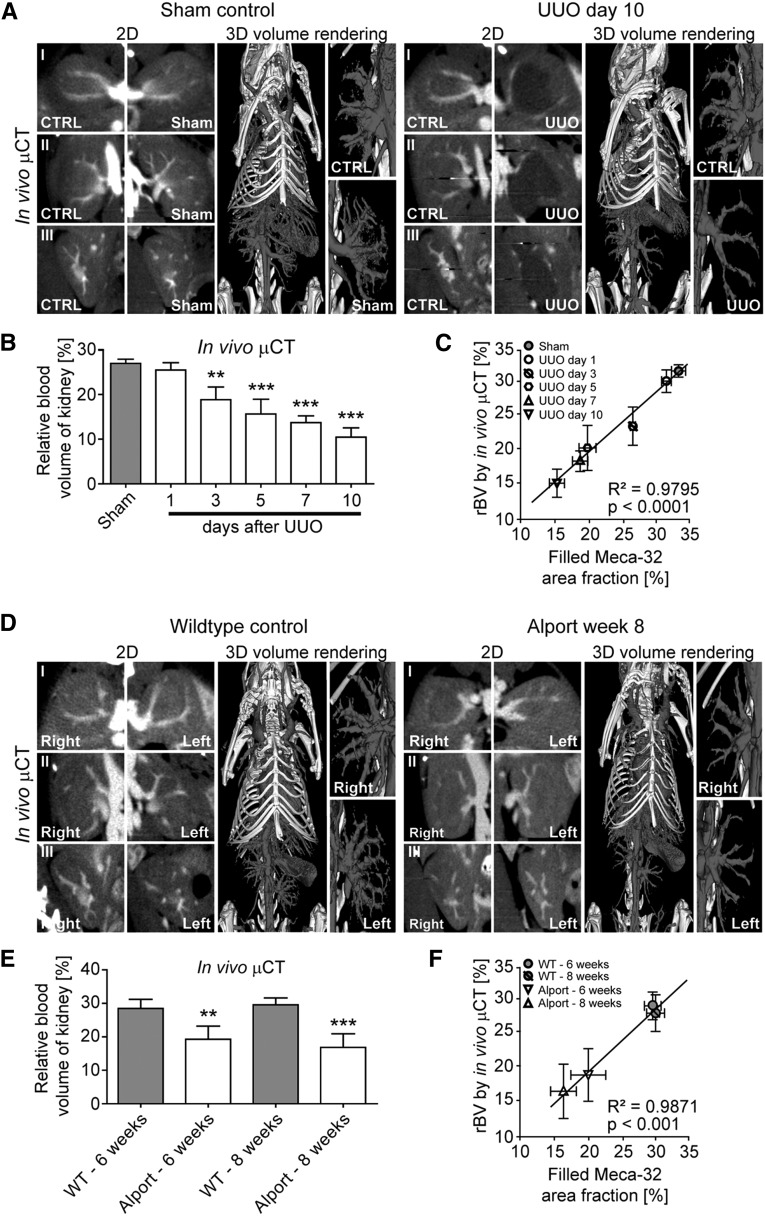
To monitor renal blood vessels during the progression of renal disease, we employed a contrast-enhanced µCT approach for in vivo imaging using an iodine-based contrast agent optimized for blood-pool imaging.18 This approach enabled the noninvasive visualization of renal vessels with a spatial resolution of 35 µm voxel side length, as exemplified by cross-sectional images and 3D renderings (Figure 4A). Longitudinal in vivo µCT scans of mice with I/R-induced kidney injury confirmed the significant loss of functional blood vessels already at early time points after I/R injury and an even more pronounced rarefaction in late-stage fibrosis (Figure 4B, Supplemental Videos 1 and 2). Accordingly, renal rBV values decreased already early (−20% on I/R day 1) and progressively (up to −43% on I/R day 56, compared with baseline renal rBV values quantified in sham controls), demonstrating that fibrosis progression was paralleled by a gradual loss of vessel functionality (P<0.001; Figure 4C). Similar to the histologic findings, the reduction in functional vessels assessed by in vivo µCT was observed before the onset of interstitial fibrosis (Figure 2B).7,22–24
Figure 4.
Longitudinal in vivo µCT imaging reveals a continuous reduction in functional renal blood vessels during progression of I/R-induced kidney injury. (A) Visualization of renal blood vessels by contrast-enhanced in vivo µCT (2D cross-sectional images in transversal (I), coronal (II) and sagittal (III) planes, as well as 3D volume renderings). (B) Longitudinal monitoring of the continuous reduction in number and functionality of renal blood vessels by in vivo µCT. (C) Noninvasive quantification of the renal rBV over time by in vivo µCT revealed a continuous reduction of vessel functionality in I/R-induced progressive fibrosis compared with kidneys of sham control mice. (D) A highly significant correlation was observed between the renal rBV determined by functional in vivo µCT and computationally filled vascular structures using ex vivo Meca-32 immunohistochemistry. **P<0.01; ***P<0.001.
We confirmed the continuous reduction of vessel functionality in Alport and UUO mice. For both models, in vivo µCT showed significantly reduced rBV values in diseased versus control kidneys (Figure 5, A and B for UUO; Figure 5, D and E for Alport mice, respectively). Strikingly, in the UUO model, capillary rarefaction and the gradual loss of vessel functionality were also observed very early, before the onset of overt fibrosis, i.e., on day 3 (Figures 3A and 5B).
Figure 5.
Functional vessels assessed by in vivo µCT are reduced in UUO and in Alport mice. (A) Visualization of the altered renal vasculature in UUO day 10 and sham control kidneys by in vivo µCT. (B) Noninvasive quantification of the renal rBV over time by in vivo µCT confirmed the continuous reduction in number and functionality of renal blood vessels in the UUO model. (C) A highly significant correlation was observed between the renal rBV and the filled Meca-32 area fraction in the UUO model. (D) Visualization of the altered renal vasculature in 8-week-old Col4a3-deficient (Alport) mice and age-matched wild type (WT) littermates by in vivo µCT. (E) Noninvasive quantification of the renal rBV in 6- and 8-week-old Alport mice and age-matched controls. (F) Also for the Alport model, a highly significant correlation was observed between the renal rBV and the filled Meca-32 area fraction. **P<0.01; ***P<0.001.
To assess the accuracy of in vivo µCT for quantifying vascular dysfunction in kidney fibrosis, rBV values were correlated with histologically reconstructed equivalents (Supplemental Figure 1).18 As exemplified by the I/R model, a significant correlation between rBV values determined by in vivo µCT and immunohistochemistry was observed (R2=0.98, P<0.001, Figure 4D). This high congruency was also found in the UUO model and in Alport mice (Figure 5, C and F, respectively). Within all the experiments, quantified renal rBV values were extremely consistent and showed very low variability in both healthy and diseased animals, further corroborating the high accuracy and robustness of our methodology.
Renal rBV in contralateral (right) kidneys of mice with I/R or UUO supported the progressive course of kidney damage in the injured (left) kidneys. Renal rBV was significantly increased in the contralateral kidneys from day 14 in I/R and day 7 in UUO mice onwards (+17% at I/R day 56 and +21% at UUO day 10; Supplemental Figure 2, A and B), suggesting a compensatory hypertrophy of these kidneys. The total kidney volume of contralateral kidneys correspondingly increased during disease progression (Supplemental Figure 3, A and B). The injured left kidneys in I/R mice also showed an initial increase in organ volume, most likely due to post-ischemic swelling (I/R day 1–3), followed by continuous organ shrinkage from day 5 onwards. In UUO, as expected due to the progression of hydronephrosis, kidney volumes continuously increased (Supplemental Figure 3B).
Anatomical Ex Vivo µCT Imaging Reveals Macro-to-Microvascular Alterations in Chronic Kidney Disease Models
Upon in vivo imaging, mice were perfused with the vascular casting agent Microfil,18 and subsequently performed high-resolution µCT scans of excised kidneys resulted in a spatial resolution of approximately 3 µm voxel side length. Previous studies have reported on Microfil perfusion of the renal vasculature in mice and rats.25–28 Here, we used this high-resolution ex vivo µCT method to analyze vessel morphometrics that can be derived from perfused renal vasculature, such as branching, size and tortuosity, in progressive kidney fibrosis.
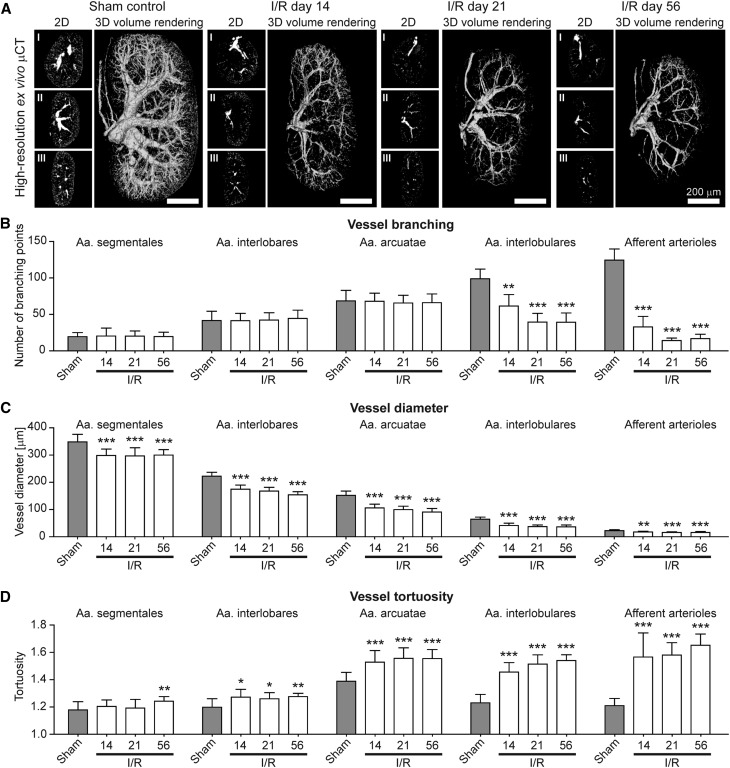
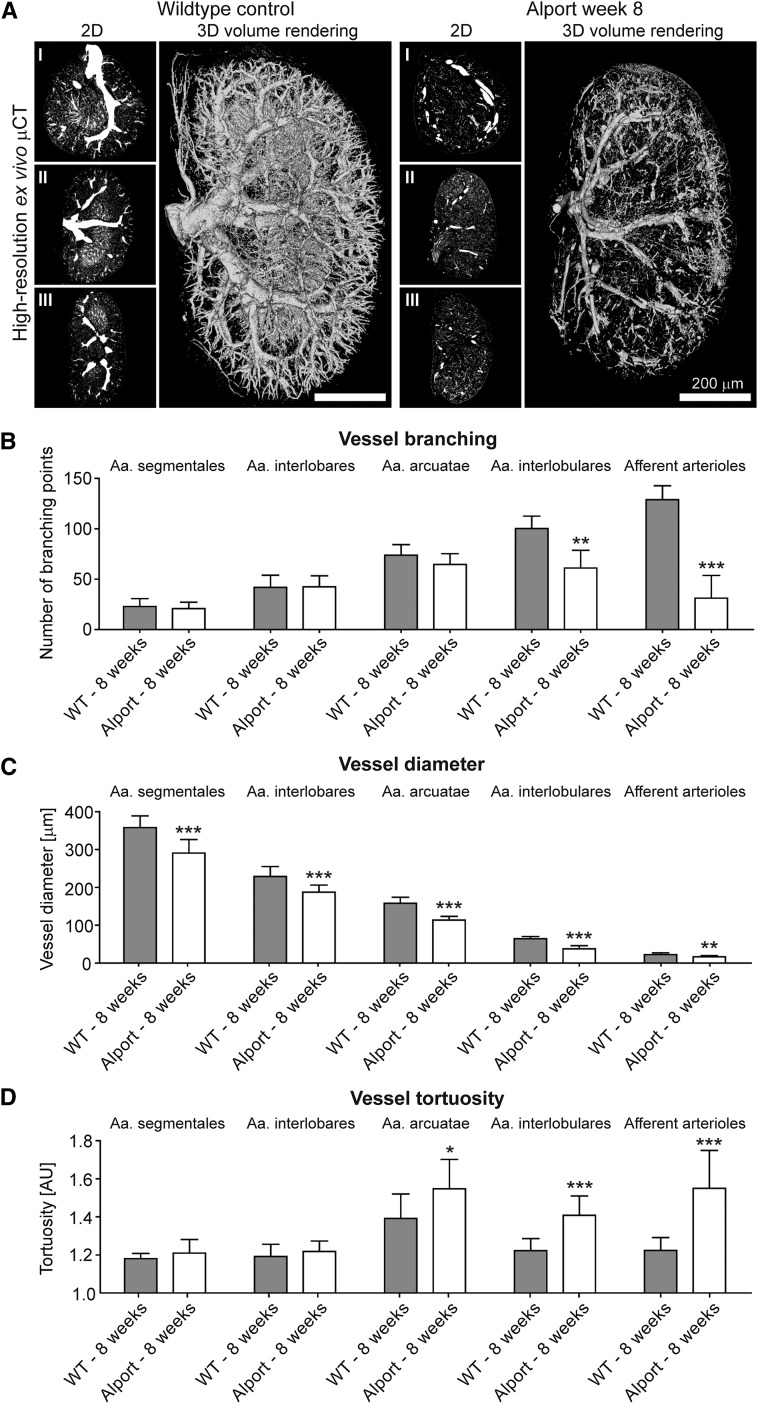
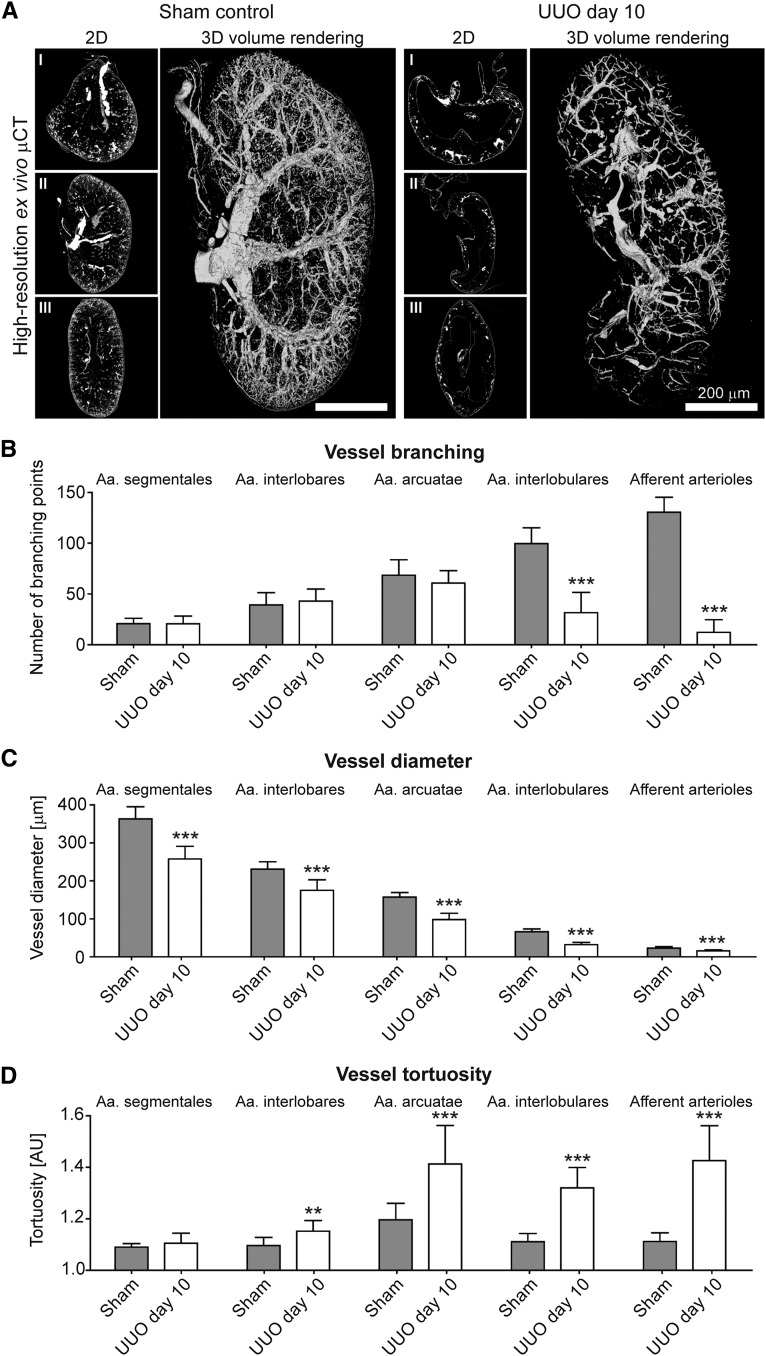
After threshold-based vessel tree segmentation, compared with healthy controls, a significant loss of small-caliber arterial vessels was observed in fibrotic kidneys (Figures 6A, 7A and 8A; Supplemental Videos 3 and 4). When analyzing vascular branching in detail, the reduction of the renal rBV in progressive kidney fibrosis (Figure 4C) was morphologically linked to a strong reduction of peripheral branching points: i.e., in I/R day 14 kidneys, the number of 4th (Aa. interlobulares) and 5th order (afferent arterioles) branching points significantly decreased by −38% and −74%, respectively (P<0.001; Figure 6B). The number of peripheral branching points progressively decreased until day 21 with up to −60% and −89% reduction of 4th and 5th order branching points, respectively (P<0.001, Figure 6B). High-resolution µCT imaging revealed similar findings for Alport kidneys (Figure 7, A and B) and an even more pronounced reduction in UUO with up to −68% and −91% reductions for 4th and 5th order branching points, respectively (P<0.001; Figure 8, A and B). Importantly, branching points of large-caliber arterial vessels (Aa. segmentales, interlobares and arcuatae) were not altered. These findings indicate that independently of the underlying disease, kidney injury is not only associated with the well-described rarefaction of peritubular capillaries1,14,29,30 but also with a pronounced rarefaction of functional small-caliber arteries (from Aa. interlobulares downward).
Figure 6.
Ex vivo µCT imaging and 3D quantification of the renal vasculature reveals significant alterations of renal arteries in progressive I/R induced renal injury. (A) Representative high-resolution ex vivo µCT images of sham controls and I/R day 14, 21 and 56 kidneys after Microfil perfusion (2D cross-sectional images in transversal (I), coronal (II) and sagittal (III) planes, as well as 3D volume renderings). Note the progressive rarefaction of functional vessels besides the continuous shrinkage of fibrotic kidneys over time. Scale bar, 200 µm. (B) µCT-based quantification of vascular branching points per increasing vessel order (from hilus to periphery). (C, D) µCT-based quantification of the mean vessel diameter (C) and mean vessel tortuosity (D) in sham control and I/R day 14, 21 and 56 kidneys. A continuous reduction in vessel branching and vessel size was linked to an increased vessel tortuosity during fibrosis progression. *P<0.05; **P<0.01; ***P<0.001.
Figure 7.
Alterations of renal arteries in progressive kidney damage using ex vivo µCT are confirmed in Alport mice. (A) Representative high-resolution ex vivo µCT images of kidneys from 8-week-old Alport and age-matched wild type (WT) mice upon Microfil perfusion. Note the loss of functional vessels and the shrinkage of the Alport kidney compared with the WT kidney. Scale bar, 200 µm. µCT-based quantification of vascular branching points (B), of vessel size (C) and of vessel tortuosity (D) confirmed the link between reduced branching points, reduced vessel diameters and increased vessel tortuosity during fibrosis progression. *P<0.05; **P<0.01; ***P<0.001.
Figure 8.
Alterations of renal arteries in progressive kidney damage using ex vivo µCT are confirmed in UUO induced renal injury. (A) Representative high-resolution ex vivo µCT images of Microfil perfused UUO day 10 and sham control kidneys. Scale bar, 200 µm. µCT-based quantification of vascular branching points (B), of vessel diameters (C) and of vessel tortuosity (D). **P<0.01; ***P<0.001.
Surprisingly, when quantifying the size of renal vessels, a yet unrecognized reduction of luminal diameter of all large-to-small-sized arterial vessels during disease progression was observed. As exemplified by I/R day 14, a massive reduction in diameters of Aa. segmentales (−14%), interlobares (−21%), arcuatae (−30%), interlobulares (−36%), and afferent arterioles (−22%) was found compared with sham-treated controls (P<0.001; Figure 6C). Strikingly, vessel diameters were not further reduced beyond day 14, even though fibrosis and vessel rarefaction progressed. A similar reduction of arterial vessel diameters was confirmed in Alport and UUO kidneys (Figures 7C and 8C).
To extend these analyses, we also quantified vessel tortuosity, i.e., the ratio of the vessel length between two nearby branching points and the linear distance between these two (see Figure 1). In line with observed reductions in vessel size and branching points, a clear increase in vessel tortuosity was observed in all three models during fibrosis progression. In I/R day 14, an increase in vessel tortuosity was observed in Aa. interlobares (+4%), arcuatae (+6%), interlobulares (+11%), and afferent arterioles (+16%; P<0.001; Figure 6D). Beyond I/R day 14, tortuosity further increased in Aa. interlobulares and afferent arterioles (+14% and +21%, respectively; P<0.0001). µCT-based determinations of vessel tortuosity in Alport kidneys revealed similar findings (Figure 7D) and again an even stronger effect in UUO kidneys with increased tortuosity by +18% for Aa. arcuatae, +18% for Aa. interlobulares and +28% for afferent arterioles (P<0.001; Figure 8D). Collectively, these findings exemplify that high-resolution µCT is highly suitable for a comprehensive assessment of vascular alterations and revealed significant changes in vessel branching, diameter, and tortuosity during the progression of kidney diseases.
DISCUSSION
Endothelial injury resulting in capillary rarefaction has been identified as a hallmark of CKD development.1–7 Several recent studies suggested that restoring the renal microvasculature may provide novel therapeutic options for patients with CKD.8–12 Thus far, however, quantitative imaging tools allowing for the noninvasive monitoring of morphologic and functional alterations of the renal microvasculature during disease progression have been lacking, and studies investigating vessel rarefaction in CKD have been largely restricted to invasive microscopic end-point analyses.1–14 We here employed in vivo and ex vivo µCT-based imaging techniques, alongside conventional immunohistochemical methodologies, to demonstrate that (1) contrast-enhanced in vivo µCT imaging is highly suitable for accurate and noninvasive monitoring of vessel functionality during progressive kidney diseases, via quantifying the renal rBV; (2) the renal rBV continuously decreases during early-to-late-stage renal disease progression; (3) vessel functionality is reduced immediately after renal injury prior to the onset of interstitial fibrosis, supporting the assumption that endothelial injury might be a major initiating cause of fibrosis development; and (4) in addition to peritubular capillaries, arterial vessels of virtually all calibers undergo substantial alterations during progressive renal disease with regard to vessel branching, size, and tortuosity.
Prior studies using tissue samples from patients and various CKD animal models have shown that fibrosis progression is associated with a continuous rarefaction of glomerular and cortical peritubular capillaries.1,31–35 Previous publications also reported on different invasive in situ preparation techniques to assess vascular parameters such as renal blood flow, flow velocity, and vessel diameter in experimental kidney injury models in rats.36–46 However, highly detailed longitudinal analyses on vessel functionality in experimental mouse models of chronic kidney diseases have not been performed to date. To bridge this gap, we refined a recently described contrast-enhanced µCT-based imaging protocol enabling the noninvasive visualization and quantification of microvascular changes in tumors and in liver fibrosis18,19 for monitoring vessel functionality in experimental models of chronic kidney injury in mice. Using this technique, we confirm previous findings of peritubular capillary loss at the functional level in a quantitative, noninvasive, and longitudinal manner using renal rBV analyses.
Our approach also demonstrates that vessel functionality was reduced immediately after renal injury, in particular in the I/R injury model, i.e., prior to the onset of fibrosis. Our findings support the hypothesis that capillary rarefaction may be a potential initiating trigger of progressive kidney fibrosis.1,2,14,30 However, reduced rBV values in the post-ischemic phase upon I/R injury, and perhaps also in the other models, could have also been due to vascular congestion and/or vasoconstriction resulting in reduced kidney perfusion. Although the current gold standard for determining capillary rarefaction, i.e., histologic analysis, showed a reduction in filled Meca-32 positive blood vessels, this effect might also have been due to potential alterations in endothelial Meca-32 expression in response to cellular stress in the post-ischemic phase rather than loss of capillaries.14,47–50 Importantly however, we observed a similar reduction in the number of capillaries in histologic analyses employing other endothelial markers, such as CD31 and VEGFR2 (J.B. and P.B., unpublished data).
We provide the first ex vivo images of the vascular network in healthy and diseased murine kidneys at a spatial resolution of less than 4 µm voxel side length, which extends previously published data on Microfil perfusion of the renal vasculature.25–28 In addition, the implementation of quantitative analyses of 3D vascular networks revealed a previously unrecognized reduction of vessel branches during disease progression paralleled by increased tortuosity of the remaining vessels. Extending previous studies,51–53 we found that not only post-glomerular vessels, i.e., capillaries, but all large-to-small-sized blood vessels in the kidney exhibited substantially reduced luminal diameters during disease progression. This reduced diameter of renal vessels, in particular of small-caliber vessels, may be the consequence of the pathologic deposition of ECM proteins during disease progression, leading to increased intrarenal and/or interstitial pressure. Alternatively or additionally, it may also result from vasoconstriction, which likely plays a more prominent role in larger arteries.53,54
Compared with other imaging modalities, computed tomography (CT) has several pros and cons. Pros include user-friendliness, operator independence, and the quantitative potential for both functional and anatomical characterization of vascular alterations in CKD. Cons include X-ray exposure, the need for iodine-based contrast agents and the low sensitivity of CT to contrast agents.20 While the rBV determination is noninvasive and can be used longitudinally, the resolution of this approach does not allow detailed in vivo analyses of morphologic vascular changes such as branching, tortuosity or diameter. This is possible only using high-resolution ex vivo µCT imaging, which requires high X-ray doses and sacrifice of the animals. Another limitation of the in vivo µCT method is that it cannot distinguish between a structural loss of vessels versus a functional reduction of perfusion, e.g., due to vasoconstriction. Thus, this method provides a measure of functional renal vessels.
In summary, we here show that µCT imaging can be used to provide novel insights into the macro-to-microvascular alterations and dynamics in murine models of progressive renal diseases, including a previously unappreciated alteration of larger renal vessels. µCT imaging appears to be highly useful for the quantitative monitoring of anatomical and functional changes in the renal macro- and microvasculature, and might be particularly useful for studies on the role of blood vessels in CKD and for facilitating the bench-to-bedside translation of pro-angiogenic and anti-fibrotic therapies.
CONCISE METHODS
Kidney Injury Models
Chronic kidney injury was surgically induced in 6-week-old C57bl/6 wild-type mice by ischemia (30 min)/reperfusion injury (I/R) or unilateral ureteral obstruction (UUO) of the left kidney, as described previously.29,55 Sham-operated animals were used as controls. As a third model for progressive renal injury, 6–8-week-old Col4a3−/− mice bred on a 129/SvJ background, a model of Alport syndrome, were investigated alongside age-matched wild-type littermates. All mice were housed in a specific pathogen-free environment under ethical conditions approved by German legal requirements.
In Vivo Micro-Computed Tomography
Contrast-enhanced in vivo µCT imaging was performed using a dual-energy flat-panel micro-computed tomography scanner (TomoScope 30s Duo; CT Imaging, Erlangen, Germany). Mice were imaged before and immediately after intravenous injection of 100 µl eXIATM160XL (Binitio Biomedical, Ottawa, Canada), a high molecular weight iodine-based contrast agent optimized for in vivo µCT-based blood pool imaging. The contrast agent was injected as a bolus into the lateral tail vein. During the entire in vivo imaging process, mice were anesthetized with 1.5% isoflurane in oxygen-enriched air. Dual-energy scans were performed at 41 and 65 kV (0.5 mA and 1 mA) resulting in 2880 projections of size 1032×1024 acquired over a 6-minute time frame. A Feldkamp-type algorithm (CT Imaging), including ring artifact correction, was applied to reconstruct volumetric data with a voxel size of 35×35×35 µm3. The reconstructed data were processed using Imalytics Preclinical software (Gremse-IT, Aachen, Germany) enabling the 3D visualization of blood vessels and interactive segmentation of volumes of interest (VOIs). Quantifications of the renal relative blood volume (rBV) were performed after defining five spherical (500 µm diameter) VOIs per kidney cortex. For each kidney, the rBV was calculated as the ratio of the contrast agent-induced enhancement (in Hounsfield units) of the renal cortex and the enhancement of pure blood which was measured in a large reference blood vessel (aorta) (Figure 1).18 To quantify the total organ volume of kidneys, 3D µCT-based organ segmentations were performed.
Ex Vivo Micro-Computed Tomography
After in vivo µCT imaging, mice were perfused with Microfil (Flow Tech, Carver, MA), a lead-containing silicone rubber radiopaque contrast agent, by using constant flows adjusted via a perfusion pump (150 ml/h; catheter diameter: 1.0 cm; catheter length: 75 cm), as described previously in more detail.18 Microfil, which solidifies approximately 20 min after application within the vascular compartment, enables the high-resolution 3D investigation of the microarchitecture of renal blood vessels. To this end, the excised kidneys were formalin-fixed and scanned using a high-resolution SkyScan 1172 µCT (SkyScan, Kontich, Belgium). In detail, kidneys were positioned on a rotation platform and scanned 180° around the vertical axis in rotation steps of 0.3° at 59 kV and an electric current of 167 µA. This resulted in 640 acquired projections (4000×2096 pixels) acquired over a period of 4–6 hours per kidney. Reconstructions were performed using filtered back-projection (Feldkamp-type) resulting in an isotropic pixel size of 3 µm. After 3D volume rendering of reconstructed high-resolution µCT data sets and threshold-based visualization of blood vessels, vascular branching as well as vessel size and tortuosity were semi-automatically analyzed as described in Figure 1. In detail, vessel size and tortuosity were systematically determined by randomly choosing ten vessels per hierarchical order in the renal vessel tree (Aa. segmentales, interlobares, arcuatae, interlobulares and afferent arterioles). For each blood vessel, the diameter was determined in one of three possible (transversal, coronal or sagittal) planes in which the cross-sectional area was relatively round and tortuosity was calculated as the ratio of the shortest vessel path length between two nearby branching points and the linear distance between these branching points. Normal anatomy of healthy kidneys confirmed our approach of tortuosity determination: compared with straight-running arteries, the more windy arcuate arteries showed the highest values for tortuosity (Figures 6D, 7D and 8D). Vascular branching patterns were analyzed by quantifying the number of branching points in total and per rising branching order per primary blood vessel along its course, from the hilus (Aa. segmentales) to the periphery (afferent arterioles) (see Figure 1).
Histology and Immunohistochemistry
Tissue sections were fixed using Methyl-Carnoy’s solution and paraffin-embedded to assess renal morphology using periodic acid-Schiff staining and to perform immunohistochemical stainings against collagen I, fibronectin, αSMA and Meca-32 using routine protocols.55 In brief, sections were stained using primary antibody against murine collagen I (Southern Biotechnology Associates, Birmingham, AL), fibronectin (Chemikon International, Temecula, CA), αSMA (Dako, Glostrup, Denmark), and Meca-32 (Developmental Studies Hybridoma Bank at the University of Iowa, Iowa City, IA). Biotinylated secondary antibodies were purchased from Vector Laboratories (Burlingame, CA). Stained tissue slides were scanned using NanoZoomer digital slide scanner (Hamamatsu Photonics, Hamamatsu, Japan). For quantifying the degree of renal fibrosis, 16 photomicrographs (Original magnification,×400) were randomly taken per kidney cortex of each mouse (n=28 I/R, n=20 UUO, n=8 sham, n=10 Alport, and n=10 untreated wild-type mice). Area fractions of collagen I, fibronectin, αSMA, and filled Meca-32 positive blood vessels (see below) were quantified using open-access image analysis software ImageJ version 1.43u (National Institutes of Health, Bethesda, MD). For reconstructing the equivalent of in vivo quantified rBV values on 2D histologic slices, the lumen of Meca-32 positive vascular structures was computationally filled using three photomicrographs per kidney cortex, and the filled Meca-32 area fraction, which most closely reflects the vascular volume, was determined using a previously described custom macro implemented for ImageJ.18
Statistical Analysis
All data are presented as mean±SD. For assessing statistical significance, the two-tailed unpaired Student’s t test and Pearson’s correlation were used. P values <0.05 were considered as statistically significant. All statistical analyses were performed using Graph PadPrism 5.0 (San Diego, CA).
DISCLOSURES
Felix Gremse is founder and owner of Gremse-IT, a start-up company that offers software and services for medical image analysis. The other authors have no competing financial interests to declare.
Supplementary Material
Acknowledgments
This work was supported by the START-Program (124/14 and 152/12) and the Interdisciplinary Center for Clinical Research (K7-3) of the Faculty of Medicine at RWTH Aachen University Clinic, by the European Research Council (ERC: Starting Grant 309495-NeoNaNo), by the German Research Foundation (DFG: SFB/Transregio 57 “Mechanisms of organ fibrosis”, BO 3755/1-1 and BO 3755/2-1) and by the Else-Kröner Fresenius Stiftung (EKFS 2012_A216).
Footnotes
Published online ahead of print. Publication date available at www.jasn.org.
This article contains supplemental material online at http://jasn.asnjournals.org/lookup/suppl/doi:10.1681/ASN.2015020204/-/DCSupplemental.
References
- 1.Bohle A, Kressel G, Müller CA, Müller GA: The pathogenesis of chronic renal failure. Pathol Res Pract 185: 421–440, 1989 [DOI] [PubMed] [Google Scholar]
- 2.Basile DP, Donohoe D, Roethe K, Osborn JL: Renal ischemic injury results in permanent damage to peritubular capillaries and influences long-term function. Am J Physiol Renal Physiol 281: F887–F899, 2001 [DOI] [PubMed] [Google Scholar]
- 3.Matsumoto M, Tanaka T, Yamamoto T, Noiri E, Miyata T, Inagi R, Fujita T, Nangaku M: Hypoperfusion of peritubular capillaries induces chronic hypoxia before progression of tubulointerstitial injury in a progressive model of rat glomerulonephritis. J Am Soc Nephrol 15: 1574–1581, 2004 [DOI] [PubMed] [Google Scholar]
- 4.Eardley KS, Kubal C, Zehnder D, Quinkler M, Lepenies J, Savage CO, Howie AJ, Kaur K, Cooper MS, Adu D, Cockwell P: The role of capillary density, macrophage infiltration and interstitial scarring in the pathogenesis of human chronic kidney disease. Kidney Int 74: 495–504, 2008 [DOI] [PubMed] [Google Scholar]
- 5.Boor P, Ostendorf T, Floege J: Renal fibrosis: novel insights into mechanisms and therapeutic targets. Nat Rev Nephrol 6: 643–656, 2010 [DOI] [PubMed] [Google Scholar]
- 6.Tanaka T, Nangaku M: Angiogenesis and hypoxia in the kidney. Nat Rev Nephrol 9: 211–222, 2013 [DOI] [PubMed] [Google Scholar]
- 7.Dimke H, Sparks MA, Thomson BR, Frische S, Coffman TM, Quaggin SE: Tubulovascular cross-talk by vascular endothelial growth factor a maintains peritubular microvasculature in kidney. J Am Soc Nephrol 26: 1027–1038, 2015 [DOI] [PMC free article] [PubMed] [Google Scholar]
- 8.Lin SL, Chang FC, Schrimpf C, Chen YT, Wu CF, Wu VC, Chiang WC, Kuhnert F, Kuo CJ, Chen YM, Wu KD, Tsai TJ, Duffield JS: Targeting endothelium-pericyte cross talk by inhibiting VEGF receptor signaling attenuates kidney microvascular rarefaction and fibrosis. Am J Pathol 178: 911–923, 2011 [DOI] [PMC free article] [PubMed] [Google Scholar]
- 9.Schrimpf C, Xin C, Campanholle G, Gill SE, Stallcup W, Lin SL, Davis GE, Gharib SA, Humphreys BD, Duffield JS: Pericyte TIMP3 and ADAMTS1 modulate vascular stability after kidney injury. J Am Soc Nephrol 23: 868–883, 2012 [DOI] [PMC free article] [PubMed] [Google Scholar]
- 10.Long DA, Norman JT, Fine LG: Restoring the renal microvasculature to treat chronic kidney disease. Nat Rev Nephrol 8: 244–250, 2012 [DOI] [PubMed] [Google Scholar]
- 11.Bijkerk R, van Solingen C, de Boer HC, van der Pol P, Khairoun M, de Bruin RG, van Oeveren-Rietdijk AM, Lievers E, Schlagwein N, van Gijlswijk DJ, Roeten MK, Neshati Z, de Vries AA, Rodijk M, Pike-Overzet K, van den Berg YW, van der Veer EP, Versteeg HH, Reinders ME, Staal FJ, van Kooten C, Rabelink TJ, van Zonneveld AJ: Hematopoietic microRNA-126 protects against renal ischemia/reperfusion injury by promoting vascular integrity. J Am Soc Nephrol 25: 1710–1722, 2014 [DOI] [PMC free article] [PubMed] [Google Scholar]
- 12.Xavier S, Vasko R, Matsumoto K, Zullo JA, Chen R, Maizel J, Chander PN, Goligorsky MS: Curtailing endothelial TGF-β signaling is sufficient to reduce endothelial-mesenchymal transition and fibrosis in CKD. J Am Soc Nephrol 26: 817–829, 2015 [DOI] [PMC free article] [PubMed] [Google Scholar]
- 13.Advani A, Connelly KA, Yuen DA, Zhang Y, Advani SL, Trogadis J, Kabir MG, Shachar E, Kuliszewski MA, Leong-Poi H, Stewart DJ, Gilbert RE: Fluorescent microangiography is a novel and widely applicable technique for delineating the renal microvasculature. PLoS ONE 6: e24695, 2011 [DOI] [PMC free article] [PubMed] [Google Scholar]
- 14.Kramann R, Tanaka M, Humphreys BD: Fluorescence microangiography for quantitative assessment of peritubular capillary changes after AKI in mice. J Am Soc Nephrol 25: 1924–1931, 2014 [DOI] [PMC free article] [PubMed] [Google Scholar]
- 15.Sadick M, Schock D, Kraenzlin B, Gretz N, Schoenberg SO, Michaely HJ: Morphologic and dynamic renal imaging with assessment of glomerular filtration rate in a pcy-mouse model using a clinical 3.0 Tesla scanner. Invest Radiol 44: 469–475, 2009 [DOI] [PubMed] [Google Scholar]
- 16.Inoue T, Kozawa E, Okada H, Inukai K, Watanabe S, Kikuta T, Watanabe Y, Takenaka T, Katayama S, Tanaka J, Suzuki H: Noninvasive evaluation of kidney hypoxia and fibrosis using magnetic resonance imaging. J Am Soc Nephrol 22: 1429–1434, 2011 [DOI] [PMC free article] [PubMed] [Google Scholar]
- 17.Kiessling F, Greschus S, Lichy MP, Bock M, Fink C, Vosseler S, Moll J, Mueller MM, Fusenig NE, Traupe H, Semmler W: Volumetric computed tomography (VCT): a new technology for noninvasive, high-resolution monitoring of tumor angiogenesis. Nat Med 10: 1133–1138, 2004 [DOI] [PubMed] [Google Scholar]
- 18.Ehling J, Theek B, Gremse F, Baetke S, Möckel D, Maynard J, Ricketts SA, Grüll H, Neeman M, Knuechel R, Lederle W, Kiessling F, Lammers T: Micro-CT imaging of tumor angiogenesis: quantitative measures describing micromorphology and vascularization. Am J Pathol 184: 431–441, 2014 [DOI] [PMC free article] [PubMed] [Google Scholar]
- 19.Ehling J, Bartneck M, Wei X, Gremse F, Fech V, Möckel D, Baeck C, Hittatiya K, Eulberg D, Luedde T, Kiessling F, Trautwein C, Lammers T, Tacke F: CCL2-dependent infiltrating macrophages promote angiogenesis in progressive liver fibrosis. Gut 63: 1960–1971, 2014 [DOI] [PMC free article] [PubMed] [Google Scholar]
- 20.Ehling J, Lammers T, Kiessling F: Non-invasive imaging for studying anti-angiogenic therapy effects. Thromb Haemost 109: 375–390, 2013 [DOI] [PMC free article] [PubMed] [Google Scholar]
- 21.Venkatachalam MA, Griffin KA, Lan R, Geng H, Saikumar P, Bidani AK: Acute kidney injury: a springboard for progression in chronic kidney disease. Am J Physiol Renal Physiol 298: F1078–F1094, 2010 [DOI] [PMC free article] [PubMed] [Google Scholar]
- 22.Tanaka S, Tanaka T, Nangaku M: Hypoxia as a key player in the AKI-to-CKD transition. Am J Physiol Renal Physiol 307: F1187–F1195, 2014 [DOI] [PubMed] [Google Scholar]
- 23.Daehn I, Bottinger EP: Microvascular endothelial cells poised to take center stage in experimental renal fibrosis. J Am Soc Nephrol 26: 767–769, 2015 [DOI] [PMC free article] [PubMed] [Google Scholar]
- 24.Tufro A: Tubular vascular endothelial growth factor-a, erythropoietin, and medullary vessels: a trio linked by hypoxia. J Am Soc Nephrol 26: 997–998, 2015 [DOI] [PMC free article] [PubMed] [Google Scholar]
- 25.Garcia-Sanz A, Rodriguez-Barbero A, Bentley MD, Ritman EL, Romero JC: Three-dimensional microcomputed tomography of renal vasculature in rats. Hypertension 31: 440–444, 1998 [DOI] [PubMed] [Google Scholar]
- 26.Ortiz MC, García-Sanz A, Bentley MD, Fortepiani LA, García-Estañ J, Ritman EL, Romero JC, Juncos LA: Microcomputed tomography of kidneys following chronic bile duct ligation. Kidney Int 58: 1632–1640, 2000 [DOI] [PubMed] [Google Scholar]
- 27.Iliescu R, Chade AR: Progressive renal vascular proliferation and injury in obese Zucker rats. Microcirculation 17: 250–258, 2010 [DOI] [PMC free article] [PubMed] [Google Scholar]
- 28.Vasquez SX, Gao F, Su F, Grijalva V, Pope J, Martin B, Stinstra J, Masner M, Shah N, Weinstein DM, Farias-Eisner R, Reddy ST: Optimization of microCT imaging and blood vessel diameter quantitation of preclinical specimen vasculature with radiopaque polymer injection medium. PLoS ONE 6: e19099, 2011 [DOI] [PMC free article] [PubMed] [Google Scholar]
- 29.Chevalier RL, Forbes MS, Thornhill BA: Ureteral obstruction as a model of renal interstitial fibrosis and obstructive nephropathy. Kidney Int 75: 1145–1152, 2009 [DOI] [PubMed] [Google Scholar]
- 30.Basile DP, Friedrich JL, Spahic J, Knipe N, Mang H, Leonard EC, Changizi-Ashtiyani S, Bacallao RL, Molitoris BA, Sutton TA: Impaired endothelial proliferation and mesenchymal transition contribute to vascular rarefaction following acute kidney injury. Am J Physiol Renal Physiol 300: F721–F733, 2011 [DOI] [PMC free article] [PubMed] [Google Scholar]
- 31.Bohle A, von Gise H, Mackensen-Haen S, Stark-Jakob B: The obliteration of the postglomerular capillaries and its influence upon the function of both glomeruli and tubuli. Functional interpretation of morphologic findings. Klin Wochenschr 59: 1043–1051, 1981 [DOI] [PubMed] [Google Scholar]
- 32.Bohle A, Mackensen-Haen S, von Gise H: Significance of tubulointerstitial changes in the renal cortex for the excretory function and concentration ability of the kidney: a morphometric contribution. Am J Nephrol 7: 421–433, 1987 [DOI] [PubMed] [Google Scholar]
- 33.Mackensen-Haen S, Bohle A, Christensen J, Wehrmann M, Kendziorra H, Kokot F: The consequences for renal function of widening of the interstitium and changes in the tubular epithelium of the renal cortex and outer medulla in various renal diseases. Clin Nephrol 37: 70–77, 1992 [PubMed] [Google Scholar]
- 34.Bohle A, Wehrmann M, Mackensen-Haen S, Gise H, Mickeler E, Xiao TC, Müller C, Müller GA: Pathogenesis of chronic renal failure in primary glomerulopathies. Nephrol Dial Transplant 9[Suppl 3]: 4–12, 1994 [PubMed] [Google Scholar]
- 35.Bohle A, Mackensen-Haen S, Wehrmann M: Significance of postglomerular capillaries in the pathogenesis of chronic renal failure. Kidney Blood Press Res 19: 191–195, 1996 [DOI] [PubMed] [Google Scholar]
- 36.Steinhausen M, Eisenbach GM, Galaske R: Countercurrent system in the renal cortex of rats. Science 167: 1631–1633, 1970 [DOI] [PubMed] [Google Scholar]
- 37.Steinhausen M: Further information on the cortical countercurrent system in rat kidney. Yale J Biol Med 45: 451–456, 1972 [PMC free article] [PubMed] [Google Scholar]
- 38.Steinhausen M, Eisenbach GM, Böttcher W: High-frequency microcinematographic measurements on peritubular blood flow under control conditions and after temporary ischemia of rat kidneys. Pflugers Arch 339: 273–288, 1973 [DOI] [PubMed] [Google Scholar]
- 39.Steinhausen M, Zimmerhackl B, Thederan H, Dussel R, Parekh N, Esslinger HU, von Hagens G, Komitowski D, Dallenbach FD: Intraglomerular microcirculation: measurements of single glomerular loop flow in rats. Kidney Int 20: 230–239, 1981 [DOI] [PubMed] [Google Scholar]
- 40.Zimmerhackl B, Parekh N, Brinkhus H, Steinhausen M: The use of fluorescent labeled erythrocytes for intravital investigation of flow and local hematocrit in glomerular capillaries in the rat. Int J Microcirc Clin Exp 2: 119–129, 1983 [PubMed] [Google Scholar]
- 41.Steinhausen M, Snoei H, Parekh N, Baker R, Johnson PC: Hydronephrosis: a new method to visualize vas afferens, efferens, and glomerular network. Kidney Int 23: 794–806, 1983 [DOI] [PubMed] [Google Scholar]
- 42.Zimmerhackl B, Robertson CR, Jamison RL: The microcirculation of the renal medulla. Circ Res 57: 657–667, 1985 [DOI] [PubMed] [Google Scholar]
- 43.Zimmerhackl B, Dussel R, Steinhausen M: Erythrocyte flow and dynamic hematocrit in the renal papilla of the rat. Am J Physiol 249: F898–F902, 1985 [DOI] [PubMed] [Google Scholar]
- 44.Brodsky SV, Yamamoto T, Tada T, Kim B, Chen J, Kajiya F, Goligorsky MS: Endothelial dysfunction in ischemic acute renal failure: rescue by transplanted endothelial cells. Am J Physiol Renal Physiol 282: F1140–F1149, 2002 [DOI] [PubMed] [Google Scholar]
- 45.Yamamoto T, Tada T, Brodsky SV, Tanaka H, Noiri E, Kajiya F, Goligorsky MS: Intravital videomicroscopy of peritubular capillaries in renal ischemia. Am J Physiol Renal Physiol 282: F1150–F1155, 2002 [DOI] [PubMed] [Google Scholar]
- 46.Hattori R, Ono Y, Kato M, Komatsu T, Matsukawa Y, Yamamoto T: Direct visualization of cortical peritubular capillary of transplanted human kidney with reperfusion injury using a magnifying endoscopy. Transplantation 79: 1190–1194, 2005 [DOI] [PubMed] [Google Scholar]
- 47.Yuan HT, Li XZ, Pitera JE, Long DA, Woolf AS: Peritubular capillary loss after mouse acute nephrotoxicity correlates with down-regulation of vascular endothelial growth factor-A and hypoxia-inducible factor-1 alpha. Am J Pathol 163: 2289–2301, 2003 [DOI] [PMC free article] [PubMed] [Google Scholar]
- 48.Basile DP: Rarefaction of peritubular capillaries following ischemic acute renal failure: a potential factor predisposing to progressive nephropathy. Curr Opin Nephrol Hypertens 13: 1–7, 2004 [DOI] [PubMed] [Google Scholar]
- 49.Hörbelt M, Lee SY, Mang HE, Knipe NL, Sado Y, Kribben A, Sutton TA: Acute and chronic microvascular alterations in a mouse model of ischemic acute kidney injury. Am J Physiol Renal Physiol 293: F688–F695, 2007 [DOI] [PubMed] [Google Scholar]
- 50.Basile DP, Yoder MC: Renal endothelial dysfunction in acute kidney ischemia reperfusion injury. Cardiovasc Hematol Disord Drug Targets 14: 3–14, 2014 [DOI] [PMC free article] [PubMed] [Google Scholar]
- 51.Zimmerhackl B, Parekh N, Kücherer H, Steinhausen M: Influence of systemically applied angiotensin II on the microcirculation of glomerular capillaries in the rat. Kidney Int 27: 17–24, 1985 [DOI] [PubMed] [Google Scholar]
- 52.Cavarape A, Endlich K, Feletto F, Parekh N, Bartoli E, Steinhausen M: Contribution of endothelin receptors in renal microvessels in acute cyclosporine-mediated vasoconstriction in rats. Kidney Int 53: 963–969, 1998 [DOI] [PubMed] [Google Scholar]
- 53.Gannon KP, McKey SE, Stec DE, Drummond HA: Altered myogenic vasoconstriction and regulation of whole kidney blood flow in the ASIC2 knockout mouse. Am J Physiol Renal Physiol 308: F339–F348, 2015 [DOI] [PMC free article] [PubMed] [Google Scholar]
- 54.Schnermann J: Concurrent activation of multiple vasoactive signaling pathways in vasoconstriction caused by tubuloglomerular feedback: a quantitative assessment. Annu Rev Physiol 77: 301–322, 2015 [DOI] [PubMed] [Google Scholar]
- 55.Boor P, Konieczny A, Villa L, Schult AL, Bücher E, Rong S, Kunter U, van Roeyen CR, Polakowski T, Hawlisch H, Hillebrandt S, Lammert F, Eitner F, Floege J, Ostendorf T: Complement C5 mediates experimental tubulointerstitial fibrosis. J Am Soc Nephrol 18: 1508–1515, 2007 [DOI] [PubMed] [Google Scholar]
Associated Data
This section collects any data citations, data availability statements, or supplementary materials included in this article.


