

Abstract
Early binge-like alcohol drinking may promote the development of hazardous intake. However, the enduring cellular alterations following the first experience with alcohol consumption are not fully understood. We found that the first binge-drinking alcohol session produced enduring enhancement of excitatory synaptic transmission onto dopamine D1 receptor-expressing neurons (D1+ neurons) in the nucleus accumbens (NAc) shell but not the core in mice, which required D1 receptors (D1Rs) and mechanistic target of rapamycin complex 1 (mTORC1). Furthermore, inhibition of mTORC1 activity during the first alcohol drinking session reduced alcohol consumption and preference of a subsequent drinking session. mTORC1 is critically involved in RNA-to-protein translation, and we found that the first alcohol session rapidly activated mTORC1 in NAc shell D1+ neurons and increased synaptic expression of the AMPAR subunit GluA1 and the scaffolding protein Homer. Finally, D1R stimulation alone was sufficient to activate mTORC1 in the NAc to promote mTORC1-dependent translation of the synaptic proteins GluA1 and Homer. Together, our results indicate that the first alcohol drinking session induces synaptic plasticity in NAc D1+ neurons via enhanced mTORC1-dependent translation of proteins involved in excitatory synaptic transmission that in turn drives the reinforcement learning associated with the first alcohol experience. Thus, the alcohol-dependent D1R/mTORC1-mediated increase in synaptic function in the NAc may reflect a neural imprint of alcohol's reinforcing properties, which could promote subsequent alcohol intake.
SIGNIFICANCE STATEMENT Consuming alcohol for the first time is a learning event that drives further drinking. Here, we identified a mechanism that may underlie the reinforcing learning associated with the initial alcohol experience. We show that the first alcohol experience induces a persistent enhancement of excitatory synaptic transmission on NAc shell D1+ neurons, which is dependent on D1R and mTORC1. We also find that mTORC1 is necessary for the sustained alcohol consumption and preference across the initial drinking sessions. The first alcohol binge activates mTORC1 in NAc D1+ neurons and increases levels of synaptic proteins involved in glutamatergic signaling. Thus, the D1R/mTORC1-dependent plasticity following the first alcohol exposure may be a critical cellular component of reinforcement learning.
Keywords: addiction, alcohol, dopamine, mTOR, plasticity
Introduction
Alcohol consumption is nearly ubiquitous worldwide and is the most commonly used drug with abuse potential, along with tobacco. Approximately one-half of Americans >12 years old are current alcohol drinkers, and approximately one-quarter are current binge drinkers (5 or more drinks in a drinking session at least once in 30 d; Substance Abuse and Mental Health Services Administration, 2014). Of particular importance is the pattern of intake during the early phases of drinking, because alcohol consumption to the point of intoxication during the initial alcohol experience can increase the risk of future hazardous drinking (Warner et al., 2007; Morean et al., 2014).
The staggering number of alcohol consumers likely reflects that alcohol is legally obtainable and often can be intrinsically rewarding. Its positive reinforcing properties involve the mesolimbic dopamine (DA) pathway (Vengeliene et al., 2008), which encodes the salience and valence of stimuli (Cooper and Knutson, 2008). Like other drugs of abuse, alcohol increases DA neuron firing in the ventral tegmental area (VTA; Okamoto et al., 2006) and DA release in nucleus accumbens (NAc) (Di Chiara and Imperato, 1988). The NAc, and especially DA in the NAc, is critical for the expression of many motivated and goal-directed behaviors (Sesack and Grace, 2010). The NAc is predominately composed of two largely independent populations of GABAergic medium spiny neurons (MSNs), with different peptide and receptor expression and projection targets (Gerfen and Surmeier, 2011). Neurons expressing DA D1 receptors (D1+ MSNs) primarily follow the direct pathway to the ventral midbrain, whereas neurons expressing DA D2 receptors (D2+ MSNs) exclusively project to the ventral pallidum, also called the indirect pathway (Lu et al., 1998). DA modulates activity in both striatal pathways and strongly influences goal-directed behavior (Goto and Grace, 2005; Gerfen and Surmeier, 2011), but with opposing actions of D1 receptors (D1Rs) and D2 receptors (D2Rs) on adenylate cyclase activation of protein kinase A (PKA; Neve et al., 2004; Smith et al., 2013). In addition, D1Rs mediate alcohol binge drinking and self-administration (El-Ghundi et al., 1998; Price and Middaugh, 2004), and intra-NAc D1R antagonists reduce alcohol self-administration (Hodge et al., 1997), locomotor sensitization (Bahi and Dreyer, 2012), and conditioned place preference (CPP; Young et al., 2014). Thus, NAc D1Rs are critically involved in alcohol reinforcement, intake, and learning.
We are particularly interested in whether a single, voluntary, binge-like alcohol drinking session can recruit memory-related synaptic mechanisms, which could promote future drinking. A single exposure to alcohol or other abused drugs, such as cocaine, morphine, or nicotine, persistently enhances excitatory neurotransmission on VTA DA neurons (Saal et al., 2003). However, little is known about how the first experience of alcohol or other drugs alter synaptic transmission in a VTA target region, the NAc. Temporally locked DA and glutamatergic input triggers a D1R-dependent structural plasticity of spines on NAc neurons (Yagishita et al., 2014), demonstrating the necessity of DA and D1R activation in persistent NAc neuron plasticity. Therefore, we tested the hypothesis that the initial alcohol exposure, which is known to trigger DA release into the NAc (Di Chiara and Imperato, 1988), persistently alters excitatory synaptic transmission in NAc neurons. We found that alcohol induced synaptic plasticity in NAc D1+ but not D2+ neurons, an effect that required D1R activation and mTORC1-dependent protein translation.
Materials and Methods
Animals.
C57BL/6J male mice were purchased from The Jackson Laboratory. To create transgenic mice lines, we crossed Drd1-Cre or Drd2-Cre mice (C57BL/6J background; Mutant Mouse Regional Resource Center) with Ai14 mice [B6.Cg-Gt(ROSA)26Sortm14(CAG-tdTomato) C57BL/6J background; The Jackson Laboratory] to generate Drd1-Cre/Ai14 and Drd2-Cre/Ai14 lines respectively (Wang et al., 2015). Mouse genotypes were determined by PCR analysis of products derived from tail DNA. Adult (>P60) male mice were housed in a climate-controlled room in polypropylene cages with ad libitum food and water. For most experiments, mice were group housed in a regular 12 h light/dark cycle room (lights on 06:00–18:00). Subjects that underwent the two-bottle choice alcohol-drinking paradigm were single housed in a reverse light/dark cycle room (lights on 22:00–10:00).
Reagents.
Rabbit anti-phosphoAkt (Ser473, 1:1000), rabbit anti-Akt (1:1000), rabbit anti-phosphoGSK3β (Ser9, 1:4000), rabbit anti-phospho4E-BP (Thr37/46, 1:500), rabbit anti-4E-BP (1:500), rabbit anti-phosphoS6K (Thr389, 1:500), rabbit anti-S6K (1:500), rabbit anti-phosphoS6 (Ser235/236, 1:1000 for Western blot; 1:500 for IHC), rabbit anti-S6 (1:3000), rabbit anti-phosphoGluA1 (Ser845, 1:500), and rabbit anti-CREB (1:500) antibodies were obtained from Cell Signaling Technology. Mouse anti-NeuN (1:500), mouse anti-GSK3β (1:1000), and rabbit anti-GluA1 (1:500) antibodies and nitrocellulose membranes were purchased from EMD Millipore. Rabbit anti-phosphoErk1/2 (Thr202/Tyr204; 1:5000), mouse anti-Erk2 (1:2000), goat anti-Homer (1:250), mouse anti-PSD95 (1:3000), goat anti-actin (1:2000), and rabbit anti-GAPDH (1:2000) antibodies were purchased from Santa Cruz Biotechnology. Donkey anti-rabbit horseradish peroxidase (HRP), donkey anti-mouse HRP and donkey anti-goat HRP (1:2000) were purchased from The Jackson Laboratory. NuPAGE 4–12% Bis-Tris gradient gels, donkey anti-rabbit IgG AlexaFluor 488 (1:500), donkey anti-mouse AlexaFluor 647 (1:500), and the Paris Kit were obtained from Life Technologies. Bicinchoninic acid (BCA) protein assay kit was obtained from Thermo Scientific. EDTA-free protease inhibitor cocktail was purchased from Roche. Enhanced Chemiluminescence (ECL) Plus was purchased from GE Healthcare. Ribonucleoside Vanadyl Complex was obtained from New England Biolabs. Rnasin, proteinase K, and Avian Myeloblastosis Virus Reverse Transcriptase were purchased from Promega. SYBR Green PCR Master mix was obtained from Applied Biosystems. Vectashield was purchased from Vector Laboratories. SCH-23390 hydrochloride, SKF-81297 hydrobromide, picrotoxin, and tetrodotoxin were purchased from Tocris Bioscience (Bio-Techne). DL-2-amino-5-phosphonopentanoic acid (DL-APV) was purchased from Abcam Biochemicals. Rapamycin was obtained from LC Laboratories. N-(2,6-dimethylphenylcarbamoylmethyl) triethylammonium chloride (QX-314) was obtained from Alomone Labs. Spermine was purchased from Sigma-Aldrich. Ethyl Alcohol (190 proof) was purchased from VWR.
Preparation of solutions.
SKF-81297 (5 mg/kg), rapamycin (10 mg/kg), and SCH-23390 (0.1 mg/kg) were dissolved in 3% dimethyl sulfoxide (DMSO), and vehicle controls in these experiments were injected with 3% DMSO In 0.9% saline. Quinpirole (5 mg/kg) and injected alcohol (2 g/kg, 20% v/v) were diluted in 0.9% saline, and vehicle controls in these experiments were injected with saline. For alcohol drinking experiments, alcohol was diluted in water to 20% v/v.
Two-bottle choice drinking paradigm.
Alcohol drinking experiments were conducted as previously described (Hwa et al., 2011; Warnault et al., 2013; Carnicella et al., 2014), except that here subjects received only a single alcohol session. Mice had access to one bottle 20% (v/v) alcohol and one bottle of water (two-bottle choice), whereas control mice received two bottles of water for the same amount of time. The session began 30–60 min after the beginning of the dark cycle. For electrophysiology experiments, Drd1-Cre/Ai14 and Drd2-Cre/Ai14 mice underwent a 24 h two-bottle choice session. The water and alcohol bottles were weighed 2, 4 and 24 h into the session. Patch-clamp experiments were conducted 24 h after the end of the single 24 h two-bottle choice session. For the behavioral experiment, subjects underwent two consecutive 4 h two-bottle choice sessions, separated by 24 h. Alcohol preference was calculated by dividing the total volume of alcohol consumed by the total liquid intake volume (water + alcohol). For Western blot analyses and immunohistochemistry experiments, C57BL/6J mice underwent a 4 or 24 h two-bottle choice session, and were killed immediately at the end of the session.
Blood alcohol concentration measurement.
Blood alcohol concentration (BAC) was measured as previously described (Weiss et al., 1993; Zapata et al., 2006). Blood was collected in heparinized capillary tubes immediately at the end of the single 4 h two-bottle choice session after the subject was euthanized. Serum was extracted with 3.4% perchloric acid followed by a 5 min centrifugation at 420 × g (2000 rpm) and assayed for alcohol content using the nicotinamide adenine dinucleotide redox (NAD+/NADH) enzyme spectrophotometric method. BACs were calculated by using a standard calibration curve.
Acute brain slice preparation.
Drd1-Cre/Ai14 and Drd2-Cre/Ai14 mice were euthanized, brains were removed and placed in an ice-cold sucrose solution containing the following (in mm): 200 sucrose, 1.9 KCl, 1.4 NaH2PO4, 0.5 CaCl2, 6 MgCl2, 10 glucose, 0.4 ascorbic acid, and 25 NaHCO3; osmolarity 310–320 mOsm, bubbled with 95% O2/5% CO2 to maintain physiological pH. Sections containing the NAc were cut into 300 μm slices using a Leica VT1000 vibrating microtome. Slices were collected and transferred to a warmed (32°–34°C) chamber containing a carbogen-bubbled aCSF solution containing the following (in mm): 125 NaCl, 2.5 KCl, 1.4 NaH2PO4, 2 CaCl2, 1.3 MgCl2, 10 glucose, 0.4 ascorbic acid, and 25 NaHCO3; osmolarity 310–320 mOsm. Slices were warmed for 30 min and then kept at room temperature (RT) for at least 45 min before beginning recordings.
Electrophysiology.
Whole-cell patch-clamp electrophysiology were conducted similarly as previously described (Wang et al., 2012; Beckley et al., 2013). Slices were transferred to a recording chamber and perfused with aCSF at 3 ml/min at RT. NAc neurons were visually identified with differential interference contrast using a Zeiss microscope (Axio Examiner A1). Whole-cell patch-clamp recordings were performed on NAc neurons that were either positive or negative for tdTomato. Recording pipettes with a resistance of 1.5–3 MΩ were filled with internal solution containing the following: (in mm): 120 CsCl, 10 HEPES, 2 MgCl2, 1 EGTA, 2 Na2ATP, 0.3 NaGTP, 0.2% biocytin; osmolarity 290 mOsm, pH 7.3. Series resistance (Rs) was monitored throughout the recording and an experiment was discontinued if Rs exceeded 30 MΩ or changed >25%. Currents were evoked using a tungsten bipolar electrode (FHC). A 0.2 ms stimulus pulse was delivered at 0.05 Hz at a setting that elicited a reliable, submaximal response from the recorded neuron. Data were acquired using an Axon MultiClamp 700B amplifier with Digidata 1440 digitizer (Molecular Devices). Recordings were filtered at 4 kHZ, acquired at 10 kHz, and collected on-line with pCLAMP10 (Molecular Devices).
The recording aCSF included 100 μm picrotoxin to block GABA-A receptors and DL-APV 100 μm was added when necessary to block NMDARs. For AMPAR/NMDAR ratio measurements, neurons were held at +40 mV, and mixed excitatory currents were evoked at 0.05 Hz, then DL-APV was applied to isolate AMPAR currents. The averaged AMPAR current was subtracted from the averaged mixed excitatory current to reveal the NMDAR-mediated current, and the AMPAR/NMDAR ratio was computed using the peak AMPAR and NMDAR currents. AMPAR-mediated currents were confirmed by their sensitivity to the AMPAR antagonist NBQX (100 μm) For AMPAR rectification experiments, the internal solution included 100 μm spermine and 1 μm QX-314 to block GluA2-lacking AMPAR receptors at positive holding potentials and Nav channels, respectively. AMPAR currents were evoked with constant stimulus intensity at different holding potentials: +40, +20, 0, −30, and −70 mV. The AMPAR rectification index was computed by dividing the slope of AMPAR peak current amplitudes at negative holding potentials by the slope at positive holding potentials. AMPAR paired pulse facilitation was measured by evoking two AMPAR-mediated currents with a 50 ms interpulse interval, and the paired pulse ratio was calculated by dividing the second peak by the first peak. Miniature EPSC events were recorded in the presence of 1 μm tetrodotoxin, detected during a 200 s epoch, and analyzed using the template-matching event-detection algorithm in the Clampfit 10 analysis module of pCLAMP10. Detection parameters were set at amplitude >4 pA and acquired events were visually inspected before averaging.
Tissue collection.
Mice were killed by cervical dislocation, and the brains were removed and sectioned. The NAc was isolated from a 1-mm-thick coronal section located +1.70 mm to +0.70 mm anterior to bregma. A vertical cut was made from the lateral ventricle, which was the lateral boundary for our NAc isolation, making our section predominantly NAc shell but with a small fraction of the NAc core included. The NAc was dissected on an anodized aluminum block on ice. For real-time PCR analysis, the samples were snap-frozen. For Western blot analysis, the tissue was homogenized in ice-cold radio immunoprecipitation assay (RIPA) buffer (in mm: 50 Tris-Cl, 5 EDTA, 120 NaCl, 1% NP-40, 0.1% deoxycholate, 0.5% SDS, protease and phosphatase inhibitors). Samples were homogenized using a sonic dismembrator. Protein content was determined using BCA kit.
Western blot analysis.
Procedure is as previously described (Neasta et al., 2012). Tissue homogenates (30 μg per sample) were resolved for 2 h and transferred onto nitrocellulose membranes at 30 V for 2 h. Blots were blocked with 5% milk-PBS with 0.1% Tween 20 at RT and then probed with primary antibodies overnight at 4°C. Membranes were washed and probed with HRP-conjugated secondary antibodies for 2 h at RT and bands were visualized using ECL. Band intensities were quantified by ImageJ (National Institutes of Health).
Crude synaptosomal preparation.
NAc was homogenized in a glass homogenizer containing 200 μl of ice-cold Krebs-sucrose buffer (in mm: 125 NaCl, 1.2 KCl, 1.2 MgSO4, 1.2 CaCl2, 22 Na2CO3, 1.2 NaH2PO4, 10 glucose, and 320 mm sucrose, pH 7.4) in the presence of protease and phosphatase inhibitors. The homogenate was centrifuged at 1000 × g for 10 min at 4°C to pellet heavy membranes and debris (P1). The supernatant (S1) was collected and was centrifuged at 16,000 × g at 4°C for 20 min to pellet the synaptosomal membrane fraction (P2). The P2 faction was resuspended in 100 μl RIPA buffer (same content as above). Total protein concentration was determined using the BCA protein assay kit. The synaptosomal fractionation was confirmed by the presence of PSD-95 and the absence nonsynaptic CREB in the synaptic fraction.
Immunohistochemistry.
Drd1-Cre/Ai14 and Drd2-Cre/Ai14 mice were deeply anesthetized and then transcardially perfused with 0.01 m PBS, and then with 4% paraformaldehyde (PFA) in PBS. Brains were postfixed in 4% PFA for 4 h and then cryoprotected in 30% sucrose for at least 3 d. Brains were then rapidly frozen and sectioned coronally into 50 μm sections using a Leica CM3050 cryostat (Leica Biosystems). Sections containing the NAc were collected, washed in PBS, and then incubated at RT for 4 h in PBS containing 5% normal donkey serum and 0.3% Triton-X for blocking and permeabilization, respectively. Following PBS washes, sections were incubated in the primary antibodies rabbit anti phosphoS6 and mouse anti-NeuN at 4°C overnight. Following washes, sections were incubated in secondary antibodies, donkey-anti rabbit IgG AlexaFluor488 and donkey anti-mouse AlexaFluor647, for 4 h at 4 °C. Sections were washed and then mounted onto Fisher Superfrost glass slides, Vectashield Mounting Media was added, and slides were coverslipped. Images were acquired on the Zeiss LSM 510 Meta confocal microscope with the 20× Plan-Apochromat objective. Quantification was completed semiautomatically using Imaris, Surface module (Bitplane), and all counts were verified manually. The numbers of NeuN+, TdTomato+ (D1+ in Drd1-Cre/Ai14 and D2+ in Drd2-Cre/Ai14), and pS6+ neurons were counted within the NAc shell and core in both hemispheres. To count labeling of pS6 within D1+ and D2+ neurons, we assumed that neurons that were negative for Tdtomato were the other neuronal population. E.g., D1− neurons were considered D2+ and D2− neurons were considered D1+. Because >90% of neurons are either D1 or D2+ (Smith et al., 2013), our methodology is accurate for the vast majority of neurons. A caveat is that we cannot count neurons that express both D1Rs and D2Rs.
Polysomal RNA and total RNA isolation.
Polysome-bound RNA was purified from mouse NAc according to a modified protocol described previously (del Prete et al., 2007). Fresh NAc was snap-frozen and pulverized in liquid nitrogen with a pestle. After keeping on dry ice for 5 min, the pulverized mixture of both NAc hemispheres from a single subject was resuspended in 1 ml lysis buffer (in mm: 10 Tris pH 8.0, 150 NaCl, 5 MgCl2, 40 dithiothreitol, 10 Ribonucleoside Vanadyl Complex, 400 U/ml Rnasin 1% NP40, 0.5% sodium deoxycholate, and 200 μg/ml cycloheximide) followed by repeated pipetting to homogenize the cells. Samples were centrifuged for 10 s at 12,000 × g to remove intact nuclei. The supernatant was collected and the ribosomes were further isolated by adding 2× extraction buffer (in mm: 200 Tris pH7.5, 300 NaCl, and 200 μg/ml cycloheximide). Samples were kept on ice for 5 min and then centrifuged at 12,000 × g at 4°C for 5 min to remove mitochondria and membranous debris. The resulting supernatant was loaded onto a 15–45% sucrose gradient and centrifuged in a SW41Ti rotor (Beckman Coulter) at 38,000 rpm, 4°C for 2 h. Fractions from the sucrose gradient were collected, and one aliquot was taken for absorbance at 254 nm (see Fig. 7A). Polysomal fractions were further digested with proteinase K (400 μg/ml proteinase K, 10 mm EDTA, 1% SDS) at 37°C for 30 min, followed by phenol-chloroform extraction. RNA in the water phase of the polysomal fraction was recovered by ethyl alcohol precipitation. In control experiments to confirm successful polysomal fractionation, 10 mm EDTA was added to disrupt polyribosome formation (Fig. 7A). Total RNA was extracted from mouse Nac using the Paris Kit, and both total and polysomal RNA quantity were measured using Nanodrop2000c spectrophotometer (Thermo Scientific).
Figure 7.

D1R activation promotes the translation of GLUA1, HOMER2, and PSD-95. RT-PCR of polysomal RNA (B) and total RNA (C) in the NAc 30 min after intraperitoneal SKF (5 mg/kg) or vehicle (3% DMSO). A, Isolation of polysomes by sucrose gradient centrifugation. Left, Seventy fractions from the 15–45% sucrose gradient were analyzed by absorbance at 254 nm to measure RNA content. The addition of EDTA disrupts polysome formation and shifts the elution profile. Right, Map of approximate location of each fraction along the sucrose gradient. B, C, Bar graphs show average changes of GLUA1, HOMER2, and PSD-95 following SKF treatment. Data are expressed as a ratio to total GAPDH, normalized to vehicle group, and are expressed as mean ± SEM. B, **p < 0.01. *p < 0.05. B, C, n = 3 vehicle, 3 SKF.
cDNA synthesis and quantitative real-time PCR.
Synthesis of cDNA was performed on total RNA and polysomal RNA, which were reverse-transcribed with Avian Myeloblastosis Virus Reverse Transcriptase according to the manufacturer's instructions. Resulting cDNA was used for quantitative real-time PCR (RT-PCR), using SYBR Green PCR Master mix. Thermal cycling was performed on an Applied Biosystem 7900HT Fast Real-Time PCR detection system. Optimal annealing temperature for the primers was determined to be 60°C (40 cycles). Glyceraldehyde 3-phosphate dehydrogenase (GAPDH) was used as an internal control. The following mouse primers were designed to bridge an exon–exon junction or in separated exons using Primer3 software(Rozen and Skaletsky, 2000): GAPDH: upstream- 5′-CGACTTCAACAGCAACTCCCACTCTTCC-3′, downstream- 3′-TGGGTGGTCCAGGGTTTCTTACTCCTT-5′, amplicon size = 175 bp; GLUA1: upstream- 5′-ACCACTACATCCTCGCCAAC-3′, downstream- 3′-TCACTTGTCCTCCACTGCTG-5′, amplicon size = 145 bp; HOMER2: upstream- 5′-CACGTCTTCCAGATTGACCC-3′, downstream- 3′-GTTCGGGGTGATAGTGCTGT-5′, amplicon size = 159 bp; PSD-95: upstream- 5′-ACCCTAGAAGCCCCAGGATA-3′; downstream- 3′-AAAGATGGATGGGTCGTCAC-5′, amplicon size = 147 bp.
Data analysis.
Electrophysiological experiments were analyzed with two-way ANOVA, with cell type and treatment as between-subject variables. The exception was for analyzing paired-pulse ratio, which was computed only in D1+ neurons and therefore we used a t test. The behavioral experiment was analyzed with mixed ANOVA, with drinking session as the within-subject variable and treatment (rapamycin vs vehicle) as the between-subject variable. Western blot and RT-PCR data were analyzed with Student's t tests, with Welch correction used as needed for samples with unequal variances. Cell-type-specific IHC experiment was analyzed with mixed ANOVA, with cell type as the within-subject variable and treatment (water vs alcohol) as the between-subject. We used sample sizes that are in line with previous reports from our lab and others. We assumed data followed a normal distribution, but this was not specifically tested. All tests were run as two-sided, the α value was set to 0.05, and statistical tests were run on Graphpad Prism 5.
Results
Alcohol induces synaptic plasticity in D1+ neurons
We first examined whether a single session of voluntary alcohol drinking altered glutamate receptor synaptic plasticity in D1+ and D2+ NAc shell neurons by measuring the ratio of AMPA receptor (AMPAR) to NMDA receptor (NMDAR) activity. We used Drd1-Cre/Ai14 and Drd2-Cre/Ai14 mice which express TdTomato in Cre-positive cells (Madisen et al., 2010; Wang et al., 2015), allowing us to identify D1+ neurons or D2+ neurons, respectively. Drd1-Cre/Ai14 and Drd2-Cre/Ai14 mice underwent a single drinking session, with 24 h access to a two-bottle choice for 20% alcohol and water, and whole-cell patch-clamp electrophysiology was performed 24 h after the end of the two-bottle choice session, a time-point when alcohol is absent from brain tissue and thus we can probe for enduring adaptations. We considered both D1+ and D2-neurons from Drd1-Cre/Ai14 mice and Drd2-Cre/Ai14 mice, respectively, as D1+ neurons, and both D1− and D2+ neurons as D2+ neurons. There were no differences between D1+ and D2− neurons or D1− and D2+ neurons in any of physiological test that we conducted (data not shown). Drd1-Cre/Ai14 and Drd2-Cre/Ai14 mice consumed comparable amounts of alcohol throughout the 24 h session (Table 1). Following a single two-bottle choice binge intake session (Fig. 1B) and 24 h of abstinence, there was an increase in the AMPAR/NMDAR ratio in D1+ but not D2+ neurons in the NAc shell (Fig. 1B; two-way ANOVA: no alcohol effect: F(1,27) = 1.3, p = 0.257; no cell-type effect: F(1,27) = 0.2, p = 0.650; alcohol × cell-type interaction: F(1,27) = 6.3, p = 0.018). We also tested whether a single noncontingent administration of alcohol, which allows more precise control over BAC levels and timing of alcohol exposure, was sufficient to produce similar enduring alterations in synaptic transmission in neurons in the medial portion of NAc shell. Drd1-Cre-Ai14 mice and Drd2-Cre-Ai14 mice received a single intraperitoneal (i.p.) injection of a nonhypnotic dose of alcohol (2 g/kg). We found that the AMPAR/NMDAR ratio was increased selectively in D1+ neurons in the NAc shell 24 h after intraperitoneal alcohol administration, with no change in D2+ neurons (Fig. 1C; two-way ANOVA: no alcohol effect: F(1,29) = 1.4, p = 0.239; no cell-type effect: F(1,29) = 0.7, p = 0.407; alcohol × cell-type interaction: F(1,29) = 5.3, p = 0.029). The AMPA/NMDA ratio in D1+ neurons in the NAc shell following a single alcohol administration returned to near baseline levels within 72 h (data not shown; t test: t(16) = 1.1, p = 0.300). In contrast to the shell, there was no change in AMPA/NMDA in either D1+ or D2+ neurons from the NAc core following an alcohol injection (Fig. 1D; two-way ANOVA: no alcohol effect: F(1,30) = 0.6, p = 0.430; no cell-type effect: F(1,30) = 0.5, p = 0.482; no alcohol × cell-type interaction: F(1,30) = 0.07, p = 0.800). These results indicate that a single exposure to alcohol altered excitatory synaptic transmission selectively onto D1+ neurons in the NAc shell.
Table 1.
Alcohol consumption during a single alcohol drinking session
| Figures | Experiment | Mouse strain | N | Alcohol consumption, g/kg |
BAC at 4 h, g/dl | Correlation | ||
|---|---|---|---|---|---|---|---|---|
| 2 h | 4 h | 24 h | ||||||
| 1B | Patch-clamp: AMPA/NMDA | Drd1Cre/Ai14 | 2 | 1.42 ± 0.13 | 4.14 ± 0.65 | 9.25 ± 1.10 | — | |
| Drd2Cre/Ai14 | 3 | 2.49 ± 0.53 | 3.09 ± 0.89 | 9.79 ± 4.63 | — | |||
| 4B–C | Western blot: AKT, GSK-3, ERK, GluA1, Homer, PSD-95 | C57BL/6J | 8 | — | 3.29 ± 0.45 | — | 0.14 ± 0.03 | r = 0.8166* |
| 4B | Western blot: 4E-BP and S6K | C57BL/6J | 5 | — | 5.45 ± 0.81 | — | — | |
| Text only | Western blot: 24 h withdrawal | C57BL/6J | 5 | — | — | 12.82 ± 0.98 | — | |
| 4D | Western blot: GluA1 | C57BL/6J | 3 | — | 2.76 ± 0.94 | — | — | |
| 5 | IHC: pS6 | Drd1Cre/Ai14 | 3 | — | 3.47 ± 0.47 | — | — | |
| Drd2Cre/Ai14 | 2 | — | 3.49 ± 0.86 | — | — | |||
We measured alcohol consumption (g/kg) by subjects, either C57BL/6J or transgenic mice (Drd1Cre/Ai14 or Drd2Cre/Ai14) with a C57BL/6J background, across different experiments. Consumption (g/kg) was measured at the end of the 4 h drinking session, except in the patch-clamp electrophysiology experiment, which had a 24 h drinking session and we measured total consumption at 2, 4, and 24 h, and a Western blot experiment with 24 h drinking and 24 h withdrawal. For the Western blot synaptic fractionation experiment, illustrated in Figure 4C, we measured BAC (g/dl), and then correlated BAC to total alcohol consumption at 4 h.
Values are mean ± SEM;
*p < 0.05.
Figure 1.

Alcohol increases the AMPAR/NMDAR ratio in D1+ neurons but not D2+ neurons selectively in the NAc shell. Patch-clamp recordings in D1+ and D2+ neurons in the NAc shell 24 h after an alcohol challenge. Drd1-Cre/Ai14 and Drd2-Cre/Ai14 mice underwent a single 24 h two-bottle choice (2BC) 20% alcohol session (Alcohol) or water only (Water; B), or were administered a single intraperitoneal administration of alcohol (2 g/kg) or saline (C, D). A, An example of two patched neurons, D1+ (left) and D1− (right). Top left image is bright field, top right image is TdTomato (Ai14+) and the bottom is a merged image. Arrow on bottom image points to pipette that has formed a seal on a D1− neuron. B, Top left, Time course showing cumulative amount of alcohol consumed by Drd1-Cre/Ai14 and Drd2-Cre/Ai14 mice (n = 5) within the 24 h voluntary drinking session. Top right, Bar graphs show average AMPAR/NMDAR ratio in D1+ and D2+ neurons following voluntary alcohol session. Two-way ANOVA, Bonferroni multiple comparison, *p < 0.05; D1+: water versus alcohol; n (neurons) = D1+: 7 water, 9 alcohol; D2+: 6 water, 9 alcohol. Bottom, Representative AMPAR and NMDAR currents in D1+ (black) and D2+ neurons (gray) after water or alcohol. C, D, Left, Bar graphs show average AMPAR/NMDAR ratio in D1+ and D2+ neurons following alcohol injection. Two way-ANOVA, Bonferroni multiple comparison, *p < 0.05; D1+: saline versus alcohol; n (neurons): NAc Shell (C) = D1+: 7 saline, 10 alcohol; D2+: 8 saline, 8 alcohol. NAc Core (D) = D1+: 9 saline, 9 alcohol; D2+: 8 saline, 8 alcohol. Right, Representative current traces in D1+ (black) and D2+ neurons (gray) after saline or alcohol. Calibration: 20 ms, 50 pA.
We next determined the mechanism that underlies the enhanced excitatory synaptic transmission in D1+ neurons. We first examined action potential-independent miniature EPSCs (mEPSCs) in NAc shell neurons from Drd1-Cre/Ai14 or Drd2-Cre/Ai14 mice systemically administered 2 g/kg alcohol or saline. As shown in Figure 2A, mEPSC amplitude was increased in D1+ but not D2+ neurons 24 h after alcohol injection (two-way ANOVA: main alcohol effect: F(1,23) = 6.7, p = 0.017; no cell-type effect: F(1,23) = 1.0, p = 0.328; alcohol × cell-type interaction: F(1,23) = 5.2, p = 0.032). Alcohol induced a nonsignificant trend in increased mEPSC frequency in D1+ neurons (Fig. 2A; two-way ANOVA: no alcohol effect: F(1,23) = 1.3, p = 0.271; no cell-type effect: F(1,23) = 2.7, p = 0.112; no alcohol × cell-type interaction: F(1,23) = 3.9, p = 0.060). However, alcohol did not alter the AMPAR paired-pulse ratio in NAc shell D1+ neurons (Fig. 2B; t test: t(10) = 1.3, p = 0.235). Together, these results suggest that the enhancement of AMPAR/NMDAR ratio in response to alcohol was not due to increased presynaptic glutamate release, and instead suggest a postsynaptic locus of alcohol's action, with increased AMPAR function in D1+ neurons.
Figure 2.

Alcohol increases mEPSC current amplitudes and alters the AMPAR rectification index in D1+ neurons but not D2+ neurons. Patch-clamp recordings in NAc shell D1+ and D2+ neurons 24 h after subjects received a single intraperitoneal alcohol injection (2 g/kg). A, Top left, Bar graph showing effect of alcohol on mEPSC amplitude. Two-way ANOVA, Bonferroni multiple comparison, **p < 0.01; D1+: saline versus alcohol; n (neurons) = D1+: 7 saline, 7 alcohol, D2+: 6 saline, 7 alcohol. Bottom left, Effect of alcohol on mEPSC frequency. Right, Representative traces showing mEPSC events from D1+ neurons (black) and D2+ neurons (gray) after saline or alcohol. Calibration 500 ms, 25 pA. B, Top, Bar graph shows average AMPAR PPR following alcohol. Bottom, Representative traces of evoked AMPAR currents evoked 50 ms apart. Stimuli artifacts are removed for clarity. Calibration: 25 ms, 50 pA. n (D1+ neurons) = 5 saline, 7 alcohol. C, Top, Bar graphs show average AMPAR rectification index following alcohol. Two-way ANOVA, Bonferroni multiple comparison, **p < 0.01; D1+: saline versus alcohol. n (neurons) = D1+: 8 saline, 9 alcohol, D2+: 8 saline, 9 alcohol. Bottom, Representative AMPAR traces at holding potentials of +40 (outward current), 0, and −70 mV (inward current) from D1+ neurons (black) and D2+ neurons (gray) after saline or alcohol. Calibration: 25 ms, 50 pA.
Next, we examined whether a single alcohol exposure altered AMPAR function by measuring the input/output relationship of AMPAR-mediated currents. AMPARs that lack GluA2 subunit are Ca2+-permeable, and show inward rectification due to intracellular polyamine blockade at positive holding potentials (Isaac et al., 2007). Thus, we measured the rectification index (RI; AMPAR current at negative membrane potential divided by AMPAR current at positive membrane potential). As shown in Figure 2C, alcohol significantly increased the RI in D1+ neurons but not D2+ neurons (two-way ANOVA: main alcohol effect: F(1,30) = 13.9, p = 0.0008; main cell-type effect: F(1,30) = 10.6; p = 0.0029; no alcohol × cell-type interaction: F(1,30) = 0.6, p = 0.435) suggesting that alcohol increased the number of GluA2-lacking AMPARs. These data suggest that alcohol triggered synaptic plasticity onto D1+ neurons by increasing AMPAR-mediated activity and promoting a switch in AMPAR composition toward more GluA2-lacking receptors.
Alcohol-mediated behaviors require D1R activation in the NAc (Hodge et al., 1997; Bahi and Dreyer, 2012; Young et al., 2014), and we previously showed that a single alcohol injection activates mTORC1 in the NAc (Neasta et al., 2010). mTORC1 promotes mRNA-to-protein translation of a subset of synaptic proteins (Thoreen et al., 2012), and is required for the induction of several forms of synaptic plasticity (Hoeffer and Klann, 2010; Lipton and Sahin, 2014). Therefore, we tested whether D1R or mTORC1 activation are necessary for alcohol's effect on excitatory synaptic strength in D1+ neurons. Drd1-Cre/Ai14 and Drd2-Cre/Ai14 mice received systemic administration of the D1R antagonist SCH-23390 (0.1 mg/kg), the mTORC1 inhibitor rapamycin (10 mg/kg), or vehicle 30 min (SKF) or 3 hr (rapamycin) before alcohol administration. As shown in Figure 3A, both SCH-23390 and rapamycin blocked the alcohol-induced enhancement of AMPAR/NMDAR ratio in D1+ neurons compared with vehicle controls (two-way ANOVA: no alcohol effect: F(1,37) = 3.3, p = 0.076; no pretreatment effect: F(2,37) = 1.5, p = 0.237; alcohol × pretreatment interaction: F(2,37) = 4.7, p = 0.015). These results indicate that activation of D1Rs and mTORC1 were required for alcohol-induced synaptic plasticity in D1+ neurons in the NAc shell.
Figure 3.
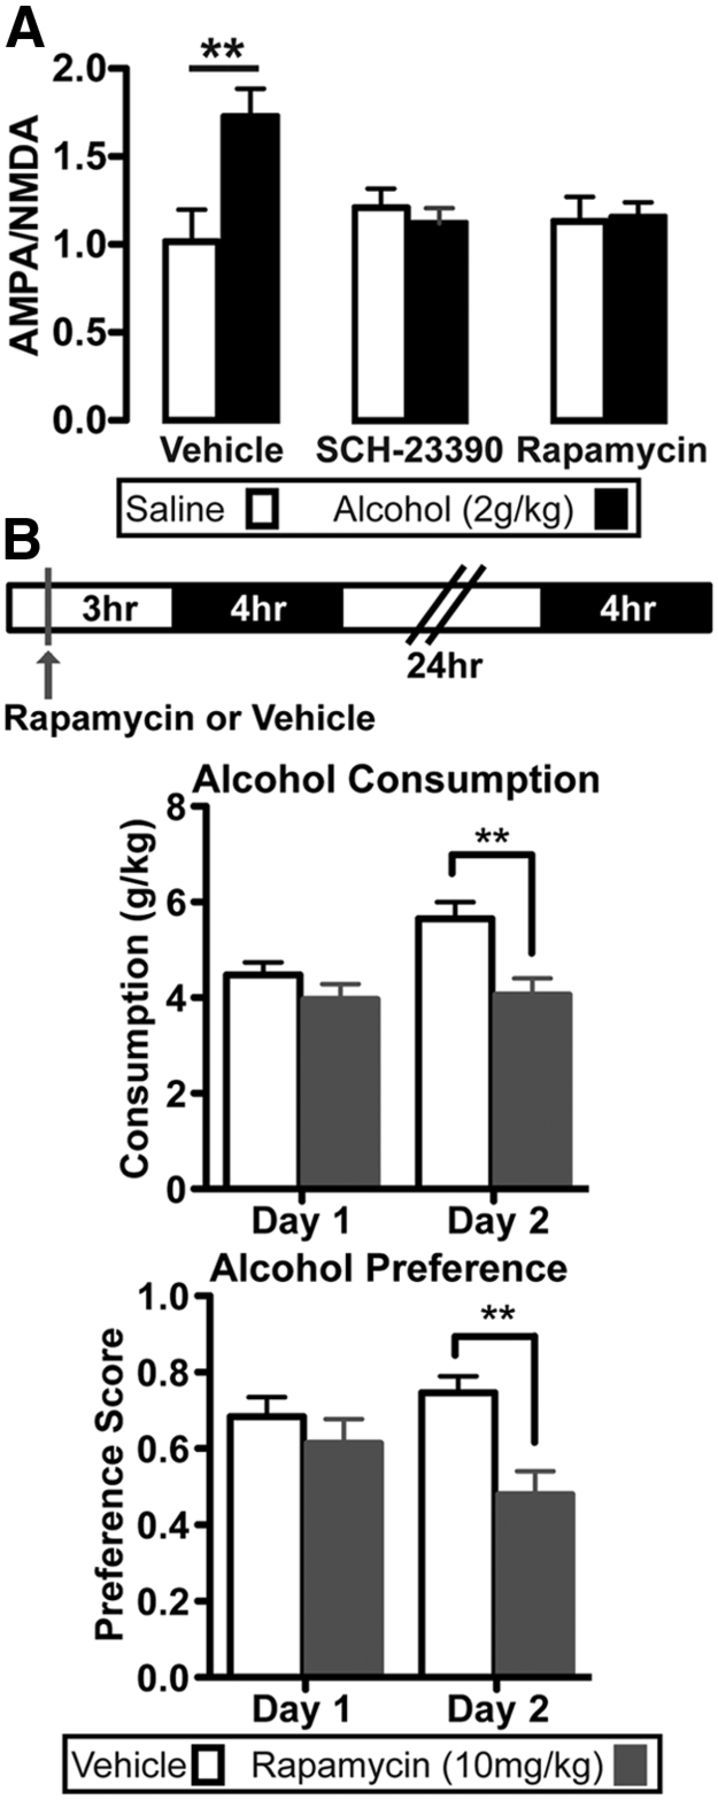
mTORC1 is required for the alcohol-induced enhancement of the AMPAR/NMDAR ratio in D1+ neurons and for reinforcement learning triggered by the first alcohol drinking session. A, Patch-clamp recordings from D1+ neurons in the NAc shell 24 h following an alcohol (2 g/kg) or saline injection. Subjects were pretreated with either vehicle (3% DMSO) or rapamycin (10 mg/kg) 3 h before, or D1R antagonist SCH-23390 (0.1 mg/kg) 30 min before alcohol injection. Bar graphs depict the average AMPAR/NMDAR ratio after alcohol challenge. Two-way ANOVA, Bonferroni multiple comparison, **p < 0.01; Vehicle: saline versus alcohol; n (D1+ neurons) = 6 vehicle/saline, 11 vehicle/alcohol, 6 rapamycin/saline, 8 rapamycin/alcohol, 5 SCH23390/saline, 7 SCH23390/alcohol. B, Alcohol consumption and preference during the first two 4 h sessions of two-bottle choice for alcohol and water. Top, Schematic representation of the experimental procedure. Mice received intraperitoneal administration of vehicle or rapamycin (10 mg/kg) 3 h before a 4 h two-bottle choice session (black), and then 24 h later, mice were given another 4 h two-bottle choice session. Middle bottom, Bar graphs show alcohol consumption (middle) and alcohol preference (bottom) on days 1 and 2 of vehicle (white) and rapamycin (gray) groups. **p < 0.01; n = 12 vehicle, 15 rapamycin.
Next, we tested the possible behavioral consequences of mTORC1 activation in response to the first alcohol drinking session and tested the hypothesis that mTORC1 activation facilitates the consumption of alcohol in response to the initial drinking session. To do so, we examined whether treating mice with rapamycin before the initial 4 h two-bottle choice drinking session affected alcohol consumption and preference over water on the first and subsequent session. C57BL/6J mice received systemic administration of vehicle or rapamycin (10 mg/kg) 3 h before the first 4 h session of two-bottle choice for alcohol (20%) or water, and then 24 h later, the subjects were given a second 4 h two-bottle choice drinking session (Fig. 3B). While consumption and preference were not altered on the first session, rapamycin treatment reduced alcohol consumption (Fig. 3B; repeated-measures ANOVA: main day effect: F(1,25) = 5.8, p = 0.024; main treatment effect: F(1,25) = 7.6, p = 0.011; day × treatment interaction: F(1,25) = 4.3, p = 0.049) and alcohol preference (Fig. 3B: repeated-measures ANOVA: no day effect: F(1,25) = 0.06, p = 0.441; main treatment effect: F(1,25) = 6.4, p = 0.018; day × treatment interaction: F(1,25) = 4.6, p = 0.041) on the subsequent drinking session. This effect was likely not due to reduced locomotion following rapamycin, as total consumption (alcohol + water) was increased on the second drinking session but was not different between groups (data not shown; repeated-measures ANOVA: main day effect: F(1,25) = 13.1, p = 0.0013; no treatment effect: F(1,25) = 1.9, p = 0.179; no day × treatment interaction: F(1,25) = 1.7, p = 0.198). Furthermore, although there was a relatively strong correlation in vehicle-treated mice between alcohol consumption on days 1 and 2 that trended toward significance (data not shown: r = 0.572, p = 0.052), there was little correlation in mice treated with rapamycin (data not shown: r = 0.257, p = 0.354). These results suggest that mTORC1 is important for reinforcement learning triggered by the first alcohol drinking experience.
The first alcohol binge rapidly activates mTORC1 and increases synaptic protein expression
Because a single alcohol drinking session induced an mTORC1-dependent adaptation in synaptic transmission in NAc D1+ neurons and was sufficient to drive subsequent drinking behavior, and a single injection of alcohol activates Akt and its downstream target mTORC1 (Mendoza et al., 2011) in the NAc (Neasta et al., 2010, 2011), we hypothesized that a single session of voluntary access to alcohol was sufficient to activate the Akt/mTORC1 pathway. To test this possibility, C57BL/6J mice underwent a single 4 h two-bottle choice session, whereas control mice received two bottles of water for 4 h. At the end of the 4 h session, mice reached a BAC of 0.143 ± 0.030 g/dl (Table 1), a drinking level that reflects binge intake (Crabbe et al., 2011), and importantly, alcohol consumption and BAC were strongly correlated (Fig. 4A; r(6) = 0.8, p = 0.013). A single bout of alcohol drinking robustly increased phosphorylation of Akt, as evidenced by phosphorylation at residue Ser473 (Fig. 4B; t(12) = 8.0, p < 0.001). Moreover, alcohol drinking increased the phosphorylation of the Akt substrate, glycogen synthase kinase 3β (GSK-3β, Ser9; Cross et al., 1995; Fig. 4B; t(12) = 7.2, p < 0.001), and also produced a small but significant increase in phosphorylation of extracellular signal-regulated kinase 2 (Erk2, Tyr204; Fig. 4B; t(12) = 2.3, p = 0.043), which can also lead to the activation of mTORC1 (Ma and Blenis, 2009). In line with alcohol-triggered activation of Akt in the NAc, mTORC1 was activated in response to alcohol drinking as indicated by increased phosphorylation of its downstream targets, eukaryotic translation initiation factor 4E-binding protein 1 (4E-BP; Thr37/46; Fig. 4B; Welch-corrected t(4) = 8.9, p = 0.0009) and p70 ribosomal S6 kinase (S6K, Thr389; t(7) = 4.6, p = 0.0026), and increased phosphorylation of the S6K substrate ribosomal protein S6 (Ser235/236; Fig. 4B; t(12) = 4.1, p = 0.001). The increases in the phosphorylation levels were not due to changes in basal levels of the tested proteins (data not shown; Akt: t(12) = 0.6, p = 0.533; GSK-3β: t(12) = 0.2, p = 0.826; Erk2: t(12) = 0.3, p = 0.803; 4E-BP: t(7) = 0.4, p = 0.735; S6K: t(7) = 0.9, p = 0.387; S6: t(12) = 0.6, p = 0.590; Erk2: t(12) = 0.3, p = 0.803). Phosphorylation levels of 4E-BP, S6K, and S6 returned to near-baseline values 24 h after a single 24 h two-bottle choice drinking session (data not shown: 4E-BP: t(7) = 2.0, p = 0.088; S6K: t(7) = 1.8; p = 0.112); S6: t(7) = 0.08; p = 0.940) These data indicate that the mTORC1 pathway in the NAc was activated in response a single session of voluntary alcohol consumption.
Figure 4.

A single alcohol drinking session activates mTORC1 and increases protein expression in the synaptic fraction. Western blot analyses of the total homogenate (B, D) and synaptic fraction (C) immediately after a single 4 h two-bottle choice session for alcohol (black) or water only (white). B, right, and C, D, bottom, Representative images of the bar graph analyses. A, Scatter plot showing the relationship between alcohol consumption (g/kg) and BAC (g/dL) from the 4 h alcohol two-bottle choice session. BAC assay was run in duplicate or triplicate (black points). Mean consumption and BAC (±SEM) is signified by the gray point. Centerline is the linear regression and outer curved lines are the 95% confidence intervals. B, Bar graphs depict the changes in phosphorylation levels of Akt, GSK3β, Erk2 (lower band), 4E-BP, S6K, and S6 in the total homogenate following alcohol access. Data are expressed as the optical density ratio of phosphoprotein to total protein, normalized to water control. Data are expressed as mean ± SEM. C, Bar graphs show the average changes in the phosphorylation of S6 (left) or total levels of GluA1, Homer, and PSD-95 (right) in the synaptic fraction in response to alcohol. For total protein levels, data are expressed as the optical density ratio of total protein to GAPDH, normalized to control. D, Bar graph shows average change in phospho-GluA1 (Ser485; left), and the change in total GluA1 (right), following alcohol drinking. A, R2 = 0.637; slope is significantly different from zero: F(1,17) = 29.9; p < 0.0001. B, ***p < 0.001, **p < 0.01, *p < 0.05. C, **p = 0.0052, *p < 0.05. D, *p = 0.0484. A, n = 8 mice. B, C, 4E-BP and S6K: n = 4 water, 5 alcohol; all others: n = 6 water, 8 alcohol. D, n = 3 water, 3 alcohol.
mTORC1-dependent ribosomal machinery is found in dendrites, where mTORC1 drives local protein translation (Liu-Yesucevitz et al., 2011; Buffington et al., 2014; Lipton and Sahin, 2014). Thus, we tested whether an alcohol-drinking session activates mTORC1 at synapses by measuring the level of S6 phosphorylation in a crude synaptosomal preparation. As shown in Figure 4C, the first alcohol drinking session robustly activated mTORC1 in the synaptic fraction of the NAc (t(12) = 3.4, p = 0.005). We then tested whether a single drinking session was sufficient to increase the expression of proteins whose translation is regulated by mTORC1, including GluA1, Homer, and PSD-95 (Lee et al., 2005; Slipczuk et al., 2009; Neasta et al., 2010). Although alcohol did not change the protein levels in the NAc total homogenate (data not shown; GluA1: t(12) = 0.4, p = 0.694; Homer t(12) = 0.3, p = 0.801; PSD-95: t(12) = 0.4, p = 0.685), a single drinking session increased synaptic levels of GluA1 (Fig. 4C; t(12) = 2.3, p = 0.040) and Homer (Fig. 4C; t(12) = 2.9, p = 0.012), but not PSD-95 (Fig. 4C; t(12) = 1.1, p = 0.299). Increased synaptic protein levels could be due to either increased protein translation or membrane trafficking. D1R activation promotes the trafficking of GluA1 to the cell surface via phosphorylation of GluA1 at Ser845 (Snyder et al., 2000), which is a PKA phosphorylation site (Esteban et al., 2003). However, alcohol drinking did not increase GluA1 phosphorylation. In fact, a small but significant decrease in phosphorylation at Ser845 was observed in the total homogenate of alcohol versus water only drinking mice (Fig. 4D; t(4) = 2.8, p = 0.049), with a nonsignificant trend for an increase in total GluA1 levels (t(4) = 2.0, p = 0.111). Together, these data indicate that the first binge drinking session was sufficient to activate mTORC1, increase GluA1 and Homer levels in the NAc synaptic fraction, which resulted in increased postsynaptic AMPAR currents. Furthermore, increased synaptic GluA1 was not to be due to phosphorylated Ser845-dependent trafficking of the subunit.
Because alcohol only altered synaptic transmission in NAc D1+ neurons, we tested whether a single 4 h session of alcohol drinking increased S6 phosphorylation in D1+ but not D2+ neurons by analyzing phospho-S6 immunoreactivity in the medial portion of the NAc shell or the NAc core (Fig. 5A). Drd1-Cre/Ai14 and Drd2-Cre/Ai14 mice consumed a similar amount of alcohol in the single 4 h session as C57BL/6J mice (Table 1). Binge intake of alcohol significantly increased the percentage of phosphoS6-positive neurons among all cells in the NAc shell (Fig. 5B; t(10) = 3.1, p = 0.011), which was driven by enhanced phosphoS6 expression in D1+ neurons but not D2+ neurons (Fig. 5B; mixed ANOVA: no cell-type effect: F(1,10) = 0.2, p = 0.642; main alcohol effect: F(1,10) = 8.6, p = 0.015; cell-type × alcohol interaction: F(1,10) = 6.9, p = 0.025). In contrast, alcohol treatment did not affect phospho-S6 levels in the NAc core, either in total neurons (Fig. 5C; t(10) = 1.2, p = 0.271) or in D1+ or D2+ neurons (Fig. 5C; mixed ANOVA: no cell-type effect: F(1,10) = 0.6, p = 0.443; no alcohol effect: F(1,10) = 1.4; p = 0.268; no cell-type × alcohol interaction: F(1,10) = 0.1; p = 0.760). Overall, these data suggest that the initial drinking experience rapidly activated mTORC1 selectively within D1+ neurons in the NAc shell.
Figure 5.

A single voluntary alcohol session increases pS6 immunoreactivity only in D1+ neurons in the NAc shell. Immunohistochemical analyses of phospho-S6 levels in D1+ and D2+ neurons in the medial NAc shell and NAc core following a 4 h two-bottle choice alcohol session (Alcohol) or water only (Water). A, Representative coronal section that contains the medial portion of the NAc shell (shaded black) and NAc core (red). Image courtesy of Allen Mouse Brain Atlas (Lein et al., 2007). B, C, Bar graphs depict the average changes in phospho-S6 immunoreactivity as a ratio of total neurons (left) or of D1+ and D2+ neurons (right) following alcohol access. Data are expressed as mean ± SEM. B, Left, *p < 0.05; Right, Mixed ANOVA, Bonferroni multiple comparison, **p < 0.01 D1+: water versus alcohol. D, E, Representative images from the NAc shell (D) and core (E) with labeling of pS6 (green) and D1+ neurons (red) in a Drd1-Cre/Ai14 subject that received only water (top) or alcohol (bottom). All images also contained NeuN immunoreactivity, but that channel was removed for clarity. Yellow arrow indicates colocalization of pS6 and TdTomato (D1+ neuron). White arrow indicates pS6 alone. Calibration: 25 μm. B, C, n: 7 water, 5 alcohol.
D1R activates mTORC1 and triggers protein translation
Finally, we aimed at elucidating the mechanism that underlies the mTORC1-dependent adaptations in response to a single drink of alcohol. Alcohol increases DA levels in the NAc (Di Chiara and Imperato, 1988). We found that alcohol activates mTORC1 selectively in NAc in D1+ neurons (Fig. 5) and that alcohol-dependent plasticity in D1+ neurons requires mTORC1 and D1Rs (Fig. 3). Thus, we tested whether direct stimulation of D1Rs was sufficient to activate mTORC1 in the NAc. Adult C57BL/6J mice received systemic administration of the D1R agonist SKF-81927 (SKF; 5 mg/kg) or vehicle, and mTORC1-related activation in the NAc was examined 30 min later. SKF treatment significantly increased phosphorylation of Akt and GSK-3β in the NAc, but in contrast to alcohol drinking, did not alter Erk2 phosphorylation (Fig. 6A; Akt: Welch-corrected: t(6) = 4.0, p = 0.007; GSK-3β: t(10) = 4.5, p = 0.001; Erk2: lower band: t(10) = 1.0, p = 0.357). Although SKF treatment did not alter 4E-BP phosphorylation (Fig. 6A; t(6) = 0.3, p = 0.7571), phosphorylation levels of S6K and S6 were increased (Fig. 6A; S6K: t(7) = 11.1, p < 0.0001; S6: t(10) = 7.2, p < 0.0001). S6 contains a cluster of five phosphorylation sites (Ser235, 236, 240, 244, and 247) that are all targets of the mTORC1 substrate ribosomal protein p70 S6 kinase (S6K; Ruvinsky and Meyuhas, 2006), and SKF increases phosphorylation of S6 at all of these sites (data not shown; Ser240/244: t(6) = 4.2, p = 0.006; Ser244/247: t(6) = 3.0, p = 0.025). SKF did not change the overall level of levels of the examined proteins (data not shown; Akt: t(10) = 0.7, p = 0.515; GSK-3β: t(10) = 0.1, p = 0.907; Erk2: t(10) = 0.1, p = 0.915; 4E-BP: t(6) = 2.1, p = 0.083; S6K: t(7) = 0.7, p = 0.532; S6: t(10) = 0.7, p = 0.480). In contrast to D1R activation, systemic administration of the D2R agonist quinpirole (5 mg/kg) did not alter the phosphorylation state of the examined proteins (Fig. 6B; pAkt: t(7) = 0.2, p = 0.871; pGSK-3β: t(7) = 0.9, p = 0.414; pErk2: t(7) = 1.2, p = 0.262;h pS6: t(7) = 0.7, p = 0.517). Quinpirole also did not affect the overall expression level of Akt (data not shown; t(7) = 0.3, p = 0.761), GSK-3β (t(7) = 0.9, p = 0.410) or S6 (t(7) = 0.1, p = 0.248), and slightly decreased Erk2 (data not shown; t(7) = 2.4, p = 0.045). Together, these results indicate that D1R but not D2R stimulation was sufficient to activate the Akt/mTORC1 pathway in the NAc.
Figure 6.

The D1 agonist SKF-81927, but not the D2 agonist quinpirole, activates Akt and mTORC1 in the NAc. Western blot analyses 30 min after intraperitoneal injection of 3% DMSO (vehicle) or 5 mg/kg SKF-81927 (A), or 0.9% saline (vehicle) or 5 mg/kg quinpirole (B). Right, Representative blots of bar graph analyses. The vertical line that separates groups in quinpirole experiment indicates that blots were from the same gel but were not run in adjacent lanes. A, B, Bar graphs depict the average changes of Akt, GSK3β, Erk2 (lower band), 4E-BP, S6K, and S6 phosphorylation in response to SKF (A) or quinpirole (B) treatment. Data are expressed as the optical density ratio of phosphoprotein to total protein and normalized to vehicle control, and are expressed as mean ± SEM. A, **p < 0.01, ***p < 0.001. A, 4E-BP: n = 4 vehicle, 5 SKF; S6K: n = 4 vehicle, 5 SKF; All others: n = 6 Vehicle, 6 SKF. B, n = 5 Vehicle, 4 Quinpirole.
Because mTORC1 controls the dendritic mRNA to protein translation (Thoreen et al., 2012), we next examined whether SKF increased the translation of GLUA1, HOMER2 mRNA whose protein levels were increased by alcohol (Fig. 4) and whose, translation is regulated by mTORC1 (Lee et al., 2005; Slipczuk et al., 2009; Neasta et al., 2010). Thus, we measured the mRNA levels of these selected targets in polysomal fractions, which contain mRNAs undergoing translation (Fig. 7A). Mice treated with SKF showed a robust increase in polysomal GLUA1 (Fig. 7A; t(4) = 4.6, p = 0.010), HOMER2 (t(4) = 6.9, p = 0.002), and PSD-95 (t(4) = 4.5, p = 0.011). Furthermore, there was no change in total mRNA of these genes (Fig. 7C; GLUA1: t(4) = 1.2, p = 0.304; HOMER2: t(4) = 0.4, p = 0.688; PSD-95: t(4) = 0.3, p = 0.781), indicating that D1R activation triggered translation of these synaptic proteins without affecting transcription.
Finally, we determined whether D1R administration led to mTORC1-dependent increases in the protein levels of the three above-mentioned downstream targets. Rapamycin (10 mg/kg) significantly blocked the D1R-mediated increase in GluA1 (Fig. 8A; two-way ANOVA: main rapamycin pretreatment effect: F(1,13) = 5.6, p = 0.033; main SKF treatment effect: F(1,13) = 15.1, p = 0.002; no pretreatment × treatment interaction; F(1,13) = 2.9, p = 0.112) and Homer (Fig. 8A; two-way ANOVA: main rapamycin pretreatment effect: F(1,13) = 6.1, p = 0.028; main SKF treatment effect: F(1,13) = 10.9, p = 0.006; pretreatment × treatment interaction: F(1,13) = 7.1, p = 0.020). In contrast, the SFK-mediated increase in PSD-95 immunoreactivity was not affected by rapamycin treatment (Fig. 8A; two-way ANOVA: no rapamycin pretreatment effect: F(1,13) = 2.5, p = 0.176; main SKF treatment effect: F(1,13) = 16.2, p = 0.001; no pretreatment × treatment interaction: F(1,13) = 0.04, p = 0.851). Also, in contrast to D1R activation, quinpirole did not alter the levels of GluA1, Homer, PSD-95 in the absence of rapamycin (Fig. 8B; GluA1: t(7) = 1.2, p = 0.250; Homer t(7) = 1.1, p = 0.304; PSD-95 t(7) = 1.9, p = 0.096). Overall, these results suggest that D1R activation triggered mTORC1-dependent translation of GLUA1 and HOMER2, which led to increases in protein levels of both proteins. The Homer antibody recognizes all Homer isoforms, and we cannot exclude the possibility that immunoreactivity of other isoforms were also increased in the NAc in response to D1R activation. Nonetheless, these results show that D1R activation was sufficient to trigger the translation of proteins important for excitatory synaptic transmission, similar to what was observed for alcohol exposure.
Figure 8.

D1R-dependent increases in GluA1 and Homer protein levels require mTORC1 activity. Western blot analyses in the NAc 30 min after intraperitoneal administration of SKF or vehicle (3% DMSO) from subjects that were pretreated 3 h prior with rapamycin (i.p., 10 mg/kg) or vehicle (3% DMSO). A, Top, Representative blots from groups following vehicle or rapamycin injection and then vehicle or SKF injection. Bottom, Bar graphs display the average changes in GluA1, Homer, or PSD-95 following pretreatment of rapamycin or vehicle, followed by treatment of SKF or vehicle. Data are expressed as an optical density ratio of total protein to GAPDH, normalized to the vehicle/vehicle group, and are expressed as mean ± SEM. GluA1: two-way ANOVA, Bonferroni multiple comparison, **p < 0.01 veh/veh versus veh/SKF; *p < 0.05 veh/SKF versus rapamycin/SKF. Homer: two-way ANOVA, Bonferroni multiple comparison, **p < 0.01 veh/veh versus veh/SKF and veh/SKF versus rapamycin/SKF. PSD-95: two-way ANOVA Bonferroni multiple comparison, *p < 0.05 veh/veh versus veh/SKF and rapamycin/veh versus rapamycin/SKF. B, Left, Bar graphs show the average changes in GluA1, Homer, and PSD-95 levels in response to quinpirole. Data are expressed as the optical density ratio of total protein to GAPDH, normalized to saline control, an expressed as mean ± SEM. Right, Representative blots of bar graph analyses. The vertical line between groups indicates that blots were from the same gel but were not run in adjacent lanes. A, n = 4 vehicle/vehicle, 4 vehicle/SKF, 4 rapamycin/vehicle, 5 rapamycin/SKF. B, n = 5 saline, 4 quinpirole.
Discussion
Our major finding is that the first experience with alcohol was sufficient to induce a long-lasting enhancement of excitatory synaptic transmission onto D1+ neurons in the NAc shell. Importantly, this increased excitatory activity was mediated by the activation of D1Rs and mTORC1, resulting in the translation of glutamate receptors and regulatory synaptic proteins. Our data suggest that the alcohol-driven increase in synaptic levels of mTORC1-dependent GluA1 and Homer translation was, at least in part, the molecular mechanism underlying the sustained synaptic strengthening in D1+ neurons after a single binge-level bout of alcohol consumption. Importantly, we report that inhibition of mTORC1 during the initial drinking session reduced alcohol consumption and preference on a subsequent drinking session. Together, our results suggest that mTORC1-dependent plasticity in D1+ neurons may be a neural trace of the reinforcing property of alcohol.
We show that a single alcohol drinking session increased synaptic expression of GluA1 and led to a long-lasting enhancement in the function of GluA2-lacking AMPARs in the NAc. GluA1 translation depends on mTORC1 activity (Slipczuk et al., 2009), and we show that mTORC1-dependent increases in GluA1 levels depended on D1R activation. D1R activation also regulates the membrane trafficking of GluA1 via PKA-dependent phosphorylation of GluA1 at Ser845 (Chao et al., 2002; Esteban et al., 2003). However, our results indicate that alcohol drinking did not increase phosphorylation of GluA1 at Ser845, and thus it is unlikely that a single drinking experience was sufficient to drive lateral movement of AMPARs along the plasma membrane.
We have previously shown that Homer protein expression is increased in the NAc following binge drinking, and that Homer increased in an mTORC1-dependent (Neasta et al., 2010). Importantly, we show here that a single binge alcohol drinking session, likely acting through D1R activation, was sufficient to increase expression of Homer. Homer promotes synaptic plasticity in a number of ways, such as coupling Group 1 metabotropic glutamate receptors (mGluR1 and mGluR5) to inositol trisphosphate receptors and promoting mGluR-induced intracellular calcium release (Tu et al., 1998). In addition, Homer (Szumlinski et al., 2008) and GluA1 (Chen et al., 2010) have been linked to drug-induced neuroadaptations. The alcohol augmentation of synaptic GluA1 and Homer levels in the NAc is in line with our observations regarding the ability of alcohol to enhance excitatory synaptic strength. Finally, it is highly likely that the synaptic translation of other mTORC1 targets (Buffington et al., 2014) contributes to the increased synaptic strength that develops after a single alcohol exposure, a line of research currently under investigation.
Alcohol augments DA release into the NAc (Di Chiara and Imperato, 1988), and we found that direct D1R stimulation, or alcohol exposure likely acting through D1Rs, was sufficient to activate Akt and its downstream effectors mTORC1 in the NAc. However, we cannot rule out that Erk2 activity leads to mTORC1 activation following alcohol binge drinking, as phosphorylation levels of Erk2 was increased after alcohol consumption but not D1 agonist administration. We also show that activation of D1Rs produced an mTORC1-dependent increase in the levels of the synaptic proteins Homer and GluA1 within the NAc, providing a clear link between D1R stimulation, mTORC1 activation, and enhancement of synaptic plasticity in the NAc. We previously found that PKA, which is activated by D1R stimulation (Neve et al., 2004), is required for the alcohol-mediated activation of the small GTP binding protein H-Ras in the NAc (Ben Hamida et al., 2012). H-Ras in turn stimulates the PI3K/Akt pathway (Castellano and Downward, 2010), which is also activated in the NAc in response to alcohol and drives alcohol drinking (Neasta et al., 2011, 2014). Downstream of Akt is mTORC1, which is also activated after binge drinking and withdrawal, and mediates alcohol behaviors (Neasta et al., 2010). Our results show that mTORC1 pathway activation returns to baseline levels 24 h after the alcohol drinking session, but the transient mTORC1 activation is sufficient to drive alter excitatory synaptic transmission persists for at least 24 h. Together with previous findings, this suggests that mTORC1 activation may persist for longer periods following repeated cycles of alcohol intake.
A link between D1R and mTORC1 has been suggested in the dorsal striatum and hippocampus. In the dorsal striatum, L-DOPA activates mTORC1 selectively in D1+ neurons from mice with a 6-OHDA lesion, and inhibiting mTORC1 prevents L-DOPA-induced dyskinesia (Santini et al., 2009). Also, repeated D1R activation increases S6K phosphorylation in the hippocampus, occludes high-frequency stimulation-induced long-term potentiation, and induces kindled seizures (Gangarossa et al., 2014). However, because a single administration of D1R agonist was sufficient to induce the mTORC1 signaling cascade in the NAc shell, our data suggest that mTORC1 is more readily available for D1R-dependent stimulation in the NAc than in these other brain regions, which could reflect compartmentalization of D1Rs with the ribosomal translational machinery in dendrites or spines of D1+ neurons. These interesting possibilities should be further explored in future studies.
mTORC1-dependent plasticity is also activated by a single exposure to other drugs of abuse (Neasta et al., 2014), perhaps reflecting encoding of the reinforcing property of drugs. Acute Δ9-tetrahydrocannabinol (THC) increases S6K phosphorylation in the striatum (Puighermanal et al., 2013), and cocaine increases pS6 in the NAc (Wu et al., 2011). Moreover, withdrawal from cocaine increases total and phosphorylated mTOR in the NAc (James et al., 2014), and cue-induced reinstatement to cocaine increases phosphorylated S6K and S6 in the NAc core (Wang et al., 2010). Recently, Biever et al. (2015) showed that amphetamine acutely increases pS6 in D1+ neurons in the striatum, but interestingly this effect was independent of mTORC1. It is possible that amphetamine activates S6 differently than alcohol, and also our experiments examined alcohol's actions selectively in the NAc, whereas Biever et al. (2015) investigated amphetamine's actions on the entire striatum. Nevertheless, the actions of mTORC1 are behaviorally relevant for the intake of various drugs of abuse, as intra-NAc rapamycin decreases the breakpoint for cocaine and reduces cue-induced cocaine reinstatement (James et al., 2014), and inhibits binge alcohol drinking and alcohol self-administration (Neasta et al., 2010). These findings provide compelling evidence that mTORC1 is involved in encoding the reinforcing properties of alcohol and other drugs of abuse. mTORC1 is required at various stages of learning and memory formation, including long-term memory storage, memory consolidation (Buffington et al., 2014), and reconsolidation of alcohol seeking (Barak et al., 2013). Moreover, our results provides a clear link between D1Rs and mTORC1 activation in the NAc shell, and previous studies have shown that NAc D1Rs are also critical for the development or expression of alcohol-induced behaviors including locomotor sensitization, CPP, and self-administration (Hodge et al., 1997; Bahi and Dreyer, 2012; Young et al., 2014). D1R activation is likely important for encoding the reinforcing properties of other drugs, as knockdown of D1Rs in the NAc shell prevents the acquisition of cocaine self-administration (Pisanu et al., 2015). Furthermore, our results indicate that mTORC1 is also required for sustained alcohol consumption across the initial alcohol drinking sessions, which further reinforce the hypothesis that D1Rs and mTORC1 are required for the development of alcohol-related behaviors. Although mTORC1 inhibition does not affect alcohol drinking on the first session, it is possible that this initial alcohol experience is due to the novelty of the stimulus, which may recruit different neural circuits. C57BL/6J mice display particularly high levels of novelty-seeking behavior (Griebel et al., 1993; Moy et al., 2008).
We also demonstrate that alcohol activates mTORC1 and induces plasticity in the NAc shell but not core, which is in line with previous findings showing that alcohol is self-administered into the NAc shell but not core (Engleman et al., 2009), and suggest that the NAc shell is critically involved in encoding the reinforcing actions of alcohol. Together, D1R-mTORC1 is likely a critical signaling pathway underlying drug- and alcohol-induced maladaptations in the NAc shell, and our results indicate that even the first binge alcohol intake session leads to persistent D1R- and mTORC1-dependent enhancement excitatory synaptic transmission in NAc shell D1+ neurons.
Further experiments will be needed to determine whether specific synapses onto NAc neurons show mTORC1-induced plasticity. The ventral hippocampus (vHC), basolateral amygdala, and medial prefrontal cortex (mPFC) all project onto NAc cells, and multiple injections of cocaine increases the AMPAR/NMDAR ratio only in vHC inputs (Britt et al., 2012). Adding more complexity, cocaine self-administration and withdrawal increases the AMPAR/NMDAR ratio in vHC inputs, but enhances AMPAR rectification in mPFC inputs (Pascoli et al., 2014) within the NAc, suggesting that alcohol challenge may impact selective synapses differently. It is also known that D1+ neurons from the NAc project to the VTA, as well as to the ventral pallidum (Lu et al., 1998), so it will be important to test whether D1+ neurons with these projections show alcohol-induced synaptic alterations.
In conclusion, our results indicate that the first alcohol binge intake experience is sufficient to stimulate mTORC1 and synaptic plasticity selectively in D1+ neurons in the NAc shell. Furthermore, mTORC1 activity is necessary for sustained alcohol drinking and preference across the initial alcohol drinking sessions. We propose that the D1R/mTORC1-dependent enhancement of excitatory currents in the NAc after the first alcohol experience reflects a neural imprint of alcohol's rewarding properties, and is necessary for the development of alcohol-induced pathological behaviors, such as compulsive drinking.
Footnotes
This work was supported by NIH/NIAAA Grants P50 AA017072 (D.R.) and F32 AA023703 (J.T.B.). We thank Ji Hwan Yu for animal management, Dr Viktor Kharazia for imaging, and Dr Frederic W. Hopf for careful review of the paper.
The authors declare no competing financial interests.
References
- Bahi A, Dreyer JL. Involvement of nucleus accumbens dopamine D1 receptors in ethanol drinking, ethanol-induced conditioned place preference, and ethanol-induced psychomotor sensitization in mice. Psychopharmacology (Berl) 2012;222:141–153. doi: 10.1007/s00213-011-2630-8. [DOI] [PubMed] [Google Scholar]
- Barak S, Liu F, Ben Hamida S, Yowell QV, Neasta J, Kharazia V, Janak PH, Ron D. Disruption of alcohol-related memories by mTORC1 inhibition prevents relapse. Nat Neurosci. 2013;16:1111–1117. doi: 10.1038/nn.3439. [DOI] [PMC free article] [PubMed] [Google Scholar]
- Beckley JT, Evins CE, Fedarovich H, Gilstrap MJ, Woodward JJ. Medial prefrontal cortex inversely regulates toluene-induced changes in markers of synaptic plasticity of mesolimbic dopamine neurons. J Neurosci. 2013;33:804–813. doi: 10.1523/JNEUROSCI.3729-12.2013. [DOI] [PMC free article] [PubMed] [Google Scholar]
- Ben Hamida S, Neasta J, Lasek AW, Kharazia V, Zou M, Carnicella S, Janak PH, Ron D. The small G protein H-Ras in the mesolimbic system is a molecular gateway to alcohol-seeking and excessive drinking behaviors. J Neurosci. 2012;32:15849–15858. doi: 10.1523/JNEUROSCI.2846-12.2012. [DOI] [PMC free article] [PubMed] [Google Scholar]
- Biever A, Puighermanal E, Nishi A, David A, Panciatici C, Longueville S, Xirodimas D, Gangarossa G, Meyuhas O, Hervé D, Girault JA, Valjent E. PKA-dependent phosphorylation of ribosomal protein S6 does not correlate with translation efficiency in striatonigral and striatopallidal medium-sized spiny neurons. J Neurosci. 2015;35:4113–4130. doi: 10.1523/JNEUROSCI.3288-14.2015. [DOI] [PMC free article] [PubMed] [Google Scholar]
- Britt JP, Benaliouad F, McDevitt RA, Stuber GD, Wise RA, Bonci A. Synaptic and behavioral profile of multiple glutamatergic inputs to the nucleus accumbens. Neuron. 2012;76:790–803. doi: 10.1016/j.neuron.2012.09.040. [DOI] [PMC free article] [PubMed] [Google Scholar]
- Buffington SA, Huang W, Costa-Mattioli M. Translational control in synaptic plasticity and cognitive dysfunction. Annu Rev Neurosci. 2014;37:17–38. doi: 10.1146/annurev-neuro-071013-014100. [DOI] [PMC free article] [PubMed] [Google Scholar]
- Carnicella S, Ron D, Barak S. Intermittent ethanol access schedule in rats as a preclinical model of alcohol abuse. Alcohol. 2014;48:243–252. doi: 10.1016/j.alcohol.2014.01.006. [DOI] [PMC free article] [PubMed] [Google Scholar]
- Castellano E, Downward J. Role of RAS in the regulation of PI 3-kinase. Curr Top Microbiol Immunol. 2010;346:143–169. doi: 10.1007/82_2010_56. [DOI] [PubMed] [Google Scholar]
- Chao SZ, Ariano MA, Peterson DA, Wolf ME. D1 dopamine receptor stimulation increases GluR1 surface expression in nucleus accumbens neurons. J Neurochem. 2002;83:704–712. doi: 10.1046/j.1471-4159.2002.01164.x. [DOI] [PubMed] [Google Scholar]
- Chen BT, Hopf FW, Bonci A. Synaptic plasticity in the mesolimbic system: therapeutic implications for substance abuse. Ann N Y Acad Sci. 2010;1187:129–139. doi: 10.1111/j.1749-6632.2009.05154.x. [DOI] [PMC free article] [PubMed] [Google Scholar]
- Cooper JC, Knutson B. Valence and salience contribute to nucleus accumbens activation. Neuroimage. 2008;39:538–547. doi: 10.1016/j.neuroimage.2007.08.009. [DOI] [PMC free article] [PubMed] [Google Scholar]
- Crabbe JC, Harris RA, Koob GF. Preclinical studies of alcohol binge drinking. Ann N Y Acad Sci. 2011;1216:24–40. doi: 10.1111/j.1749-6632.2010.05895.x. [DOI] [PMC free article] [PubMed] [Google Scholar]
- Cross DA, Alessi DR, Cohen P, Andjelkovich M, Hemmings BA. Inhibition of glycogen synthase kinase-3 by insulin mediated by protein kinase B. Nature. 1995;378:785–789. doi: 10.1038/378785a0. [DOI] [PubMed] [Google Scholar]
- del Prete MJ, Vernal R, Dolznig H, Müllner EW, Garcia-Sanz JA. Isolation of polysome-bound mRNA from solid tissues amenable for RT-PCR and profiling experiments. RNA. 2007;13:414–421. doi: 10.1261/rna.79407. [DOI] [PMC free article] [PubMed] [Google Scholar]
- Di Chiara G, Imperato A. Drugs abused by humans preferentially increase synaptic dopamine concentrations in the mesolimbic system of freely moving rats. Proc Natl Acad Sci U S A. 1988;85:5274–5278. doi: 10.1073/pnas.85.14.5274. [DOI] [PMC free article] [PubMed] [Google Scholar]
- El-Ghundi M, George SR, Drago J, Fletcher PJ, Fan T, Nguyen T, Liu C, Sibley DR, Westphal H, O'Dowd BF. Disruption of dopamine D1 receptor gene expression attenuates alcohol-seeking behavior. Eur J Pharmacol. 1998;353:149–158. doi: 10.1016/S0014-2999(98)00414-2. [DOI] [PubMed] [Google Scholar]
- Engleman EA, Ding ZM, Oster SM, Toalston JE, Bell RL, Murphy JM, McBride WJ, Rodd ZA. Ethanol is self-administered into the nucleus accumbens shell, but not the core: evidence of genetic sensitivity. Alcohol Clin Exp Res. 2009;33:2162–2171. doi: 10.1111/j.1530-0277.2009.01055.x. [DOI] [PMC free article] [PubMed] [Google Scholar]
- Esteban JA, Shi SH, Wilson C, Nuriya M, Huganir RL, Malinow R. PKA phosphorylation of AMPA receptor subunits controls synaptic trafficking underlying plasticity. Nat Neurosci. 2003;6:136–143. doi: 10.1038/nn997. [DOI] [PubMed] [Google Scholar]
- Gangarossa G, Ceolin L, Paucard A, Lerner-Natoli M, Perroy J, Fagni L, Valjent E. Repeated stimulation of dopamine D1-like receptor and hyperactivation of mTOR signaling lead to generalized seizures, altered dentate gyrus plasticity, and memory deficits. Hippocampus. 2014;24:1466–1481. doi: 10.1002/hipo.22327. [DOI] [PubMed] [Google Scholar]
- Gerfen CR, Surmeier DJ. Modulation of striatal projection systems by dopamine. Annu Rev Neurosci. 2011;34:441–466. doi: 10.1146/annurev-neuro-061010-113641. [DOI] [PMC free article] [PubMed] [Google Scholar]
- Goto Y, Grace AA. Dopaminergic modulation of limbic and cortical drive of nucleus accumbens in goal-directed behavior. Nat Neurosci. 2005;8:805–812. doi: 10.1038/nn1471. [DOI] [PubMed] [Google Scholar]
- Griebel G, Belzung C, Misslin R, Vogel E. The free-exploratory paradigm: an effective method for measuring neophobic behavior in mice and testing potential neophobia-reducing drugs. Behav Pharmacol. 1993;4:637–644. [PubMed] [Google Scholar]
- Hodge CW, Samson HH, Chappelle AM. Alcohol self-administration: further examination of the role of dopamine receptors in the nucleus accumbens. Alcohol Clin Exp Res. 1997;21:1083–1091. doi: 10.1111/j.1530-0277.1997.tb04257.x. [DOI] [PMC free article] [PubMed] [Google Scholar]
- Hoeffer CA, Klann E. mTOR signaling: at the crossroads of plasticity, memory and disease. Trends Neurosci. 2010;33:67–75. doi: 10.1016/j.tins.2009.11.003. [DOI] [PMC free article] [PubMed] [Google Scholar]
- Hwa LS, Chu A, Levinson SA, Kayyali TM, DeBold JF, Miczek KA. Persistent escalation of alcohol drinking in C57BL/6J mice with intermittent access to 20% ethanol. Alcohol Clin Exp Res. 2011;35:1938–1947. doi: 10.1111/j.1530-0277.2011.01545.x. [DOI] [PMC free article] [PubMed] [Google Scholar]
- Isaac JT, Ashby MC, McBain CJ. The role of the GluR2 subunit in AMPA receptor function and synaptic plasticity. Neuron. 2007;54:859–871. doi: 10.1016/j.neuron.2007.06.001. [DOI] [PubMed] [Google Scholar]
- James MH, Quinn RK, Ong LK, Levi EM, Charnley JL, Smith DW, Dickson PW, Dayas CV. mTORC1 inhibition in the nucleus accumbens “protects” against the expression of drug seeking and “relapse” and is associated with reductions in GluA1 AMPAR and CAMKIIα levels. Neuropsychopharmacology. 2014;39:1694–1702. doi: 10.1038/npp.2014.16. [DOI] [PMC free article] [PubMed] [Google Scholar]
- Lee CC, Huang CC, Wu MY, Hsu KS. Insulin stimulates postsynaptic density-95 protein translation via the phosphoinositide 3-kinase-Akt-mammalian target of rapamycin signaling pathway. J Biol Chem. 2005;280:18543–18550. doi: 10.1074/jbc.M414112200. [DOI] [PubMed] [Google Scholar]
- Lein ES, Hawrylycz MJ, Ao N, Ayres M, Bensinger A, Bernard A, Boe AF, Boguski MS, Brockway KS, Byrnes EJ, Chen L, Chen L, Chen TM, Chin MC, Chong J, Crook BE, Czaplinska A, Dang CN, Datta S, Dee NR, et al. Genome-wide atlas of gene expression in the adult mouse brain. Nature. 2007;445:168–176. doi: 10.1038/nature05453. [DOI] [PubMed] [Google Scholar]
- Lipton JO, Sahin M. The neurology of mTOR. Neuron. 2014;84:275–291. doi: 10.1016/j.neuron.2014.09.034. [DOI] [PMC free article] [PubMed] [Google Scholar]
- Liu-Yesucevitz L, Bassell GJ, Gitler AD, Hart AC, Klann E, Richter JD, Warren ST, Wolozin B. Local RNA translation at the synapse and in disease. J Neurosci. 2011;31:16086–16093. doi: 10.1523/JNEUROSCI.4105-11.2011. [DOI] [PMC free article] [PubMed] [Google Scholar]
- Lu XY, Ghasemzadeh MB, Kalivas PW. Expression of D1 receptor, D2 receptor, substance P and enkephalin messenger RNAs in the neurons projecting from the nucleus accumbens. Neuroscience. 1998;82:767–780. doi: 10.1016/S0306-4522(97)00327-8. [DOI] [PubMed] [Google Scholar]
- Ma XM, Blenis J. Molecular mechanisms of mTOR-mediated translational control. Nat Rev Mol Cell Biol. 2009;10:307–318. doi: 10.1038/nrm2672. [DOI] [PubMed] [Google Scholar]
- Madisen L, Zwingman TA, Sunkin SM, Oh SW, Zariwala HA, Gu H, Ng LL, Palmiter RD, Hawrylycz MJ, Jones AR, Lein ES, Zeng H. A robust and high-throughput Cre reporting and characterization system for the whole mouse brain. Nat Neurosci. 2010;13:133–140. doi: 10.1038/nn.2467. [DOI] [PMC free article] [PubMed] [Google Scholar]
- Mendoza MC, Er EE, Blenis J. The Ras-ERK and PI3K-mTOR pathways: cross-talk and compensation. Trends Biochem Sci. 2011;36:320–328. doi: 10.1016/j.tibs.2011.03.006. [DOI] [PMC free article] [PubMed] [Google Scholar]
- Morean ME, Kong G, Camenga DR, Cavallo DA, Connell C, Krishnan-Sarin S. First drink to first drunk: age of onset and delay to intoxication are associated with adolescent alcohol use and binge drinking. Alcohol Clin Exp Res. 2014;38:2615–2621. doi: 10.1111/acer.12526. [DOI] [PMC free article] [PubMed] [Google Scholar]
- Moy SS, Nadler JJ, Young NB, Nonneman RJ, Segall SK, Andrade GM, Crawley JN, Magnuson TR. Social approach and repetitive behavior in eleven inbred mouse strains. Behav Brain Res. 2008;191:118–129. doi: 10.1016/j.bbr.2008.03.015. [DOI] [PMC free article] [PubMed] [Google Scholar]
- Neasta J, Ben Hamida S, Yowell Q, Carnicella S, Ron D. Role for mammalian target of rapamycin complex 1 signaling in neuroadaptations underlying alcohol-related disorders. Proc Natl Acad Sci U S A. 2010;107:20093–20098. doi: 10.1073/pnas.1005554107. [DOI] [PMC free article] [PubMed] [Google Scholar]
- Neasta J, Ben Hamida S, Yowell QV, Carnicella S, Ron D. AKT signaling pathway in the nucleus accumbens mediates excessive alcohol drinking behaviors. Biol Psychiatry. 2011;70:575–582. doi: 10.1016/j.biopsych.2011.03.019. [DOI] [PMC free article] [PubMed] [Google Scholar]
- Neasta J, Kiely PA, He DY, Adams DR, O'Connor R, Ron D. Direct interaction between scaffolding proteins RACK1 and 14-3-3ζ regulates brain-derived neurotrophic factor (BDNF) transcription. J Biol Chem. 2012;287:322–336. doi: 10.1074/jbc.M111.272195. [DOI] [PMC free article] [PubMed] [Google Scholar]
- Neasta J, Barak S, Ben Hamida SB, Ron D. mTOR complex 1: A key player in neuroadaptations induced by drugs of abuse. J Neurochem. 2014;130:172–184. doi: 10.1111/jnc.12725. [DOI] [PMC free article] [PubMed] [Google Scholar]
- Neve KA, Seamans JK, Trantham-Davidson H. Dopamine receptor signaling. J Recept Signal Transduct Res. 2004;24:165–205. doi: 10.1081/RRS-200029981. [DOI] [PubMed] [Google Scholar]
- Okamoto T, Harnett MT, Morikawa H. Hyperpolarization-activated cation current (Ih) is an ethanol target in midbrain dopamine neurons of mice. J Neurophysiol. 2006;95:619–626. doi: 10.1152/jn.00682.2005. [DOI] [PMC free article] [PubMed] [Google Scholar]
- Pascoli V, Terrier J, Espallergues J, Valjent E, O'Connor EC, Lüscher C. Contrasting forms of cocaine-evoked plasticity control components of relapse. Nature. 2014;509:459–464. doi: 10.1038/nature13257. [DOI] [PubMed] [Google Scholar]
- Pisanu A, Lecca D, Valentini V, Bahi A, Dreyer JL, Cacciapaglia F, Scifo A, Piras G, Cadoni C, Di Chiara G. Impairment of acquisition of intravenous cocaine self-administration by RNA-interference of dopamine D1-receptors in the nucleus accumbens shell. Neuropharmacology. 2015;89:398–411. doi: 10.1016/j.neuropharm.2014.10.018. [DOI] [PubMed] [Google Scholar]
- Price KL, Middaugh LD. The dopamine D1 antagonist reduces ethanol reward for C57BL/6 mice. Alcohol Clin Exp Res. 2004;28:1666–1675. doi: 10.1097/01.ALC.0000145783.39748.E6. [DOI] [PubMed] [Google Scholar]
- Puighermanal E, Busquets-Garcia A, Gomis-González M, Marsicano G, Maldonado R, Ozaita A. Dissociation of the pharmacological effects of THC by mTOR blockade. Neuropsychopharmacology. 2013;38:1334–1343. doi: 10.1038/npp.2013.31. [DOI] [PMC free article] [PubMed] [Google Scholar]
- Rozen S, Skaletsky H. Primer3 on the WWW for general users and for biologist programmers. Methods Mol Biol. 2000;132:365–386. doi: 10.1385/1-59259-192-2:365. [DOI] [PubMed] [Google Scholar]
- Ruvinsky I, Meyuhas O. Ribosomal protein S6 phosphorylation: from protein synthesis to cell size. Trends Biochem Sci. 2006;31:342–348. doi: 10.1016/j.tibs.2006.04.003. [DOI] [PubMed] [Google Scholar]
- Saal D, Dong Y, Bonci A, Malenka RC. Drugs of abuse and stress trigger a common synaptic adaptation in dopamine neurons. Neuron. 2003;37:577–582. doi: 10.1016/S0896-6273(03)00021-7. [DOI] [PubMed] [Google Scholar]
- Santini E, Heiman M, Greengard P, Valjent E, Fisone G. Inhibition of mTOR signaling in Parkinson's disease prevents L-DOPA-induced dyskinesia. Sci Signal. 2009;2:ra36. doi: 10.1126/scisignal.2000308. [DOI] [PubMed] [Google Scholar]
- Sesack SR, Grace AA. Cortico-basal ganglia reward network: microcircuitry. Neuropsychopharmacology. 2010;35:27–47. doi: 10.1038/npp.2009.93. [DOI] [PMC free article] [PubMed] [Google Scholar]
- Slipczuk L, Bekinschtein P, Katche C, Cammarota M, Izquierdo I, Medina JH. BDNF activates mTOR to regulate GluR1 expression required for memory formation. PLoS One. 2009;4:e6007. doi: 10.1371/journal.pone.0006007. [DOI] [PMC free article] [PubMed] [Google Scholar]
- Smith RJ, Lobo MK, Spencer S, Kalivas PW. Cocaine-induced adaptations in D1 and D2 accumbens projection neurons (a dichotomy not necessarily synonymous with direct and indirect pathways) Curr Opin Neurobiol. 2013;23:546–552. doi: 10.1016/j.conb.2013.01.026. [DOI] [PMC free article] [PubMed] [Google Scholar]
- Snyder GL, Allen PB, Fienberg AA, Valle CG, Huganir RL, Nairn AC, Greengard P. Regulation of phosphorylation of the GluR1 AMPA receptor in the neostriatum by dopamine and psychostimulants in vivo. J Neurosci. 2000;20:4480–4488. doi: 10.1523/JNEUROSCI.20-12-04480.2000. [DOI] [PMC free article] [PubMed] [Google Scholar]
- Substance Abuse and Mental Health Services Administration. Results from the 2013 National Survey on Drug Use and Health: Summary of National Findings, NSDUH series H-48, HHS publication no. (SMA) 14-4863. Rockville, MD: SAMHSA; 2014. [Google Scholar]
- Szumlinski KK, Ary AW, Lominac KD. Homers regulate drug-induced neuroplasticity: implications for addiction. Biochem Pharmacol. 2008;75:112–133. doi: 10.1016/j.bcp.2007.07.031. [DOI] [PMC free article] [PubMed] [Google Scholar]
- Thoreen CC, Chantranupong L, Keys HR, Wang T, Gray NS, Sabatini DM. A unifying model for mTORC1-mediated regulation of mRNA translation. Nature. 2012;485:109–113. doi: 10.1038/nature11083. [DOI] [PMC free article] [PubMed] [Google Scholar]
- Tu JC, Xiao B, Yuan JP, Lanahan AA, Leoffert K, Li M, Linden DJ, Worley PF. Homer binds a novel proline-rich motif and links group 1 metabotropic glutamate receptors with IP3 receptors. Neuron. 1998;21:717–726. doi: 10.1016/S0896-6273(00)80589-9. [DOI] [PubMed] [Google Scholar]
- Vengeliene V, Bilbao A, Molander A, Spanagel R. Neuropharmacology of alcohol addiction. Br J Pharmacol. 2008;154:299–315. doi: 10.1038/bjp.2008.30. [DOI] [PMC free article] [PubMed] [Google Scholar]
- Wang J, Ben Hamida S, Darcq E, Zhu W, Gibb SL, Lanfranco MF, Carnicella S, Ron D. Ethanol-mediated facilitation of AMPA receptor function in the dorsomedial striatum: implications for alcohol drinking behavior. J Neurosci. 2012;32:15124–15132. doi: 10.1523/JNEUROSCI.2783-12.2012. [DOI] [PMC free article] [PubMed] [Google Scholar]
- Wang J, Cheng Y, Wang X, Roltsch Hellard E, Ma T, Gil H, Ben Hamida S, Ron D. Alcohol elicits functional and structural plasticity selectively in dopamine D1 receptor-expressing neurons of the dorsomedial striatum. J Neurosci. 2015;35:11634–11643. doi: 10.1523/JNEUROSCI.0003-15.2015. [DOI] [PMC free article] [PubMed] [Google Scholar]
- Wang X, Luo YX, He YY, Li FQ, Shi H, Xue LF, Xue YX, Lu L. Nucleus accumbens core mammalian target of rapamycin signaling pathway is critical for cue-induced reinstatement of cocaine seeking in rats. J Neurosci. 2010;30:12632–12641. doi: 10.1523/JNEUROSCI.1264-10.2010. [DOI] [PMC free article] [PubMed] [Google Scholar]
- Warnault V, Darcq E, Levine A, Barak S, Ron D. Chromatin remodeling: a novel strategy to control excessive alcohol drinking. Transl Psychiatry. 2013;3:e231. doi: 10.1038/tp.2013.4. [DOI] [PMC free article] [PubMed] [Google Scholar]
- Warner LA, White HR, Johnson V. Alcohol initiation experiences and family history of alcoholism as predictors of problem-drinking trajectories. J Stud Alcohol Drugs. 2007;68:56–65. doi: 10.15288/jsad.2007.68.56. [DOI] [PubMed] [Google Scholar]
- Weiss F, Lorang MT, Bloom FE, Koob GF. Oral alcohol self-administration stimulates dopamine release in the rat nucleus accumbens: genetic and motivational determinants. J Pharmacol Exp Ther. 1993;267:250–258. [PubMed] [Google Scholar]
- Wu J, McCallum SE, Glick SD, Huang Y. Inhibition of the mammalian target of rapamycin pathway by rapamycin blocks cocaine-induced locomotor sensitization. Neuroscience. 2011;172:104–109. doi: 10.1016/j.neuroscience.2010.10.041. [DOI] [PMC free article] [PubMed] [Google Scholar]
- Yagishita S, Hayashi-Takagi A, Ellis-Davies GC, Urakubo H, Ishii S, Kasai H. A critical time window for dopamine actions on the structural plasticity of dendritic spines. Science. 2014;345:1616–1620. doi: 10.1126/science.1255514. [DOI] [PMC free article] [PubMed] [Google Scholar]
- Young EA, Dreumont SE, Cunningham CL. Role of nucleus accumbens dopamine receptor subtypes in the learning and expression of alcohol-seeking behavior. Neurobiol Learn Mem. 2014;108:28–37. doi: 10.1016/j.nlm.2013.05.004. [DOI] [PMC free article] [PubMed] [Google Scholar]
- Zapata A, Gonzales RA, Shippenberg TS. Repeated ethanol intoxication induces behavioral sensitization in the absence of a sensitized accumbens dopamine response in C57BL/6J and DBA/2J mice. Neuropsychopharmacology. 2006;31:396–405. doi: 10.1038/sj.npp.1300833. [DOI] [PMC free article] [PubMed] [Google Scholar]