

Abstract
Delayed diagnosis of ovarian cancer (OC) is usually a cause of its high mortality. OC counts for one of the most aggressive gynecological malignancies. Noninvasive biomarkers may be used to help with diagnostic and treatment decisions in OC management. The incidence and clinical significance of occult OC cells (circulating tumor cells-CTCs) in the peripheral blood of patients with newly diagnosed or nondiagnosed OC at the time of surgical intervention were examined in our study. The objective of the study was to isolate and cultivate CTCs in OC patients (mainly stage IIIB-C) by a recently introduced size-based separation method (MetaCell®). CTCs were successfully isolated in patients with OC capturing cells with proliferation potential. The cells were enriched in good fitness, which enabled the short term in vitro culture of the CTCs. The CTCs may be used for further downstream applications (e.g. gene expression analysis) even if in the majority of the in vitro CTC cultures no confluence was reached. The CTCs were detected in 77 out of 118 patients (65.2%). CTC positivity was given to the relationship with different disease stage parameters with special focus on CA125 marker levels. The results show that the information on CTC presence may provide new and independent prognosis staging information to the patient description. Several interesting relationships of CA125, age and ascites presence are reported. As shown in our patient sample, patients with ascites tend to have higher CA125 levels, even if the CTCs were not found in the peripheral blood. It suggests that hematogenous dissemination is fully represented by the CTCs while lymphogenic dissemination is represented by elevated CA125. In this context, easy access to CTCs provided by the method applied in our study, both at the time of diagnosis and relapse, may become an increasingly valuable tool in future. This methodology may provide an opportunity for more personalized medicine where treatment for OC may be guided by information from an individual’s CTC molecular profile.
Keywords: CTCs, circulating tumor cells, ovarian cancer, cultivation, in vitro, gene expression, CA125
Introduction
Ovarian cancer (OC) is the second most common malignancy of the female reproductive system in Western civilized countries [1]. Delayed diagnosis of (OC) is usually a cause of its high mortality. OC counts for one of the most aggressive gynecological malignancies. Only 25% of OC are diagnosed while the malignancy is still confined to the ovary, and the cure rate in these patients can reach 90%. If the disease spread already by the time of diagnosis, the probability of cure is really low [2]. For that reason, noninvasive biomarkers may be used to help with diagnostic and treatment decisions to ensure optimal patient management in OC.
Circulating tumor cells (CTCs) have demonstrated predictive and prognostic value in patients with metastatic breast, prostate, and colorectal cancers [3-5]. Results from prospective trials in each of these cancer modalities showed that patients with elevated CTCs at any time during the course of the treatment had a significantly shorter progression free survival (PFS) and overall survival (OS) than patients without CTCs in their peripheral blood [6-9]. Several studies have been conducted so far to assess CTCs in a similar context in OC. The results are summarized in Romero-Laorden review and suggest that CTCs and DTCs are associated with poor clinical outcomes in OC [10]. To implement CTCs examination as a prognostic tool in the clinical setting further multi-center clinical studies need to be conducted and at least two CTC-isolation methods need to be compared side by side to confirm their CTCs capture efficiency. Our study examined CTCs incidence and their association with clinicopathological characteristics of OC in patients with newly diagnosed or previously non-diagnosed OC at the time of surgical intervention. The objective of this study was to isolate and cultivate CTCs in OC patients by a recently introduced size-based separation method. The presence of CTCs was further evaluated in relation to CA125 values, the presence of ascites, age and other factors.
The focus was on the relation between CTCs and CA125. CA125 is the gold standard tumor marker in OC. Serum level of CA125 is used to monitor response to chemotherapy, relapse, and disease progression in OC patients. Given this, it seems reasonable to examine if CA125 may be used as a prognostic indicator in correlation to CTCs. CA125 level less than 35 U/mL is now considered normal [11,12]. When stratified by disease stage, elevated levels were found in more than 90% of patients with advanced stage ovarian cancer but in only 50% of patients with stage I disease [15-17]. Most reports indicate that a rise in CA125 level precedes clinical detection by about 3 months [18]. Despite the limitations in the interpretation of a solitary CA125 value, this biomarker is widely used to prospectively evaluate therapeutic efficacy and monitor disease status among ovarian cancer patients [19,20].
CA125 antigen is a serum marker which has been sufficiently well validated to be of use in routine clinical care [14]. We expect that based on further clinical studies, CTCs may become as important as CA125 in OC diagnosis and treatment? We hypothesized that CTCs and CA125 are independent factors in OC patients, adding new information values to OC staging. If this hypothesis is confirmed, CTCs may become a standard in OC management algorithm.
Materials and methods
Patients: To date 118 patients with diagnosed OC have been enrolled in the study in accordance with the Declaration of Helsinki. All patients were candidates for surgery or surgical diagnostics. Based on informed consent, clinical data were collected from all participating patients. The patient stage characteristics are shown in Table 1 and Figure 1. For each patient, approximately 8 mL of venous blood was drawn from the antecubital veins and placed into S-Monovette tubes (Sarstedt AG & Co., Numbrecht, Germany) containing 1.6 mg EDTA/mL blood as an anticoagulant. The samples were processed at room temperature using an isolation procedure completed within 24 hours after the blood draw.
Table 1.
Patient characteristics and CTC testing results
| Patient characteristics | Total patients (N) | CTC positive (N) | % |
|---|---|---|---|
| 118 | 77 | 59 | |
| FIGO stage | |||
| IA | 5 | 4 | 80 |
| IC | 14 | 5 | 35.7 |
| IIA | 1 | 1 | 100 |
| IIB | 2 | 0 | 0 |
| IIC | 4 | 3 | 75 |
| IIIA | 3 | 1 | 33 |
| IIIB | 12 | 8 | 66.7 |
| IIIC | 69 | 44 | 63.8 |
| IV | 8 | 7 | 87.5 |
| Grading | |||
| 1 | 1 | 0 | 0 |
| 2 | 19 | 10 | 53 |
| 3 | 52 | 35 | 67 |
| NA | 46 | 28 | 60.9 |
| Histology | |||
| Serous | 81 | 55 | 62.4 |
| Serous/borderline | 4 | 1 | 25 |
| Non serous (e.g. mucinous) | 6 | 6 | 100 |
| Clear cell type | 3 | 1 | 33.3 |
| Endometrioid | 1 | 0 | 0 |
| Undifferentiated | 2 | 2 | 50 |
| NA | 21 | 9 |
Figure 1.
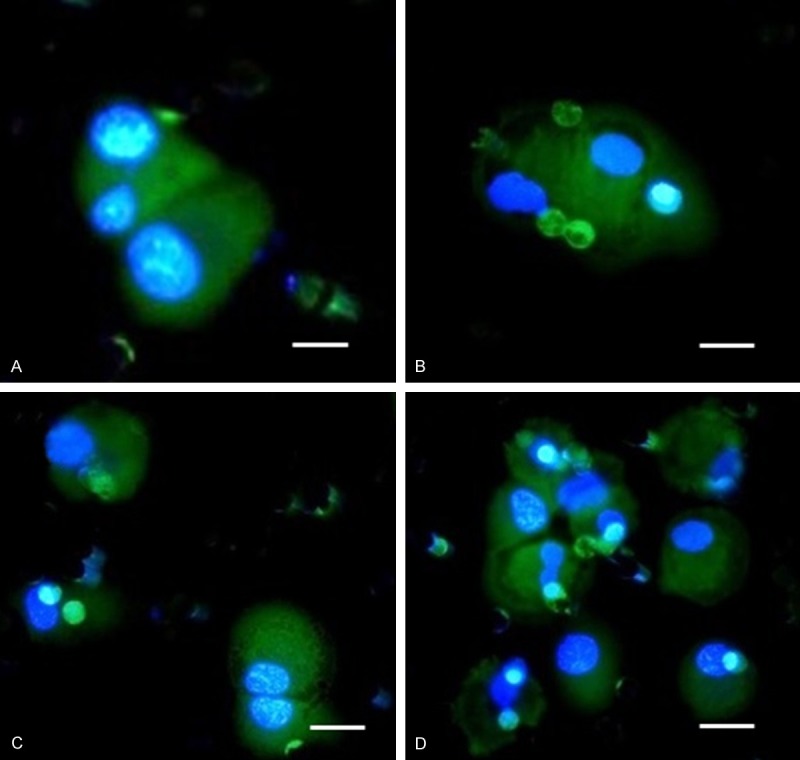
A-D. CTCs captured and cultured on the membrane filter stained by unspecific vital fluorescent nuclear (NucBlueTM) and cytomplastic (CelltrackerTM) stain. The bar represents 10 μm.
CTCs enrichment and culture: A new size-based separation method for viable CTC enrichment from peripheral blood has recently been introduced (MetaCell®, MetaCell s.r.o., Ostrava, Czech Republic) [20,21]. The size-based enrichment process is based on the filtration of peripheral blood through a porous polycarbonate membrane (with pores of 8 μm diameter). The minimum and maximum volume of the filtered peripheral blood may be adjusted up to 50 mL of fluid. The standard 8 mL peripheral blood sample from patients suffering from OC was transferred into the filtration tube. Gradual transfer of the blood in several steps is preferred to prevent blood clotting on the membrane filter. The peripheral blood flow is supported by capillary action of the absorbent touching the membrane filter. The filtered CTCs were observed immediately after filtration on the membrane. The control of CTCs presence immediately after isolation eliminates false negative results of the examination. The membrane filter is kept in a plastic ring that is transferred into the 6-well cultivation plate, 4 mL RPMI media is added to the filter top and CTCs are cultured on the membrane in vitro under standard cell-culture conditions (37°C, 5% atmospheric CO2) and observed by inverted microscope (Figure 3). The CTCs were grown in FBS-enriched RPMI medium (10%) for a minimum of 3-14 days on the membrane. The cultured cells were analyzed by means of vital fluorescent microscopy using unspecific nuclear (NucBlueTM) and cytoplasmatic (CelltrackerTM) stain and by histochemistry (May-Grunwald staining).
Figure 3.
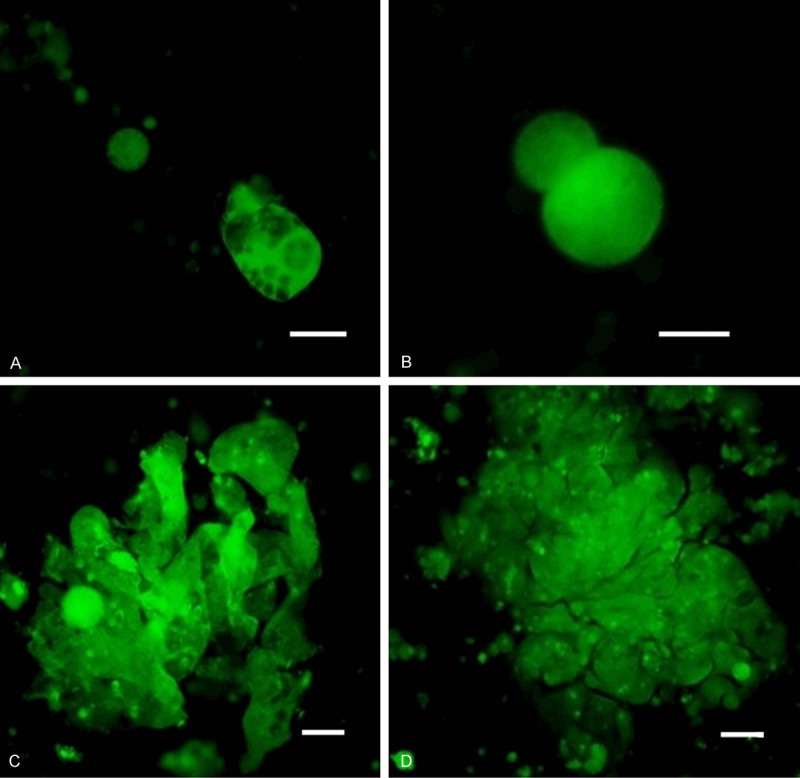
DTCs captured on the separating membrane shown immediately after enrichment (A, B) and after 6 days in vitro culture where cells already show differentiation towards epithelial character (C, D). Cells are visualized by CelltrackerTM. The bar represents 20 μm.
Alternatively the enriched CTCs fraction can be transferred from the membrane and cultured directly on any plastic surface or a microscopic slide. Microscopic slide culture is preferred if immunohistochemistry/immunofluorescence analysis is planned. If an intermediate CTCs-analysis is awaited, the CTCs-fraction is transferred in PBS (1.5 mL) to a cytospin slide. The slide is then dried for 24 hours and analyzed immunohistochemically.
Cytomorphological analysis
The stained cells on the membrane (vital or fixed) were examined using light and fluorescence microscopy in two steps: (i) screening at ×20 magnification to locate the cells; (ii) observation at ×40 magnification for detailed cytomorphological analysis. Isolated cells and/or clusters of cells of interest (immunostained or not) were selected, digitized, and the images were then examined by an experienced researcher and/or pathologist. CTCs were defined as cells with the following characteristics: (i) with a nuclear size ≥10 μm); (ii) irregular nuclear contour; (iii) visible cytoplasm; (iv) prominent nucleoli. (v) high nuclear-cytoplasmic ratio, (vi) proliferating, (vii) growing in 3D-layers.
Gene expression analysis (GEA)
To confirm the origin of the cells on the separation membrane, CTC-gene expression analysis can be performed. Gene expression analysis (GEA) allows up to 20 tumor-associated markers in RNA from different cell fractions to be tested within a single quantitative polymerase chain reaction (qPCR) run. Differential diagnostics markers for qPCR test are chosen in concordance with the expected diagnosis.
The key purpose of GEA is to compare gene expression of tumor-associated markers in the CTC-enriched fractions to that in the whole blood.
Soon after, RNA is isolated from the whole blood and CTC-enriched fraction on the membrane. RNA can be isolated from the CTC fraction immediately after separation process (these are the so-called “virgin CTCs”) or/and from the CTC fraction grown on the separation membrane in vitro (the so-called “membrane fraction”). Some of the cells grown on the membrane in vitro may overgrow the membrane and set up a new cell culture on the culture-well bottom. These cells are analyzed as the “bottom fraction”.
Finally, the CTC-gene expression analysis allows identification of the relative amount of tumor-associated markers in the whole blood and in CTC-enriched fractions. If the tumor-associated genes are highly expressed in the CTC fraction, a subsequent analysis of chemoresistance-associated genes is performed. Molecular analysis allows identification of which type of the chemotherapeutic agents may be of use in tumor therapy and assigned as personalized cancer therapy based on CTCs.
The cells captured on the membrane are lysed by RLT-buffer with beta-mercapto-ethanol (Qiagen). RNA is then isolated using the RNeasy Mini Kit (Qiagen). The RNA from the whole blood is isolated with a modified procedure and the quality/concentration of RNA is measured by NanoDrop (ThermoScientific). As there are only a few hundred cells on the membrane, the median concentration of RNA is quite low (5-10 ng/µl). High Capacity cDNA Reverse Transcription Kit (Life Technologies) was used for cDNA production. qPCR analysis was performed using Taqman chemistry with Taqman MGB-probes for all the tested genes (Life Technologies).
Statistical analysis
All analyses were performed using clinicopathological information transformed into variables 0 and 1 if applicable for tested characteristics. The absolute CA125 levels were transformed into the categories normal (0) or elevated (1) to so called relative CA125 value. Chi-squared test, t-tests, cluster analysis, correlation analysis were outperformed using GeneX (MultiD, SE) and GraphPadPrism vs. 5 (Graphpad, US). P-value of lessn than 0.05 was considered as statistically significant.
Results
We report successful CTCs isolation in 77 out of 118 patients with OC (65.2%), capturing cells with proliferation potential in different histology OC subtypes. The cells enriched by size-based filtration remained in good fitness, unaffected by any antibodies or lysing solutions, which enabled theirs in vitro culture. The CTCs were cultured in vitro in short-term cultures (3-5 days) for further downstream applications.
CTCs in OC and their cytomorphological features
The size of the cells guided us in the process of cancer cell identification even without any additional staining (e.g. May-Grϋnwald-MGG). The standard staining method (MGG) has enabled us to analyze the nuclei with nucleoli. Generally the nucleus was bigger than 10 μm itself and the cells did not present much of cytoplasm before in vitro culture. The nuclear-cytoplasmatic ratio is relatively high in cancer cells, but not in the in vitro cultured CTCs. The CTCs get big and elongated during in vitro growth, changing their nuclear-cytoplasmatic ratio. The cytoplasm of CTCs is relatively rigid if compared to the cytoplasm of DTCs (see Figures 1, 2 and 3). The average cell size for the selected patients (n=10) was 23.4 µm (23.4 ± 6.7). Due to the cell size (15 μm), nucleus size (10 μm), shape, and nucleoli visualized by simple MGG-stain in the formerly fixed cells or by simple vital fluorescent staining procedure, CTCs may be identified simply by microscope. Cancer cells (CTCs/DTCs), captured on the separating membrane are shown on the Figures 1, 2 and 3.
Figure 2.
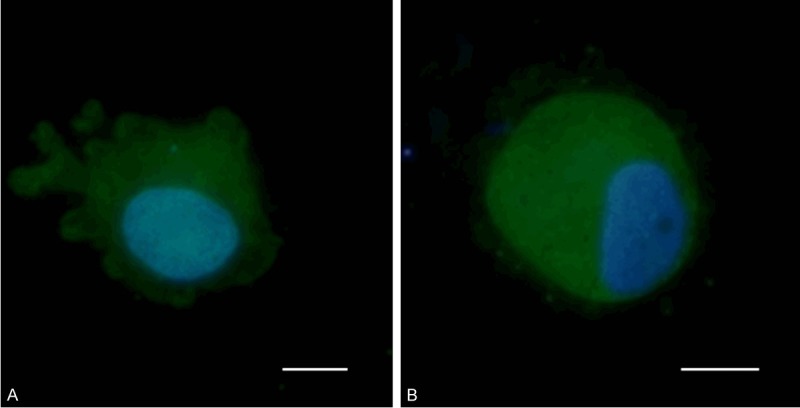
CTC captured and cultured on the membrane filter with visualized nucleus counterstained with vital nuclear (NucBlueTM) and cytoplasmatic (CelltrackerTM) stain. A. CTC isolated from a patient with diagnosed Clear Cell Ovarian Carcinoma. B. CTC isolated from a patient with Serous Ovarian Carcinoma. The bar represents 10 μm.
CTCs and molecular characterization
Gene expression analysis has been provided for some of tested patients (n=20). Preferably samples evaluated by cytomorphology as positive were included into gene expression profiling. CTCs in OC expressed MUC1, EPCAM in more than 90% cases, but MUC16 (reported as CA125) was detected only in 30% of CTCs. Additionally, KRT18 and KRT19 were heavily expressed in CTCs enriched and cultured fractions.
CTCs and clinicopathological criteria
The frequency of CTC positivity is summarized for different patient subgroups in Tables 1 and 2. As next CTC presence is put into correlation with other clinicopathological criteria in Table 3. Interestingly, under all the more serious disease conditions like higher FIGO stages, higher Grade, CTCs can be detected in more than 2/3 of the patients (more than 60% of tested patients are CTC-positive).
Table 2.
Clinicopathological characteristics and CTCs presence
| % | CTCs positive | % | CTCs negative | % | P-Value | ||
|---|---|---|---|---|---|---|---|
| CTC (N) | 118 | ||||||
| CTC positive | 73 | 61.8 | |||||
| CTC negative | 45 | 38.1 | |||||
| CA125 (N) | 85 | ||||||
| CA125 (1) | 58 | 68.2 | 36 | 62.1 | 22 | 37.9 | |
| CA125 (0) | 27 | 31.8 | 14 | 51.9 | 13 | 48.1 | 0.3729 |
| Ascites (N) | 112 | ||||||
| Ascites (1) | 53 | 47.3 | 39 | 73.6 | 14 | 26.4 | |
| Ascites (0) | 59 | 52.7 | 31 | 52.5 | 28 | 47.5 | 0.0216 |
| Peritoneal carcinomatosis (N) | 110 | ||||||
| Peritoneal carcinomatosis (1) | 61 | 55.5 | 43 | 70.5 | 18 | 29.5 | |
| Peritoneal carcinomatosis (0) | 49 | 44.5 | 25 | 51 | 24 | 49 | 0.0367 |
| Lymph node tested (N) | 80 | ||||||
| Lymph node involvement (1) | 23 | 28.7 | 16 | 69.6 | 7 | 30.4 | |
| Lymph node involvement (0) | 57 | 71.3 | 33 | 57.9 | 24 | 42.1 | 0.3322 |
| Residual disease (N) | 100 | ||||||
| Residual disease (1) | 56 | 56 | 42 | 75 | 14 | 25 | |
| Residual disease (0) | 44 | 44 | 24 | 54.5 | 20 | 45.5 | 0.0321 |
| Ascites (1) (N) | 53 | ||||||
| Peritoneal carcinomatosis (1) | 48 | 90.6 | 34 | 70.8 | 14 | 29.2 | |
| Peritoneal carcinomatosis (0) | 5 | 9.4 | 3 | 60 | 2 | 40 | 0.6156 |
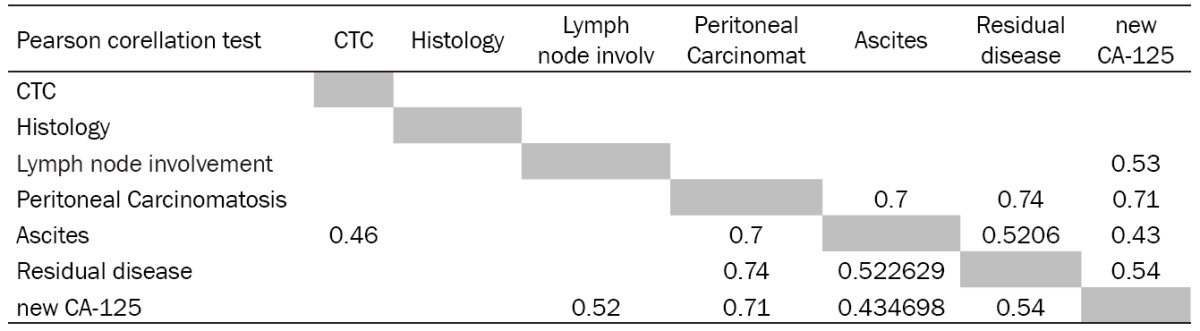
Table 3.
Correlation analysis of CTCs and other clinicopathological characteristics. Pearson correlation coefficients in the table are shown if reaching the level of significance (p< 0.05)
|
As shown in Table 2, CTCs were found in 30% of OC patients diagnosed with lymph node involvement. No significant correlation between CTC and LN-involvement has been reported in our OC group. 73.6% of the patients with ascites were CTC-positive. Up to 70% of OC patients with peritoneal carcinomatosis were CTC-positive. Patients with residual disease after surgery were also CTC-positive in 75%. Ascites was observed in 70% (48 patients) out of group of patient with peritoneal carcinomatosis data. As next, significance has been shown for correlation of CTCs and ascites, CTCs and peritoneal carcinomatosis, CTCs and residual disease.
In the context of CTC and CA125 testing the patients were divided into two subgroups based on the relative CA125 values. Only relative numbers for CA125 were taken into the analysis (elevated CA125=1, normal CA125=0). The results report that CTCs and CA125 behave like two independent biomarkers in the presented study. The independence has been confirmed by Chi-square test and correlation analysis (Pearson correlation coefficient) (Table 3). Pearson correlation coefficients for CTCs and other clinicopathological characteristics are shown only if reaching the level of significance (P<0.05). Another result of interest shown in the Table 3 is the correlation of peritoneal carcinomatosis and residual disease with elevated CA125 values.
Additionally, cluster analysis of the tested clinicopathological parameters has been provided to demonstrate how different the group of OC patient undergoing surgery may be. Clearly there are 4 main clusters of the OC patients (see Figure 4A). There is a relatively big subgroup exhibiting no prognostically negative clinicopathological characteristic except of CTC-presence (3rd cluster from the left). Similarly, there is a cluster defined by peritoneal disease only (1st cluster from the left).
Figure 4.

Cluster analysis of the clinicopathological criteria of OC-patients involved into this type f analysis. A. Cluster analysis without CA125 as variable. B. Cluster analysis including CA125 (elevation of CA125 is reported in relative numbers 1 (elevated) and 0 (normal)).
If as next variable CA125 (new CA125=relative CA125 value) is added to the cluster analysis, the subgroup of patients can be divided clearly into 2 distinct subclusters (Figure 4B). The first one is represented by elevated CA125 values, the second one is represented only by CTC presence. These facts may be used for better clinicopathological characterization of the OC patients, dividing them into the subgroups with hematogenous spread only and peritoneal spread only.
The presented data could support the hypothesis that the elevated CA125 levels are indicators of peritoneal OC spread in general. On the other site, CTC-presence is representing another type of metastatic spread-a hematogenous. As independence of CTC and CA125 has been shown (additionally on Figures 5, 6 and 7), we may conclude that the both CTCs and CA125 tests may have its own role in the OC disease management.
Figure 5.

Means of absolute CA125 values (U/ml) are shown for different clinicopathological groups on the graph. The data show that the CA125 elevated levels are correlated to more serious disease characteristics (lymph node involvement, peritoneal carcinomatosis, ascites presence, residual disease presence), but not exclusively to the CTC-positivity. As shown CTC and CA125 are independent biomarkers in our group of OC patients.
Figure 6.
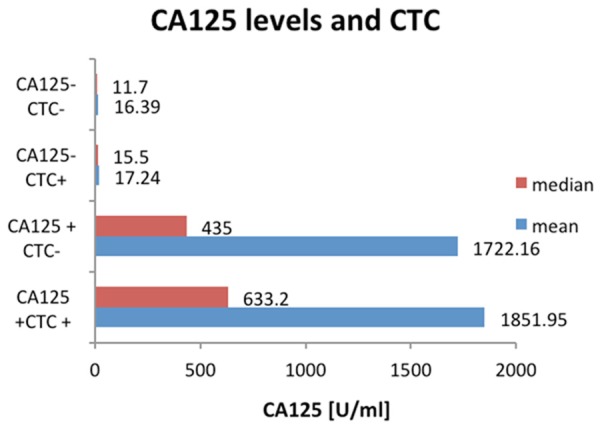
Absolute CA125 values (U/ml) in groups with CTC presence/absence and CA125-specification.
Figure 7.

FIGO stages and absolute CA125 levels (U/ml). The data displayed on the graph show, that absolute CA125 levels do not correlate with FIGO stages. Elevated CA125 levels are typical to the FIGO IIIB stage (a blue column). FIGO IIIB is characterized by microscopic and macroscopic pelvic cancer mass presence. On the other site CA125 (U/ml) levels are associated with ascites presence (P<0.05). Taken together elevated CA125 could characterize peritoneal spread of the OC. CTCs were not seen more frequently at IIIB.
Discussion
The theory of metastatic process is based on the fact that single tumor cells disseminate from the primary tumor either locally, leading to local metastases or through lymphatic vessels to regional lymph nodes or hematogenously to distant organs. Accurate diagnosis of disease stage can greatly influence the treatment modus in OC as well. It was believed that OC metastasizes via a passive mechanism by which ovarian cancer cells are shed from the primary tumor and carried by physiological movement and peritoneal fluid to the peritoneum and omentum. The discovery of hematogenous metastasis of OC via CTCs initiated rethinking of possible clinical implications of these findings for OCmanagement [23].
Patients with cancers that disseminate predominantly through the blood, such as breast, lung and prostate cancers, have substantially higher numbers of detectable CTCs [24]. So, it was surprising that the majority of patients (65.2%) investigated within planned surgical treatment in this study had detectable CTCs in their blood given that OC does not predominantly metastasize through the bloodstream.
Currently, no consensus on clinical utility has been reached for CTCs in OC patients. As reported in a review by Romero, more prospective validation and uniform methodology for CTCs detection is needed [10]. The CTC-examination may offer clinicians a more reliable method to identify disease aggressiveness earlier. The multicenter, randomized, exploratory study reported findings of patients with relapsed/recurrent advanced OC. Patients with baseline ≥2 CTCs had significantly shorter time to disease progression and shorter overall survival time than patients without CTCs in their blood. This was independent of baseline CA125 value, platinum therapy status, tumor cell type and grade, prior taxane treatment, ECOG score, largest size and number of lesions, presence of ascites, race, and age. These data demonstrate that the prognostic value of CTCs is independent of established factors confirming their biological significance [25]. The independence of CTCs information on other clinicopathological characteristics (e.g. lymph node involvement and CA125 values) was shown by our study as well.
Prognostic significance has been confirmed for CTCs in several studies using different CTC-separation techniques [26-28]. Braun et al. observed a decreased overall survival as well as an increased rate of early, distant metastatic disease in patients with OC and DTCs detected in bone marrow biopsy [29].
Taken together CTCs may represent an opportunity to assess cancer spread directly and earlier than recent methods, which classify tumor growths in general. A functional methodology to harvest separated tumor cells from blood may provide researchers with a population of viable and proliferating cells to examine gene expression profiles or gene mutations in cancer.
Differences in isolation techniques and early disease stages make it difficult to report on recommendations resulting from presented OC-CTC studies. Nevertheless, the detection of CTCs is often hampered by the heterogeneity of the primary tumor and by the loss of epithelial antigens as occurs during epithelial to mesenchymal transition [30]. EpCAM (epithelial cell adhesion molecule) is definitely not a perfect marker for CTCs detection due to the high variation in its gene expression between tumor subtypes and its illegitimate transcription from leukocytes [31]. Furthermore cytokeratins, generic markers for epithelial CTCs, are also found on healthy epithelial cells released into circulation as well as on a subpopulation of granulocytes [32,33]. For this reason, testing of other tumor-associated genes has been introduced into the CTCs evaluation process through our study. We were able to identify expression of tumor-associated genes on captured CTCs and confirm cancer origin of the captured cells by gene expression analysis.
As a result, even if the captured enriched CTC-population is contaminated by white blood cells, these can be eliminated by short-term in vitro culture. If still some white blood cells survive the short term in vitro culture, they may be identified by cytomorphological and gene expression analysis. Similarly, higher expression of tumor-associated genes can be detected if more cancerous cells are present in the enriched cell fraction used for testing.
Interestingly, under all the more serious disease conditions like higher FIGO stages, higher Grade, CTCs were detected in more than 2/3 of the patients (more than 60% of tested patients were CTC-positive) in our study.
Our study results suggest that MetaCell® techniques may be used to capture, identify and enumerate CTCs in patients with OC. This may provide useful additional and independent prognostic information independently on standard CA125 biomarker. As concluded from our data elevated CA125 could characterize peritoneal spread of the OC. Then CTCs could be a sign of hematogenous spread solely. From that context there is an extremely interesting group of patients who do not display CA125 elevation and are CTC positive.
The ability to isolate CTCs at an early disease stage and independently from epithelial antigens is an important improvement. The treatment of OC is increasingly likely to evolve into a more individualized approach, based on a better understanding of the molecular composition of each patient’s tumor. In this context, easy access to CTCs, both at the time of diagnosis and relapse, should be an increasingly valuable tool in future years.
Our methodological approach may provide an opportunity for more personalized medicine where treatment for OC may be guided by information from an individual’s CTCs molecular profile.
Acknowledgements
This study was supported by the grant of the Czech Ministry of Health: IGA NT14441-3/2013.
Disclosure of conflict of interest
None.
References
- 1.Jemal A, Siegel R, Ward E, Hao Y, Xu J, Murray T, Thun MJ. Cancer statistics, 2008. CA Cancer J Clin. 2008;58:71–96. doi: 10.3322/CA.2007.0010. [DOI] [PubMed] [Google Scholar]
- 2.Roett MA, Evans P. Ovarian cancer: an overview. Am Fam Physician. 2009;80:609–616. [PubMed] [Google Scholar]
- 3.Allard WJ, Matera J, Miller MC, Repollet M, Connelly MC, Rao C, Tibbe AG, Uhr JW, Terstappen LW. Tumor cells circulate in the peripheral blood of all major carcinomas but not in healthy subjects or patients with nonmalignant diseases. Clin Cancer Res. 2004;10:6897–904. doi: 10.1158/1078-0432.CCR-04-0378. [DOI] [PubMed] [Google Scholar]
- 4.Cristofanilli M, Budd GT, Ellis MJ, Stopeck A, Matera J, Miller MC, Reuben JM, Doyle GV, Allard WJ, Terstappen LW, Hayes DF. Circulating tumor cells, disease progression, and survival in metastatic breast cancer. N Engl J Med. 2004;351:781–91. doi: 10.1056/NEJMoa040766. [DOI] [PubMed] [Google Scholar]
- 5.de Bono JS, Scher HI, Montgomery RB, Parker C, Miller MC, Tissing H, Doyle GV, Terstappen LW, Pienta KJ, Raghavan D. Circulating tumor cells predict survival benefit from treatment in metastatic castration-resistant prostate cancer. Clin Cancer Res. 2008;14:6302–9. doi: 10.1158/1078-0432.CCR-08-0872. [DOI] [PubMed] [Google Scholar]
- 6.Budd GT, Cristofanilli M, Ellis MJ, Stopeck A, Borden E, Miller MC, Matera J, Repollet M, Doyle GV, Terstappen LW, Hayes DF. Circulating tumor cells versus imaging-predicting overall survival in metastatic breast cancer. Clin Cancer Res. 2006;12:6403–9. doi: 10.1158/1078-0432.CCR-05-1769. [DOI] [PubMed] [Google Scholar]
- 7.Danila DC, Heller G, Gignac GA, Gonzalez-Espinoza R, Anand A, Tanaka E, Lilja H, Schwartz L, Larson S, Fleisher M, Scher HI. Circulating tumor cell number and prognosis in progressive castration-resistant prostate cancer. Clin Cancer Res. 2007;13:7053–8. doi: 10.1158/1078-0432.CCR-07-1506. [DOI] [PubMed] [Google Scholar]
- 8.Hayes DF, Cristofanilli M, Budd GT, Ellis MJ, Stopeck A, Miller MC, Matera J, Allard WJ, Doyle GV, Terstappen LW. Circulating tumor cells at each follow-up time point during therapy of metastatic breast cancer patients predict progression-free and overall survival. Clin Cancer Res. 2006;12:4218–24. doi: 10.1158/1078-0432.CCR-05-2821. [DOI] [PubMed] [Google Scholar]
- 9.Shaffer DR, Leversha MA, Danila DC, Lin O, Gonzalez-Espinoza R, Gu B, Anand A, Smith K, Maslak P, Doyle GV, Terstappen LW, Lilja H, Heller G, Fleisher M, Scher HI. Circulating tumor cell analysis in patients with progressive castration-resistant prostate cancer. Clin Cancer Res. 2007;13:2023–9. doi: 10.1158/1078-0432.CCR-06-2701. [DOI] [PubMed] [Google Scholar]
- 10.Romero-Laorden N, Olmos D, Fehm T, Garcia-Donas J, Diaz-Padilla I. Circulating and disseminated tumor cells in ovarian cancer: a systematic review. Gynecol Oncol. 2014;133:632–9. doi: 10.1016/j.ygyno.2014.03.016. [DOI] [PubMed] [Google Scholar]
- 11.Bast RC Jr, Klug TL, St John E, Jenison E, Niloff JM, Lazarus H, Berkowitz RS, Leavitt T, Griffiths CT, Parker L, Zurawski VR Jr, Knapp RC. A radioimmunoassay using a monoclonal antibody to monitor the course of epithelial ovarian cancer. N Engl J Med. 1983;309:883–887. doi: 10.1056/NEJM198310133091503. [DOI] [PubMed] [Google Scholar]
- 12.Kenemans P, van Kamp GJ, Oehr P, Verstraeten RA. Heterologous double-determinant immunoradiometric assay CA 125 II: reliable second-generation immunoassay for determining CA 125 in serum. Clin Chem. 1993;39:2509–2513. [PubMed] [Google Scholar]
- 13.Rustin GJ, Nelstrop AE, Tuxen MK, Lambert HE. Defining progression of ovarian carcinoma during follow-up according to CA 125: a North Thames Ovary Group Study. Ann Oncol. 1996;7:361–364. doi: 10.1093/oxfordjournals.annonc.a010602. [DOI] [PubMed] [Google Scholar]
- 14.Meyer T, Rustin GJ. Role of tumour markers in monitoring epithelial ovarian cancer. Br J Cancer. 2000;82:1535–1538. doi: 10.1054/bjoc.2000.1174. [DOI] [PMC free article] [PubMed] [Google Scholar]
- 15.Gupta D, Lis CG. Role of CA125 in predicting ovarian cancer survival-a review of the epidemiological literature. J Ovarian Res. 2009;2:13. doi: 10.1186/1757-2215-2-13. [DOI] [PMC free article] [PubMed] [Google Scholar]
- 16.Menon U, Jacobs IJ. Ovarian cancer screening in the general population. Curr Opin Obstet Gynecol. 2001;13:61–64. doi: 10.1097/00001703-200102000-00009. [DOI] [PubMed] [Google Scholar]
- 17.Verheijen RH, Mensdorff-Pouilly S, van Kamp GJ, Kenemans P. CA 125: fundamental and clinical aspects. Semin Cancer Biol. 1999;9:117–124. doi: 10.1006/scbi.1998.0114. [DOI] [PubMed] [Google Scholar]
- 18.Skates SJ, Menon U, MacDonald N, Rosenthal AN, Oram DH, Knapp RC, Jacobs IJ. Calculation of the risk of ovarian cancer from serial CA-125 values for preclinical detection in postmenopausal women. J. Clin. Oncol. 2003;21:206s–210s. doi: 10.1200/JCO.2003.02.955. [DOI] [PubMed] [Google Scholar]
- 19.Duffy MJ, Bonfrer JM, Kulpa J, Rustin GJ, Soletormos G, Torre GC, Tuxen MK, Zwirner M. CA125 in ovarian cancer: European Group on Tumor Markers guidelines for clinical use. Int J Gynecol Cancer. 2005;15:679–691. doi: 10.1111/j.1525-1438.2005.00130.x. [DOI] [PubMed] [Google Scholar]
- 20.Rustin GJ, Bast RC Jr, Kelloff GJ, Barrett JC, Carter SK, Nisen PD, Sigman CC, Parkinson DR, Ruddon RW. Use of CA-125 in clinical trial evaluation of new therapeutic drugs for ovarian cancer. Clin Cancer Res. 2004;10:3919–3926. doi: 10.1158/1078-0432.CCR-03-0787. [DOI] [PubMed] [Google Scholar]
- 21.Bobek V, Matkowski R, Gürlich R, Grabowski K, Szelachowska J, Lischke R, Schützner J, Harustiak T, Pazdro A, Rzechonek A, Kolostova K. Cultivation of circulating tumor cells in esophageal cancer. Folia Histochem Cytobiol. 2014;52:171–7. doi: 10.5603/FHC.2014.0020. [DOI] [PubMed] [Google Scholar]
- 22.Cegan M, Kolostova K, Matkowski R, Broul M, Schraml J, Fiutowski M, Bobek V. In vitro culturing of viable circulating tumor cells of urinary bladder cancer. Int J Clin Exp Pathol. 2014;7:7164–71. [PMC free article] [PubMed] [Google Scholar]
- 23.Yeung TL, Leung CS, Yip KP, Au Yeung CL, Wong ST, Mok SC. Cellular and molecular processes in ovarian cancer metastasis. Am J Physiol Cell Physiol. 2015;309:C444–56. doi: 10.1152/ajpcell.00188.2015. [DOI] [PMC free article] [PubMed] [Google Scholar]
- 24.Liberko M, Kolostova K, Bobek V. Essentials of circulating tumor cells for clinical research and practice. Crit Rev Oncol Hematol. 2013;88:338–56. doi: 10.1016/j.critrevonc.2013.05.002. [DOI] [PubMed] [Google Scholar]
- 25.Poveda A, Kaye SB, McCormack R, Wang S, Parekh T, Ricci D, Lebedinsky CA, Tercero JC, Zintl P, Monk BJ. Circulating tumor cells predict progression free survival and overall survival in patients with relapsed/recurrent advanced ovarian cancer. Gynecol Oncol. 2011;122:567–72. doi: 10.1016/j.ygyno.2011.05.028. [DOI] [PubMed] [Google Scholar]
- 26.Fan T, Zhao Q, Chen JJ, Chen WT, Pearl ML. Clinical significance of circulating tumor cells detected by an invasion assay in peripheral blood of patients with ovarian cancer. Gynecol Oncol. 2009;112:185–91. doi: 10.1016/j.ygyno.2008.09.021. [DOI] [PMC free article] [PubMed] [Google Scholar]
- 27.udson PL, Geller MA, Bliss RL, Boente MP, Downs LS Jr, Argenta PA, Carson LF. Preoperative detection of peripherally circulating cancer cells and its prognostic significance in ovarian cancer. Gynecol Oncol. 2003;91:389–94. doi: 10.1016/j.ygyno.2003.08.004. [DOI] [PubMed] [Google Scholar]
- 28.Marth C, Kisic J, Kaern J, Tropé C, Fodstad Ø. Circulating tumor cells in the peripheral blood and bone marrow of patients with ovarian carcinoma do not predict prognosis. Cancer. 2002;94:707–12. doi: 10.1002/cncr.10250. [DOI] [PubMed] [Google Scholar]
- 29.Braun S, Schindlbeck C, Hepp F, Janni W, Kentenich C, Riethmuller G, Pantel K. Occult tumor cells in bone marrow of patients with locoregionally restricted ovarian cancer predict early distant metastatic relapse. J. Clin. Oncol. 2001;19:368–75. doi: 10.1200/JCO.2001.19.2.368. [DOI] [PubMed] [Google Scholar]
- 30.Paterlini-Brechot P, Benali NL. Circulating tumor cells (CTC) detection: clinical impact and future directions. Cancer Lett. 2007;253:180–204. doi: 10.1016/j.canlet.2006.12.014. [DOI] [PubMed] [Google Scholar]
- 31.Zhong XY, Kaul S, Eichler A, Bastert G. Evaluating GA733-2 mRNA as a marker for the detection of micrometastatic breast cancer in peripheral blood and bone marrow. Arch Gynecol Obstet. 1999;263:2–6. doi: 10.1007/s004040050251. [DOI] [PubMed] [Google Scholar]
- 32.Lambrechts AC, van’t Veer LJ, Rodenhuis S. The detection of minimal numbers of contaminating epithelial tumor cells in blood or bone marrow: use, limitations and future of RNAbased methods. Ann Oncol. 1998;9:1269–76. doi: 10.1023/a:1008445604263. [DOI] [PubMed] [Google Scholar]
- 33.Kruger WH, Jung R, Detlefsen B, Mumme S, Badbaran A, Brandner J, Renges H, Kroger N, Zander AR. Interference of cytokeratin-20 and mammaglobin-reverse-transcriptase polymerase chain assays designed for the detection of disseminated cancer cells. Med Oncol. 2001;18:33–8. doi: 10.1385/MO:18:1:33. [DOI] [PubMed] [Google Scholar]