

Summary
Activation of the μ-opioid receptor (μOR) is responsible for the efficacy of the most effective analgesics. To understand the structural basis for μOR activation, we obtained a 2.1 Å X-ray crystal structure of the μOR bound to the morphinan agonist BU72 and stabilized by a G protein-mimetic camelid-antibody fragment. The BU72-stabilized changes in the μOR binding pocket are subtle and differ from those observed for agonist-bound structures of the β2 adrenergic receptor (β2AR) and the M2 muscarinic receptor (M2R). Comparison with active β2AR reveals a common rearrangement in the packing of three conserved amino acids in the core of the μOR, and molecular dynamics simulations illustrate how the ligand-binding pocket is conformationally linked to this conserved triad. Additionally, an extensive polar network between the ligand-binding pocket and the cytoplasmic domains appears to play a similar role in signal propagation for all three GPCRs.
Introduction
The most powerful analgesic and addictive properties of opiate alkaloids are mediated by the μOR1. As the receptor primarily responsible for the effects of opium, the μOR is one of the oldest drug targets within the pharmacopeia2. Opioid receptors are highly versatile signaling molecules. Activation of the μOR results in signaling through the heterotrimeric G protein Gi, resulting in analgesia and sedation as well as euphoria and physical dependence3. The μOR can also signal through arrestin, and this pathway has been attributed to adverse effects of opioid analgesics including tolerance, respiratory suppression, and constipation4-6.
The μOR has been the subject of intense focus for drug-discovery efforts over the past century, with the identification of numerous ligands of varying efficacy. These drugs occupy a wide chemical spectrum, from small organic molecules to a variety of endogenous and synthetic peptides7. Structure-activity studies have revealed that subtle changes in ligand structure can convert an agonist into an antagonist7. These studies have yielded a general hypothesis for the information encoded within GPCR ligands where distinct pharmacophores within a drug are responsible for efficacy (message) or selectivity (address)8 (Fig. 1a). For the morphinan ligands, our previous structural examination of the inactive states of the μOR and the δOR revealed molecular insights into ligand selectivity9,10. To understand the structural basis for μOR activation, we obtained a structure of this receptor in the active state using a combination of a high-affinity agonist and a G protein-mimetic camelid antibody fragment. A comparison of this structure with the inactive-state structures of the μOR9 and δOR10,11, as well as the inactive and active-state structures of the β2AR12-15, M2R16,17, and rhodopsin18,19, provide insights into shared mechanisms of GPCR activation.
Figure 1. Activated structure of μOR bound to BU72 and Nb39.
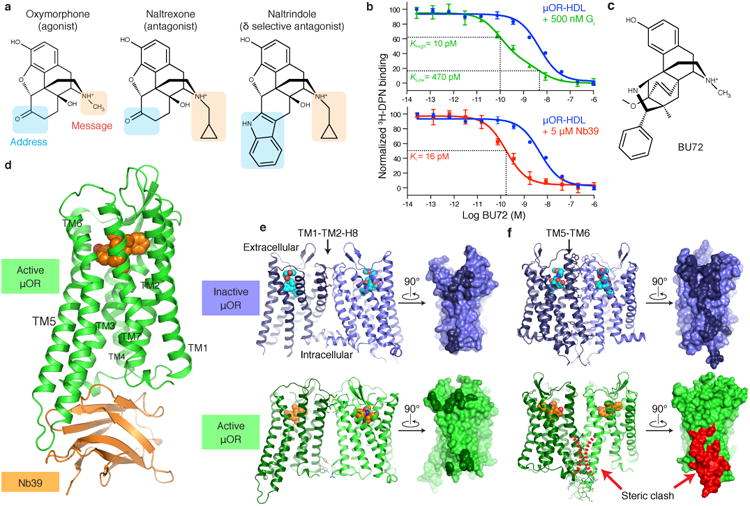
a, Structures of prototypical opioid ligands highlighting regions involved in encoding efficacy (message) and selectivity (address). b, 3H-diprenorphine (3H-DPN) radioligand competition binding of μOR in HDL particles. In the presence of Gi, the affinity of the morphinan agonist BU72 increases 47 fold. The two observed binding sites indicate the affinity of BU72 for receptor coupled to Gi and uncoupled to Gi. A similar 29-fold increase in affinity is observed in presence of Nb39. The binding curves are representative of at least three experiments performed in triplicate, and the data and error bars represent the mean ± s.e.m. c, Structure of the high affinity agonist BU72. d, Overall structure of the μOR-BU72-Nb39 complex. e, An interface between TM1-TM2 and H8 is observed in both inactive and active structures of the μOR. The residues comprising the interface are highlighted in dark colors on the surface view. f, The TM5-TM6 interface observed for inactive μOR is not compatible with the active state due to clashing residues in TM5 and TM6 (highlighted in red).
Results
Nanobody stabilized structure of the μOR
The active states of ligand-activated GPCRs are likely unstable, even when bound to full agonists20-23. However, the active conformation can be stabilized by interactions between a receptor and its cognate G protein. This stabilization is reflected in a higher affinity for agonists when GPCRs are in complex with their cognate G protein24. In the case of the μOR, the affinity for the morphinan agonist BU72 is enhanced by 47 fold when coupled to the G protein Gi (Fig. 1b, c). Efforts to obtain a structure of activated μOR in complex with Gi have thus far not been successful. As an alternative, we have previously utilized camelid single-domain antibody fragments, nanobodies, as G protein-mimetics to stabilize the active conformation of the β2AR and M2R for structural study12,13,17. For the β2AR, the conformation of the receptor obtained in complex with the Gs mimetic nanobody 80 (Nb80) was nearly identical to that in the β2AR-Gs complex25 (RMSD 0.61 Å).
To generate G protein-mimetic nanobodies for the μOR, llamas were immunized with purified μOR bound to the peptide agonist DMT1-DALDA26 and reconstituted into phospholipid vesicles12. We examined the ability of selected nanobodies to stabilize the high-affinity state for μOR agonists. Purified μOR was reconstituted into high-density lipoprotein (HDL) particles and agonist competition assays were performed in the presence or absence of nanobodies (Fig. 1b). In presence of 5 μM nanobody 39 (Nb39), the affinity of the potent morphinan agonist BU7227 increases from 470 pM to 16 pM (Fig. 1b). BU72 has a dissociation half-life of 140 minutes in the presence of Nb39 (Extended Data Fig. 1b). Nb39 also enhances the affinity of μOR agonists DAMGO and endomorphin-2, indicating that the effect is not limited to morphinan agonists (Extended Data Fig. 1a).
Crystals of the μOR bound to BU72 and Nb39 were obtained in a monoolein lipidic mesophase28 and a complete data set to 2.1 Å was obtained by merging diffraction data from four crystals (Extended Data Table 1). Nb39 binds to the intracellular surface of μOR (Fig. 1d, Extended Data Fig. 2), and mediates the majority of packing interactions between lipidic layers and adjacent Nb39-μOR complexes in the crystal lattice. There are no packing interactions involving the extracellular surface of the receptor (Extended Data Fig. 1c). We observe a limited parallel dimeric packing interaction between μOR molecules involving the extracellular end of transmembrane helix 1 (TM1), TM2, the first extracellular loop (ECL1), and helix 8 with a buried surface area of 460 Å2 (Fig. 1e). A similar interface between TM1, TM2, and helix 8 was also observed in the inactive structure of μOR with a slightly larger buried surface area of 615 Å2 (Fig. 1e). The inactive structure also identified a more extensive parallel dimer interaction involving TM5 and TM6 with a buried surface area 1460 Å2 (Fig. 1f). This interaction involving TM5 and TM6 would not be compatible with the conformational changes we observe in the active state (Fig. 1f). It is important to note that the physiologic relevance of these interfaces remains unclear.
Structural differences in the extracellular surface between inactive and active μOR are relatively small (Fig. 2a) with the exception of the proximal N-terminus, as discussed below. Conformational changes at the cytoplasmic surface of the μOR observed upon activation are similar to those observed for the β2AR, M2R and rhodopsin, with large outward movement of TM6 and a smaller inward movement of TM5 and TM7 (Fig. 2a, Extended Data Fig. 3). The conserved E/DRY motif at the intracellular end of TM3 plays a role in maintaining GPCRs in the inactive state. In rhodopsin, an ionic interaction between R1353.50 and E2476.30 in TM6 stabilizes TM6 in an inactive conformation (superscript numbers follow the Ballesteros-Weinstein numbering method for GPCRs29). While there is no acidic amino acid at the end of TM6 of μOR that can form a similar salt bridge with R1653.50, R1653.50 can form a hydrogen bond with T2796.34 (Fig. 2b). In the active states of the μOR and metarhodopsin II, R3.50 forms a hydrogen bond with Y5.58, stabilizing the inward movement of TM5 (Fig. 2b). R3.50 and Y5.58 assume a similar orientation in the M2R and the β2AR-Gs complex; however, they are not close enough to form a hydrogen bond (Extended Data Fig. 3a).
Figure 2. Structural comparison of inactive and active μOR.
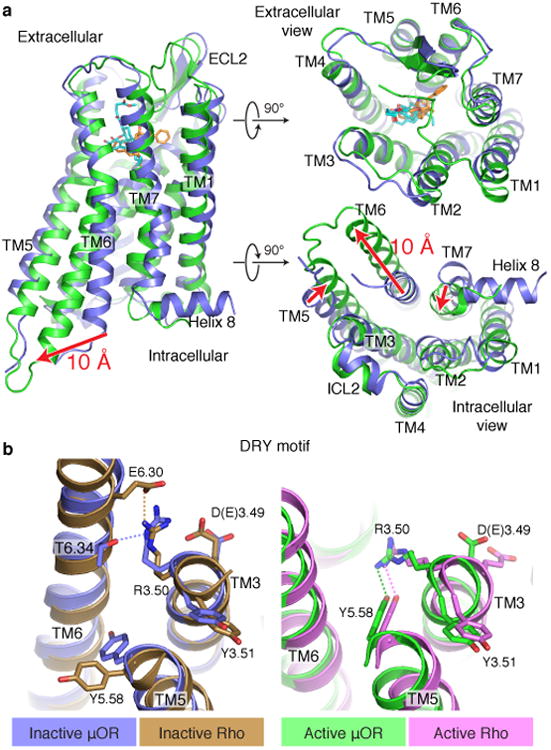
a, Active μOR undergoes a 10 Å outward displacement of TM6 on activation. The extracellular domain of the receptor shows minimal changes upon activation. b, Comparison of the conserved E/DRY motif in the inactive structures of μOR (blue) and rhodopsin (Rho, brown) shows a polar interaction between R3.50 and T6.34 in μOR, analogous to the ionic lock between R3.50 and E6.30 observed for rhodopsin. c, Comparison of the same region in the active state of μOR (green) and Rho (purple) shows a conserved interaction between R3.50 and Y5.58.
Agonist binding pocket
The morphinan scaffold of BU72 binds to the activated μOR in a similar orientation to that observed previously for the irreversible antagonist β-funaltrexamine (β-FNA) at the inactive μOR (Fig. 3a, Extended Data Fig. 4). Figure 3b shows that the overall structural differences in the orthosteric binding pockets of active and inactive μOR are relatively subtle. The majority of interactions between BU72 and active μOR are hydrophobic or aromatic in nature, with the exception of two conserved polar interactions (Fig. 3c, Extended Data Fig. 4). As observed previously in the inactive structures of the μOR, δOR and κOR30, the phenolic hydroxyl of BU72 engages in a water-mediated interaction with H2976.52. In the active state, this network is more extended, and involves Y1483.33 and the backbone carbonyl of K2335.39. An ionic interaction between the morphinan tertiary amine and D1473.32 is seen in both the active μOR bound to BU72 and in inactive μOR bound to β-FNA (Fig. 3c).
Figure 3. μOR agonist binding pocket.
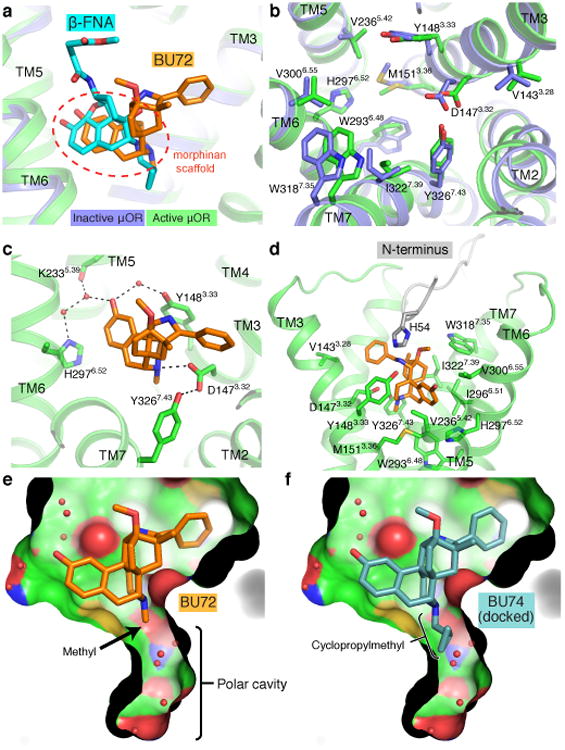
a, BU72 and β-funaltrexamine (β-FNA) occupy a similar pose in the μOR binding pocket. The common morphinan scaffold shared by both ligands is highlighted. b, Binding pocket residues of inactive (blue) and active (green) μOR viewed from the extracellular side. c, Polar interactions between BU72 and active μOR. d, BU72 and binding pocket residues shown with the proximal amino-terminus (grey). e, View of the polar cavity extending towards the intracellular side of μOR in the active state. f, The cyclopropylmethyl group of the antagonist BU74 can be docked to fit within the polar cavity of the active state. However, MD simulations show that this pose is unstable (Extended Data Figure 6).
We also observe an unexpected interaction between BU72 and the amino-terminus of the μOR, which forms a lid over the ligand-binding pocket (Fig. 3d and Extended Data Fig. 5). In particular, the amino-terminal residue H54 is positioned 2.6 Å from secondary amine of BU72. It is of interest that binding of BU72, as well as other structurally unrelated peptide agonists like DAMGO and DMT1-DALDA, lead to conformational changes in the truncated amino terminus that can be detected by nuclear magnetic resonance (NMR) spectroscopy (Sounier et al., companion manuscript). While interactions between the amino-terminus and the transmembrane core may indeed be important for μOR function31, the specific interaction observed here is unlikely to be physiologically relevant as H54 is not highly conserved and the H54A mutation does not alter the affinity of BU72 in μOR with the full length amino-terminus (μOR wild-type Ki = 21 pM and μOR H54A Ki = 30 pM in HEK293 membranes). Additionally, using a bioluminescence resonance energy transfer assay32, we observe no significant difference in the EC50 of Gi activation by BU72 between the wild-type receptor and the H54A mutant (EC50 for wild-type of 79±17 pM and H54A mutant of 67±20 pM).
While the morphinan core of BU72 is unambiguously placed within the electron density, there are two unexplained features of the ligand. We observe a strong positive electron density (Fo-Fc signal) between the H54 side chain and the BU72 amine (Extended Data Fig. 5c). Attempts to identify the source of this density, including mass spectrometry for an alternative ligand structure and the presence an anomalous signal for a coordinated metal were unsuccessful (Extended Data Fig. 4). Another unexpected finding is the near-planar geometry of the sp3 hybridized carbon of BU72 to which the pendant phenyl group is attached (Extended Data Fig. 4e-h). This geometry could be explained by a double bond between this carbon and the adjacent nitrogen. We observed a minor fraction of such a compound by mass spectrometry in our preparation of BU72. However, this compound was not observed in mass spectrometry of the μOR-ligand-Nb39 complex used for crystallography. Ultimately, we modeled a higher-energy conformation of BU72 within the observed electron density (see Extended Data Fig. 4 for further discussion).
In the active μOR, there is a water-filled cavity lined by polar and aromatic side chains that extends off of the intracellular end of the ligand-binding pocket (Fig. 3e). While a similar cavity is observed in inactive μOR, the active-state cavity is larger and completely contiguous with the morphinan-binding site. Substitution of morphinans with a cyclopropylmethyl at the tertiary amine generally results in a ligand with antagonist activity7. As an example, BU74, which only differs from BU72 in having a cyclopropylmethyl substituent on the tertiary amine (Fig. 3f) is an antagonist at the μOR33. While BU74 can be docked into the active state μOR structure with the cyclopropylmethyl within the polar cavity, there are potential clashes with Y3267.43 in TM7 and W2936.48 in TM6. Moreover, the cyclopropylmethyl substituent would displace one or more water molecules that form part of a polar network described in more detail below. Consistent with these observations, MD simulations reveal that the antagonist BU74 is unstable in the position occupied by the agonist BU72 and rapidly shifts away from this initial pose (Extended Data Fig. 6).
Propagation of conformational changes
The structural difference in the orthosteric ligand-binding pocket between active and inactive μOR is relatively subtle (Fig. 3b). It is difficult to identify specific interactions between the structurally rigid agonist and the receptor as being key for μOR activation. This stands in contrast to activation of the β2AR and M2R, where specific polar interactions between the receptor and the smaller, more flexible agonists contribute to structural changes associated with activation. These polar interactions stabilize a 2 Å inward movement of TM5 in the β2AR and a 2 Å inward movement of TM6 in the M2R.
While agonist stabilized changes in the binding pocket differ for the μOR, β2AR, and M2R, the overall structural changes observed at the G protein interface are very similar (Extended Data Fig. 3). The mechanism by which agonist-stabilized changes propagate to the cytoplasmic surface appears to be more similar between μOR and the β2AR compared to the M2R (Fig. 4a). For both the β2AR and the μOR, there is a rearrangement of the packing of a triad of conserved amino acids F6.44, P5.50 and I3.40 (which we term the conserved core triad) that lie just below the binding pocket (Fig 4a). This rearrangement is associated with a counterclockwise rotation (when viewed from the extracellular surface) and outward movement of the cytoplasmic end of TM6. Thus, the subtle agonist-stabilized rearrangement in the conserved core triad may initiate the cascade of structural changes involved in activation of the μOR and β2AR. The role of the conserved core triad appears to differ in the M2R, where the smaller V1113.40 forms a weaker packing interaction with F3966.44 and P1985.50. As a result, the triad in both inactive and active states of the M2R appear similar to the active states of the β2AR (Fig. 4a).
Figure 4. Mechanisms of allosteric coupling in μOR.

a, Comparison of the structural rearrangements in the conserved core triad of μOR, β2AR, and M2R. b, The morphinan ligands BU72 and β-FNA bind to the μOR with a shared hydrophobic surface shown in spheres. BU72 binding results in a 1.5 Å displacement of TM3 towards TM2 and a rotameric change in the sodium coordinating residue N1503.35. Red arrows highlight displacement of the ligand or TM3 upon activation. c, In an MD simulation initiated from the active μOR structure but with the agonist BU72 removed from the binding site, residues in TM3, including the conserved core triad residue I1553.40, adopt an inactive-like conformation. The motions of I1553.40 and ligand-contacting residue D1473.32 are tightly coupled throughout the simulation. Atom positions during simulation are plotted relative to the active structure, with positive values representing displacement toward the position in the inactive structure (see Full Methods). Dashed horizontal lines represent the positions of the indicated atoms in the inactive structure. d, W2936.48 is slightly closer to the phenolic aromatic of the morphinan in the active state of μOR. e, MD simulations show that removal of the agonist BU72 from the active structure results in a change in the preferred rotamer of W2936.48. MD results were consistent across multiple simulations; see Supplementary Section.
Given the similarity in allosteric propagation between μOR and β2AR, we sought to identify how BU72 stabilizes the active conformation of the conserved core triad. In the β2AR, the rearrangement of the conserved core triad can be attributed to an agonist stabilized inward movement of TM512,13. For the μOR, however, there are no specific interactions between the receptor and BU72 that stabilize the inward movement of TM5. Instead, we identify a set of interactions that together appear to stabilize the rearrangement of the conserved core triad in the μOR.
Both β-FNA and BU72 share a common morphinan scaffold. This common scaffold, however, is positioned differently in the inactive and active structures. In both states, residues I2966.51 and V3006.55 in TM6 and W3187.35 and I3227.39 in TM7 form a common hydrophobic surface for binding the morphinan ligands (spheres, Fig. 4b,d). While this surface is similar in both inactive and active states, differences in the position of the rigid morphinan agonist and antagonist result in differences in the positions of key ligand substituents relative to specific residues in TM3 and TM6 that are coupled to the conserved core triad of F2896.44, P2445.50 and I1553.40 (Fig. 4b,d).
In the active μOR structure, the morphinan scaffold of BU72 adopts a pose that is sterically incompatible with the inactive position of TM3. As a result, the residues of TM3 that interact with the tertiary amine (D1473.32) and methyl substituent (M1513.36) of the agonist shift 1.5 Å toward TM2 relative to its position in the inactive structure (Fig. 4b). We utilized MD simulations to assess whether the agonist favors this displacement in TM3. In simulations of activated μOR with the agonist removed, the previously ligand-contacting residues on TM3 quickly relax toward their inactive positions (Fig. 4c), often without global structural change of the receptor. These motions are tightly coupled to motion of the conserved core triad residue I1553.40 towards its inactive position, causing it to reposition relative to F2896.44 (Fig. 4b,c). Notably, the position of D1473.32 is also coupled to the rotameric state of N1503.35, which coordinates an allosteric sodium ion in the inactive state and forms a hydrogen bond with a backbone carbonyl of I1463.31 in the active state (Fig. 4b,c).
Another link between the ligand binding pocket and the conserved core triad may be mediated via TM6 through W2936.48 (Fig. 4d,e). In the active μOR structure, the aromatic group of BU72 is positioned only slightly closer (0.6 Å) to W2936.48 as compared to the same aromatic group of β-FNA in the inactive state. However, MD simulations suggest that agonists stabilize W2936.48 in the rotamer observed in the active-state crystal structure. In simulations of the active state, removal of BU72 results in a change in the favored rotamer of W2936.48 (Fig. 4e). Conversely, we assessed whether an agonist bound to the inactive state would stabilize the side chain of W2936.48 in the rotamer associated with the active state. Here, we simulated the inactive state structure with the antagonist β-FNA replaced with the agonist β-fuoxymorphamine (β-FOA), which differs from β-FNA solely in a methyl substituent at the morphinan tertiary amine34 (Extended Data Fig. 7a). In these simulations, the pose of β-FOA tends to shift towards that observed for BU72 and the TM3 residues D1473.32 and N1503.35 shift towards their active-state positions; in concert, the side chain of W2936.48 shifts towards its active position (Extended Data Fig. 7b,c). W2936.48 is spatially juxtaposed to the conserved core triad residue F2896.44, and the conformation of W2936.48 may therefore serve as an important link between the ligand-binding pocket and the triad (Fig. 4d).
Role of polar network in GPCR activation
In addition to rearrangement of the conserved core triad, comparison of inactive and active structures of μOR reveals an extensive network of polar interactions between the orthosteric binding pocket and the G protein-coupling interface that must rearrange upon activation (Fig. 5a). The high-resolution electron density maps of the active μOR allow us to detect more ordered water molecules within this polar network than have been observed in other active-state GPCR structures reported to date. To provide a better comparison of this polar network, we examined the high-resolution inactive structure of the highly homologous δOR11. The inactive structure of δOR at a resolution of 1.8 Å identifies more water molecules within this polar network than the 2.8 Å inactive structure of μOR and therefore highlights the contribution of many hydrogen bonds in stabilizing both inactive and active states of opioid receptors (Fig. 5b). These hydrogen bonds represent many low energy molecular switches that have to be broken and reformed in a concerted manner to achieve the active conformation. The polar network interactions for inactive state μOR are likely to be identical to the inactive state of δOR because the specific amino acids involved in this network and their side chain conformations are identical between the two homologous receptors.
Figure 5. Rearrangement of a conserved polar network.

a, b Comparison of the water-mediated polar network in the active μOR and high-resolution inactive δOR (PDB ID: 4N6H). To simplify comparisons between different receptors, only Ballesteros-Weinstein numbers are used to label amino acid side chains. The network extends from the orthosteric ligand-binding site to the G protein-coupling domain of the receptor. c, The active structure of μOR reveals the basis for sodium ion allosteric regulation of GPCR function. Rearrangement of S3.39 and N3.35 eliminates the sodium ion coordination site in the active state. d, Conserved hydrogen bonding network in the NPxxY region between active μOR and rhodopsin.
Many of the residues in the polar network are conserved (Extended Data Fig. 8a, b, e and f), suggesting that the polar network may also be conserved and play a similar role in activation of other Family A GPCRs. While there are fewer water molecules observed in the active state structure of the β2AR, the ones that are resolved are in the same positions as those observed in the μOR. Even though the resolution in the active β2AR and M2R structures is not sufficient to observe as many ordered water molecules, the positions of the conserved side chains lining the polar core of the β2AR and M2R are nearly identical to those of the μOR (Extended Data Fig. 8f), suggesting that they are stabilized by a similar hydrogen bonding network.
In the high-resolution inactive state structure of the δOR, there is an ordered sodium ion that is adjacent to the conserved core triad and is coordinated by the side chains of D2.50, N3.35 and S3.39, as well as by W6.48 through a water molecule (Fig. 5b,c). A sodium ion at a similar coordination site has been observed in inactive structures of the protease activated receptor subtype 1 (PAR1)35, the adenosine A2A receptor (A2AR)36 and the β1 adrenergic receptor (β1AR)37. For many GPCRs, including the μOR, agonist binding affinity and/or G protein activation is allosterically inhibited by sodium38. Consistent with allosteric stabilization of the inactive state by sodium, we do not observe a sodium ion in the active state structure of the μOR, and the residues that formed the sodium-binding site rearrange to preclude sodium binding in the active state (Fig. 5c).
The polar network ends at the cytoplasmic surface with a web of interactions involving the conserved NPxxY sequence (Fig. 5d). Upon receptor activation, the NPxxY motif in TM7 moves inward towards TM5 where N3327.49 and Y3367.53 participate in a hydrogen bond network involving Y2525.58 in TM5, the backbone carbonyls of L1583.43 in TM3 and V2856.40 in TM6, and three ordered water molecules (Fig. 5d). A similar hydrogen bond network was previously observed in the structure of metarhodopsin II19. Similar water-mediated hydrogen bonds are likely present in active β2AR and M2R as the side chains of key residues in this region occupy similar positions (Extended Data Fig. 3b).
It is interesting to speculate on the role of this polar network in the energetics of μOR activation. NMR studies reveal that allosteric coupling of the agonist-binding pocket and the G protein-binding interface in the μOR is relatively weak, and structural changes in TM6 are observed only in the presence of a G protein-mimetic nanobody (Sounier et al., companion manuscript). A similar observation has been made for the β2AR20-22,39. Using both double electron-electron resonance (DEER) spectroscopy and NMR spectroscopy we observed that in the presence of a saturating concentration of the catecholamine agonist isoproterenol only 20% of β2AR has TM6 in an active-like conformation24. This stands in contrast to the more efficient coupling between the orthosteric binding pocket and TM6 in rhodopsin, as reflected in the ability to crystallize rhodopsin in an active state without a G protein or G protein mimetic nanobody40, and biophysical studies that reveal a stronger allosteric coupling between the orthosteric binding pocket and TM6 in rhodopsin41. Comparison of the inactive state structures of rhodopsin and the δOR reveals that the δOR has a more extensive polar network on the cytoplasmic side of the ligand binding pocket (Extended Data Fig. 9). This is particularly notable when considering the network of hydrogen bonds that maintain TM6 in the inactive conformation (Extended Data Fig. 9). As noted above, a similar polar network likely stabilizes the inactive states of the μOR and β2AR (Extended Data Fig. 8). The less extensive polar network stabilizing the inactive state of rhodopsin is compensated for by the covalent inverse agonist, 11-cis-retinal. This balance of non-covalent polar interactions and a covalent ligand imparts rhodopsin with virtually no basal activity, but the ability to rapidly and efficiently respond to photoisomerization of retinal. In contrast, the polar network in the μOR and β2AR help to maintain unliganded receptors in an inactive state, but the need to disrupt this network makes activation of these receptors energetically less efficient.
Conclusion
The structure of activated μOR presented here provides a model for how efficacy is encoded within small chemical differences in otherwise structurally similar morphinan ligands. Comparison of active μOR with other active state structures offers insights into shared and subtype-specific mechanisms for activation of Family A GPCRs. Additionally, the extensive reorganization of the polar network required to achieve the fully active state may explain the inefficient allosteric coupling of the orthosteric pocket and the G protein-coupling interface observed in NMR studies for both the μOR and the β2AR. It is possible that subtle ligand-specific differences in the polar network connections may contribute to preferential activation of different signaling proteins.
Full Methods and associated references are available in the online version of the paper at www.nature.com/nature.
Online Methods
Expression and purification of μOR
Full length Mus musculus μOR bearing an amino-terminal Flag epitope tag and a carboxy-terminal 6xHis tag was expressed in Sf9 insect cells using the BestBac baculovirus system (Expression Systems). To facilitate removal of flexible amino- and carboxy-terminal regions, a tobacco etch virus protease recognition sequence was inserted after residue 51 and a rhinovirus 3C protease recognition sequence was inserted before residue 359. Insect cells were infected with baculovirus encoding μOR at a density of 4×10⁶ cells/ml for 48-60 hours at 27° C. Receptor was solubilized and purified in a final buffer comprised of 25 mM HEPES pH 7.4, 100 mM NaCl, 0.01% MNG (Anatrace), 0.001% cholesterol hemisuccinate (CHS) as previously described9.
Llama immunization and selection of μOR-binding nanobodies
Purified μOR bound to the antagonist naloxone and with the amino- and carboxy- termini cleaved was incubated with an excess of the agonist DMT1-DALDA (NIDA Drug Supply Program) and further purified by size exclusion chromatography in a buffer comprised of 20 mM HEPES pH 7.5,100 mM NaCl, 0.1% dodecylmaltoside (DDM, Anatrace), 0.03% CHAPS, 0.01% CHS, and 1 μM DMT1-DALDA. The resulting agonist bound receptor was reconstituted into phospholipid vesicles composed of DOPC (1,2-dioleoyl-sn-glycero-3-phosphocholine, Avanti Polar Lipids) and Lipid A in a 10:1 (w:w) ratio at a final receptor concentration of 1.3 mg/ml. The resulting reconstituted receptor was flash frozen in liquid nitrogen in 100 μg aliquots for llama immunization.
One llama was immunized over a period of 6 weeks with 0.3 mg of liposome-reconstituted μOR purified as described above and bound to the agonist DMT1-DALDA. A phage display library of nanobodies was prepared from peripheral blood lymphocytes as previously described42. μOR-binding nanobodies were identified by selecting phage that bound liposome-reconstituted μOR in the presence or absence of agonist. Ten clones from three families were enriched during rounds of selection. One family, which includes Nb39, bind the intracellular surface and function as G protein mimetics. Another family of nanobodies, including clone Nb35, was identified that competes directly with orthosteric antagonists of the μOR and binds at the extracellular surface.
Expression and purification of nanobodies
Nanobodies bearing a carboxy-terminal 6xHis tag were expressed in the periplasm of Escherichia coli strain WK6. Cultures were grown to an OD600 of 1.0 at 37°C in Terrific Broth medium containing 0.1% glucose, 2 mM MgCl2, and 50 μg/mL ampicillin and induced with 0.5 mM isopropyl-β-D-thiogalactoside (IPTG). Cells were harvested after overnight growth at 25°C and incubated in a buffer containing 200 mM Tris pH 8.0, 0.5 mM EDTA, 500 mM sucrose, 0.5 mg/mL lysozyme for 1 hour at 25°C. Bacteria were osmotically lysed by rapid dilution in a 4× volume of water. The periplasmic fraction was isolated by centrifugation of cell debris, and was supplemented with NaCl to a final concentration of 150 mM as well as imidazole to a final concentration of 25 mM. Nanobodies were purified from the periplasmic fraction by nickel affinity chromatography, and were subsequently purified by size exclusion chromatography in a buffer comprised of 25 mM HEPES pH 7.5 and 100 mM NaCl. Peak fractions were pooled and concentrated to approximately 5 mM.
Radioligand characterization of BU72 and Nb39
Radioligand competition assays were performed using purified μOR reconstituted into high-density lipoprotein (HDL) particles comprised of the lipids POPC and POPG (Avanti Polar Lipids) in a 3:2 molar ratio as previously described43,44. Heterotrimeric Gi was prepared by co-expressing human Giα1, human Gβ1 and Gγ2 subunits in Hi5 insect cells using baculoviruses encoding the individual subunits. The G protein was purified as previously described25.
For competition binding experiments, a mixture of 0.02 nM μOR and 2.3 nM 3H-diprenorphine (3H-DPN, Perkin Elmer) was incubated with varying concentrations of agonist in a binding buffer comprised of 25 mM HEPES pH 7.4, 100 mM NaCl, and 0.1% BSA. Experiments were also performed with either 5 μM Nb39 or 500 nM Gi. Binding reactions were incubated for 4 hours at 25°C. Free radioligand was separated from bound radioligand by rapid filtration onto a Whatman GF/B filter pretreated with 0.1% polyethylenimine with the aid of a 48-well harvester (Brandel). Radioligand activity was measured by liquid scintillation counting. Competition binding data were fit to a one-site model for μOR alone and μOR with Nb39 and a two-site model for μOR incubated with Gi using GraphPad Prism 6.0.
Dissociation studies for BU72 were performed using the method of Motulsky and Mahan45. 3H-DPN was diluted in an assay buffer comprised of 20 mM Tris, pH 7.4, 150 mM NaCl, and 0.05% BSA containing μOR in HDL particles with either vehicle or different concentrations of BU72 alone or in the presence of Nb39. Binding reactions were incubated at 25°C in the dark and nonspecific binding was determined in the presence of 10 μM naloxone. Aliquots of this binding reaction were removed at specified time points over the course of 2 or 8 hours and filtered through Whatman GF/C filters with the aid of a Brandel harvester. As above, radioligand activity was measured by liquid scintillation counting. Dissociation rates for BU72 were determined by fitting data in the ‘kinetics of competitive binding’ program in GraphPad Prism 6.02. For K1 and K2, rates of 3H-DPN association and dissociation were determined through independent studies following the same method as above.
Purification and crystallization of μOR-BU72-Nb39 complex
Initial crystals of a μOR-BU72-Nb complex diffracted to low resolution. In an effort to improve the specific activity of purified μOR, we utilized an extracellular binding nanobody, Nb35 during the purification of the receptor. Nb35 binds in the orthosteric pocket of μOR with a Ki of 12 nM. Purified ligand-free μOR, with the amino- and carboxy- termini cleaved was mixed with a 2.5× excess of Nb35, and the complex was isolated by Ni-NTA chromatography. Functional μOR in complex with Nb35 was eluted in a buffer containing 25 mM HEPES pH 7.5, 100 mM NaCl, 0.01% MNG, 0.001% CHS, and 250 mM imidazole. The agonist BU72 and Nb39 were then added in excess. In the presence of Nb39, BU72 has exceptionally high affinity for the μOR and displaces Nb35, resulting in the desired μOR-BU72-Nb39 complex. The μOR-BU72-Nb39 complex was isolated by size exclusion chromatography and concentrated to approximately 50 mg/mL for crystallization trials.
For crystallization, the purified μOR-BU72-Nb39 complex was reconstituted into a 10:1 (w:w) mixture of monoolein and cholesterol (Sigma). The protein solution and lipid were mixed in a 1:1.5 ratio (w:w) and the lipidic cubic phase was attained using the two-syringe method46. 30 nL of the resulting mesophase was dispensed onto 96-well glass plates and overlaid with 500 nL of precipitant solution using a Gryphon LCP robot (Art Robbins Instruments). Crystals grew in a precipitant comprised of 15-25% PEG300, 100 mM HEPES pH 7.0-7.5, 1% 1,2,3-heptanetriol, 0.5-1.0% Polypropylene glycol P 400 (Hampton Research) and 100-300 mM (NH4)2HPO4. Crystals were observed after 2 days and reached full size in 1 week. Crystals were harvested with mesh grid loops (MiTeGen) and flash frozen in liquid nitrogen. Loops were screened at the Advanced Photon Source GM/CA beamlines 23ID-B and 23ID-D. Diffraction data were collected at a wavelength of 1.033 Å using a 10 μm beam with 5 fold attenuation and exposed for 0.5-1 s. An oscillation width of 0.1-0.5 degrees was used and diffraction images from 4 crystals were merged to create the final data set.
Structure determination and refinement
Diffraction images were indexed, scaled, and merged by XDS47 with statistics summarized in Extended Data Table 1. The structure was determined by molecular replacement in Phaser48 with initial search models including inactive μOR (PBD ID: 4DKL) and Nb80 (PDB ID: 3P0G). The structural model was iteratively rebuilt in Coot49 and refined using Phenix50. Final refinement statistics are summarized in Extended Data Table 1. Molprobity51 was used for structure analysis and indicated that 96.3% of residues where within favored Ramachandran regions with 3.7% in allowed regions. No residues were identified as Ramachandran outliers. Figures were prepared using MacPyMol (Schrödinger).
System setup for molecular dynamics simulations
Simulations of the μ opioid receptor (μOR) were based on both the antagonist-bound inactive-state crystal structure (PDB ID: 4DKL) and the agonist-bound active-state crystal structure described in this manuscript. Coordinates were prepared by first removing all non-ligand and non-receptor molecules except for the cholesterol neighboring TM7 and for crystallographic water molecules near the receptor. For inactive μOR simulations, the T4 lysozyme was removed and acetyl and methylamide capping groups were placed on R263ICL3 and E270ICL3. For active μOR simulations, the nanobody was removed. In both cases, Prime (Schrödinger, Inc.) was used to model missing side-chains, and capping groups were then added to the N- and C- termini of the receptor. Histidine residues were simulated as the neutral Nε tautomer. Other titratable residues were simulated in their dominant protonation state at pH 7 except for D1142.50, which was charged in inactive simulations and neutral in active simulations. A sodium ion was placed adjacent to D1142.50 in inactive simulations.
The μOR was simulated in seven distinct conditions. These include: (1) The unliganded, inactive μOR, prepared by deleting the covalently bound, co-crystallized ligand, β-FNA, and adding a proton in its place to K2335.39; (2) The inactive μOR with the co-crystallized ligand β-FNA; (3) The inactive μOR with agonist β-FOA (which does not bind covalently); (4) The unliganded, active μOR, prepared by deleting the co-crystallized ligand, BU72; (5) The active μOR with the co-crystallized ligand BU72; (6) The active μOR with the co-crystallized ligand BU72, with the N-terminal peptide deleted; (7) The active μOR with the antagonist BU74, with the N-terminal peptide deleted. Simulations of the active μOR without N-terminal peptide were prepared by deleting residues 52 through 64 of the receptor. Simulations with β-FOA were prepared by docking β-FOA to the crystallographic pose of β-FNA. Simulations with BU74 were prepared by docking BU74 to the crystallographic pose of BU72 and rotating the torsion angle of the methylcyclopropyl group to agree with that of β-FNA's methylcyclopropyl group.
We performed three to six simulations per condition (Supplementary Section). Simulations in a given condition were initiated from identical structures, but with initial atom velocities assigned independently and randomly.
It should be noted that in all liganded simulations, including those with β-FNA, β-FOA, BU72, and BU74, the ligand's tertiary amine nitrogen was protonated and therefore the ligand was simulated as a cation. This is necessary for the ligand to form the conserved salt bridge with neighboring D1473.32.
Each of the resulting prepared μOR receptor structures was then aligned to the Orientations of Proteins in Membranes (OPM)52 entry for the inactive μOR using MacPyMOL (Schrödinger). The μOR was modified with disulfide bridges and inserted into a hydrated, equilibrated palmitoyloleoylphosphatidylcholine (POPC) bilayer using the CHARMM-GUI interface53-56. Sodium and chloride ions were added to neutralize the system, reaching a final concentration of approximately 150 mM. All simulations contained one μOR receptor embedded in a lipid bilayer with 160 POPC molecules.
Simulation protocol and analysis
Each simulation was performed on two GPUs using the CUDA version of PMEMD (Particle Mesh Ewald Molecular Dynamics) in Amber1457-59 with 2.5 fs time steps. Simulations were heated from 0 K to 100 K in the NVT ensemble and then from 100 K to 310 K in the NPT ensemble, both with 10.0 kcal mol−1 Å−2 harmonic restraints applied to the protein and to the lipids. Initial velocities were assigned randomly at the first heating step with Langevin dynamics. Subsequently, simulations were equilibrated in the NPT ensemble at 310 K (controlled with a Langevin thermostat) with pressure of 1 bar (controlled with anisotropic Berendsen weak-coupling barostat), with harmonic restraints on all protein atoms tapered off 1.0 kcal mol−1 Å−2 in a stepwise fashion every 2.0 ns starting at 5.0 kcal mol−1 Å−2 to 0.0 kcal mol−1 Å−2, for a total of 12.0 ns of equilibration. Bond lengths to hydrogen atoms were constrained using SHAKE. Production simulations were performed in the NPT ensemble at 310 K and 1 bar, using a Langevin thermostat for temperature coupling and a Monte Carlo barostat for pressure coupling, and were initiated from the final snapshot of the corresponding equilibration simulation. Nonbonded interactions were cutoff at 9.0 Å, and long-range electrostatic interactions were computed using the particle mesh Ewald (PME) method, with an Ewald coefficient β of approximately 0.31 Å−1 and B-spline interpolation of order 4. The FFT grid size was 84 × 84 × 96 for all simulations. We performed a total of 27 simulations, which are summarized in the Supplementary Section.
We used the CHARMM36 parameter set for protein molecules, lipid molecules, and salt ions, and the CHARMM TIP3P model for water; protein parameters incorporated CMAP terms60-63. These parameters were assigned using the ParmEd implementation of Chamber, provided with AmberTools14. Ligand parameters were based on the results from the CHARMM ParamChem web server, version 0.9.7.164, and incorporated specific modifications to partial charges. When ParamChem reported large penalties (errors) for estimated partial charges, better estimates were determined by submitting appropriately chosen fragments to ParamChem (see below).
Parameterization of β-FNA, the co-crystallized ligand in the inactive μOR structure, required additional steps due to the added complexity of its covalent bond with K2335.39 on the receptor. To assign parameters to the rest of β-FNA, the molecule was fragmented as shown in “Supplementary Section on Parameterization” and then re-assembled. In addition, a molecule consisting of K2335.39 bonded to the portion of β-FNA on the extracellular side of its morphinan scaffold was submitted to ParamChem, and the results were used to modify charges near the bond between the β-FNA carbon and Lys side-chain nitrogen. A modified version of the ParmEd program was used to form a bond between β-FNA and K2335.39, to parameterize that and neighboring bonds, and to modify neighboring partial charges according to the derived parameters. The related ligand β-FOA (which does not bind covalently to the μOR) was divided into the same three fragments as β-FNA for parameterization, with the following modifications: the bond between the ligand and K2335.39 was cleaved, a C=C double bond was formed between the two carbons adjacent to this bond, and the methylcyclopropyl group was replaced with a methyl group. The co-crystallized ligand of the active μOR, BU72, was similarly parameterized by splitting it into fragments, individually uploading the fragments to the ParamChem web server, and assembling the results together. The fragments can be found in the Supplementary Section. The ligand, BU74, was parameterized identically to BU72, except that its tertiary amine methyl group was replaced with a methylcyclopropyl group.
Quantitative analysis of trajectories was conducted in both cpptraj, an Amber14 software package, and VMD65. Plots were smoothed with a moving average, with a symmetric triangular smoothing window. The window length was 20 ns, except during the first 10 ns of each simulation, when the smoothing window extended from time zero to double the time at which the data was recorded. Plots were rendered in R with the ggplot2 package as well as in Python with the Matplotlib package.
To compute movement of specified atoms from the active position towards the inactive position, as plotted in Fig. 4C, the active and inactive crystal structures and each simulation frame were aligned using the Cα atoms of residues 80–95, 102–13, and 181–205 (TMs 1, 2, and 4). For each specified atom, the atom position in simulation was projected onto the line connecting the atom positions in the active and inactive crystal structures, and the distance of the projected point from the position in the active crystal structure position was determined.
Extended Data
Extended Data Figure 1. Characterization of Nb39 and lattice interactions in μOR-Nb39 crystals.

a, 3H-diprenorphine (3H-DPN) competition binding shows increased affinity for μOR-selective agonists DAMGO and endomorphin-2 in the presence of Nb39. b, The dissociation half-life (t1/2) of BU72 was determined by measuring the association rate of the antagonist 3H-DPN in the presence of the indicated concentrations of BU72. The dissociation t1/2 of BU72 is 43 minutes and increases to 140 minutes in presence of Nb39. Panels a and b are representative of at least three experiments performed in triplicate, and the data and error bars represent the mean ± s.e.m. c, Crystal lattice packing of the μOR-Nb39 complex shows that most of the contacts are mediated by Nb39. The μOR extracellular domain is not involved in any contacts.
Extended Data Figure 2. μOR-Nb39 interface.

a, Nb39 does not penetrate as deeply into the core of the μOR when compared with the β2AR-Nb80 complex and the M2R-Nb9-8 complex. In the β2AR-Nb80 and M2R-Nb9-8 complexes, nanobody CDR3 residues bind within the core of the receptor transmembrane bundle. In comparison, Nb39 binding involves more framework residues. Notably, seven residues of CDR3 remained unresolved in the final model of the μOR-Nb39 complex. b, Nb39 interacts primarily through hydrogen bonds with residues from ICL2, ICL3 and Helix 8 of the μOR. c, Schematic representation of the interactions between μOR and Nb39 highlighting the numerous Nb39 framework interactions.
Extended Data Figure 3. Cytoplasmic domain rearrangements in conserved regions.

a, The E/DRY sequence is a highly conserved motif within Family A GPCRs responsible for constraining receptors in an inactive conformation. Comparisons of inactive and active state structures around the conserved E/DRY residues at the cytoplasmic surface of the μOR, the M2 muscarinic receptor (M2R), the β2 adrenergic receptor (β2AR) and Rhodopsin (Rho) are shown here. Hydrogen bonds are shown as dotted lines. b, The NPxxY motif is a highly conserved sequence in TM7 among Family A GPCRs. In the active state μOR, Y7.53 and N7.49 in TM7 interact with Y5.58 in TM5 and the backbone carbonyl of L3.43 in TM3 through a water mediated polar network. A similar network is observed in the active state of rhodopsin. While waters are not observed in the lower resolution structures of the β2AR and M2R, the positions of the side chains of Y7.53, N7.49 and Y5.58 suggest a similar water mediated network with putative waters represented by red circles.
Extended Data Figure 4. Conformation of the binding pocket and BU72.

The 2Fo-Fc electron density contoured at 2.0 σ and within 1.8 Å of residues comprising the active μOR ligand-binding pocket is shown as grey mesh in a and b. The same views are shown in c and d with the omit Fo-Fc density for BU72 displayed as an orange mesh. Displayed Fo-Fc electron density is contoured at 3.0 σ. e, Placement of an energetically minimized conformation of BU72 within the Fo-Fc electron density shows a poor fit for the pendant phenyl ring. The conformation of BU72 was minimized using quantum mechanical Hartree-Fock methods. f, An alternative possible ligand structure with sp2 geometry at the carbon adjacent to the phenyl (highlighted in red dashed circle) was initially considered due to a better fit within the electron density. This alternative ligand is predicted to be 2 daltons (Da) smaller than BU72. g, In order to resolve potential ambiguity in the cocrystallized ligand, we performed mass spectrometry on the same protein sample used to generate crystals of the active μOR. The protein was precipitated in methanol and the supernatant was subjected to MALDI-MS which revealed a strong peak at m/z=429.226, consistent with the expected mass of BU72. h, Shown is our final crystallographic model for BU72 within the Fo-Fc electron density. This model likely represents a high-energy conformation of BU72. Notably, the position of the morphinan scaffold is invariant between these alternative models for the crystallized ligand.
Extended Data Figure 5. The N-terminus of the μOR interacts with BU72.

a, Surface cut-away view showing that the N-terminus forms a lid over the ligand-binding pocket. Shown in the lower panel is the ligand-binding pocket in the absence of the N-terminus. b, Blue mesh shows the 2Fo-Fc omit map contoured at 1.0 σ for the N-terminus. c, Shown in green mesh is the Fo-Fc omit map contoured at 4.0 σ of an unidentified density between BU72 and H54.
Extended Data Figure 6. Molecular dynamics simulation of active μOR bound to antagonist BU74.

a, Structures of agonist BU72, and antagonists BU74 and β-funaltrexamine (β-FNA). The inactive state structure of μOR was co-crystallized with β-FNA. b, BU74 was docked into the active-state structure of the μOR based on the crystallographic pose of BU72, but in an MD simulation it rapidly moves away from this initial pose. The middle panel highlights the movements of BU74 after 560 nanoseconds (ns) of simulation and the rightmost panel shows the comparison of the BU74 pose as compared to the crystal structure of β-FNA bound to inactive μOR. c, Molecular dynamics trajectory measuring the distance between the phenolic hydroxyl of Y3267.43 and the tertiary amine of BU74. Dotted lines show the distance between Y3267.43 and the same amine of BU72 in the crystal structure of active μOR and β-FNA in the structure of inactive μOR.
Extended Data Figure 7. Molecular dynamics simulation of inactive μOR bound to agonist β-FOA.

a, Structures of agonists BU72 and β-fuoxymorphamine (β-FOA) and antagonist β-funaltrexamine (β-FNA). b, MD simulation of inactive μOR with β-FOA docked into the same pose as β-FNA in the inactive-state crystal structure of μOR. β-FOA shifts towards TM3 with an accompanying rearrangement of TM3 residues D1473.32 and N1503.35 towards the active-state structure. The overall ligand-binding pocket resembles the active state after 455 nanoseconds (ns) of simulation. c, Trajectory of the W2936.48 Chi2 dihedral angle (indicated in the middle panel in b) over 700 ns of simulation. In the presence of β-FOA, the preferred rotamer for W2936.48 rapidly approaches a conformation similar to the one observed in the structure of active μOR bound to BU72.
Extended Data Figure 8. Comparison of polar networks involved in GPCR activation.

a, Residues involved in the polar network in the inactive state of the δOR (PDB ID: 4N6H) and conservation of those residues in β2AR, M2R, and rhodopsin. b, Residues involved in the polar network in active state μOR and conservation in β2AR, M2R, and rhodopsin. c, Water-mediated polar network in the inactive structure of the δOR involves residues from TM1, TM2, TM3, TM5, TM6 and TM7. d, An identical view as in (c) of the polar network in the active μOR. e, Residues involved in the polar network in inactive structures of δOR, β2AR and M2R are conserved both in sequence and conformation. f, In active μOR, β2AR and M2R, the residues within the polar network are again conserved in sequence and conformation.
Extended Data Figure 9. Differences in TM6 polar network in opioid receptors and rhodopsin.

a, The entire set of contacts within the polar network that include a residue within TM6 is displayed for the inactive δOR, active μOR, and inactive and active rhodopsin (Rho). b, Helix wheel representation of TM6 showing polar contacts. Notably, the inactive δOR engages in many more polar contacts with neighboring residues as compared to inactive rhodopsin. Additionally, the active states of both μOR and rhodopsin have fewer polar contacts than the inactive state.
Extended Data Table 1. Data collection and refinement statistics (molecular replacement).
| μOR-BU72-Nb39a | |
|---|---|
| Data collectionb | |
| Space group | I212121 |
| Cell dimensions | |
| a, b, c (Å) | 44.4, 144.0, 209.9 |
| α, β, γ (°) | 90.0, 90.0, 90.0 |
| Resolution (Å) | 50.0-2.07 (2.12-2.07) |
| Rmerge (%) | 11.2 (153.6) |
| <I/σI> | 11.0(1.7) |
| CC1/2 (%) | 99.2 (64.7) |
| Completeness (%) | 99.8 (100.0) |
| Redundancy | 8.6 (8.8) |
| Refinement | |
| Resolution (Å) | 42.5-2.1 (2.15-2.10) |
| Number of reflections | 39,948 |
| Rwork/Rfree (%) | 18.53/22.15 (25.83/28.71) |
| Number of atoms | |
| Protein | 3,278 |
| Ligand (BU72) | 32 |
| Lipid, water and others | 208 |
| B-factors (Å2) | |
| Protein | 56.89 |
| Ligand (BU72) | 39.50 |
| Lipid, water and others | 69.91 |
| R.M.S. deviation from ideality | |
| Bond lengths (Å) | 0.008 |
| Bond angles (°) | 1.193 |
| Ramachandran statisticsc (%) | |
| Favored | 96.1 |
| Allowed | 3.9 |
| Outliers | 0 |
Diffraction data from 4 crystals were merged into a complete data set
Highest resolution shell statistics are shown in parentheses
As calculated by Molprobity
Supplementary Material
Acknowledgments
We acknowledge support from the Stanford Medical Scientist Training Program and the American Heart Association (A.M.), National Institutes of Health grants R37DA036246 (B.K.K. and S.G.) and R01GM083118 (B.K.K.), a Terman Faculty Fellowship (R.O.D.), Eli Lilly and Company through the Lilly Research Program (R.O.D.), and the Mathers Foundation (B.K.K. and W.I.W). We also acknowledge the National Institute of Drug Abuse Drug Supply Program for providing DMT1-DALDA. We thank Damien Maurel and Sandra Agnel from the ARPEGE facility (Institut de Génomique Fonctionnelle) for assistance with cell-based Gi coupling assays, Hassan El Hassan for expert echnical assistance, and Samuel Hertig, Naomi Latorraca, and Kilian Cavalotti for assistance with MD simulations and analysis.
Footnotes
Supplementary Information is linked to the online version of the paper at www.nature.com/nature.
Author Contributions: W.H. developed functional purification protocols, expressed and purified μOR, characterized the effect of nanobodies and Gi on μOR ligand affinity, identified Nb39 for crystallography of the μOR-Nb complex, performed crystallization trials, data collection, structure determination and refinement. A.M. established the project with biochemistry of active μOR, prepared samples for llama immunization, validated nanobody activity, performed crystallization trials, and identified initial crystals of the μOR-BU72-Nb complex suitable for diffraction studies. A.J.V. analyzed the polar network. A.J.V., E.F., and A.S. performed and analyzed molecular dynamics simulations with supervision from R.O.D. T.L. identified μOR-binding nanobodies with supervision from J.S. S.G. established the biochemistry for purification of agonist-bound μOR and prepared samples for μOR immunization. H.E.K. helped with data collection and processing. T.S.T helped with the characterization of the amino-terminal region. R.K. and P.G. analyzed BU72 and assessed alternative ligand structures. S.M.H. synthesized BU72. K.E.L. and J.R.T. helped with selection of opioid ligands including BU72 and performed dissociation kinetics experiments. W.I.W. supervised structure refinement. A.M. and B.K.K. provided overall project supervision, and wrote the manuscript with W.H. and R.O.D.
Author Information: Coordinates and structure factors for the μOR-BU72-Nb39 complex are deposited in the Protein Data Bank under accession code 5C1M. Readers are welcome to comment on the online version of this article at www.nature.com/nature.
Competing financial interests: A.M., T.L., J.S., and B.K.K. have filed a patent for active-state stabilizing nanobodies for opioid receptors.
References
- 1.Matthes HW, et al. Loss of morphine-induced analgesia, reward effect and withdrawal symptoms in mice lacking the μ-opioid-receptor gene. 1996 doi: 10.1038/383819a0. [DOI] [PubMed] [Google Scholar]
- 2.Brownstein MJ. A brief history of opiates, opioid peptides, and opioid receptors. Proceedings of the National Academy of Sciences of the United States of America. 1993;90:5391–5393. doi: 10.1073/pnas.90.12.5391. [DOI] [PMC free article] [PubMed] [Google Scholar]
- 3.Schumacher MA, Basbaum AI, Naidu RK. In: Basic & Clinical Pharmacology, 13e. Katzung Bertram G, Trevor Anthony J., editors. McGraw-Hill Medical; 2015. [Google Scholar]
- 4.Raehal KM, Walker JK, Bohn LM. Morphine side effects in β-arrestin 2 knockout mice. Journal of Pharmacology and Experimental Therapeutics. 2005;314:1195–1201. doi: 10.1124/jpet.105.087254. [DOI] [PubMed] [Google Scholar]
- 5.Bohn LM, Gainetdinov RR, Lin FT, Lefkowitz RJ, Caron MG. [mu]-Opioid receptor desensitization by [beta]-arrestin-2 determines morphine tolerance but not dependence. Nature. 2000;408:720–723. doi: 10.1038/35047086. [DOI] [PubMed] [Google Scholar]
- 6.Bohn LM, et al. Enhanced Morphine Analgesia in Mice Lacking β-Arrestin 2. Science. 1999;286:2495–2498. doi: 10.1126/science.286.5449.2495. [DOI] [PubMed] [Google Scholar]
- 7.Pasternak GW, Pan YX. Mu Opioids and Their Receptors: Evolution of a Concept. Pharmacological Reviews. 2013;65:1257–1317. doi: 10.1124/pr.112.007138. [DOI] [PMC free article] [PubMed] [Google Scholar]
- 8.Chavkin C, Goldstein A. Specific receptor for the opioid peptide dynorphin: structure--activity relationships. Proceedings of the National Academy of Sciences. 1981;78:6543–6547. doi: 10.1073/pnas.78.10.6543. [DOI] [PMC free article] [PubMed] [Google Scholar]
- 9.Manglik A, et al. Crystal structure of the [micro]-opioid receptor bound to a morphinan antagonist. Nature. 2012;485:321–326. doi: 10.1038/nature10954. doi: http://www.nature.com/nature/journal/v485/n7398/abs/nature10954.html - supplementary-information. [DOI] [PMC free article] [PubMed] [Google Scholar]
- 10.Granier S, et al. Structure of the δ-opioid receptor bound to naltrindole. Nature. 2012;485:400–404. doi: 10.1038/nature11111. doi: http://www.nature.com/nature/journal/v485/n7398/abs/nature11111.html - supplementary-information. [DOI] [PMC free article] [PubMed] [Google Scholar]
- 11.Fenalti G, et al. Molecular control of [dgr]-opioid receptor signalling. Nature. 2014;506:191–196. doi: 10.1038/nature12944. http://www.nature.com/nature/journal/v506/n7487/abs/nature12944.html - supplementary-information. [DOI] [PMC free article] [PubMed] [Google Scholar]
- 12.Rasmussen SGF, et al. Structure of a nanobody-stabilized active state of the [bgr]2 adrenoceptor. Nature. 2011;469:175–180. doi: 10.1038/nature09648. doi: http://www.nature.com/nature/journal/v469/n7329/abs/nature09648.html - supplementary-information. [DOI] [PMC free article] [PubMed] [Google Scholar]
- 13.Ring AM, et al. Adrenaline-activated structure of [bgr]2-adrenoceptor stabilized by an engineered nanobody. Nature. 2013;502:575–579. doi: 10.1038/nature12572. http://www.nature.com/nature/journal/v502/n7472/abs/nature12572.html - supplementary-information. [DOI] [PMC free article] [PubMed] [Google Scholar]
- 14.Cherezov V, et al. High-Resolution Crystal Structure of an Engineered Human β2-Adrenergic G Protein–Coupled Receptor. Science. 2007;318:1258–1265. doi: 10.1126/science.1150577. [DOI] [PMC free article] [PubMed] [Google Scholar]
- 15.Rosenbaum DM, et al. GPCR Engineering Yields High-Resolution Structural Insights into β2-Adrenergic Receptor Function. Science. 2007;318:1266–1273. doi: 10.1126/science.1150609. [DOI] [PubMed] [Google Scholar]
- 16.Haga K, et al. Structure of the human M2 muscarinic acetylcholine receptor bound to an antagonist. Nature. 2012;482:547–551. doi: 10.1038/nature10753. doi: http://www.nature.com/nature/journal/v482/n7386/abs/nature10753.html - supplementary-information. [DOI] [PMC free article] [PubMed] [Google Scholar]
- 17.Kruse AC, et al. Activation and allosteric modulation of a muscarinic acetylcholine receptor. Nature. 2013;504:101–106. doi: 10.1038/nature12735. http://www.nature.com/nature/journal/v504/n7478/abs/nature12735.html - supplementary-information. [DOI] [PMC free article] [PubMed] [Google Scholar]
- 18.Palczewski K, et al. Crystal Structure of Rhodopsin: A G Protein-Coupled Receptor. Science. 2000;289:739–745. doi: 10.1126/science.289.5480.739. [DOI] [PubMed] [Google Scholar]
- 19.Choe HW, et al. Crystal structure of metarhodopsin II. Nature. 2011;471:651–655. doi: 10.1038/nature09789. doi: http://www.nature.com/nature/journal/v471/n7340/abs/10.1038-nature09789-unlocked.html - supplementary-information. [DOI] [PubMed] [Google Scholar]
- 20.Rosenbaum DM, et al. Structure and function of an irreversible agonist-[bgr]2 adrenoceptor complex. Nature. 2011;469:236–240. doi: 10.1038/nature09665. doi: http://www.nature.com/nature/journal/v469/n7329/abs/nature09665.html - supplementary-information. [DOI] [PMC free article] [PubMed] [Google Scholar]
- 21.Nygaard R, et al. The Dynamic Process of β2-Adrenergic Receptor Activation. Cell. 2013;152:532–542. doi: 10.1016/j.cell.2013.01.008. doi: http://dx.doi.org/10.1016/j.cell.2013.01.008. [DOI] [PMC free article] [PubMed] [Google Scholar]
- 22.Manglik A, Kobilka B. The role of protein dynamics in GPCR function: insights from the beta2AR and rhodopsin. Current opinion in cell biology. 2014;27:136–143. doi: 10.1016/j.ceb.2014.01.008. [DOI] [PMC free article] [PubMed] [Google Scholar]
- 23.Manglik A, et al. Structural Insights into the Dynamic Process of beta2-Adrenergic Receptor Signaling. Cell. 2015;161:1101–1111. doi: 10.1016/j.cell.2015.04.043. [DOI] [PMC free article] [PubMed] [Google Scholar]
- 24.De Lean A, Stadel JM, Lefkowitz RJ. A ternary complex model explains the agonist-specific binding properties of the adenylate cyclase-coupled beta-adrenergic receptor. Journal of Biological Chemistry. 1980;255:7108–7117. [PubMed] [Google Scholar]
- 25.Rasmussen SGF, et al. Crystal structure of the [bgr]2 adrenergic receptor-Gs protein complex. Nature. 2011;477:549–555. doi: 10.1038/nature10361. doi: http://www.nature.com/nature/journal/v477/n7366/abs/nature10361.html - supplementary-information. [DOI] [PMC free article] [PubMed] [Google Scholar]
- 26.Schiller PW, et al. Synthesis and in vitro opioid activity profiles of DALDA analogues. European Journal of Medicinal Chemistry. 2000;35:895–901. doi: 10.1016/s0223-5234(00)01171-5. doi: http://dx.doi.org/10.1016/S0223-5234(00)01171-5. [DOI] [PubMed] [Google Scholar]
- 27.Neilan CL, et al. Characterization of the complex morphinan derivative BU72 as a high efficacy, long-lasting mu-opioid receptor agonist. European Journal of Pharmacology. 2004;499:107–116. doi: 10.1016/j.ejphar.2004.07.097. doi: http://dx.doi.org/10.1016/j.ejphar.2004.07.097. [DOI] [PubMed] [Google Scholar]
- 28.Caffrey M. Crystallizing Membrane Proteins for Structure Determination: Use of Lipidic Mesophases. Annual Review of Biophysics. 2009;38:29–51. doi: 10.1146/annurev.biophys.050708.133655. [DOI] [PubMed] [Google Scholar]
- 29.Ballesteros JA, Weinstein H. Integrated methods for the construction of three-dimensional models and computational probing of structure-function relations in G protein-coupled receptors. Methods in Neurosciences. 1995;25:366–428. doi: 10.1016/S1043-9471(05)80049-7. [DOI] [Google Scholar]
- 30.Wu H, et al. Structure of the human [kgr]-opioid receptor in complex with JDTic. Nature. 2012;485:327–332. doi: 10.1038/nature10939. doi: http://www.nature.com/nature/journal/v485/n7398/abs/nature10939.html - supplementary-information. [DOI] [PMC free article] [PubMed] [Google Scholar]
- 31.Chaturvedi K, Shahrestanifar M, Howells RD. μ Opioid receptor: role for the amino terminus as a determinant of ligand binding affinity. Molecular Brain Research. 2000;76:64–72. doi: 10.1016/s0169-328x(99)00332-0. doi: http://dx.doi.org/10.1016/S0169-328X(99)00332-0. [DOI] [PubMed] [Google Scholar]
- 32.Gales C, et al. Probing the activation-promoted structural rearrangements in preassembled receptor-G protein complexes. Nature structural & molecular biology. 2006:13, 778–786. doi: 10.1038/nsmb1134. [DOI] [PubMed] [Google Scholar]
- 33.Husbands SM, et al. BU74, a complex oripavine derivative with potent kappa opioid receptor agonism and delayed opioid antagonism. European Journal of Pharmacology. 2005;509:117–125. doi: 10.1016/j.ejphar.2004.12.035. doi: http://dx.doi.org/10.1016/j.ejphar.2004.12.035. [DOI] [PubMed] [Google Scholar]
- 34.Takemori AE, Larson DL, Portoghese PS. The irreversible narcotic antagonistic and reversible agonistic properties of the fumaramate methyl ester derivative of naltrexone. Eur J Pharmacol. 1981;70:445–451. doi: 10.1016/0014-2999(81)90355-1. [DOI] [PubMed] [Google Scholar]
- 35.Zhang C, et al. High-resolution crystal structure of human protease-activated receptor 1. Nature. 2012;492:387–392. doi: 10.1038/nature11701. doi: http://www.nature.com/nature/journal/v492/n7429/abs/nature11701.html - supplementary-information. [DOI] [PMC free article] [PubMed] [Google Scholar]
- 36.Liu W, et al. Structural Basis for Allosteric Regulation of GPCRs by Sodium Ions. Science. 2012;337:232–236. doi: 10.1126/science.1219218. [DOI] [PMC free article] [PubMed] [Google Scholar]
- 37.Miller-Gallacher JL, et al. The 2.1 Å Resolution Structure of Cyanopindolol-Bound β<sub>1</sub>-Adrenoceptor Identifies an Intramembrane Na<sup>+</sup> Ion that Stabilises the Ligand-Free Receptor. PLoS ONE. 2014;9:e92727. doi: 10.1371/journal.pone.0092727. [DOI] [PMC free article] [PubMed] [Google Scholar]
- 38.Pert CB, Pasternak G, Snyder SH. Opiate agonists and antagonists discriminated by receptor binding in brain. Science. 1973;182:1359–1361. doi: 10.1126/science.182.4119.1359. [DOI] [PubMed] [Google Scholar]
- 39.Manglik A, et al. Structural insights into the dynamic process of beta2-adrenergic receptor signaling. Cell. 2015 doi: 10.1016/j.cell.2015.04.043. [DOI] [PMC free article] [PubMed] [Google Scholar]
- 40.Park JH, Scheerer P, Hofmann KP, Choe HW, Ernst OP. Crystal structure of the ligand-free G-protein-coupled receptor opsin. Nature. 2008;454:183–187. doi: 10.1038/nature07063. [DOI] [PubMed] [Google Scholar]
- 41.Knierim B, Hofmann KP, Gartner W, Hubbell WL, Ernst OP. Rhodopsin and 9-demethyl-retinal analog: effect of a partial agonist on displacement of transmembrane helix 6 in class A G protein-coupled receptors. The Journal of biological chemistry. 2008;283:4967–4974. doi: 10.1074/jbc.M703059200. [DOI] [PubMed] [Google Scholar]
- 42.Pardon E, et al. A general protocol for the generation of Nanobodies for structural biology. Nat Protocols. 2014;9:674–693. doi: 10.1038/nprot.2014.039. http://www.nature.com/nprot/journal/v9/n3/abs/nprot.2014.039.html - supplementary-information. [DOI] [PMC free article] [PubMed] [Google Scholar]
- 43.Whorton MR, et al. A monomeric G protein-coupled receptor isolated in a high-density lipoprotein particle efficiently activates its G protein. Proceedings of the National Academy of Sciences of the United States of America. 2007;104:7682–7687. doi: 10.1073/pnas.0611448104. [DOI] [PMC free article] [PubMed] [Google Scholar]
- 44.Kuszak AJ, et al. Purification and functional reconstitution of monomeric mu-opioid receptors: allosteric modulation of agonist binding by Gi2. The Journal of biological chemistry. 2009;284:26732–26741. doi: 10.1074/jbc.M109.026922. [DOI] [PMC free article] [PubMed] [Google Scholar]
- 45.Motulsky HJ, Mahan LC. The kinetics of competitive radioligand binding predicted by the law of mass action. Molecular pharmacology. 1984;25:1–9. [PubMed] [Google Scholar]
- 46.Caffrey M, Cherezov V. Crystallizing membrane proteins using lipidic mesophases. Nat Protocols. 2009;4:706–731. doi: 10.1038/nprot.2009.31. [DOI] [PMC free article] [PubMed] [Google Scholar]
- 47.Kabsch W. XDS. Acta Crystallographica Section D. 2010;66:125–132. doi: 10.1107/S0907444909047337. [DOI] [PMC free article] [PubMed] [Google Scholar]
- 48.McCoy AJ, et al. Phaser crystallographic software. Journal of Applied Crystallography. 2007;40:658–674. doi: 10.1107/S0021889807021206. [DOI] [PMC free article] [PubMed] [Google Scholar]
- 49.Emsley P, Cowtan K. Coot: model-building tools for molecular graphics. Acta Crystallographica Section D. 2004;60:2126–2132. doi: 10.1107/S0907444904019158. [DOI] [PubMed] [Google Scholar]
- 50.Afonine PV, et al. Towards automated crystallographic structure refinement with phenix.refine. Acta Crystallographica Section D. 2012;68:352–367. doi: 10.1107/S0907444912001308. [DOI] [PMC free article] [PubMed] [Google Scholar]
- 51.Chen VB, et al. MolProbity: all-atom structure validation for macromolecular crystallography. Acta crystallographica Section D, Biological crystallography. 2010;66:12–21. doi: 10.1107/S0907444909042073. [DOI] [PMC free article] [PubMed] [Google Scholar]
- 52.Lomize MA, Lomize AL, Pogozheva ID, Mosberg HI. OPM: Orientations of Proteins in Membranes database. Bioinformatics. 2006;22:623–625. doi: 10.1093/bioinformatics/btk023. [DOI] [PubMed] [Google Scholar]
- 53.Brooks BR, et al. CHARMM: The biomolecular simulation program. Journal of Computational Chemistry. 2009;30:1545–1614. doi: 10.1002/jcc.21287. [DOI] [PMC free article] [PubMed] [Google Scholar]
- 54.Jo S, Kim T, Im W. Automated Builder and Database of Protein/Membrane Complexes for Molecular Dynamics Simulations. PLoS ONE. 2007;2:e880. doi: 10.1371/journal.pone.0000880. [DOI] [PMC free article] [PubMed] [Google Scholar]
- 55.Jo S, Kim T, Iyer VG, Im W. CHARMM-GUI: A web-based graphical user interface for CHARMM. Journal of Computational Chemistry. 2008;29:1859–1865. doi: 10.1002/jcc.20945. [DOI] [PubMed] [Google Scholar]
- 56.Wu EL, et al. CHARMM-GUI Membrane Builder toward realistic biological membrane simulations. Journal of Computational Chemistry. 2014;35:1997–2004. doi: 10.1002/jcc.23702. [DOI] [PMC free article] [PubMed] [Google Scholar]
- 57.Case DA, et al. Amber 14. 2014 [Google Scholar]
- 58.Le Grand S, Götz AW, Walker RC. SPFP: Speed without compromise—A mixed precision model for GPU accelerated molecular dynamics simulations. Computer Physics Communications. 2013;184:374–380. [Google Scholar]
- 59.Salomon-Ferrer R, Goötz AW, Poole D, Le Grand S, Walker RC. Routine microsecond molecular dynamics simulations with Amber on GPUs. 2. Explicit solvent particle mesh Ewald. Journal of Chemical Theory and Computation. 2013;9:3878–3888. doi: 10.1021/ct400314y. [DOI] [PubMed] [Google Scholar]
- 60.Best RB, et al. Optimization of the Additive CHARMM All-Atom Protein Force Field Targeting Improved Sampling of the Backbone ϕ, ψ and Side-Chain χ1 and χ2 Dihedral Angles. Journal of Chemical Theory and Computation. 2012;8:3257–3273. doi: 10.1021/ct300400x. [DOI] [PMC free article] [PubMed] [Google Scholar]
- 61.Klauda JB, et al. Update of the CHARMM All-Atom Additive Force Field for Lipids: Validation on Six Lipid Types. The Journal of Physical Chemistry B. 2010;114:7830–7843. doi: 10.1021/jp101759q. [DOI] [PMC free article] [PubMed] [Google Scholar]
- 62.MacKerell AD, et al. All-atom empirical potential for molecular modeling and dynamics studies of proteins. The Journal of Physical Chemistry B. 1998;102:3586–3616. doi: 10.1021/jp973084f. [DOI] [PubMed] [Google Scholar]
- 63.MacKerell AD, Feig M, Brooks CL. Extending the treatment of backbone energetics in protein force fields: Limitations of gas‐phase quantum mechanics in reproducing protein conformational distributions in molecular dynamics simulations. Journal of computational chemistry. 2004;25:1400–1415. doi: 10.1002/jcc.20065. [DOI] [PubMed] [Google Scholar]
- 64.Vanommeslaeghe K, et al. CHARMM general force field: A force field for drug-like molecules compatible with the CHARMM all-atom additive biological force fields. Journal of Computational Chemistry. 2010;31:671–690. doi: 10.1002/jcc.21367. [DOI] [PMC free article] [PubMed] [Google Scholar]
- 65.Humphrey W, Dalke A, Schulten K. VMD: Visual molecular dynamics. Journal of Molecular Graphics. 1996;14:33–38. doi: 10.1016/0263-7855(96)00018-5. doi: http://dx.doi.org/10.1016/0263-7855(96)00018-5. [DOI] [PubMed] [Google Scholar]
Associated Data
This section collects any data citations, data availability statements, or supplementary materials included in this article.