Abstract
Transposable elements (TEs) comprise roughly forty per cent of mammalian genomes1. TEs have played an active role in genetic variation, adaptation, and evolution through the duplication or deletion of genes or their regulatory elements2-4 and TEs themselves can act as alternative promoters for nearby genes resulting in non-canonical regulation of transcription5,6. However, TE activity can lead to detrimental genome instability7, and hosts have evolved mechanisms to appropriately silence TE mobility8,9. Recent studies have demonstrated that a subset of TEs, endogenous retroviral elements (ERVs) containing long terminal repeats (LTRs), are silenced through trimethylation of histone H3 on lysine 9 (H3K9me3) by ESET (also known as SETDB1, SET domain bifurcated 1, or KMT1E)10 and a co-repressor complex containing KAP1 (KRAB-associated protein 1, also known as tripartite motif-containing protein 28, TRIM28)11 in mouse embryonic stem cells (ESCs). Here we show that the replacement histone variant H3.3 is enriched at class I and class II ERVs, notably early transposon (ETn)/MusD and intracisternal A-type particles (IAPs). Deposition at a subset of these elements is dependent upon the H3.3 chaperone complex containing ATRX (alpha thalesemia/mental retardation syndrome X)12 and DAXX (Death-associated protein 6)12-14. We demonstrate that recruitment of DAXX, H3.3, and KAP1 to ERVs are co-dependent and upstream of ESET, linking H3.3 to ERV-associated H3K9me3. Importantly, H3K9me3 is reduced at ERVs upon H3.3 deletion, resulting in derepression and dysregulation of adjacent, endogenous genes, along with increased retrotransposition of IAPs. Our study identifies a unique heterochromatin state marked by the presence of both H3.3 and H3K9me3 and establishes an important role for H3.3 in control of ERV retrotransposition in ESCs.
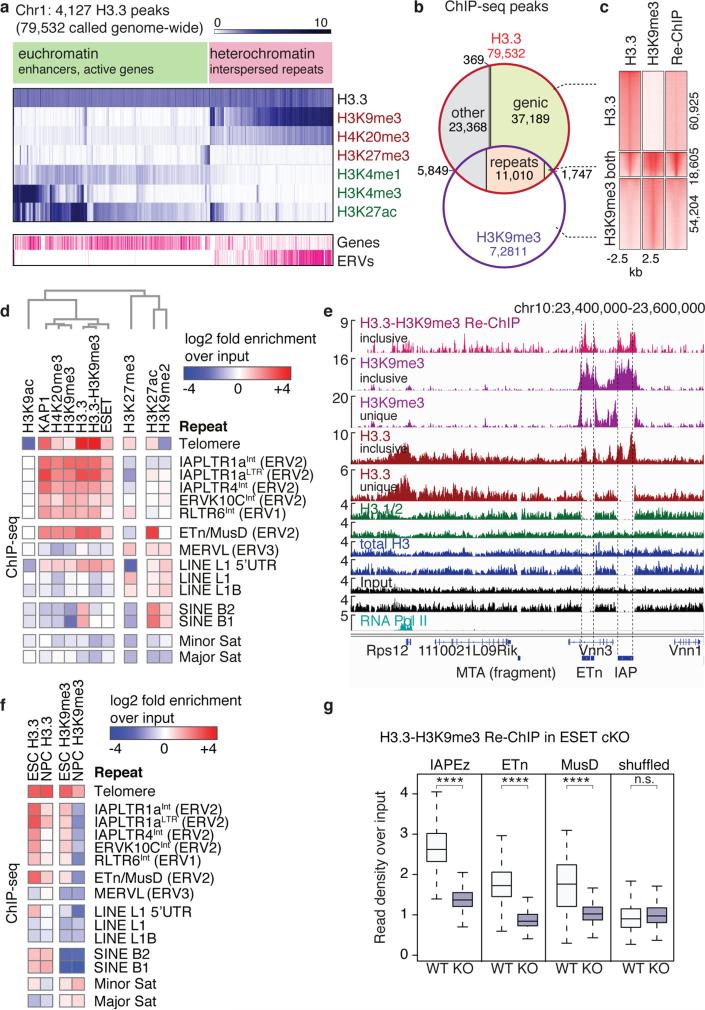
Deposition of the histone variant H3.3 has been linked to regions of high nucleosome turnover and has been traditionally associated with gene activation. However, we and others have demonstrated that H3.3 is incorporated into both facultative and constitutive heterochromatin12,15,16. Here, we used ChIP-seq to identify 79,532 regions of H3.3 enrichment across the entire mouse genome, including repetitive regions (see below and Methods for details of data analysis), and performed a hierarchical clustering of H3.3 with various chromatin modifications. Consistent with deposition at euchromatin and heterochromatin, we observe H3.3 associated with both active (e.g., H3K4me3, H3K27ac, H3K4me1) and repressed (e.g., H3K9me3, H3K27me3, H4K20me3) chromatin states (Fig. 1a). While most H3.3 peaks localized to genic regions and intergenic regulatory regions such as enhancers12, 23% (18,606/79,532) intersected with H3K9me3 peaks indicative of heterochromatic regions. Of these, 59% (11,010/18,606) localized to interspersed repeats (longer than 1kb) and only 9% (1,747/18,606) fell within genic regions (Fig. 1b). Sequential ChIP-seq (Re-ChIP) demonstrated co-enrichment of H3.3 and H3K9me3 at these regions (Fig. 1c).
Figure 1. H3.3 is co-enriched with H3K9me3 at class I and II ERVs associated heterochromatin.
a, Hierarchical (Spearman rank) clustering of H3.3 peaks on chromosome 1 with histone modifications associated with active (green) or repressed (red) chromatin states. Annotated genes and ERVs are shown. b, Venn diagram of H3.3 and H3K9me3 peaks demonstrating overlap at repetitive elements. c, ChIP-seq density heat maps for peaks classified as H3.3 only (n=60,925), both H3.3 and H3K9me3 (n=18,605), or H3K9me3 only (n=54,204). Color intensity represents normalized and globally scaled tag counts. d, ChIP-seq enrichment of H3.3 and heterochromatic histone modifications and factors mapped to the repetitive genome. Data are represented in a hierarchically (Spearman rank) clustered heatmap of log2 fold enrichment (red) or depletion (blue) over a matched input. See Extended Data Fig. 1 for complete heatmap. e, Genome browser ChIP-seq representations in ESCs. Read counts are normalized to total number of reads for each data set and exclude (‘unique’) or include (‘inclusive’) repetitive reads. f, ChIP-seq enrichment of H3.3 and H3K9me3 at various repeat regions in ESCs and NPCs. Data are represented as in panel d. g, Levels of co-enriched H3.3-H3K9me3 in control and ESET cKO ESCs. One-sided Wilcoxon signed rank test (**** = p<0.0001; n.s. = not significant).
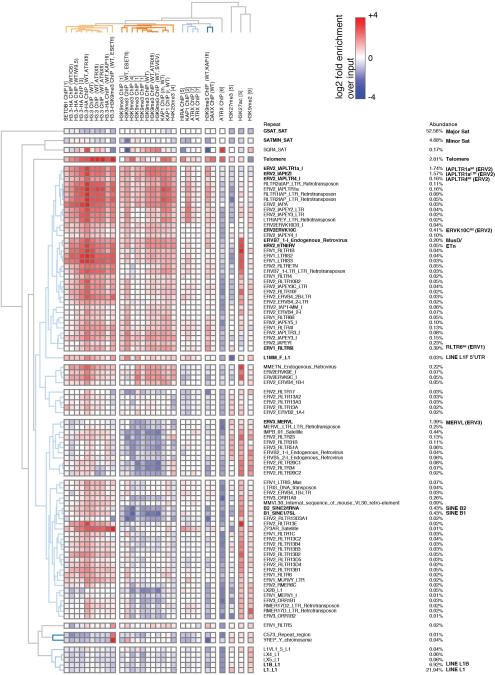
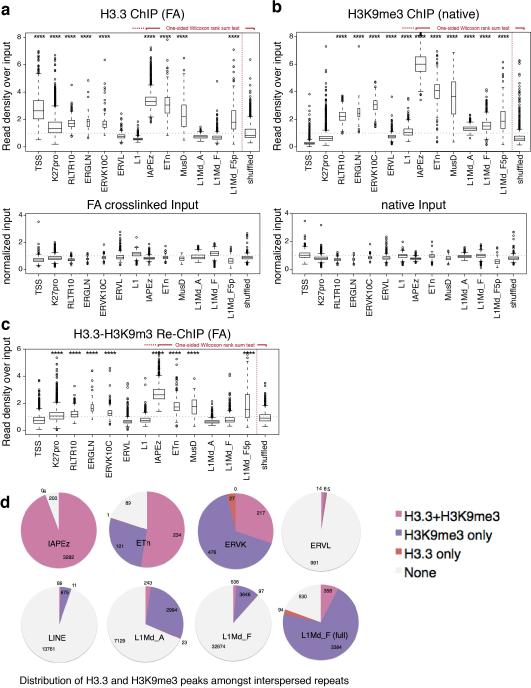
To identify repeat families that were associated with H3.3, we mapped our H3.3 ChIP-seq data to a comprehensive database of murine repetitive sequences17-19. Unbiased hierarchical clustering demonstrated a striking correlation between H3.3, H3K9me3, and H3.3-H3K9me3 Re-ChIP over class I and II ERVs, as well as enrichment of known silencing factors KAP1 and ESET (Fig. 1d and Extended Data Fig. 1). Class III ERVs and the non-LTR LINE and SINE elements carry little H3.3 and H3K9me3 but higher levels of H3K9me2. However, the promoter/5’ UTR of intact LINE1 elements are enriched with H3.3, H3K9me3, KAP1, and ESET (Fig. 1d and Extended Data Fig. 1), suggesting a related mechanism of repression. Analyzing individual well-annotated integration sites of ERVs5,20, we found that IAP and ETn/MusD ERVs, the most active transposons in the mouse genome21-23, are significantly enriched in H3.3 and H3K9me3 (Extended Data Fig. 2a-c), with 94% of IAP and 53% of ETn ERVs enriched with both H3.3 and H3K9me3 (Extended Data Fig. 2d).
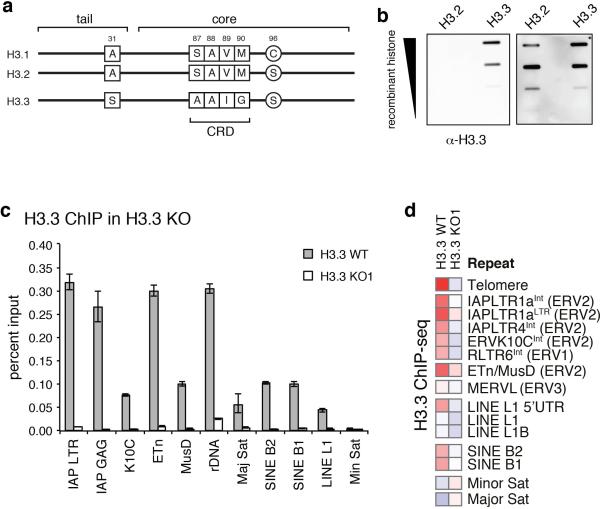
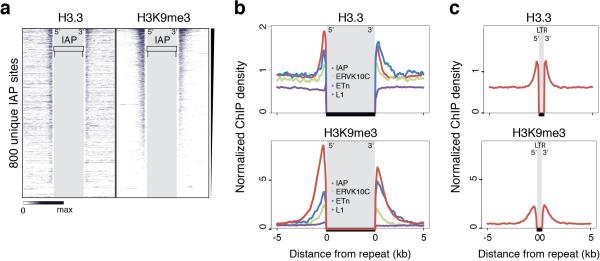
Repetitive regions provide a challenge to Next-Gen sequencing analysis due to the ambiguity arising from mapping short reads to non-unique sequences. Standard ChIP-seq alignments disregard reads that map to more than a single location in the genome, leaving gaps wherever the underlying sequence is non-unique (Fig. 1e, traces labeled ‘unique’). To include interspersed repeats, we allowed random assignment of ambiguously mappable reads to one of the best matches24 (Fig. 1e, traces labeled ‘inclusive’), effectively averaging counts over multiple occurrences of the same exact read match. As exemplified by ETn and IAP insertions downstream of the Vnn3 transcription start site, H3K9me3 is broadly enriched over the non-unique ERV sequence, whereas H3.3 appears more confined over 3’ and 5’ regions of the repeats (Fig. 1e). Neither ChIP-seq using an antibody recognizing only the canonical H3 isoforms (H3.1/2) nor an antibody recognizing all H3 isoforms (total H3; H3.3 constitutes ~10% of total H3 in ESCs) show enrichment at the corresponding regions (Fig. 1e), and H3.3 enrichment was lost in ESC lacking H3.316 (Extended Data Fig. 3). We were further able to detect both H3.3 and H3K9me3 in the uniquely mappable flanking sites of IAP and ETn ERVs, (Extended Data Fig. 4a,b). In addition to full ERVs, we found single (so-called ‘orphan’) LTRs to be enriched in both H3.3 and H3K9me3 (Extended Data Fig. 4c), suggesting that the LTR sequence itself is sufficient for the nucleation of H3.3 and heterochromatin factors.
H3.3 deposition has been linked to dynamic chromatin regions with high levels of nucleosome turnover and DNA accessibility. As H3.3 enrichment at ETn and IAP ERVs was comparable to levels found at active promoters in ESCs (Extended Data Fig. 2a, 5a; compare also to Rps12 enrichment in Fig. 1e), we tested whether ERVs were nucleosome-depleted in ESCs. Surprisingly, we found that ERVs showed low DNA accessibility compared to promoters of highly expressed genes with comparable H3.3 enrichment, as measured by DNase and MNase digestion25, and showed no signs of transcription as judged by RNA Pol II occupancy12 (Extended Data Fig. 5a). Notably, we find that newly synthesized H3.326 is rapidly incorporated at IAPs, despite the high levels of H3K9me3 and silent state (Extended Data Fig. 5b). Overall, our data suggest that a substantial fraction of H3.3 resides at ERVs in ESCs and constitutes a unique chromatin state fundamentally distinct from previously described combinations of histone variants and modifications.
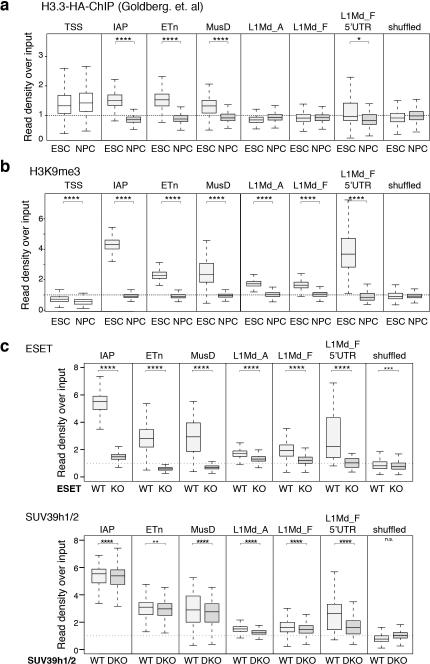
Previous studies have demonstrated that silencing of ERVs via H3K9me3 is unique to the pluripotent or embryonic state, with adult somatic tissues showing dependence upon DNA methylation for ERV repression. Concomitant with loss of H3K9me3, H3.3 enrichment is lost from IAP and ETn ERVs upon differentiation from ESC to NPCs (Fig. 1f and Extended Data Fig. 6a,b). These data suggest that, like H3K9me3, H3.3 may play a role in the embryonic establishment, but not the somatic maintenance, of this silenced chromatin state. Unlike H3K9me3, H3.3 is retained at telomeres upon differentiation (Fig. 1f), suggesting uncoupled or alternate mechanisms of repression from those functioning at ERVs.
H3K9me3 is facilitated by two histone methyltransferases, ESET and Suv39h1/2, that display distinct properties and regions of genomic activity. Previous studies demonstrate that ESET plays a critical role in the establishment of H3K9me3 at a large number of ERVs10, while Suv39h1/2 is involved in maintenance and spreading of H3K9me3 at a subset of repeat elements27. To elucidate which methyltransferase was responsible for establishing H3.3/H3K9me3 heterochromatin, we analyzed the effect of ESET and Suv39h1/2 knockout on H3K9me3 levels at H3.3-containing ERVs. We found that ESET was required for H3K9me3 at all H3.3-containing classes of repeats (Fig. 1g and Extended Data Fig. 6c). Suv39h1/2 deletion resulted in a small decrease of H3K9me3 at IAP and ETn/MusD elements, but greatly decreased H3K9me3 at intact LINE elements, including their 5’UTR (Extended Data Fig. 6c). In conclusion, the co-occurence of H3.3 and H3K9me3 facilitated by ESET methyltransferase activity defines a novel class of heterochromatin that functions at ERVs and intact LINE1 5’ ends.
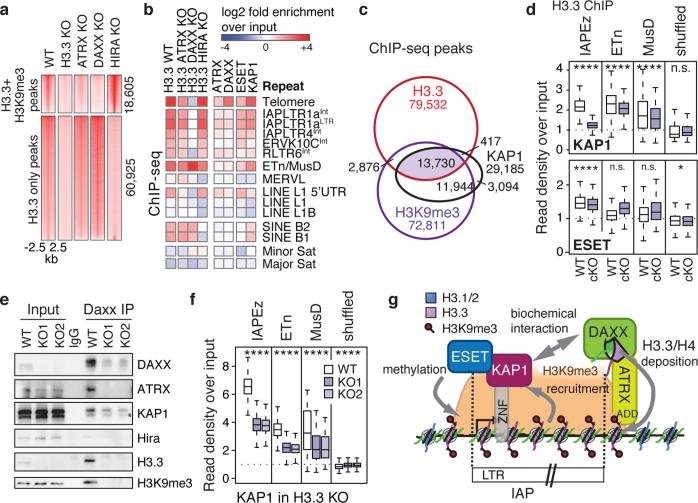
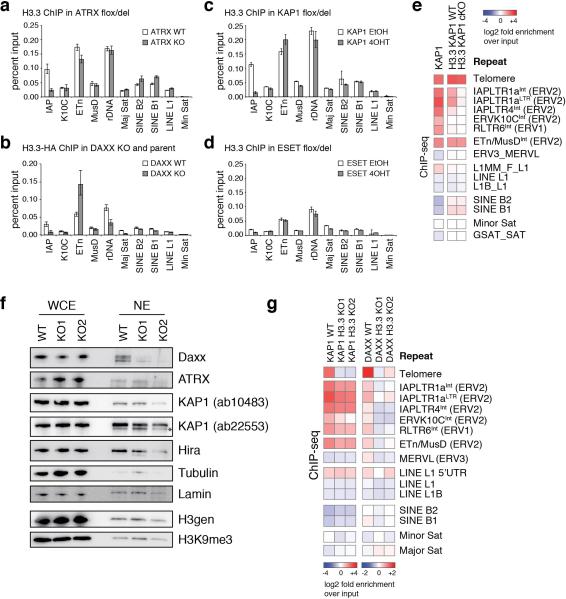
The histone variant H3.3 is incorporated at distinct regions of chromatin by either the HIRA or ATRX/DAXX histone chaperone complexes12-14. We and others previously demonstrated that HIRA is responsible for H3.3 enrichment at genic regions, while the ATRX/DAXX complex facilitates H3.3 deposition at simple repeat regions such as telomeres12,13,15. Using ChIP-seq, we found that DAXX and ATRX were responsible for H3.3 incorporation at regions enriched with both H3.3 and H3K9me3, while HIRA facilitated deposition at regions enriched with H3.3 alone (Fig. 2a). ATRX and DAXX deletion, but not HIRA, attenuated H3.3 enrichment at telomeres as well as at IAP ERVs, but not at ETn/MusD ERVs (Fig. 2b and Extended Data Fig. 7a,b), indicating that ATRX/DAXX is required for H3.3 enrichment at specific subclasses of ERVs. ChIP-seq analysis at repeats demonstrated that both DAXX and ATRX co-occupied class I and II ERVs enriched with KAP1 and ESET, as well as telomeres (Fig. 2b). To further understand the relationship between the corepressor KAP1 and ATRX/DAXX-dependent H3.3 deposition at ERVs, we mapped genome-wide enrichment of KAP1 and found that almost half (13,730/29,185) of the KAP1 peaks coincided with shared H3.3/H3K9me3 peaks (Fig. 2c). We therefore wanted to determine whether KAP1 played a role in targeting H3.3 deposition via recruitment of ATRX/DAXX. Indeed, H3.3 enrichment was reduced at IAP ERVs in the absence of KAP1 but was independent of ESET (Fig. 2d and Extended Data Fig. 7c-e), suggesting a novel role for KAP1 in recruitment of ATRX/DAXX.
Figure 2. DAXX/ATRX is responsible for H3.3 deposition at a subset of ERVs and co-localizes with ERV-specific heterochromatic factors.
a, ChIP-seq density heat maps for peaks classified as both H3.3 and H3K9me3 (n=18,605) or H3.3 only (n=60,925). Color intensity represents normalized and globally scaled tag counts. b, ChIP-seq enrichment of H3.3 chaperones and chaperone-dependent H3.3 deposition at repetitive regions. Data are represented in a heatmap of log2 fold enrichment (red) or depletion (blue) over a matched input. c, Venn diagram of H3.3, H3K9me3, and KAP1 peaks demonstrating substantial overlap in ESCs. d, Levels of H3.3 in control and KAP1 cKO (top) and control and ESET cKO (bottom) ESCs. One-sided Wilcoxon signed rank test (**** = p<0.0001; * = p<0.05; n.s. = not significant). e, Immunoblotting of DAXX immunoprecipitated from wild type or H3.3-null nuclear extracts showing co-immunoprecipitation with ATRX, H3.3, H3K9me3, and KAP1 independent of H3.3 (1% input). Asterisk denotes cross-reacting band. f, Levels of KAP1 in control and H3.3 KO ESCs. Data is presented as in panels d. g, Model of corepressor complex function at IAPs: KAP1 recognizes ERVs through sequence-specific KRAB zinc finger (ZNF) DNA binding proteins and recruits DAXX/ATRX independently of its interaction with ESET. DAXX/ATRX deposit H3.3 at IAPs, facilitating efficient KAP1 association with chromatin. ESET is then recruited, resulting in H3K9me3-mediated silencing of ERVs.
To determine whether KAP1 and ATRX/DAXX associated biochemically, we prepared nuclear extracts from ESCs. We found that DAXX coimmunoprecipitated its known complex member ATRX as well as its substrate H3.3 (Fig. 2e). Of note, DAXX-associated histone was enriched with H3K9me3 (Fig. 2e). In addition, DAXX coimmunoprecipitated KAP1 (Fig. 2e), suggesting that DAXX/ATRX and KAP1 can form a biochemical complex. Hira was not coimmunoprecipitated, demonstrating the specificity of the interaction. Given the requirement of H3.3 for DAXX folding28, we repeated DAXX immunoprecipitation from two independent ESC lines lacking H3.316 (Fig. 2e). While overall nuclear DAXX levels were reduced in the absence of H3.3 (Fig. 2e, Extended Data Fig. 7f), in agreement with a co-folding mechanism, the low levels of remaining DAXX maintained association with KAP1 (Fig. 2e), suggesting interaction independent of the H3.3 substrate.
We next wanted to determine whether the loss of H3.3 affected KAP1 or DAXX targeting to ERVs. Intriguingly, both KAP1 and DAXX recruitment to ERVs was reduced in the absence of H3.3, and telomere association was lost (Fig. 2f and Extended Data Fig. 7g). We cannot distinguish, however, if reduced enrichment of DAXX at chromatin is a result of KAP1 impairment or a direct consequence of reduced DAXX protein stability in the absence of H3.3. Together, these data suggest that H3.3, DAXX, and KAP1 are cooperative in their function related to ERV silencing (Fig. 2g). Intriguingly, while H3.3 enhances KAP1 and DAXX recruitment to ETn/MusD elements (Fig. 2f and Extended Data Fig. 7g), the variant remains enriched at these elements in the absence of the corepressor complex (Fig. 2b,d and Extended Data Fig. 7c-e).
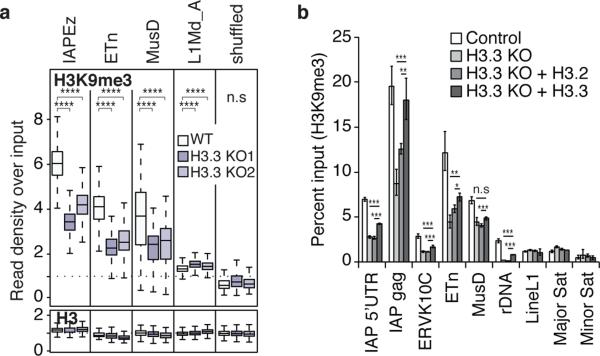
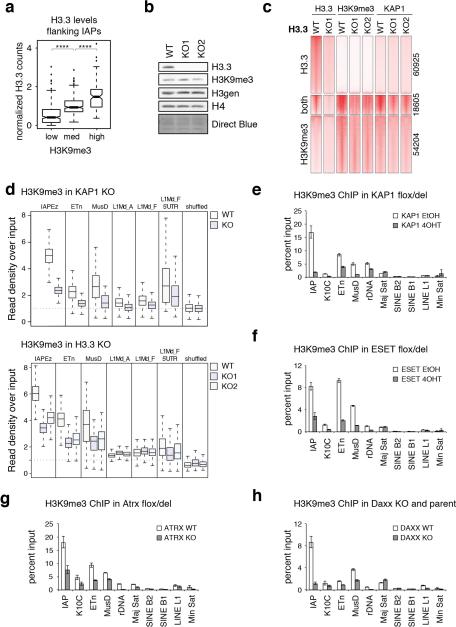
As we observed a positive correlation between H3K9me3 and H3.3 enrichment at IAP ERVs (Extended Data Fig. 4a, 8a), we next tested whether there was a functional link between H3.3 deposition and H3K9me3 establishment at specific subclasses of ERVs. While global levels of H3K9me3 were not affected by the loss of H3.3 (Extended Data Fig. 8b), we found that H3K9me3 was reduced specifically at peaks enriched with both H3.3 and H3K9me3, concomitant with a reduction of KAP1 occupancy (Extended Data Fig. 8c). Indeed, H3K9me3 levels were reduced up to 50% at IAP, ETn and MusD repeats in the absence of H3.3 (Fig. 3a). Importantly, nucleosome density was not reduced as evidenced by the overall maintenance of total H3 (Fig. 3a). Intriguingly, H3K9me3 levels were reduced at ETn/MusD elements in the absence of DAXX, ATRX, KAP1, or ESET (Extended Data Fig. 8d-h), while H3.3 enrichment at these elements was independent of the corepressor complex (Fig. 2 and Extended Data Fig. 7), suggesting a multifaceted mechanism in which both H3.3 deposition and corepressor complex recruitment contribute to ERV silencing.
Figure 3. H3.3 is required for the maintenance of H3K9me3 at specific class I and II ERVs.
a, Levels of H3K9me3 and total H3 in control and H3.3 KO ESCs. One-sided Wilcoxon signed rank test (**** = p<0.0001; n.s. = not significant). b, ChIP-qPCR analysis of H3K9me3 enrichment at various repeat regions in control ESCs and H3.3 KO ESCs exogenously expressing either H3.2 or H3.3. Error bars represent s.d. from one experiment (n=3). Data are representative of 3 independent ChIP experiments. (* p<0.05, ** p<0.01, *** p<0.001, t-test).
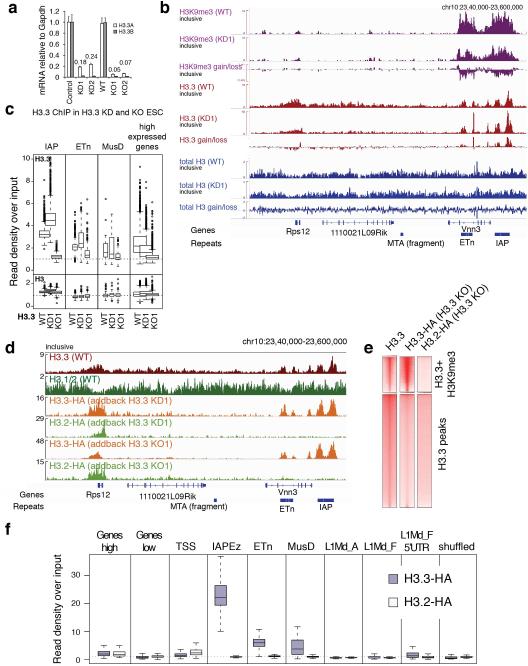
Intriguingly, ERVs retained H3.3 to a larger extent than other regions in ESCs RNAi-depleted of H3.3 (H3.3 KD16; Extended Data Fig. 9a-c), suggesting they may act as ‘sinks’ for the remaining low levels of H3.3 present in H3.3 KD ESCs. Further, exogenously expressed H3.3, but not H3.2, in both H3.3 KO and H3.3 KD ESCs was focally enriched at IAP ERVs (Extended Data Fig. 9d-f). Importantly, exogenous expression of H3.3, but not H3.2, was able to partially rescue the loss of H3K9me3 at specific repeat regions (Fig. 3b). Together, these data suggest a direct and variant-specific role for H3.3 in establishing H3K9me3 chromatin at a subset of ERVs that cannot be compensated by the canonical H3.1/2 isoforms.
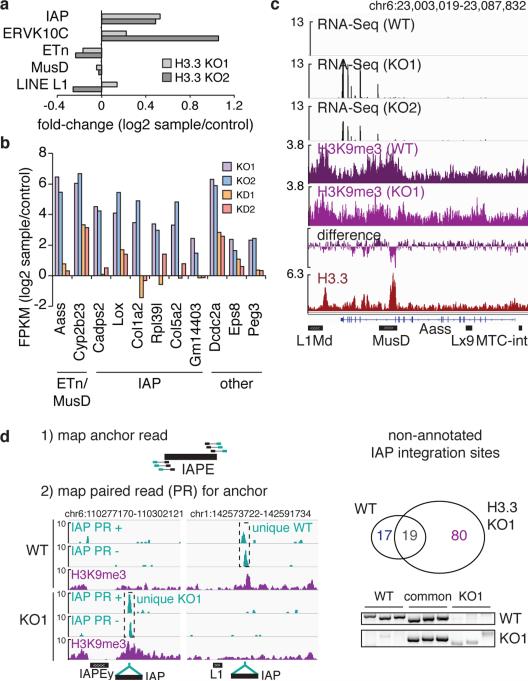
As H3K9me3 is known to be required for silencing of ERVs10, we tested whether loss of H3.3 would cause a derepression of ERVs concomitant with reduction of H3K9me3 levels. RNA-seq demonstrated a moderate increase in global transcripts from IAPs, but not ETn/MusD ERVs (Fig. 4a). Since ERVs have recently been shown to control expression of nearby genes5,6, we next tested whether endogenous genes that were deregulated in H3.3 KO ESCs were proximal to ERVs. While the majority of ERVs are neutral to neighboring genes, a number of genes in the vicinity of ERVs were highly upregulated (Fig. 4b and Extended Data Figure 10a), including the known Cyp2b23 and a new putative chimeric transcript originating from a MusD element within the Aass gene (Fig. 4c). Notably, the same set of transcripts was upregulated in H3.3-depleted ESCs, albeit at a lower level (Fig. 4b, KO1/2 vs. KD1/2), suggesting that the remaining H3.3 is partially functional in maintaining silent ERVs.
Figure 4. Loss of H3.3 leads to ERV derepression.
a, RNA-seq analysis of repeat transcripts. Data are represented as log2 change in transcript over control for H3.3 KO1 and KO2 ESCs. b, RNA-seq analysis of transcripts with nearby ERVs that are significantly upregulated in H3.3 KO1 and KO2 (q<0.05) (see Extended Data Figure 10a). Data are represented as in panel a. Nearby ERV classes are indicated. c, Representative example of an upregulated transcript in the absence of H3.3. RNA-seq tracks (black) show all reads mappable to the genome (without restriction to known transcripts). H3K9me3 (purple and violet) and H3.3 (red) tracks show inclusive reads as standardized read densities. The relative H3K9me3 difference between WT and KO is shown in a separate track (‘difference’). d, Paired-end based de-novo discovery of non-annotated IAP integration sites in control and H3.3 KO1 ESCs (for details see Methods). Venn diagram and PCR genotyping validation of non-annotated IAP integration sites in control and H3.3 KO1 ESCs.
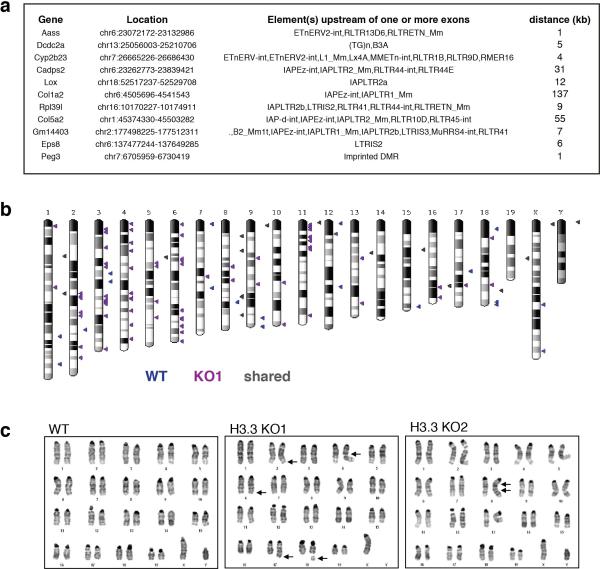
We hypothesized that ERV desilencing should result in increased ERV mobility. Paired-end sequencing of genomic DNA identified 80 non-annotated IAP integrations unique to H3.3 KO ESCs, and only 17 unique to wild type ESCs (Fig. 4d and Extended Data Fig. 10b). As derepressed IAPs have been shown to cause chromosome rearrangements, we analyzed H3.3 KO ESCs for increased genome instability. Indeed, karyotypic analysis of H3.3 KO ESCs showed a number of chromosomal abnormalities not observed in the wild type control (Extended Data Fig. 10c). Despite these observations, we cannot exclude that genomic instability in H3.3 KO ESCs might result from a loss of function unrelated to retrotransposon silencing29,30.
We have uncovered an unexpected role for histone variant H3.3 in the establishment of heterochromatin. We demonstrate a hierarchy for deposition of H3.3, favoring DAXX/ATRX-mediated chromatin assembly at ERVs over transcription-associated deposition. We propose a model in which H3.3-containing chromatin facilitates the recruitment of KAP1 to ERVs, which in turn recruits DAXX/ATRX for the maintenance of H3.3 chromatin, thus creating a positive feedback or propagation loop. This mechanism acts synergistically with ESET-mediated H3K9me3 in maintaining a silent chromatin state at ERVs. Our data also suggests an H3.3-independent function of DAXX/ATRX in maintaining H3K9me3, possibly related to an architectural role in a larger corepressor complex with KAP1 and ESET. Our findings solidify our emerging understanding of the importance of the histone variant H3.3 in the establishment of silenced chromatin states and maintenance of genome stability.
Methods
ESC culture
ESCs were cultured under standard conditions (KO-DMEM, 2 mM Glutamax, 15% ES grade fetal bovine serum, 0.1 mM 2-mercaptoethanol, and leukemia inhibitory factor (LIF)). H3.3 KO/KD ESCs were C57Bl/6J background. H3.3 KO ESCs were a mixed 129×C57Bl/6J background. Generation of H3.3 KO/KD and H3.3 KO ESCs were previously described16. For early passages, cells were maintained on an irradiated feeder layer. To remove feeders, cells were passaged at least two passages off of feeders onto gelatin-coated plates. ESCs were routinely tested for mycoplasma.
Chromatin immunoprecipitation (ChIP)
Native ChIP assays (H3K9me3, H3.3-HA) were performed with approximately 2×10⁷ ESCs per experiment. Cells were subject to hypotonic lysis and treated with micrococcal nuclease to recover mono- to tri-nucleosomes. Nuclei were lysed by brief sonication and dialyzed into N-ChIP buffer (10 mM Tris pH 7.6, 1 mM EDTA, 0.1% SDS, 0.1% Na-Deoxycholate, 1% Triton X-100) for 2 h at 4 °C. Soluble material was recovered (~70%) and incubated with 3-5 μg of antibody bound to 75 μL protein A Dynal magnetic beads (Invitrogen) and incubated overnight at 4 °C, with 5% kept as input DNA. Magnetic beads were washed, chromatin was eluted, and ChIP DNA was dissolved in 10 mM Tris pH 8.
Crosslinking ChIP assays (H3gen, H3.1/2, H3.3, H3K9me3, DAXX, KAP1) were performed with approximately 2×10⁷ ESCs per experiment. Cells were crosslinked with 1% paraformaldehyde (PFA) for 10 min at room temperature and quenched by glycine at a final concentration of 0.125 M. Chromatin was sonicated to an average size of 0.3-0.7 kb using a Biorupter (Diagenode). Purified nuclei were resuspended in X-ChIP buffer (10 mM Tris pH 8, 100 mM NaCl, 1 mM EDTA, 0.5 mM EGTA, 0.1% Na-Deoxycholate, 0.5% N-lauroylsarcosine) and incubated with 3-5 μg of antibody bound to 75 μL protein A Dynal magnetic beads (Invitrogen) and incubated overnight at 4 °C, with 5% kept as input DNA. Magnetic beads were washed, chromatin was eluted, and ChIP DNA was dissolved in 10 mM Tris pH 8.
Antibodies
H3 general (ab1791, Abcam), H3.3 (09-838, Millipore), H3.1/2 (ABE154, Millipore), H4 (rabbit antiserum), H3K9me3 (ab8898, Abcam), Hira (mouse monoclonal WC15 and WC119), DAXX (sc-7152, Santa Cruz Biotechnology), ATRX (sc-15408, Santa Cruz Biotechnology), KAP1 (ab22553, Abcam; ab10483, Abcam), Tubulin (TUB2.1, Sigma), Lamin (ab26300, Abcam), normal rabbit IgG (12-370, Millipore).
Nuclear Extract Preparation
ESCs were harvested from 60 15-cm dishes at 80% confluency. Cell pellets were resuspended in 150 mL hypotonic lysis buffer (20 mM HEPES pH 7.9, 10 mM KCl, 5 mM MgCl2, 0.5 mM EGTA, 0.1 mM EDTA, 5 mM 2-mercaptoethanol, 0.4 mM PMSF) and homogenized (dounce 10× A, 5× B). Cell lysis was confirmed by trypan blue staining. Nuclei were harvested for 5 min at 1,900 × g at 4 °C. Nuclei were resuspended in 45 mL buffer (20 mM HEPES pH 7.9, 110 mM KCl, 2 mM MgCl2, 0.1 mM EDTA, 5 mM 2-mercaptoethanol, 0.4 mM PMSF, 1× complete protease inhibitor cocktail (Roche)). One-tenth volume saturated (NH4)2SO4 pH 7.5 (final concentration ~400 mM) was added and lysates were incubated for 20 min at 4 °C rotating. Lysates were clarified for 90 min at 35,000 rpm at 4 °C. Protein complexes were precipitated by slow addition of (NH4)2SO4 to 60% saturation and collected for 10 min at 13,000 rpm at 4 °C. Precipitated complexes were resuspended by dialysis in immunoprecipitation buffer (20 mM HEPES pH 7.9, 200 mM KCl, 0.01% NP-40, 5 mM 2-mercaptoethanol, 0.4 mM PMSF) and concentration was determined by Bradford assay.
Immunoprecipitation
5 μg antibody bound to 25 μL Dynabeads was incubated with 1 mg of ESC nuclear extract for 3 hrs at 4 °C. Beads were washed four times with 1 mL buffer (20 mM HEPES pH 7.9, 400 mM KCl, 0.01% NP-40, 5 mM 2-mercaptoethanol, 0.4 mM PMSF) and eluted in 1× SDS loading buffer.
Datasets
The following published NGS datasets were meta-analyzed in this study: ChIP - RNA pol II (CTD4H8), H3.3-HA in HiraWT, Hiranull, C57Bl/6J ESC and Neuronal Precursor Cells12; ATRX31; ESET32; H3K9me3 and SUV39h1/227; H4K20me317; H3K9me233; H3K4me1, H3K4me3, H3K27me3, H3K27ac, H3.3-HA from C57Bl/6J ESC16 DNAse I Hypersensitivity (ENCODE U Wash), MNase accessibility25 RNA-seq in H3.3B-HA and H3.3 KO/KD C57Bl/6J ESC16. Datasets used for individual figure panels are described in Supplementary Information Table 1.
ChIP-seq Analysis
ChIP-seq libraries were prepared according to the Illumina protocol and sequenced with the HiSeq 2000. Raw reads in FASTQ format were aligned to the mouse genome version mm9 with Bowtie34 using -m 1 --best parameters for unique alignments and -M 1 --best parameters for inclusive alignment of non-unique reads. The former parameters instruct Bowtie to report a maximum of one match per read and discard any read that cannot be mapped to a unique best match. The –M 1 --best parameters ensure that only one alignment is reported for each read. This is either the single best alignment or, if more than one equivalent best alignment is found, one of those matches selected randomly. Input DNA mapped using the latter parameters extends evenly over the repeat classes analyzed in this study (namely IAP, ETn, MusD and L1 elements), confirming a proportional representation of those repetitive sequences relative to the unique genome (Extended Data Fig. 2a,b).
Bowtie SAM output files were converted to sorted BAM files using SAMtools35. For unique alignments, duplicate reads were filtered using the rmdup function of SAMtools. Wig files were created from BAM files using IGVTools count function (The Broad Institute) and scaled to a genome-wide average read density of 1 using java-genomic-toolkit wigmath.Scale function (As a reference, 17.5 Mio mapped reads at a fragment size of 150 bp yield an average genome-wide read density of 1 for mm9). Figures of these continuous tag counts over selected genomic intervals were created in the IGV browser (The Broad Institute).
Repetitive Genome ChIP-seq Analysis
The current build of rodent repeat sequences was downloaded from Repbase (http://www.girinst.org/repbase/) and filtered for Mus Musculus sequences. A bowtie index was created with bowtie-build. Raw ChIP-seq FASTQ reads were mapped to the repetitive sequence database using bowtie --best and -k 1 options. A table of mapped short read counts per repetitive element were extracted from bam file using SAMtools idxtats function. Further analysis was performed with R and visualized as heatmaps using GENE-E. Mapped read counts were expressed as a fraction of total mapped repetitive reads for each sample. For enrichment analysis, normalized read counts of ChIP samples were divided by normalized read counts of a matched input sample and expressed as log2 fold enrichment. In addition, the following quality controls were performed: read distribution across the repetitive sequence was inspected using IGV genome browser for each repeat family to confirm coverage of the whole repetitive sequence. To avoid over- or underestimating fold-enrichments due to low sequence representation, repetitive sequences with consistently less than ~100 mapped reads per sample or control were excluded from analysis.
Peak calling
Peaks were called for H3.3, H3K9me3 and total H3 ChIP-seq datasets from control C57Bl/6J ESCs16, including non-unique reads. MACS ChIP-seq peak-finding was performed against a matched input using cutoffs values --pvalue 1e-6 --mfold 10,50. 79,532, 72,811, and 29,189 peaks were called for H3.3, H3K9me3, and KAP1, respectively. For total H3, only 996 peaks were called with the same parameters.
Enrichment analysis over H3.3 peaks (Figure 1a)
Enrichment of H3.3 and histone modifications over H3.3 peaks were calculated as follows: Average ChIP-seq read densities over the peak interval defined in the MACS36 bed output file were extracted from normalized wig files using the java-genomics-toolkit ngs.IntervalStats function (Tim Palpant, http://palpant.us/java-genomics-toolkit/). ChIP-seq enrichment for each interval was normalized subsequently, dividing the mean read density of the ChIP-seq sample by the corresponding density of the matched input sample. Data was visualized in a heatmap as log2 fold enrichment over input and clustered with GENE-E (The Broad Institute).
Enrichment analysis over repetitive and unique genomic regions (Figures 1g, 2d, 2f, 3a, Extended Data Figures 2a-c, 5, 6, 8d, 9c, 9f)
Intervals were derived from following sources: Transcription start sites (TSS) of ~ 2000 highly active genes previously shown to be enriched in H3.3 were defined as intervals from −1kb to +1kb around their annotated TSS. H3K27me3-containing promoters (K27pro) were previously characterized16. Curated sets of IAP, IAPd, RLTR10, ETn, MusD, ERGLN, ERVK10C6 and L1Md_A27 repeat locations were used. Additional intact IAP elements were identified using the BLAT function of USCS and combined with the existing IAP dataset. Intact LINE L1Md_F promoters/5'UTR were identified in the reference genome using BLAT with the RepBase sequence L1MM_F_L1.
Enrichments over these intervals were calculated as described above from normalized ChIP and input wig files using wigmath.IntervalStats. Log2 fold enrichments over individual intervals were summarized using R in boxplots (Tuckey box-and-whisker plots using R boxplot defaults). Specifically, the box indicates median, as well as upper and lower quartile of the data. Whiskers extend to the most extreme datapoint within 1.5-times the interquartile range (IQR). Outliers are not shown. Significance levels were calculated using Wilcoxon tests and represented with following convention: n.s. = p>0.05; * = p<0.05; ** = p<0.01; *** = p<0.001; **** = p<0.0001.
Peak profile heatmaps (Figures 1c, 2a, Extended Data Figures 8c 9e)
Peak profile heatmaps were calculated using ngsplot37 over a 5kb window around the MACS peak centers (parameters: −SC global −I 0 −L 2500 −MQ 0 −RB 0.05) from BAM files using the inclusive mapping procedure. Datasets are normalized to total read counts and all maps are represented on the same global scale.
Analysis regions flanking repetitive elements (Extended Data Figure 4)
Profiles were calculated from uniquely-mapped reads only, i.e. non-unique reads and PCR duplicates were discarded before calculating the coverage using IGVtools count function (see above). Profiles over flanking regions were aggregated using the sitepro function from the CEAS suite38 with the following modifications: profiles were not centered over the element but instead separately collected for the 3’ and 5’ flanking regions. The mean of the profiles in two, 5’ and 3’, 500bp windows was extracted for each interval as an approximation of enrichment over the central, repetitive, interval. Profiles were either visualized as heatmap (using GENE-E), or averaged into a single plot (CEAS sitepro). Wig files were normalized to a global average of 1, thus the ordinate of the profile plot represents fold-enrichment/depletion over a random genome-wide distribution of reads.
RNA-seq Preparation and Analysis
RNA was isolated using QIAGEN RNeasy. Libraries were prepared according to the Illumina TruSeq protocol and were sequenced on the HiSeq 2000. Resulting reads (101 nt) were aligned to the mouse genome (mm9) using TopHat39. Gene expression level measured as FPKM was determined by the maximum likelihood estimation method implemented in the Cufflinks software package with annotated transcripts as references. Differential expression was analyzed using the Student's t test in the program Cuffdiff40 with p values corrected for multiple testing.
De-novo mapping of unannotated ERVs
Genomic DNA from H3.3 WT and KO1 ESC was sheared to an average of 500bp. Illumina paired-end sequencing was performed with 50bp reads length. ERVs were mapped to the reference genome in a two-step procedure. First, all reads were mapped to a genome consisting of all RepBase sequences belonging to specific ERV class (e.g. IAPs), using Bowtie2. Next, unpaired read pairs (where one mate matched an ERV sequence but the other could not be aligned) were extracted using samtools and mapped to the mm9 reference genome using Bowtie (allowing only for uniquely mappable reads). This strategy allowed us to anchor each ERV integration site with up to 10 uniquely mappable reads on either side of the repetitive sequence. +/− strand specific wig coverage tracks were created using IGVTools, extending reads to 500bp. We took advantage of the fact that left-hand anchor reads mapped exclusively to the + strand and right-hand anchor reads to the − strand. Thus, while existing ERVs were demarcated by a + peak on the left and − peaks on the right of the repeat sequence, non-annotated integration sites were characterized by a + peak directly overlapping with a − peak at the insertion site. + and − peaks were identified separately using the FindOutlierRegion of java genomics toolkit on split + and − wig files. Peak intervals were then intersected to find overlapping +/− peaks. WT and KO1 ESC peaks were intersected and new integration sites were only called if a +/− peak did not overlap with a − or + peak in the respective control dataset. IAP integration sites were validated by genotyping, using primer pairs spanning a ~300bp region between the IAP LTR and the unique flanking region.
Extended Data
Extended Data Figure 1. H3.3 and H3K9me3 correlate within the mouse repetitive mESC genome.
Related to Figure 1. Hierarchically (Spearman Rank) clustered heatmap showing occupancy of histone H3.3 and known heterochromatic histone modification and factors over a comprehensive set of mouse repetitive sequences (see Methods for details). Published datasets used are listed in the Methods section. Data is represented as log2 fold enrichment over matched inputs for each ChIP dataset. Repeats with less then 0.01% abundance are omitted.
Extended Data Figure 2. H3.3 and H3K9me3 co-occupy class I and II ERVs.
Related to Figure 1. a, Direct comparison of H3.3 enrichment at genic and repetitive sites. Box plot (top) showing enrichment of H3.3 over sets of intervals either representing genic or repetitive elements5 annotated in the reference genome, using inclusive read mapping. H3.3 ChIP was performed using an H3.3 antibody and FA crosslinking in H3.3 WT cell line. H3.3 enrichment is shown as standardized ChIP-seq read density divided by the standardized input read density on a per-interval basis. The width of the box is proportional to the number of intervals in each group. TSS are transcription start sites of highly active genes; K27pro are bivalent promoters16. Box plot (bottom) is showing the input read density (standardized by scaling to a genome-wide mean of 1), confirming the even representation of unique and repetitive sequences resulting from the inclusive mapping procedure (see Methods for details). Result of one-sided Wilcoxon rank sum test against a set of randomly selected genomic intervals (shuffled) is indicated (**** = p < 0.0001) b, H3K9me3 enrichment at genic and repetitive sites. H3K9me3 ChIP was performed using MNase digestion under native conditions. Box plot (top) showing enrichment of H3K9me3 over sets of intervals either representing genic or repetitive elements analogous to a. Box plot (bottom) is showing the input read density analogous to a. Result of one-sided Wilcoxon rank sum test against a set of randomly selected genomic intervals (shuffled) is indicated (**** = p < 0.0001). c, Sequential H3.3 and H3K9me3 (Re)-ChIP at genic and repetitive sites. Boxplots showing enrichment of Re-ChIP inclusive read mapping relative to an input control. Result of one-sided Wilcoxon rank sum test against a set of randomly selected genomic intervals (shuffled) is indicated (**** = p < 0.0001). d, Co-occupancy of H3.3 and H3K9me3 at specific classes of ERVs. H3.3 and H3K9me3 peak intervals were independently intersected with annotated ERVs5 and their co-ocurrences within the same ERV were evaluated. L1Md_F (full) is a subset of L1Md_F, comprising only full length repeats (>5 kb). All Pie charts include total number of intervals for each family that had none, (at least) one H3.3 peak (H3.3 only), or H3K9me3 peak(s) (H3K9me3 only), or at least one of each (H3.3+H3K9me3).
Extended Data Figure 3. Generation of H3.3-isoform specific antibodies.
Related to Figure 1. a, Schematic of amino acid sequence differences for the canonical histones H3.1 and H3.2 versus the histone variant H3.3. H3.3 differs from H3.2 or H3.1 at only 4 or 5 amino acids, positions 31, 87, 89, 90, and 96 as indicated. b, Immunoblot against recombinant histones using the final purified antibody (Millipore 09-838), confirming specificity of H3-isoform specific antibodies. c, ChIP-qPCR analysis of H3.3 enrichment at various repeat regions in control and H3.3 KO ESCs. Error bars represent s.d. from one experiment (n=3). d, ChIP-seq enrichment of H3.3 at repetitive regions of the mouse genome in control and H3.3 KO ESCs. Data are represented in a heatmap of log2 fold enrichment (red) or depletion (blue) over a matched input.
Extended Data Figure 4. H3.3 is enriched in regions flanking ERVs and orphan LTRs.
Related to Figure 1. a, ChIP-seq density heat maps for unique sites flanking full-length IAP ERVs (n=800) rank ordered by H3K9me3 enrichment. Color intensity represents normalized and globally scaled tag counts. b, H3.3 (top panel) and H3K9me3 (bottom panel) enrichment over regions flanking IAP, ERVK10C, ETn ERVs and L1 elements. H3.3 ChIP-seq was performed with FA crosslinking, H3K9me3 ChIP-seq under native conditions. Average profiles were aligned and aggregated at the 5’ and 3’ boundaries of hundreds of annotated elements from standardized unique read count coverage tracks. The profiles are directional with the 5’ ends on the left and 3’ end on the right. c H3.3 (top panel) and H3K9me3 (bottom panel) enrichment over regions flanking single (so-called orphan) IAP LTRs, ~500 bp. Orphan LTRs are the result of a recombination event between two LTRs – usually the 3’ and 5’ LTRs of the same ERV – effectively deleting the internal coding sequence. ~600 full-length LTRs (~500 bp) enriched in H3.3 and H3K9me3 were identified in the mouse genome and aggregated for the profiles.
Extended Data Figure 5. H3.3 at IAPs is not associated with transcription, DNase I or MNase sensitivity.

Related to Figure 1. a, Direct comparison of chromatin properties at transcription start sites (TSS) of highly expressed genes and IAP ERVs. Box plots showing (from left to right) comparable enrichment of H3.3; DNase I sensitivity; MNase sensitivity; Elongating RNAP2 occupancy. MNase datasets are from a recent study, showing H3.3 localizing to MNase hypersentitive regions such as active promoters25; In this study, MNase sensitivity was assessed by sequencing nucleosomes released under mild (‘short’) or extensive (‘long’) MNase digestion conditions; MNase hypersensitive sites were shown to be specifically enriched by mild MNase digestion, where as long digestion released chromatin more evenly25. b, Comparison of kinetics of H3.3 incorporation26 at the TSS of highly expressed genes and IAP ERVs; as control, a randomized set of intervals are shown.
Extended Data Figure 6. H3.3 and ESET-dependent H3K9me3 enrichment at IAPs is lost upon differentiation.
Related to Figure 1. a and b, Comparison of H3.3 (a) and H3K9me3 (b) enrichment at the TSS of highly expressed genes and various repeat classes in ESC and neuronal precursor cells using inclusive read mapping. H3.3 ChIP was performed using a genomic knock-in tagged H3.3B-HA and FA crosslinking12. H3K9me3 ChIP was performed using FA crosslinking17. Enrichment is shown as standardized ChIP-seq read density divided by the standardized input read density on a per-interval basis. Result of one-sided Wilcoxon signed rank test (NPC vs ESC) are shown (**** = p<0.0001; *** = p<0.0005; ** = p<0.005; * = p<0.05; no annotation = not significant). c, Levels of H3K9me3 enrichment in control and ESET KO ESCs (top) or control and SUV39h1/2 KO ESCs27 (bottom) at various repeat classes. Data are represented as in panels a and b.
Extended Data Figure 7. Contribution of DAXX, ATRX, KAP1, and ESET to H3.3 enrichment at ERVs.
Related to Figure 2. a-d, ChIP-qPCR analysis of H3.3 enrichment at various repeat regions in control and ATRX KO (a), DAXX KO (b), KAP1 KO (c), and ESET KO (d) ESCs. Error bars represent s.d. from one experiment (n=3). Data are representative of 2 independent ChIP experiments. e, ChIP-seq enrichment of KAP1 and H3.3 in control and KAP1 KO ESCs at repetitive regions of the mouse genome. Data are represented in a heatmap of log2 fold enrichment (red) or depletion (blue) over a matched input. f, Loss of H3.3 reduces nuclear DAXX levels. Immunoblot from whole cell extracts (WCE) or nuclear extracts (NE) in the presence and absence of H3.3. Asterisk denotes cross-reacting band. g, ChIP-seq enrichment of KAP1 and DAXX in control and H3.3 KO ESCs. Data are represented as in panel e. Note the different color scale used for KAP1 and DAXX.
Extended Data Figure 8. Effects of H3.3 and corepressor complex depletion on H3K9me3 heterochromatin.
Related to Figure 3. a, Positive correlation of H3.3 and H3K9me3 at IAP ERVs. H3.3 ChIP-seq enrichment at 800 unique IAP flanking regions (see Fig. 1e) was binned into three groups by their H3K9me3 ChIP-seq enrichment (low, medium and high). Wilcoxon rank sum test (****=p<0.0001). b, Immunoblot from ESC whole cell lysates in the presence and absence of H3.3. c, H3.3, H3K9me3 and KAP1 ChIP-seq density heat maps for peaks classified as H3.3 only (n=60,925), both H3.3 and H3K9me3 (n=18,605), or H3K9me3 only (n=54,204) in control and H3.3 KO ESC. 5kb intervals around peak centers are shown. Color intensity represents normalized and globally scaled tag counts. d, Levels of H3K9me3 at IAP, ETn, MusD ERVs and LINE elements in control and KAP1 KO ESCs (top) and control and H3.3 KO ESCs (bottom). Box plots show enrichment over matched input. e-h, ChIP-qPCR analysis of H3K9me3 at various repeat regions in control and KAP1 KO (e), ESET KO (f), ATRX KO (g), and DAXX KO (h) ESCs. Error bars represent s.d. from one experiment (n=3). Data are representative of 2 independent ChIP experiments.
Extended Data Figure 9. Global effects of H3.3 depletion.
Related to Figure 3. a, H3.3 transcript levels in control, H3.3 KD, and H3.3 KO ESCs. Data are represented as mean expression relative to Gapdh ± s.d. (n=3). b, Relative gain/loss upon H3.3 knockdown of H3K9me3, H3.3, and total H3 are shown over a section of chr10 containing the highly transcribed Rps12 gene and several ERVs. Gain/loss tracks are calculated by subtracting the respective control from H3.3 KD1 tracks, both standardized to a global mean of 1. Note that H3.3 ChIP-seq data in KD1 cells represents the remaining 10% H3.3. The global loss of H3.3 is not directly apparent from the track due to the necessary normalization of the data. The H3.3-difference track thus does not indicate the global loss of H3.3 but merely represent the relative redistribution of the remaining H3.3 from active genes (Rps12) towards repetitive sequences. c, Levels of H3.3 and H3 and IAP, ETn, MusD, and the TSS of highly expressed genes in control, H3.3 KD, and H3.3 KO ESCs. Box plots show enrichment over matched input. d, Incorporation of exogenous, constitutively expressed, H3.3 and H3.2 added back into H3.3 KD or H3.3 KO ESCs. H3.2 cannot substitute for H3.3 at repetitive ERVs but is efficiently incorporated at sites of active transcription. ChIP-seq was performed on lentivirally integrated H3.3-HA and H3.2-HA in H3.3 KD1 and H3.3 KO1. e, ChIP-seq density heat maps for peaks classified as enriched with both H3.3 and H3K9me3 (n=18,605) or H3.3 only (n=60,925). Color intensity represents tag counts scaled and normalized globally. f, Quantification of H3.3-HA and H3.2-HA add-back in H3.3 KO enrichment at low and highly expressed genes, as well as the TSS (+/− 1kb) of the latter, IAP, ETn, and MusD ERVs, and full-length LINE elements and their 5’ promoter regions. Data is represented as enrichment over input.
Extended Data Figure 10. ERV reactivation upregulates adjacent genes and may be linked to unbalanced chromosomal translocations.
Related to Figure 4. a, Repetitive elements associated with genes in Fig 4b. Elements that were found either within or nearby the transcription unit are listed and the closest distance of an ERV to an exon is given (accounting for the possibility that ERVs could initiate a partial transcript from an alternative start site). b, Newly annotated sites of IAP integration in WT and H3.3 KO1 are indicated on karyogram. c, Karyotype analysis of wild type and H3.3 KO ESCs. Abnormal karyotype indicated by arrows. All analyzed cells in H3.3 KO1 had a small reciprocal translocation between chromosomes 2q and 6q and an unbalanced translocation between chromosomes 6 and 17 resulting in partial gain of chromosomal segment 6qD to 6qG and partial loss of chromosomal segment 17qE2 to 17qE5. Approximately 45% of the cells had chromosomal breaks or gaps (1-2/cell). Approximately 45% of the H3.3 KO2 ESCs had a duplication of the segment 8qC to 8qD resulting in partial gain of this segment.
Supplementary Material
Acknowledgements
This work was supported by the Rockefeller University Fund and the Tri-Institutional Stem Cell Initiative. S.J.E. acknowledges funding from EMBO ALTF 1232-2011 and Cambridge University Herchel Smith Fund. We thank D. Pickett, D. Trono, and D. Shinkai for cell lines. We thank A. Goldberg and C. Li for technical assistance and members of the Allis lab for helpful discussions.
Footnotes
Author Contributions S.J.E. and L.A.B. contributed equally to this project. S.J.E. and L.A.B. conceived of, performed, and interpreted most experiments with guidance from C.D.A. K.-M.N. and N.D contributed to experiments. S.J.E. and L.A.B. wrote the manuscript with input from all authors.
Author Information Our ChIP-seq and RNA-seq data sets have been deposited in the GEO database with accession number GSE59189. The authors declare no competing financial interests. Readers are welcome to comment on the online version of this article at xxx.
Supplementary Information is linked to the online version of this paper.
References
- 1.Waterston RH, et al. Initial sequencing and comparative analysis of the mouse genome. Nature. 2002;420:520–562. doi: 10.1038/nature01262. doi:10.1038/nature01262. [DOI] [PubMed] [Google Scholar]
- 2.Longo MS, Carone DM, Green ED, O'Neill MJ, O'Neill RJ. Distinct retroelement classes define evolutionary breakpoints demarcating sites of evolutionary novelty. BMC Genomics. 2009;10:334. doi: 10.1186/1471-2164-10-334. doi:10.1186/1471-2164-10-334. [DOI] [PMC free article] [PubMed] [Google Scholar]
- 3.Lee J, Han K, Meyer TJ, Kim HS, Batzer MA. Chromosomal inversions between human and chimpanzee lineages caused by retrotransposons. PLoS One. 2008;3:e4047. doi: 10.1371/journal.pone.0004047. doi:10.1371/journal.pone.0004047. [DOI] [PMC free article] [PubMed] [Google Scholar]
- 4.Feschotte C, Gilbert C. Endogenous viruses: insights into viral evolution and impact on host biology. Nat Rev Genet. 2012;13:283–296. doi: 10.1038/nrg3199. doi:10.1038/nrg3199. [DOI] [PubMed] [Google Scholar]
- 5.Karimi MM, et al. DNA methylation and SETDB1/H3K9me3 regulate predominantly distinct sets of genes, retroelements, and chimeric transcripts in mESCs. Cell Stem Cell. 2011;8:676–687. doi: 10.1016/j.stem.2011.04.004. doi:10.1016/j.stem.2011.04.004. [DOI] [PMC free article] [PubMed] [Google Scholar]
- 6.Rowe HM, et al. TRIM28 repression of retrotransposon-based enhancers is necessary to preserve transcriptional dynamics in embryonic stem cells. Genome Res. 2013;23:452–461. doi: 10.1101/gr.147678.112. doi:10.1101/gr.147678.112. [DOI] [PMC free article] [PubMed] [Google Scholar]
- 7.Robberecht C, Voet T, Zamani Esteki M, Nowakowska BA, Vermeesch JR. Nonallelic homologous recombination between retrotransposable elements is a driver of de novo unbalanced translocations. Genome Res. 2013;23:411–418. doi: 10.1101/gr.145631.112. doi:10.1101/gr.145631.112. [DOI] [PMC free article] [PubMed] [Google Scholar]
- 8.Maksakova IA, Mager DL, Reiss D. Keeping active endogenous retroviral-like elements in check: the epigenetic perspective. Cell Mol Life Sci. 2008;65:3329–3347. doi: 10.1007/s00018-008-8494-3. doi:10.1007/s00018-008-8494-3. [DOI] [PMC free article] [PubMed] [Google Scholar]
- 9.Gifford WD, Pfaff SL, Macfarlan TS. Transposable elements as genetic regulatory substrates in early development. Trends Cell Biol. 2013;23:218–226. doi: 10.1016/j.tcb.2013.01.001. doi:10.1016/j.tcb.2013.01.001. [DOI] [PMC free article] [PubMed] [Google Scholar]
- 10.Matsui T, et al. Proviral silencing in embryonic stem cells requires the histone methyltransferase ESET. Nature. 2010;464:927–931. doi: 10.1038/nature08858. doi:10.1038/nature08858. [DOI] [PubMed] [Google Scholar]
- 11.Rowe HM, et al. KAP1 controls endogenous retroviruses in embryonic stem cells. Nature. 2010;463:237–240. doi: 10.1038/nature08674. doi:10.1038/nature08674. [DOI] [PubMed] [Google Scholar]
- 12.Goldberg AD, et al. Distinct factors control histone variant H3.3 localization at specific genomic regions. Cell. 2010;140:678–691. doi: 10.1016/j.cell.2010.01.003. doi:10.1016/j.cell.2010.01.003. [DOI] [PMC free article] [PubMed] [Google Scholar]
- 13.Lewis PW, Elsaesser SJ, Noh KM, Stadler SC, Allis CD. Daxx is an H3.3-specific histone chaperone and cooperates with ATRX in replication-independent chromatin assembly at telomeres. Proc Natl Acad Sci U S A. 2010;107:14075–14080. doi: 10.1073/pnas.1008850107. doi:10.1073/pnas.1008850107. [DOI] [PMC free article] [PubMed] [Google Scholar]
- 14.Drane P, Ouararhni K, Depaux A, Shuaib M, Hamiche A. The death-associated protein DAXX is a novel histone chaperone involved in the replication-independent deposition of H3.3. Genes Dev. 2010;24:1253–1265. doi: 10.1101/gad.566910. doi:10.1101/gad.566910. [DOI] [PMC free article] [PubMed] [Google Scholar]
- 15.Wong LH, et al. Histone H3.3 incorporation provides a unique and functionally essential telomeric chromatin in embryonic stem cells. Genome Res. 2009;19:404–414. doi: 10.1101/gr.084947.108. doi:10.1101/gr.084947.108. [DOI] [PMC free article] [PubMed] [Google Scholar]
- 16.Banaszynski LA, et al. Hira-dependent histone H3.3 deposition facilitates PRC2 recruitment at developmental loci in ES cells. Cell. 2013;155:107–120. doi: 10.1016/j.cell.2013.08.061. doi:10.1016/j.cell.2013.08.061. [DOI] [PMC free article] [PubMed] [Google Scholar]
- 17.Mikkelsen TS, et al. Genome-wide maps of chromatin state in pluripotent and lineage-committed cells. Nature. 2007;448:553–560. doi: 10.1038/nature06008. doi:10.1038/nature06008. [DOI] [PMC free article] [PubMed] [Google Scholar]
- 18.Day DS, Luquette LJ, Park PJ, Kharchenko PV. Estimating enrichment of repetitive elements from high-throughput sequence data. Genome Biol. 2010;11:R69. doi: 10.1186/gb-2010-11-6-r69. doi:10.1186/gb-2010-11-6-r69. [DOI] [PMC free article] [PubMed] [Google Scholar]
- 19.Jurka J, Kohany O, Pavlicek A, Kapitonov VV, Jurka MV. Clustering, duplication and chromosomal distribution of mouse SINE retrotransposons. Cytogenet Genome Res. 2005;110:117–123. doi: 10.1159/000084943. doi:10.1159/000084943. [DOI] [PubMed] [Google Scholar]
- 20.Rebollo R, et al. Epigenetic interplay between mouse endogenous retroviruses and host genes. Genome Biol. 2012;13:R89. doi: 10.1186/gb-2012-13-10-r89. doi:10.1186/gb-2012-13-10-r89. [DOI] [PMC free article] [PubMed] [Google Scholar]
- 21.Ribet D, et al. An infectious progenitor for the murine IAP retrotransposon: emergence of an intracellular genetic parasite from an ancient retrovirus. Genome Res. 2008;18:597–609. doi: 10.1101/gr.073486.107. doi:10.1101/gr.073486.107. [DOI] [PMC free article] [PubMed] [Google Scholar]
- 22.Dewannieux M, Dupressoir A, Harper F, Pierron G, Heidmann T. Identification of autonomous IAP LTR retrotransposons mobile in mammalian cells. Nat Genet. 2004;36:534–539. doi: 10.1038/ng1353. doi:10.1038/ng1353. [DOI] [PubMed] [Google Scholar]
- 23.Zhang Y, Maksakova IA, Gagnier L, van de Lagemaat LN, Mager DL. Genome-wide assessments reveal extremely high levels of polymorphism of two active families of mouse endogenous retroviral elements. PLoS Genet. 2008;4:e1000007. doi: 10.1371/journal.pgen.1000007. doi:10.1371/journal.pgen.1000007. [DOI] [PMC free article] [PubMed] [Google Scholar]
- 24.Treangen TJ, Salzberg SL. Repetitive DNA and next-generation sequencing: computational challenges and solutions. Nat Rev Genet. 2012;13:36–46. doi: 10.1038/nrg3117. doi:10.1038/nrg3117. [DOI] [PMC free article] [PubMed] [Google Scholar]
- 25.Chen P, et al. H3.3 actively marks enhancers and primes gene transcription via opening higher-ordered chromatin. Genes Dev. 2013;27:2109–2124. doi: 10.1101/gad.222174.113. doi:10.1101/gad.222174.113. [DOI] [PMC free article] [PubMed] [Google Scholar]
- 26.Yildirim O, et al. A system for genome-wide histone variant dynamics in ES cells reveals dynamic MacroH2A2 replacement at promoters. PLoS Genet. 2014;10:e1004515. doi: 10.1371/journal.pgen.1004515. doi:10.1371/journal.pgen.1004515. [DOI] [PMC free article] [PubMed] [Google Scholar]
- 27.Bulut-Karslioglu A, et al. Suv39h-dependent H3K9me3 marks intact retrotransposons and silences LINE elements in mouse embryonic stem cells. Mol Cell. 2014;55:277–290. doi: 10.1016/j.molcel.2014.05.029. doi:10.1016/j.molcel.2014.05.029. [DOI] [PubMed] [Google Scholar]
- 28.DeNizio JE, Elsasser SJ, Black BE. DAXX co-folds with H3.3/H4 using high local stability conferred by the H3.3 variant recognition residues. Nucleic Acids Res. 2014;42:4318–4331. doi: 10.1093/nar/gku090. doi:10.1093/nar/gku090. [DOI] [PMC free article] [PubMed] [Google Scholar]
- 29.Adam S, Polo SE, Almouzni G. Transcription recovery after DNA damage requires chromatin priming by the H3.3 histone chaperone HIRA. Cell. 2013;155:94–106. doi: 10.1016/j.cell.2013.08.029. doi:10.1016/j.cell.2013.08.029. [DOI] [PubMed] [Google Scholar]
- 30.Frey A, Listovsky T, Guilbaud G, Sarkies P, Sale JE. Histone H3.3 is required to maintain replication fork progression after UV damage. Curr Biol. 2014;24:2195–2201. doi: 10.1016/j.cub.2014.07.077. doi:10.1016/j.cub.2014.07.077. [DOI] [PMC free article] [PubMed] [Google Scholar]
- 31.Sarma K, et al. ATRX Directs Binding of PRC2 to Xist RNA and Polycomb Targets. Cell. 2014;159:869–883. doi: 10.1016/j.cell.2014.10.019. [DOI] [PMC free article] [PubMed] [Google Scholar]
- 32.Bilodeau S, Kagey MH, Frampton GM, Rahl PB, Young RA. SetDB1 contributes to repression of genes encoding developmental regulators and maintenance of ES cell state. Genes Dev. 2009;23:2484–2489. doi: 10.1101/gad.1837309. doi:10.1101/gad.1837309. [DOI] [PMC free article] [PubMed] [Google Scholar]
- 33.Das PP, et al. Distinct and combinatorial functions of Jmjd2b/Kdm4b and Jmjd2c/Kdm4c in mouse embryonic stem cell identity. Mol Cell. 2014;53:32–48. doi: 10.1016/j.molcel.2013.11.011. doi:10.1016/j.molcel.2013.11.011. [DOI] [PMC free article] [PubMed] [Google Scholar]
- 34.Langmead B, Trapnell C, Pop M, Salzberg SL. Ultrafast and memory-efficient alignment of short DNA sequences to the human genome. Genome Biol. 2009;10:R25. doi: 10.1186/gb-2009-10-3-r25. doi:10.1186/gb-2009-10-3-r25. [DOI] [PMC free article] [PubMed] [Google Scholar]
- 35.Li H, et al. The Sequence Alignment/Map format and SAMtools. Bioinformatics. 2009;25:2078–2079. doi: 10.1093/bioinformatics/btp352. doi:10.1093/bioinformatics/btp352. [DOI] [PMC free article] [PubMed] [Google Scholar]
- 36.Liu T. Use model-based Analysis of ChIP-Seq (MACS) to analyze short reads generated by sequencing protein-DNA interactions in embryonic stem cells. Methods Mol Biol. 2014;1150:81–95. doi: 10.1007/978-1-4939-0512-6_4. doi:10.1007/978-1-4939-0512-6_4. [DOI] [PubMed] [Google Scholar]
- 37.Shen L, Shao N, Liu X, Nestler E. ngs.plot: Quick mining and visualization of next-generation sequencing data by integrating genomic databases. BMC Genomics. 2014;15:284. doi: 10.1186/1471-2164-15-284. doi:10.1186/1471-2164-15-284. [DOI] [PMC free article] [PubMed] [Google Scholar]
- 38.Shin H, Liu T, Manrai AK, Liu XS. CEAS: cis-regulatory element annotation system. Bioinformatics. 2009;25:2605–2606. doi: 10.1093/bioinformatics/btp479. doi:10.1093/bioinformatics/btp479. [DOI] [PubMed] [Google Scholar]
- 39.Trapnell C, Pachter L, Salzberg SL. TopHat: discovering splice junctions with RNA-Seq. Bioinformatics. 2009;25:1105–1111. doi: 10.1093/bioinformatics/btp120. doi:10.1093/bioinformatics/btp120. [DOI] [PMC free article] [PubMed] [Google Scholar]
- 40.Trapnell C, et al. Differential analysis of gene regulation at transcript resolution with RNA-seq. Nat Biotechnol. 2013;31:46–53. doi: 10.1038/nbt.2450. doi:10.1038/nbt.2450. [DOI] [PMC free article] [PubMed] [Google Scholar]
Associated Data
This section collects any data citations, data availability statements, or supplementary materials included in this article.


