Abstract
Dysregulated neurodevelopment with altered structural and functional connectivity is believed to underlie many neuropsychiatric disorders1, and ‘a disease of synapses’ is the major hypothesis for the biological basis of schizophrenia2. Although this hypothesis has gained indirect support from human post-mortem brain analyses2–4 and genetic studies5–10, little is known about the pathophysiology of synapses in patient neurons and how susceptibility genes for mental disorders could lead to synaptic deficits in humans. Genetics of most psychiatric disorders are extremely complex due to multiple susceptibility variants with low penetrance and variable phenotypes11. Rare, multiply affected, large families in which a single genetic locus is probably responsible for conferring susceptibility have proven invaluable for the study of complex disorders. Here we generated induced pluripotent stem (iPS) cells from four members of a family in which a frameshift mutation of disrupted in schizophrenia 1 (DISC1) co-segregated with major psychiatric disorders12 and we further produced different isogenic iPS cell lines via gene editing. We showed that mutant DISC1 causes synaptic vesicle release deficits in iPS-cell-derived forebrain neurons. Mutant DISC1 depletes wild-type DISC1 protein and, furthermore, dysregulates expression of many genes related to synapses and psychiatric disorders in human forebrain neurons. Our study reveals that a psychiatric disorder relevant mutation causes synapse deficits and transcriptional dysregulation in human neurons and our findings provide new insight into the molecular and synaptic etiopathology of psychiatric disorders.
DISC1 was originally identified at the breakpoint of a balanced chromosomal translocation that co-segregated with schizophrenia, bipolar disorder and recurrent major depression in a large Scottish family13. Another rare mutation of a 4 base-pair (bp) frameshift deletion at the DISC1 carboxy (C) terminus was later discovered in a smaller American family (pedigree H), which shares many similarities with the Scottish pedigree12. DISC1 variants and polymorphisms have since been found to be associated with schizophrenia, bipolar disorder, major depression, and autism, and animal studies support a potential contribution of DISC1 to the etiopathology of major mental disorders13, including regulating neuronal development and synapse formation14. Little is known about DISC1 function or dysfunction in human neurons.
Pluripotent stem cells reprogrammed from patient somatic cells offer a new way to investigate mechanisms underlying complex human diseases15. Using an episomal non-integrating approach16 we establish iPS cell lines from pedigree H12, including two patients with the frameshift DISC1 mutation (D2 (schizophrenia) and D3(major depression)) and two unaffected members without the mutation (C2 and C3; Fig. 1a). We also included an unrelated healthy individual as an additional control (C1). We performed extensive quality control analyses and selected two iPS cell lines (indicated by 1 or 2, for example, C1-1 and C1-2) from each individual for detailed studies (Extended Data Fig. 1 and Supplementary Table 1a).
Figure 1. Normal neural differentiation, but markedly reduced total DISC1 protein levels in forebrain neurons derived from patient iPS cells carrying the DISC1 mutation.
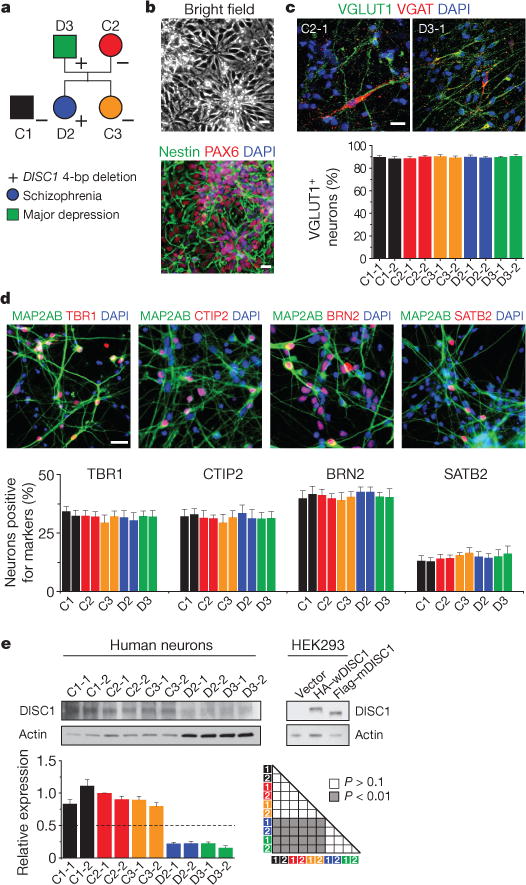
a, A schematic diagram of the pedigree for iPS cell generation. In addition, iPS cells from a control individual outside of the pedigree (C1, male) were used in the current study. The symbol + indicates one copy of the 4-bp deletion in the DISC1 gene; the symbol – indicates lack of the 4-bp deletion in the DISC1 gene. b–d, Neural differentiation of iPS cells. b, Sample bright-field and confocal images of nestin and PAX6 immunostaining of hNPCs. See Extended Data Fig. 2 for characterization of additional forebrain neural progenitor markers. c, Sample confocal images of immunostaining of human neurons at 4 weeks after neuronal differentiation for VGLUT1 (also known as SLC17A7) and VGAT, and quantification of VGLUT1+ neurons among different iPS cell lines. Values represent mean ± s.e.m. n = 5 cultures. See Extended Data Fig. 3 for characterization of other markers. d, Sample confocal images of immunostaining for MAP2AB and neuronal subtype markers of different cortical layers, and quantification of neuronal subtype differentiation among different iPS cell lines. Values represent mean ± s.e.m. n = 4 cultures. Scale bars, 20 μm. e, DISC1 protein levels in forebrain neurons derived from different iPS cell lines. Shown are sample western blot images and quantification. Data were normalized to actin for sample loading and then normalized to C2-1 in the same blot for comparison. Values represent mean ± s.e.m. n = 3; ANOVA test. Note that the DISC1 antibodies used recognized both full-length human wDISC1 (HA-tagged) and mDISC1 (Flag-tagged) exogenously expressed in HEK293 cells.
We differentiated iPS cells into forebrain-specific human neural progenitor cells (hNPCs) expressing nestin, PAX6, EMX1, FOXG1 and OTX2 (Fig. 1b; Extended Data Fig. 2a, b and Supplementary Table 1b), and then into MAP2AB+ neurons (99.92 ± 0.08%; n = 5). About 90% of neurons expressed VGLUT1 or α-CAMKII, indicative of glutamatergic neurons, whereas few neurons expressed VGAT (also known as SLC32A1) or GAD67 (GABAergic), and even fewer expressed tyrosine hydroxylase (TH) marker (dopaminergic; Fig. 1c and Extended Data Fig. 3). These neurons express different cortical layer markers, including TBR1, CTIP2 (also known as BCL11B), BRN2 (also known as POU3F2) and SATB2 (Fig. 1d). Quantitative analyses showed no differences in neuronal subtype differentiation among all lines (Fig. 1c, d and Extended Data Fig. 3).
The mutant DISC1 allele is predicted to generate a frameshift mutant DISC1 protein (mDISC1) with 9 de novo amino acids at the C terminus12 (Extended Data Fig. 4a). Quantitative real-time PCR (qRT–PCR) analysis of a common exon 2 showed similar messenger RNA levels in different neurons (Extended Data Fig. 4b and Supplementary Table 1c). Strikingly, D2 and D3 neurons only expressed ~20% of the total DISC1 protein detected in control neurons using antibodies17 that recognized both human full-length wild-type DISC1 (wDISC1) and mDISC1 when expressed in HEK293 cells (Fig. 1e). DISC1 interacts with itself and forms multimers, and sometimes aggregates18. Given that patients are heterozygous for the DISC1 mutation (Extended Data Fig. 1f), this result suggested a model in which mDISC1 interacts with wDISC1 to form aggregates and deplete soluble DISC1. Indeed, differentially tagged wDISC1 and mDISC1 co-immunoprecipitated when co-expressed in HEK293 cells (Extended Data Fig. 4c). mDISC1 significantly decreased soluble wDISC1 proteins in a dose-dependent manner and, furthermore, increased wDISC1 ubiquitination (Extended Data Fig. 4d, e). These results suggest a mechanism distinct from DISC1 haploinsufficiency in mutant human neurons.
We next examined human forebrain neuron development. As in animal models14, quantitative analyses showed that mutant neurons exhibited increased soma size and total dendritic length at 1 and 2 weeks after neuronal differentiation; however, these properties became indistinguishable from control neurons at 3 and 4 weeks (Extended Data Fig. 5). Electrophysiological recordings of neurons did not show any consistent changes in their current–voltage (I–V) relationship at 4 weeks after differentiation (Extended Data Fig. 6). To examine synapse formation, we immunostained synaptic vesicle protein SV2 (Fig. 2a), which is associated with mature synaptic vesicles and regulates presynaptic release19,20. The density of SV2+ synaptic boutons was significantly reduced in D2 and D3 neurons compared to control neurons at both 4 and 6 weeks (Fig. 2b). We next performed whole-cell patch-clamp recordings of human neurons of similar densities co-cultured on astrocytes21 (Fig. 2c). The frequency of excitatory spontaneous synaptic currents (SSCs), but not the amplitude, was significantly lower for D2-1 and D3-1neurons compared to those of C3-1 neurons at both 4 and 6 weeks (Fig. 2d), suggesting a presynaptic defect in synaptic release. Results appeared to be more complex when neurons derived from outside of the pedigree (C1) were compared. D2-1 neurons exhibited markedly reduced SSC frequency and amplitude compared to C1-1 neurons at 4 weeks and slightly reduced frequency and amplitude at 6 weeks (Fig. 2d). For D3-1 neurons, similar results of reduced SSC frequency, but not amplitude, were observed when compared to C1-1 or C3-1 neurons at 4 or 6 weeks (Fig. 2d). Although uniform results were obtained from comparison of neurons derived from the same family, all electrophysiological data showed functional synaptic transmission deficits in DISC1 mutant neurons and further suggested a component of presynaptic dysfunction. Indeed, quantitative FM1-43 imaging analyses revealed a significant defect in depolarization-induced vesicle release for mutant neurons compared to control neurons (Fig. 2e).
Figure 2. Defects of glutamatergic synapses in forebrain neurons carrying the DISC1 mutation.
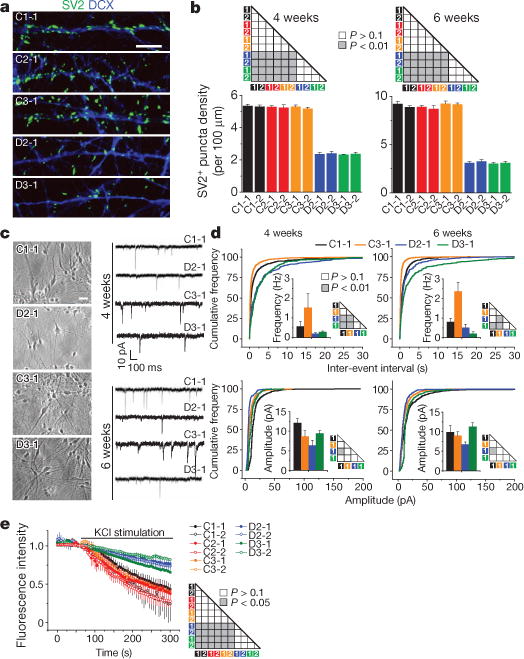
a, b, Decreased density of SV2+ puncta by human forebrain neurons derived from patient iPS cell lines carrying the DISC1 mutation compared to control lines. a, Sample confocal images of SV2 and DCX immunostaining of neurons at 6 weeks after neuronal differentiation. Scale bar, 20 μm. b, Summaries of quantification of SV2+ puncta density for neurons derived from two iPS cell lines for each individual. Values represent mean ± s.e.m. n = 5 cultures; ANOVA test. c, d, Defects in glutamatergic synaptic transmission by DISC1 mutant neurons. Forebrain hNPCs were co-cultured on confluent astrocyte feeder layers. c, Sample phase images of co-culture and sample whole-cell voltage-clamp recording traces of excitatory spontaneous synaptic currents (SSCs). Scale bar, 20 μm. d, Distribution plots of SSC event intervals and amplitudes. n = 10–12 neurons for each condition; Kolmogorov–Smirnov test. Mean frequencies and amplitudes are also shown. e, Decreased vesicle release by DISC1 mutant neurons. Six-week-old neurons were imaged for KCl (60 mM) induced release of FM1-43. Values represent mean ± s.e.m. n = 4 cultures; ANOVA test.
To address whether the DISC1 mutation is necessary and/or sufficient for observed synaptic defects, we generated different types of isogenic iPS cell lines using transcription activator-like effector nuclease (TALEN; Fig. 3a). First, we corrected the 4-bp deletion in one mutant DISC1 iPS cell line (D3-2-6R). Second, we introduced the 4-bp deletion into two control iPS cell lines, one within the pedigree (C3-1-3M) and, importantly, one outside of the pedigree (C1-2-5M) to control for potential effects of family genetic background. We confirmed successful gene editing by Sanger sequencing and validated the quality of targeted iPS cells (Extended Data Fig. 7). As expected, DISC1 protein expression was rescued in D3-2-6R neurons to a level comparable with control neurons, and reduced in C1-2-5M and C3-1-3M neurons to a level similar to DISC1 mutant neurons (Fig. 3b).
Figure 3. A causal role of the DISC1 mutation in regulating synapse formation in human forebrain neurons.
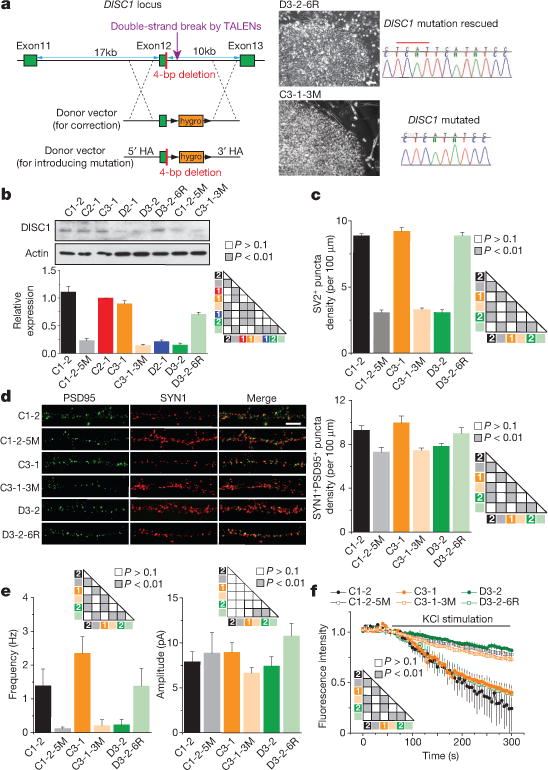
a, Generation of two types of isogenic iPS cell lines. Shown on the left is a schematic illustration of the gene editing strategy for correction of the mutation (4-bp deletion; red bar)in a mutant iPS cell line and for knock-in of the same mutation into two control iPS cell lines. HA, homology arm. Shown on the right are sample images of iPS cell colonies for the correction line (D3-2-6R) and the knock-in line (C3-1-3M) and confirmation by Sanger sequencing. Scale bar, 50 mm. b, Expression of DISC1 protein in forebrain neurons derived from different isogenic iPS cell lines. Shown are sample western blot images and quantification of the total DISC1 protein level. Data were normalized to actin for sample loading and then to C2-1 in the same blot for comparison. Values represent mean ± s.e.m. n = 3; ANOVA test. c–f, mDISC1-dependent regulation of synaptic puncta density and vesicle release. d, Sample confocal images of SYN1 and PSD95 immunostaining. Scale bar, 20 μm. Also shown are summaries of densities of SV2+ puncta (c) or SYN1+ and PSD95+ pair (d) of 6-week-old neurons. Values represent mean ± s.e.m. n = 4 cultures; ANOVA test. e, Summaries of SSC frequencies and amplitudes. Values represent mean ± s.e.m. n = 10–16 neurons for each condition; Kolmogorov–Smirnov test. f, Summary of FM1-43 imaging analysis, similar to analysis in Fig. 2e. Values represent mean ± s.e.m. n = 4 cultures; ANOVA test.
We next compared forebrain neurons derived from isogenic and parental iPS cell lines in parallel. Deficits in the density of SV2+ synaptic boutons were rescued in D3-2-6R neurons and recapitulated in C1-2-5M and C3-1-3M neurons (Fig. 3c). To examine morphological synapses further, we co-immunostained neurons with presynaptic marker synapsin 1 (SYN1) and postsynaptic marker PSD95 (also known as DLG4) (Fig. 3d). Quantification using the SYN1/PSD95 pair as a synapse marker showed reduced density in an mDISC1-dependent fashion (Fig. 3d). Functional electrophysiological recording and FM1-43-imaging analyses also confirmed mDISC1-dependent presynaptic release defects (Fig. 3e, f). These results, from three different isogenic iPS cell lines, including the knock-in line from outside of the pedigree, establish a causal role for the DISC1 mutation in synaptic defects of human neurons and suggest the pathogenic nature of this DISC1 mutation at the cellular level.
To gain molecular insight into how this pathogenic DISC1 mutation causes synaptic defects, we performed RNA-seq analysis of 4-week-old forebrain neurons derived from a control (C3-1) and two mutant (D2-1 and D3-2) iPS cell lines in triplicate (Supplementary Table 2a). There were a large number of differentially expressed genes between C3-1 and D2-1/D3-2 neurons (false discovery rate <5%; Fig. 4a and Supplementary Table 2b, c), while the expression profiles of D2-1 and D3-2 were very similar (Extended Data Fig. 8a). Results from qRT–PCR analyses of selected genes using independent samples of C3-1 and D2-1 neurons were consistent with the RNA-seq data (Extended Data Fig. 8b). Detailed bioinformatic analyses revealed several striking features of differentially expressed genes. First, the top three significantly enriched categories from GO analysis were ‘synaptic transmission’, ‘nervous system development’ and ‘dendritic spine’ (Fig. 4a and Supplementary Table 2d). Second, a large number of genes encoding DISC1-interacting proteins22 were differentially expressed (Fig. 4b). This result is surprising because previous studies have not identified the transcriptional relationship between DISC1 and its protein-interacting partners. Third, 89 differentially expressed genes are linked to schizophrenia, bipolar disorder, depression and mental disorders (Fig. 4c and Supplementary Table 2e). Thus, mDISC1 also functions as a hub for transcriptional regulation of genes implicated in psychiatric disorders.
Figure 4. Dysregulation of neuronal transcriptome encoding a subset of presynaptic proteins, DISC1-interacting proteins and mental-disorder-associated proteins in human forebrain neurons carrying the DISC1 mutation.
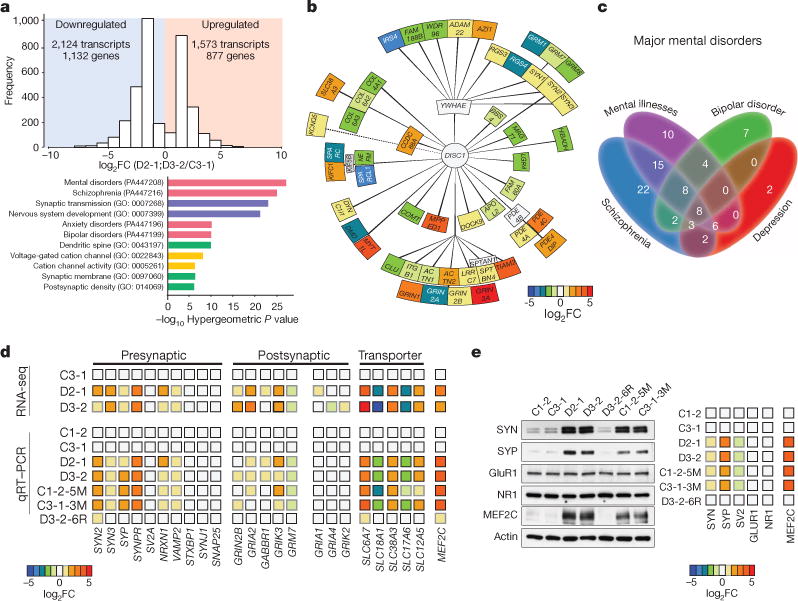
a–c, Summary of RNA-seq analysis of 4-week-old forebrain neurons derived from C3-1, D2-1 and D3-2 iPS cells, n = 3 samples for each iPS cell line. a, Histographs of differentially expressed genes in DISC1 mutant neurons (both D2 and D3) compared to control neurons and GO analysis. b, Illustration of differentially expressed genes encoding DISC1-interaction proteins. Heat-map indicates mean values of differential expression for each gene. c, Illustration of differentially expressed genes that are related to mental disorders. See Supplementary Table 2e for the gene list. d, Validation of differential mRNA expression of selected genes related to synapses in 3forebrain neurons from different isogenic iPS cell lines. Shown is a heat-map of mean values of each gene under different conditions, n = 3 experiments. Values were normalized to those of C3-1 neurons. See Extended Data Fig. 8c for details. e, Validation of differential protein expression of selected genes in forebrain neurons from isogenic iPS cell lines. Shown is a heat-map of mean values of each protein under different conditions, n = 3 experiments. See Extended Data Fig. 8d for details.
To extend these results and establish a causal link between differential gene expression and the DISC1 mutation, we performed qRT–PCR analyses of synapse-related genes using forebrain neurons derived from multiple isogenic iPS cell lines. Differential expression of many genes was found to be mDISC1-dependent (Fig. 4d and Extended Data Fig. 8c). Consistent with a presynaptic defect, mRNAs for a number of presynaptic proteins, including SYN isoforms 2 and 3, synaptophysin (SYP), synaptoporin (SYNPR), neurexin 1 (NRXN1), and VAMP2, were increased in neurons carrying the DISC1 mutation (Fig.4d and Extended Data Fig. 8c). Western blot analyses further confirmed increased protein expression of SYN and SYP in mutant neurons (Fig. 4e and Extended Data Fig. 8d). Previous studies in multiple neuronal systems have shown that elevated synapsin levels suppress presynaptic neurotransmitter release23,24. In contrast, some postsynaptically localized proteins, including GLUR1 (also known as GRIA1) and NR1 (also known as GRIN1), were not affected at mRNA and protein levels in bulk preparations (Fig. 4d, e and Extended Data Fig. 8c, d). We also observed differential expression of several transporters (Fig. 4d). Notably, the transcription factor MEF2C was drastically increased in mRNA and protein levels in mutant neurons (Fig. 4d, e and Extended Data Fig. 8c, d). MEF2C functions to restrict glutamatergic synapse numbers25 and elevated MEF2C decreases frequency, but not amplitude of SSCs in mice26, which resembles what we observed in DISC1 mutant human neurons and suggests an underlying molecular mechanism.
Our findings from studying human forebrain neurons derived from a collection of patient iPS cells and different isogenic lines suggests a model in which susceptibility genes for major psychiatric disorders could affect synaptic function via large-scale transcriptional dysregulation in human neurons. Our results illustrate a potential mechanistic link in human patient neurons for three major hypotheses of complex psychiatric disorders—genetic risk, aberrant neurodevelopment, and synaptic dysfunction. We have developed an enhanced iPS cell model for schizophrenia and major mental disorders at the cellular level27 that includes a high-penetrance and disease-related genotype, iPS cell lines from multiple members of the same family, different types of isogenic lines to address causality, and a relatively homogeneous neuronal subtype population. A key challenge and opportunity for iPS cell disease modeling is to generate new insight into pathophysiology, as opposed to confirming existing hypotheses or validating previous results from animal models. Much of our knowledge of DISC1 functions has come from understanding the biology of DISC1-interacting proteins and the function of these protein complexes, derived mostly from rodent models based on overexpression of truncated DISC1 proteins, or loss-of-function via genetic deletion or short hairpin RNA (shRNA) knockdown13. Unexpectedly, we found that disease-relevant, endogenous mutant DISC1 in human neurons causes a large-scale transcriptional dysregulation of genes associated with synapses, DISC1-interacting proteins, and psychiatric disorders. Our DISC1mutant phenotypes partially overlap with those observed in previous studies of neurons derived from idiopathic schizophrenia patient iPS cells28–30, including decreased synaptic connectivity and transcriptional dysregulation of certain genes, suggesting the potential for a common disease mechanism. Our collection of isogenic iPS cell lines and robust cellular phenotypes also provide a platform for mechanism-guided exploration of therapeutic compounds in correcting synaptic defects of human neurons and for nonbiased largescale screens.
METHODS
Generation and characterization of patient iPS cells and isogenic iPS cell lines
Skin biopsy samples were obtained from four individuals in a previously characterized American family, pedigree H12 (Fig. 1a). C1 fibroblasts were from ATCC (CRL-2097). All studies followed institutional IRB, ISCRO and animal protocols approved by Johns Hopkins University School of Medicine. Informed consents were obtained from individuals from pedigree H. Mouse embryonic fibroblasts (MEFs) were derived from E13.5 CF-1 mouse embryos as previously described16. Fibroblasts were cultured in Dulbecco’s modified Eagle’s medium (DMEM, Mediatech) supplemented with 10% fetal bovine serum (FBS, HyClone) and 2 mM L-glutamine (Invitrogen).
iPS cells were generated with the EBV-based vectors as previously described16. Briefly, plasmids pEP4 EO2S ET2K (Addgene Plasmid 20927), pEP4 EO2S EN2L (Addgene Plasmid 20922), and pEP4 EO2S EM2K (Addgene Plasmid 20923) were transfected intohuman fibroblasts by Amaxa Nucleofector (Lonza; program U-023) at a concentration of 2 μg per 100 μl electroporation solution per 2 × 10⁶ cells. Colonies of iPS cells were manually picked after 3–6 weeks for further expansion and characterization. Lack of vector integration was confirmed by qRT–PCR analysis as previously described16. Two lines from each individual that passed stringent criteria were used for the current study (Supplementary Table 1a). iPS cells (passage ≤ 35) were cultured on irradiated MEFs in human iPS cell medium consisting of D-MEM/F12 (Invitrogen), 20% Knockout Serum Replacement (KSR, Invitrogen), 2 mM L-glutamine (Invitrogen), 100 μM MEM NEAA (Invitrogen), 100 μM β-mercaptoethanol (Invitrogen), and 10 ng ml−1 human basic FGF (bFGF, PeproTech) as described16,31. For feeder-free culture of iPS cells, cells were cultured on Matrigel (BD Biosciences) with mTeSR1 media (Stem Cell Technologies). Media were changed daily and iPS cell lines were passaged by collagenase (Invitrogen, 1 mg ml−1 in D-MEM/F12 for 30 min at 37°C).
Karyotyping analysis by standard G-banding technique was carried out by the Cytogenetics Core Facility at the Johns Hopkins Hospital or Cell Line Genetics. Results were interpreted by clinical laboratory specialists of the Cytogenetics Core or Cell Line Genetics. Genotyping analysis was performed as described previously16. Genomic DNA of fibroblasts and derived iPS cells was extracted by DNeasy Blood & Tissue Kit (Qiagen) following the manufacturer’s recommended protocol. Apair of specific primers was used to amplify the region around the 4-bp deletion (Supplementary Table 1c). PCR products were cloned by TA cloning and sequenced. Bisulphite genomic sequencing was carried out with the EZ DNA Methylation-Direct Kit (Zymo Research) as previously described32. After bisulphite conversion of genomic DNA from iPS cells, primers specific to human OCT4 and NANOG promoters (Supplementary Table 1c) were used to amplify genomic DNA sequences with Platinum Taq DNA Polymerase High Fidelity (Invitrogen) for sequencing.
To assess the in vivo pluripotency of iPS cell lines, teratoma formation assays were performed16. iPS cells were injected subcutaneously into the dorsal flank of SCID mice. Animals were monitored and teratomas were dissected at 8 to 10 weeks post-injection. Tissues were fixed in 10% neutralized formalin solution (Sigma). Embedding, sectioning and haematoxylin and eosin staining were carried out by the Pathology Core Facility at the Johns Hopkins University Hospital.
TALEN designs and constructions were based on a Golden Gate Assembly protocol with modifications to the vector backbone33. Donor DNA vectors with a loxP-flanked PGK-hygromycin cassette were cloned between 5′ and 3′ homology arms (Fig. 3a), which were amplified from genomic DNA of a healthy subject and a patient with the DISC14-bp mutation. For targeting, TALENs (4 μg DNA of each plasmid) and linearized donor vectors (10 μg DNA) were electroporated into individual iPS cells (1 × 10⁶ to 2 × 10⁶ cells pretreated with 5 μM ROCK inhibitor, Y-27632, Cellagentech) using Nucleofector 2b (Lonza; program A-023). Transfected cells were transferred onto a 6-well dish pre-plated with inactivated MEFs and supplemented with Y-27632 in standard iPS cell medium. Positive colonies were selected by 10mg ml−1 hygromycin B (Invitrogen) after 5 days of culture or until small colonies appeared. Resistant colonies were sub-cloned and expanded in 48-well plates. Over 200 clonal lines were screened. The loxP-flanked PGK-hygromycin cassette was removed by electroporation of a Cre recombinase expression vector (4 μg DNA). Specific integration, correct genetic editing and efficient removal of PGK-hygromycin cassette at each stage were verified by Sanger sequencing.
Differentiation of iPS cells into forebrain-specific neural progenitors and cortical neurons
The protocol is illustrated in Extended Data Fig. 2a. Specifically, iPS cell colonies were detached from the feeder layer with 1 mg ml−1 collagenase treatment for 1h and suspended in embryoid body (EB) medium, consisting of FGF-2-free iPS cell medium supplemented with 2 μM dorsomorphin and 2 μM A-83, in non-treated polystyrene plates for 4 days with a daily medium change. After 4 days, EB medium was replaced by neural induction medium (hNPC medium) consisting of DMEM/F12, N2 supplement, NEAA, 2mg ml−1 heparin and 2 μM cyclopamine. The floating EBs were then transferred to Matrigel-coated 6-well plates at day 7 to form neural tube-like rosettes. The attached rosettes were kept for 15days with hNPC medium change every other day. On day 22, the rosettes were picked mechanically and transferred to low attachment plates (Corning) in hNPC medium containing B27. For neuronal differentiation, resuspended neural progenitor spheres were dissociated with Accutase at 37°C for 10 min and placed onto poly-D-lysine/laminin-coated coverslips in the neuronal culture medium, consisting of Neurobasal medium supplemented with 2 mM L-glutamine, B27, 10 ng ml−1 BDNF and 10 ng ml−1 GDNF. Half of the medium was replaced once a week during continuous culturing. For electrophysiological recordings, neural progenitors were plated on a confluent layer of rodent astrocytes as previously described21,34. These cultures exhibited similar neuronal densities and parallel cultures were used for recordings of different iPS cell lines in a blind fashion.
Immunocytochemistry
Cells were fixed with 4% paraformaldehyde (Sigma) for 15 min at room temperature. Samples were permeabilized and blocked with 0.25% Triton X-100 (Sigma) and 10% donkey serum in PBS for 20 min as previously described16. Samples were then incubated with primary antibodies (Supplementary Table 1b) at 4°C overnight, followed by incubation with secondary antibodies for 1 h at room temperature. Antibodies were prepared in PBS containing 0.25% Triton X-100 and 10% donkey serum. Images were taken by Zeiss LSM 710 confocal microscope, or Zeiss Axiovert 200M microscope, and analysed with ImageJ (NIH). Images were acquired with identical settings for parallel cultures. For analysis of synaptic bouton density, total SV2+ puncta in a given image were counted by ImageJ Analyze Particles, and the total dendritic length were measured by ImageJ plugin NeurphologyJ35. The numbers of SYN1/PSD95 pairs were manually counted. The synaptic density was determined by D (D = total SV2+ puncta or SYN1/PSD95 pair per 100 μm total dendritic length).
Electrophysiological and FM1-43 imaging analyses
Whole-cell patch-clamp recordings were performed using Multiclamp 700A patch-clamp amplifier (Molecular Devices, Palo Alto, CA) as previously described21. Briefly, the recording chamber was constantly perfused with a bath solution consisting of 128 mM NaCl, 30 mM glucose, 25 mM HEPES, 5 mM KCl, 2 mM CaCl2, and 1 mM MgCl2 (pH7.3; 315–325 mOsm per litre). Patch pipettes were pulled from borosilicate glass (3–5 MΩ) and filled with an internal solution consisting of 135 mM KGluconate, 10 mM Trisphosphocreatine, 10 mM HEPES, 5mM EGTA, 4 mM MgATP, and 0.5 mM Na2GTP (pH 7.3). The series resistance was typically 10–30 MΩ. For SSC recording, the membrane potential was typically held at −70 mV. Drugs were applied through a gravitydriven drug delivery system (VC-6, Warner Hamden, CT). Data were acquired using pClamp 9 software (Molecular Devices, Palo Alto, CA), sampled at 10 kHz and filtered at 1 kHz. Spontaneous synaptic events were analysed using MiniAnalysis software (Synaptosoft, Decatur, GA). All experiments were conducted at room temperature.
For monitoring synaptic vesicle release, human iPS cell derived neurons were loaded with 10 μM FM1-43 for 2 min in FM image buffer (FMIB, consisting of 170 mM NaCl, 3.5 mM KCl, 0.4 mM KH2PO4, 5 mM NaHCO3, 1.2 mM Na2SO4, 1.2 mM MgCl2, 1.3 mM CaCl2, 5 mM glucose, 20 mM N-tris (hydroxymethyl)-methyl-2-aminoethane-sulfonic acid, pH7.4, ~360 mOsmol) supplemented with 60 mM KCl, followed by a wash with 10 mM FM1-43 in FMIB for 2min. Subsequent washing was with FMIB for 5 min, followed by FMIB supplemented with 1 mM ADVASEP-7. FM1-43 imaging was performed on a Nikon TE2000 imaging system with a 20× objective. Neurons were perfused with FMIB for1 min as the baseline, followed by stimulation with 60 mM KCl for 4 min. Cells were excited at FITC spectra, and the green fluorescence was collected as FM1-43 signal. Images were acquired every 5 s and analysed using NIH ImageJ software. The FM1-43 signal was determined by F [F = (F1−B1)/(F0−B0)], which was normalized to the mean fluorescence intensity measured at the baseline condition (set as 1).
qPCR and RNA-seq analyses
Human forebrain neurons without astrocyte co-culture were used for gene expression analyses. Total RNA was isolated using mir Vana kit (Invitrogen) according to the manufacturer’s instructions. For qPCR, a total of 1 μg RNA was used to synthesize cDNA with the SuperScript III First-Strand Synthesis System (Invitrogen). Quantitative RT–PCR was then performed using SYBR green (Applied Biosystems) and the StepOnePlus Real-Time PCR System (Applied Biosystems). Quantitative levels for all genes were normalized to the housekeeping gene GAPDH and expressed relative to the relevant control samples. All primer sequences are listed in Supplementary Table 1c.
For deep RNA sequencing, libraries for three biological replicates of 4-week-old forebrain neurons derived from iPS cells of three individuals within the pedigree H (C3-1, D2-1 and D3-2) without astrocyte co-culture were prepared and sequenced on an Ion Proton Torrent. Libraries were prepared using the Ion Total RNA-Seq Kit v2 for Whole Transcriptome sequencing following the protocol provided by the manufacturer (Life Technologies, Carlsbad, CA). Briefly, poly (A)-enriched mRNA samples were fragmented, Ion Adaptors were hybridized, and cDNA generated through reverse transcription. Barcodes were added and the libraries were amplified for sequencing. From the poly(A)+ RNA-seq libraries, a total of 123 million reads were generated comprising between 9 and 34 million reads from each of the 9 samples (Supplementary Table 2a). Sequencing generated strand-specific singleend reads of variable length between 8–24 bp. Reads were mapped to the UCSC Human Reference Genome (hg19) using TopHat36 (v2.0.10) and Bowtie37 (v2.1.0). Resulting sequence alignment files were analysed using RSeQC package for quality control38. Reads covering gene coding regions were counted with BED Tools and count data were analysed for differential expression using edgeR39 (v2.15.0). For Gene Ontology analysis, gene lists were obtained for disease enrichment from PharmGKB, KEGG pathways from the Encyclopedia of Genes and Genomes and gene ontology (GO) from AmiGO. IDs for each gene list are provided in Supplementary Table 2. P values were calculated from a cumulative hypergeometric distribution, calculated at (http://www.geneprof.org/GeneProf/tools/hypergeometric.jsp). The total population size was set to 20,687. Additional gene ontology analysis was performed with WebGestalt40.
DNA constructs and biochemical analyses
Full-length human DISC1 cDNA was amplified by PCR and subcloned with HA-tag through AgeI and EcoRV into the pFUGW vector. The 4-bp deletion mutation was introduced through a synthesized long length PCR primer and cloned with Flag-tag through AgeI and EcoRV into the pFUGW vector. All expression plasmids were confirmed by DNA sequencing.
HEK293cells were cultured in Dulbecco’s modified Eagle’s medium (Invitrogen), supplemented with 10%FBS (Gibco). Once reaching 70% confluence, the cells were transiently transfected with cDNA constructs using Lipofectamine 2000 (Invitrogen). Cells were harvested 48h after transfection for biochemical analyses. Cells were lysed in RIPA buffer (150 mM NaCl, 1% Triton X-100, 0.5% sodium deoxycholate, 0.1% SDS; 50 mM Tris, pH8.0) containing Complete Protease Inhibitor Cocktail (Roche). Samples were left on ice for 30 min and sonicated briefly. The insoluble fraction was removed by centrifugation at 15,000 r.p.m. for 15 min at 4°C. Protein concentration was determined by BCA protein assay kit (Bio-Rad). 2× SDS sample buffer (Bio-Rad) containing5% β-mercaptoethanol (Sigma) was added to equal amounts of protein. Proteins were then separated by 4–15% SDS PAGE (Bio-Rad) and transferred to nitrocellulose membrane (0.45 μm). 5% dried milk in TBST (Tris buffered saline with 0.1% Tween 20) was incubated for blocking, and membranes were applied with specific antibodies as listed in Supplementary Table 1b. After washing with TBST and incubation with horseradish peroxidase-conjugated anti-rabbit or anti-mouse IgG (Santa Cruz Biotechnology), the antigen-antibody was detected by chemiluminescence (ECL; Pierce) and X-ray film (GE Healthcare).
For immunoprecipitation experiments, cells were lysed using an IP lysis buffer containing 25 mM HEPES, pH7.4, 1 mM EDTA, 10 mM NaCl, 0.5% Triton X-100, protease inhibitors cocktail (Roche) and 1 mM PMSF, except for the ubiquitination assay in which the IP lysis buffer contains 0.2% SDS (Extended Data Fig. 4e). Equal amount of protein was incubated overnight with Fast Flow Protein G agarose beads (Millipore) and mouse IgG or specific antibody in IP lysis buffer. After pull-down, protein-G beads were washed five times with IP washing buffer (25 mM HEPES, pH 7.4, 1 mM EDTA, 100 mM NaCl, 0.5% Triton X-100 and protease inhibitors cocktail (Roche) and boiled with 2×SDS sample buffer (Bio-Rad) containing 5% β-mercaptoethanol (Sigma). Western blotting was then carried out with primary antibodies listed in Supplementary Table 1b.
Data collection and statistics
All experiments were replicated at least three times using iPS cell lines indicatedin Supplementary Table 1a and data from parallel cultures were acquired. The sample size and description of the sample collection are reported in each figure legend. Quantification of synaptic puncta density, FM-imaging and electrophysiological analyses were performed in a blind fashion. Statistical analyses used for comparison are reported in each figure legends.
Extended Data
Extended Data Figure 1. Basic characterization of iPS cell lines.
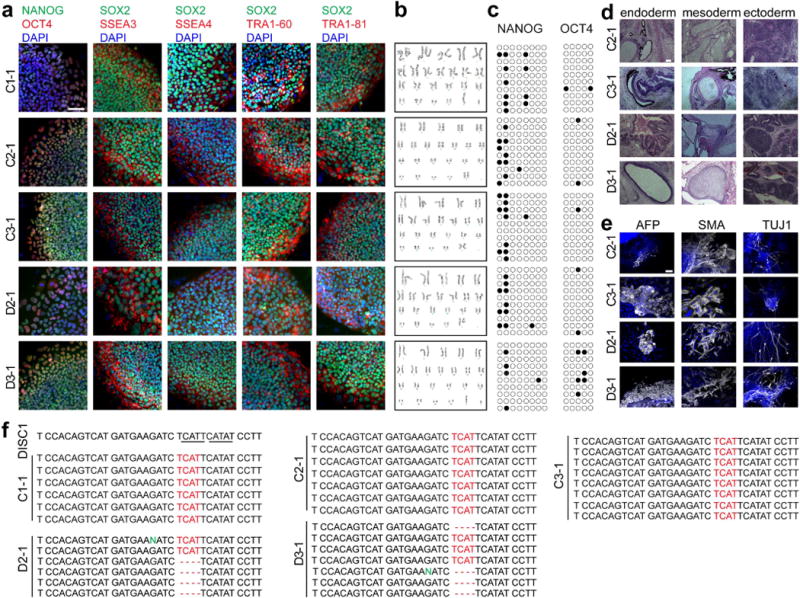
a–c, Sample confocal images of immunostaining of pluripotency-associated markers for different iPS cell lines (a, scale bar, 50 μm) and sample images of karyotyping (b). Also shown is sample bisulphite-sequencing analysis of promoter regions of pluripotency genes NANOG and OCT4 (c). Each row represents one allele: closed circles represent methylated cytosine and open circles represent unmethylated cytosine. d, e, Pluripotency of iPS cell lines. Shown are sample images of cell types of three germ-layers in teratomas following transplantation to SCID mice (d, scale bar, 100 μm) and immunostaining for AFP (an endoderm marker), SMA (a mesoderm marker) or TUJ1 (an ectoderm/neuronal marker), upon in vitro differentiation of iPS cells (e, scale bar, 50 μm). f, Confirmation of the genotype of different iPS cell lines by Sanger sequencing. Shown are sample genomic DNA sequences around exon 12 and intron 12 of different iPS cell lines. Each line represents one allele. See Supplementary Table 1a for a summary of similar characterization for all iPS cell lines used in this study.
Extended Data Figure 2. Forebrain-specific neural differentiation of iPS cell lines.
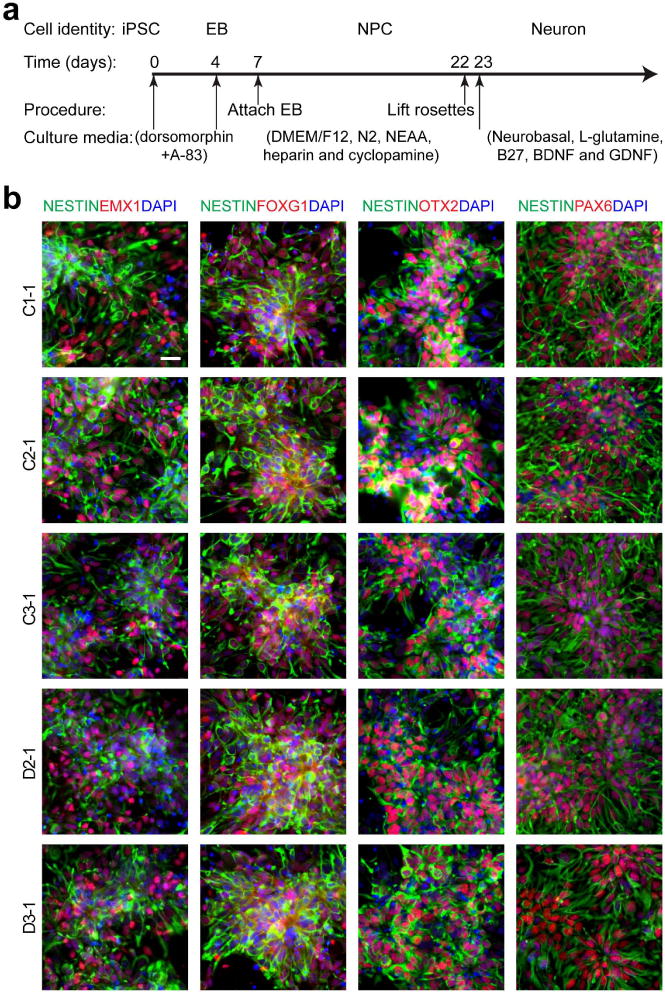
a, Schematic diagram of the differentiation procedure. b, Sample confocal images of immunostaining for nestin and forebrain progenitor markers, EMX1, FOXG1, OTX2, and PAX6, and DAPI. Scale bar, 20 μm.
Extended Data Figure 3. Neuronal subtype differentiation of iPS cell lines.
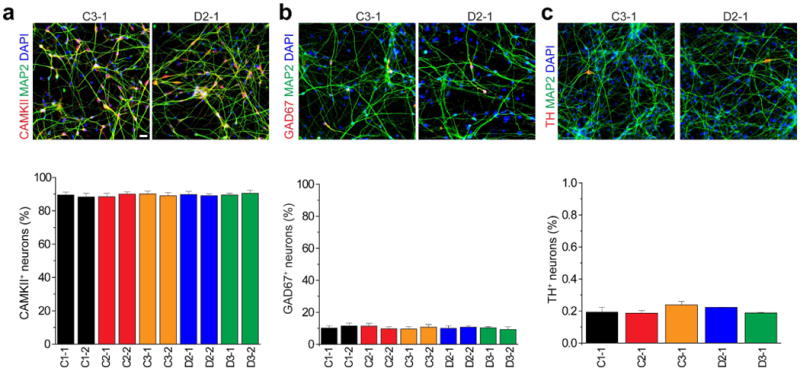
a, Expression of glutamatergic neuron marker α-CAMKII. Shown are sample confocal images of immunostaining of CAMKII and MAP2AB and quantification. Scale bar, 20 μm. Values represent mean ± s.e.m. n = 5 cultures. b, Expression of GABAergic neuron marker GAD67. Same as in a, except that GAD67 was examined. c, Expression of dopaminergic neuron marker tyrosine hydroxylase in cultures. Same as in a, except that tyrosine hydroxylase was examined in one iPS cell line each from five individuals.
Extended Data Figure 4. Effect of the 4-bp deletion mutation of DISC1 on wild-type DISC1 at the protein level.
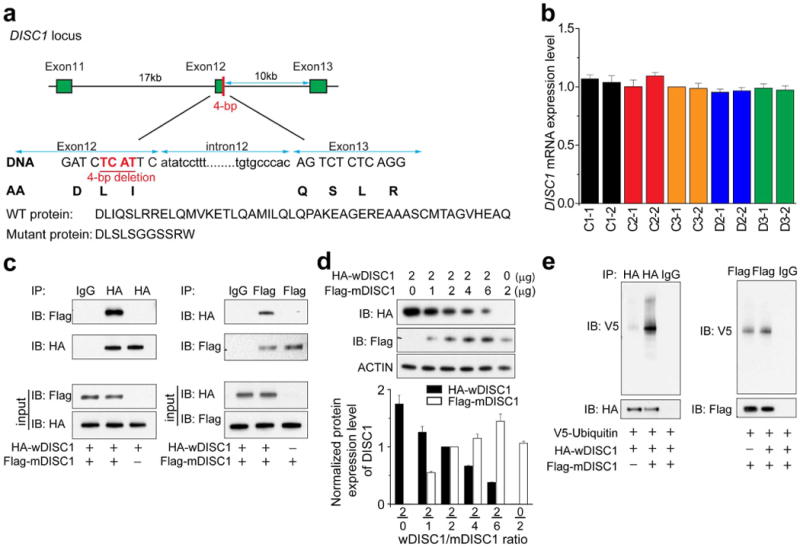
a, Schematic diagram of the DISC1 locus harbouring the frameshift 4-bp deletion mutation. Also shown are predicated protein sequences at the C terminus of wDISC1 and mDISC1. b, Quantification of DISC1 mRNA levels from qPCR analysis of exon 2. Data were normalized to that of C3-1 neurons. Values represent mean ± s.e.m., n = 3. c, Sample western blot images of co-immunoprecipitation analyses of differentially tagged wDISC1 and mDISC1 upon co-expression in HEK293 cells. d, Dose-dependent depletion of soluble wDISC1 by mDISC1 upon co-expression in HEK293 cells. Shown are sample western blot images and quantification. Data were normalized to that of the 2:2 ratio condition for each experiment. Values represent mean ± s.e.m. (n = 3). e, Increased ubiquitination of wDISC1 upon mDISC1 co-expression. Expression plasmids for V5-tagged ubiquitin and HA-tagged wDISC1 were co-transfected with or without Flag-tagged mDISC1 into HEK293 cells. Samples were prepared with lysate buffer containing SDS to dissociate the protein complex, and then wDISC1 was immunoprecipitated with anti-HA antibodies, followed by western blot analysis using anti-V5 antibodies. Note markedly increased covalent-bound ubiquitin for wDISC1 upon mDISC1 co-expression.
Extended Data Figure 5. Morphological development of forebrain neurons in culture.
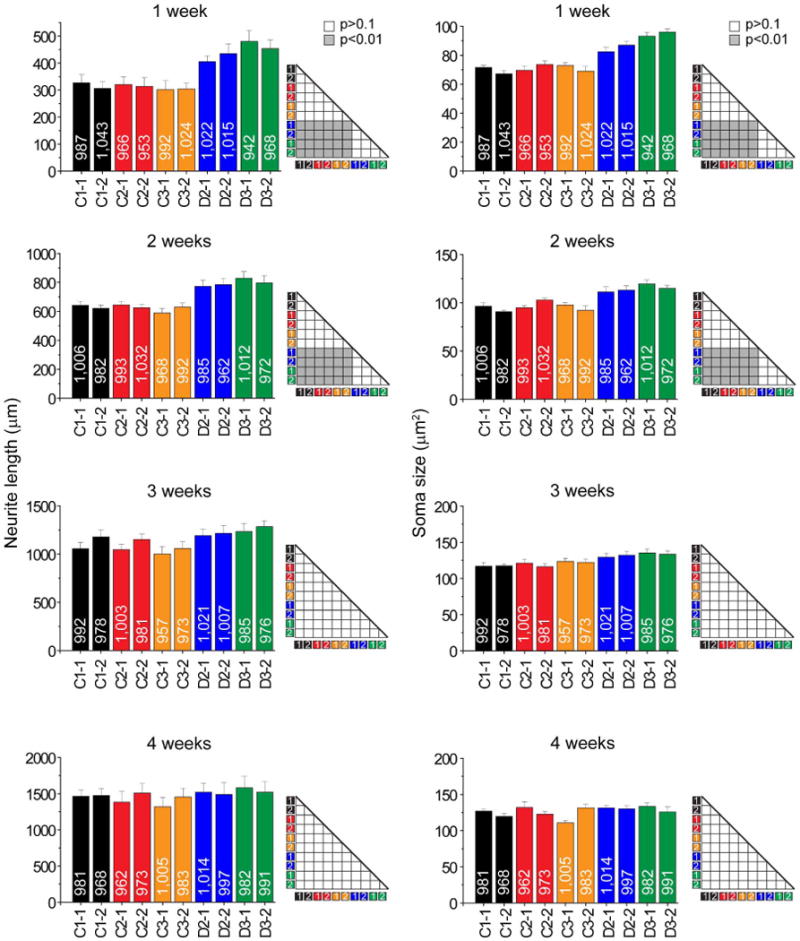
Shown are summaries of soma size and total dendritic length of forebrain neurons derived from two iPS cell lines from each individual at 1 to 4 weeks after neuronal differentiation. Numbers associated with the bars indicate total numbers of neurons examined. Values represent mean ± s.e.m. n = 5 cultures; ANOVA analysis.
Extended Data Figure 6. I–V characteristics of forebrain neurons derived from different iPS cell lines.

Shown are summaries of recordings from forebrain neurons derived from 4 iPS cell lines in co-culture with astrocytes for 1, 2 or 4weeks. Values represent mean ± s.e.m., n = 6–15 cells for each condition.
Extended Data Figure 7. Basic characterization of isogenic iPS cell lines.
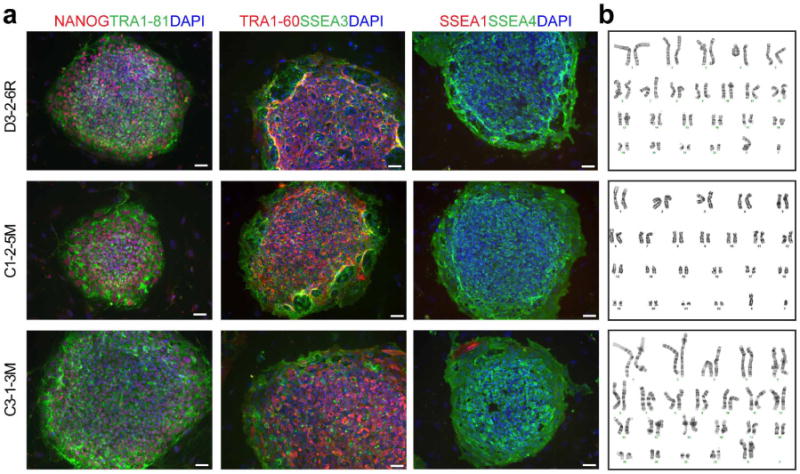
a, b, Sample images of immunostaining of pluripotency-associated markers for different isogenic iPS cell lines (a; scale bars, 50 μm) and sample images for karyotyping (b). See Supplementary Table 1a for a summary.
Extended Data Figure 8. Validations of differential gene and protein expression in forebrain neurons from different isogenic iPS cell lines.
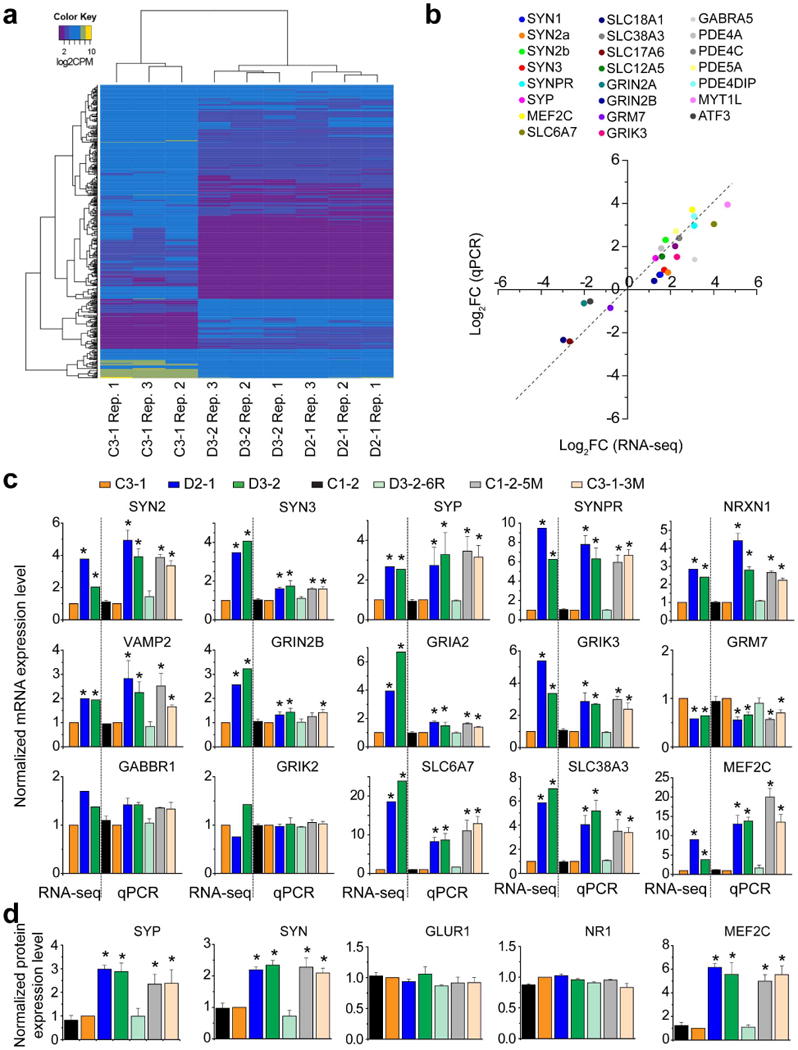
a, Heat-map of expression profile of 500 genes. b, Dot plot of gene expression analysis of a selected group of 23 genes from RNA-seq and qRT–PCR analyses of independent samples of C3-1 and D2-1 neurons. Data represent mean values (n = 3). c, Quantitative mRNA analysis of a selected group of synapserelated genes in forebrain neurons from different isogenic lines. Data from RNA-seq analysis (n = 3 samples each) are also shown for comparison. Values represent mean ± s.e.m. (n = 3; *P<0.01; ANOVA). The same data are summarized in a heat-map illustration shown in Fig. 4d. d, Quantitative analysis of protein expression based on western blot analysis. Values represent mean ± s.e.m. (n = 3; *P<0.01; ANOVA). The same data are summarized in a heat-map illustration shown in Fig. 4e.
Supplementary Material
Acknowledgments
We thank members of Ming and Song laboratories for discussion, and Q. Hussaini, Y. Cai and L. Liu for technical support. This work was supported by grants from the NIH (MH087874, NS047344), IMHRO, SFARI, NARSAD, and MSCRF to H.S.; from MSCRF, NARSAD and the NIH (NS048271) to G.-l.M.; from Dr. Miriam and Sheldon G. Adelson Medical Research Foundation to G.-l.M. and K.S.K.; from the NIH (AG045656) to G.C.; from MSCRF and NARSAD to K.M.C.; by postdoctoral fellowships from MSCRF to Z.W., Y.S., N.S.K., and G.M.; and by a predoctoral fellowship from the NIH (MH102978) to H.N.N.
Footnotes
Online Content Methods, along with any additional Extended Data display items and Source Data, are available in the online version of the paper; references unique to these sections appear only in the online paper.
Supplementary Information is available in the online version of the paper.
Author Contributions Z.W. led and was involved in every aspect of the project. H.N.N. generated isogenic iPS cell lines. Z.G. and G.C. performed electrophysiology analyses. M.A.L., E.G. and K.S.K. performed RNA-seq analyses. X.W., Y.S., N.-S.K., K.-J.Y., J.S., C.Z., G.M., D.N., H.Y., C.-H.C. and K.M.C. helped with data collection. K.K. provided DISC1 antibodies. N.Y., C.A.R. and R.L.M. obtained original skin biopsies from pedigree H.J.Z. and L.C. helped with TALEN design. G.-l.M., H.S. and Z.W. designed the project and wrote the manuscript.
Author Information RNA-seq data were deposit at GEO (accession number: GSE57821).
The authors declare no competing financial interests. Readers are welcome to comment on the online version of the paper.
References
- 1.Weinberger DR. Implications of normal brain development for the pathogenesis of schizophrenia. Arch Gen Psychiatry. 1987;44:660–669. doi: 10.1001/archpsyc.1987.01800190080012. [DOI] [PubMed] [Google Scholar]
- 2.Mirnics K, Middleton FA, Lewis DA, Levitt P. Analysis of complex brain disorders with gene expression microarrays: schizophrenia as a disease of the synapse. Trends Neurosci. 2001;24:479–486. doi: 10.1016/s0166-2236(00)01862-2. [DOI] [PubMed] [Google Scholar]
- 3.Johnson RD, Oliver PL, Davies KE. SNARE proteins and schizophrenia: linking synaptic and neurodevelopmental hypotheses. Acta Biochim Pol. 2008;55:619–628. [PubMed] [Google Scholar]
- 4.Honer WG, Young CE. Presynaptic proteins and schizophrenia. Int Rev Neurobiol. 2004;59:175–199. doi: 10.1016/S0074-7742(04)59007-4. [DOI] [PubMed] [Google Scholar]
- 5.Gulsuner S, et al. Spatial and temporal mapping of de novo mutations in schizophrenia to a fetal prefrontal cortical network. Cell. 2013;154:518–529. doi: 10.1016/j.cell.2013.06.049. [DOI] [PMC free article] [PubMed] [Google Scholar]
- 6.Kenny EM, et al. Excess of rare novel loss-of-function variants in synaptic genes in schizophrenia and autism spectrum disorders. Mol Psychiatry. 2014;19:872–879. doi: 10.1038/mp.2013.127. [DOI] [PubMed] [Google Scholar]
- 7.Malhotra D, et al. High frequencies of de novo CNVs in bipolar disorder and schizophrenia. Neuron. 2011;72:951–963. doi: 10.1016/j.neuron.2011.11.007. [DOI] [PMC free article] [PubMed] [Google Scholar]
- 8.Purcell SM, et al. A polygenic burden of rare disruptive mutations in schizophrenia. Nature. 2014;506:185–190. doi: 10.1038/nature12975. [DOI] [PMC free article] [PubMed] [Google Scholar]
- 9.Fromer M, et al. De novo mutations in schizophrenia implicate synaptic networks. Nature. 2014;506:179–184. doi: 10.1038/nature12929. [DOI] [PMC free article] [PubMed] [Google Scholar]
- 10.Lips ES, et al. Functional gene group analysis identifies synaptic gene groups as risk factor for schizophrenia. Mol Psychiatry. 2012;17:996–1006. doi: 10.1038/mp.2011.117. [DOI] [PMC free article] [PubMed] [Google Scholar]
- 11.Sullivan PF, Daly MJ, O’Donovan M. Genetic architectures of psychiatric disorders: the emerging picture and its implications. Nature Rev Genet. 2012;13:537–551. doi: 10.1038/nrg3240. [DOI] [PMC free article] [PubMed] [Google Scholar]
- 12.Sachs NA, et al. A frameshift mutation in Disrupted in Schizophrenia 1 in an American family with schizophrenia and schizoaffective disorder. Mol Psychiatry. 2005;10:758–764. doi: 10.1038/sj.mp.4001667. [DOI] [PubMed] [Google Scholar]
- 13.Thomson PA, et al. DISC1 genetics, biology and psychiatric illness. Front Biol. 2013;8:1–31. doi: 10.1007/s11515-012-1254-7. [DOI] [PMC free article] [PubMed] [Google Scholar]
- 14.Duan X, et al. Disrupted-In-Schizophrenia 1 regulates integration of newly generated neurons in the adult brain. Cell. 2007;130:1146–1158. doi: 10.1016/j.cell.2007.07.010. [DOI] [PMC free article] [PubMed] [Google Scholar]
- 15.Christian K, Song H, Ming G. Application of reprogrammed patient cells to investigate the etiology of neurological and psychiatric disorders. Front Biol. 2012;7:179–188. doi: 10.1007/s11515-012-1216-0. [DOI] [PMC free article] [PubMed] [Google Scholar]
- 16.Chiang CH, et al. Integration-free induced pluripotent stem cells derived from schizophrenia patients with a DISC1 mutation. Mol Psychiatry. 2011;16:358–360. doi: 10.1038/mp.2011.13. [DOI] [PMC free article] [PubMed] [Google Scholar]
- 17.Kuroda K, et al. Behavioral alterations associated with targeted disruption of exons 2 and 3 of the Disc1 gene in the mouse. Hum Mol Genet. 2011;20:4666–4683. doi: 10.1093/hmg/ddr400. [DOI] [PubMed] [Google Scholar]
- 18.Leliveld SR, et al. Insolubility of disrupted-in-schizophrenia 1 disrupts oligomerdependent interactions with nuclear distribution element 1 and is associated with sporadic mental disease. J Neurosci. 2008;28:3839–3845. doi: 10.1523/JNEUROSCI.5389-07.2008. [DOI] [PMC free article] [PubMed] [Google Scholar]
- 19.Custer KL, Austin NS, Sullivan JM, Bajjalieh SM. Synaptic vesicle protein 2 enhances release probability at quiescent synapses. J Neurosci. 2006;26:1303–1313. doi: 10.1523/JNEUROSCI.2699-05.2006. [DOI] [PMC free article] [PubMed] [Google Scholar]
- 20.Chang WP, Südhof TC. SV2 renders primed synaptic vesicles competent for Ca2+-induced exocytosis. J Neurosci. 2009;29:883–897. doi: 10.1523/JNEUROSCI.4521-08.2009. [DOI] [PMC free article] [PubMed] [Google Scholar]
- 21.Marchetto MC, et al. A model for neural development and treatment of Rett syndrome using human induced pluripotent stem cells. Cell. 2010;143:527–539. doi: 10.1016/j.cell.2010.10.016. [DOI] [PMC free article] [PubMed] [Google Scholar]
- 22.Camargo LM, et al. Disrupted in Schizophrenia 1 Interactome: evidence for the close connectivity of risk genes and a potential synaptic basis for schizophrenia. Mol Psychiatry. 2007;12:74–86. doi: 10.1038/sj.mp.4001880. [DOI] [PubMed] [Google Scholar]
- 23.Hackett JT, Cochran SL, Greenfield LJ, Jr, Brosius DC, Ueda T. Synapsin I injected presynaptically into goldfish mauthner axons reduces quantal synaptic transmission. J Neurophysiol. 1990;63:701–706. doi: 10.1152/jn.1990.63.4.701. [DOI] [PubMed] [Google Scholar]
- 24.Rosahl TW, et al. Short-term synaptic plasticity is altered in mice lacking synapsin I. Cell. 1993;75:661–670. doi: 10.1016/0092-8674(93)90487-b. [DOI] [PubMed] [Google Scholar]
- 25.Flavell SW, et al. Activity-dependent regulation of MEF2 transcription factors suppresses excitatory synapse number. Science. 2006;311:1008–1012. doi: 10.1126/science.1122511. [DOI] [PubMed] [Google Scholar]
- 26.Barbosa AC, et al. MEF2C, a transcription factor that facilitates learning and memory by negative regulation of synapse numbers and function. Proc Natl Acad Sci USA. 2008;105:9391–9396. doi: 10.1073/pnas.0802679105. [DOI] [PMC free article] [PubMed] [Google Scholar]
- 27.Wright R, Rethelyi JM, Gage FH. Enhancing induced pluripotent stem cell models of schizophrenia. JAMA Psychiatry. 2014;71:334–335. doi: 10.1001/jamapsychiatry.2013.4239. [DOI] [PubMed] [Google Scholar]
- 28.Brennand KJ, et al. Modelling schizophrenia using human induced pluripotent stem cells. Nature. 2011;473:221–225. doi: 10.1038/nature09915. [DOI] [PMC free article] [PubMed] [Google Scholar]
- 29.Yu DX, et al. Modeling hippocampal neurogenesis using human pluripotent stem cells. Stem Cell Reports. 2014;2:295–310. doi: 10.1016/j.stemcr.2014.01.009. [DOI] [PMC free article] [PubMed] [Google Scholar]
- 30.Brennand K, et al. Phenotypic differences in hiPS cells NPCs derived from patients with schizophrenia. Mol Psychiatry. 2014 doi: 10.1038/mp.2014.22. http://dx.doi.org/10.1038/mp.2014.22. [DOI] [PMC free article] [PubMed]
- 31.Juopperi TA, et al. Astrocytes generated from patient induced pluripotent stem cells recapitulate features of Huntington’s disease patient cells. Mol Brain. 2012;5:17. doi: 10.1186/1756-6606-5-17. [DOI] [PMC free article] [PubMed] [Google Scholar]
- 32.Ma DK, et al. Neuronal activity-induced Gadd45b promotes epigenetic DNA demethylation and adult neurogenesis. Science. 2009;323:1074–1077. doi: 10.1126/science.1166859. [DOI] [PMC free article] [PubMed] [Google Scholar]
- 33.Cermak T, et al. Efficient design and assembly of custom TALEN and other TAL effector-based constructs for DNA targeting. Nucleic Acids Res. 2011;39:e82. doi: 10.1093/nar/gkr218. [DOI] [PMC free article] [PubMed] [Google Scholar]
- 34.Song HJ, Stevens CF, Gage FH. Neural stem cells from adult hippocampus develop essential properties of functional CNS neurons. Nature Neurosci. 2002;5:438–445. doi: 10.1038/nn844. [DOI] [PubMed] [Google Scholar]
- 35.Ho SY, et al. NeurphologyJ: an automatic neuronal morphology quantification method and its application in pharmacological discovery. BMC Bioinformatics. 2011;12:230. doi: 10.1186/1471-2105-12-230. [DOI] [PMC free article] [PubMed] [Google Scholar]
- 36.Trapnell C, et al. Transcript assembly and quantification by RNA-seq reveals unannotated transcripts and isoform switching during cell differentiation. Nature Biotechnol. 2010;28:511–515. doi: 10.1038/nbt.1621. [DOI] [PMC free article] [PubMed] [Google Scholar]
- 37.Langmead B, Salzberg SL. Fast gapped-read alignment with Bowtie 2. Nature Methods. 2012;9:357–359. doi: 10.1038/nmeth.1923. [DOI] [PMC free article] [PubMed] [Google Scholar]
- 38.Wang L, Wang S, Li W. RSeQC: quality control of RNA-seq experiments. Bioinformatics. 2012;28:2184–2185. doi: 10.1093/bioinformatics/bts356. [DOI] [PubMed] [Google Scholar]
- 39.Robinson MD, McCarthy DJ, Smyth GK. edgeR: a Bioconductor package for differential expression analysis of digital gene expression data. Bioinformatics. 2010;26:139–140. doi: 10.1093/bioinformatics/btp616. [DOI] [PMC free article] [PubMed] [Google Scholar]
- 40.Wang J, Duncan D, Shi Z, Zhang B. WEB-based gene set analysis toolkit (WebGestalt): update 2013. Nucleic Acids Res. 2013;41:W77–W83. doi: 10.1093/nar/gkt439. [DOI] [PMC free article] [PubMed] [Google Scholar]
Associated Data
This section collects any data citations, data availability statements, or supplementary materials included in this article.


