

Abstract
Objective
Brain-derived neurotrophic factor (BDNF) is a potent regulator of neuronal development, and the Bdnf gene produces two populations of transcripts with either a short or long 3′ untranslated region (3′ UTR). Deficiencies in BDNF signaling have been shown to cause severe obesity in humans; however, it remains unknown how BDNF signaling impacts the organization of neuronal circuits that control energy balance.
Methods
We examined the role of BDNF on survival, axonal projections, and synaptic inputs of neurons in the arcuate nucleus (ARH), a structure critical for the control of energy balance, using Bdnfklox/klox mice, which lack long 3′ UTR Bdnf mRNA and develop severe hyperphagic obesity.
Results
We found that a small fraction of neurons that express the receptor for BDNF, TrkB, also expressed proopiomelanocortin (POMC) or neuropeptide Y (NPY)/agouti-related protein (AgRP) in the ARH. Bdnfklox/klox mice had normal numbers of POMC, NPY, and TrkB neurons in the ARH; however, retrograde labeling revealed a drastic reduction in the number of ARH axons that project to the paraventricular hypothalamus (PVH) in these mice. In addition, fewer POMC and AgRP axons were found in the dorsomedial hypothalamic nucleus (DMH) and the lateral part of PVH, respectively, in Bdnfklox/klox mice. Using immunohistochemistry, we examined the impact of BDNF deficiency on inputs to ARH neurons. We found that excitatory inputs onto POMC and NPY neurons were increased and decreased, respectively, in Bdnfklox/klox mice, likely due to a compensatory response to marked hyperphagia displayed by the mutant mice.
Conclusion
This study shows that the majority of TrkB neurons in the ARH are distinct from known neuronal populations and that BDNF plays a critical role in directing projections from these neurons to the DMH and PVH. We propose that hyperphagic obesity due to BDNF deficiency is in part attributable to impaired axonal growth of TrkB-expressing ARH neurons.
Keywords: TrkB, POMC neuron, AgRP neuron, Paraventricular hypothalamus, Excitatory synapse, Inhibitory synapse
Abbreviation: 3′ UTR, 3′ untranslated region; α-MSH, alpha-melanocyte stimulating hormone; aBNST, anterior bed nucleus of the stria terminalis; AgRP, agouti-related peptide; ARH, arcuate nucleus of the hypothalamus; BDNF, brain-derived neurotrophic factor; DiI, 1,1′-dioctadecyl-3, 3,3′,3′-tetramethylindocarbocyanine perchlorate; DMH, dorsomedial nucleus of the hypothalamus; LHA, lateral hypothalamic area; NPY, neuropeptide Y; PBS, phosphate buffer saline; POMC, proopiomelanocortin; pSTAT3, phosphorylated signal transducer and activator of transcription 3; PVH, paraventricular hypothalamic nucleus; PVHmp, medial parvicellular part of the PVH; PVHlp, lateral part of the PVH; PVHmpd, medial parvicellular part of the PVH; PVHpml, lateral magnocellular part of the PVH; PVHpv, periventricular part of the PVH; PVT, paraventricular nucleus of the thalamus; Vgat, vesicular GABA transporter; Vglut2, vesicular glutamate transporter 2
1. Introduction
Homeostatic regulation of energy balance depends on the organization and activity of hypothalamic neural circuits. The arcuate nucleus of the hypothalamus (ARH), which is situated in close vicinity to the bottom of the third ventricle, appears to be a predominant site for the integration of peripheral signals relevant to nutritional and metabolic states [1–3]. In the ARH, neurons that coexpress neuropeptide Y and agouti-related peptide (NPY/AgRP) and neurons that express proopiomelanocortin (POMC) play important roles in the regulation of food intake and energy expenditure. NPY/AgRP neurons are orexigenic, whereas POMC neurons are anorexigenic [4]. All directly respond to leptin and other appetite-regulating factors, and relay these signals to other hypothalamic nuclei that have been implicated in the control of feeding, including the paraventricular hypothalamic nucleus (PVH), the dorsomedial nucleus of the hypothalamus (DMH), and the lateral hypothalamic area (LHA) [3].
Brain-derived neurotrophic factor (BDNF) plays a crucial role in neuronal survival, synaptic plasticity, and neural circuit development [5–7]. Substantial evidence has recently emerged implicating BDNF and its receptor TrkB in the control of feeding and energy balance [8,9]. Mutations in the gene for BDNF or TrkB result in remarkable hyperphagia and massive obesity in humans and mice [10–15].
The Bdnf gene produces two forms of transcripts with either a short or long 3′ untranslated region (3′ UTR) due to the presence of two alternative polyadenylation sites [16]. We previously reported that short 3′ UTR Bdnf mRNA is restricted to the somas, whereas long 3′ UTR Bdnf mRNA is also transported to dendrites for local translation [17]. Bdnfklox/klox mice, in which long 3′ UTR Bdnf mRNA is truncated due to a genetic manipulation [17,18], develop severe hyperphagic obesity [15]. In addition, these mice exhibit deficits in leptin-induced neuronal activation and impairment in projections of arcuate POMC neurons to the DMH [15]. Given the importance of NPY/AgRP and POMC neurons in energy balance and BDNF's role as a potent regulator of synaptic development and plasticity, we hypothesized that BDNF derived from long 3′ UTR Bdnf mRNA regulates food intake in part by promoting axonal outgrowth and modulating synaptic connections of NPY/AgRP and POMC neurons.
2. Materials and methods
2.1. Animals and treatments
Npy-hrGFP (stock #: 006417), Pomc-hrGFP (stock #: 006421), Rip-Cre (stock #: 003573), and Gt(ROSA)26Sortm9(CAG-tdTomato) (Ai9; stock #: 007909) mice were obtained from the Jackson Laboratory. The Bdnfklox/+ strain has been described [17,18]. TrkBCreERT2/+ mice were kindly provided by Dr. David Ginty at Harvard Medical School. All animals were kept in temperature- and humidity-controlled rooms on a 12h/12h light/dark cycle. Mice were allowed ad libitum access to water and regular laboratory chow (Mouse Diet 20 with metabolizable energy of 3.56 kcal/g, LabDiet). NPY-hrGFP;Bdnfklox/klox and POMC-hrGFP;Bdnfklox/klox animals were generated by two sequential crosses: GFP mice were crossed to Bdnfklox/+ mice to produce GFP;Bdnfklox/+ mice, followed by an intercross between GFP;Bdnfklox/+ mice and Bdnfklox/+ mice. TrkBCreERT2/+;Ai9/+;Bdnfklox/klox animals were produced through intercrosses between TrkBCreERT2/+;Bdnfklox/+ mice and Ai9/Ai9;Bdnfklox/+ mice. To induce nuclear localization of Cre recombinase in animals harboring the TrkBCreERT2 allele, tamoxifen (100 mg/kg body weight, 1 mg in 150 μl of corn oil; Sigma–Aldrich) was administered intraperitoneally for 5 consecutive days in 6-week-old mice. Animals were transcardially perfused 10 days after the last tamoxifen injection. Animals that were used for immunohistochemistry of phosphorylated signal transducer and activator of transcription 3 (pSTAT3) were administered with recombinant mouse leptin (5 mg/kg body weight; R&D Systems) intraperitoneally and perfused 45 min later. For fasting and re-feeding experiments, animals were food-deprived for 40 h and then either perfused immediately or re-fed for 2h before perfusion. Both female and male mice were used in all experiments described in this study. We did not observe any sex differences in the neuroanatomical analysis we performed. The Animal Care and Use Committees at Georgetown University, University of Southern California, and the Scripps Research Institute approved all animal procedures used in this study.
2.2. DiI implants in postnatal mice
Implantation of DiI (1,1′-dioctadecyl-3, 3,3′,3′-tetramethylindocarbocyanine perchlorate; Molecular Probes) was conducted as previously described [19]. Briefly, male Bdnf+/+ and Bdnfklox/klox mice were anesthetized with tribromoethanol and perfused on postnatal day 12 (P12) with a 4% paraformaldehyde solution (pH 7.4). The brains were removed immediately from each perfused animal and stored in fixative at 4 °C until further processing. In preparation for labeling, the brains were blocked, embedded in 3% agarose, and sectioned from caudal to rostral to expose the ARH without disturbing rostral regions. Each brain block was stained with methylene blue to visualize morphological features of the exposed surface of the block, which allowed for unambiguous identification of the cytoarchitectonic borders of the ARH. An insect pin was used to place a small DiI crystal (∼20–40 μm in diameter) into the ARH of each brain under visual guidance with the assistance of a stereo-zoom microscope. After implantation, the brain blocks were stored in 4% paraformaldehyde, and the DiI was allowed to diffuse for 6 weeks in the dark at 37 °C. Then, 80-μm-thick sections through the hypothalamus were cut on a vibratome, mounted onto poly-l-lysine-coated glass slides, and cover-slipped with 65% buffered glycerol.
2.3. Immunohistochemistry
For AgRP and alpha-melanocyte stimulating hormone (α-MSH) immunostaining, adult or P12 mice were deeply anesthetized and transcardially perfused with saline followed by fixative (4% paraformaldehyde in borate buffer, pH 9.5). Brains were then postfixed in a solution of 20% sucrose in fixative for 4h and then cryoprotected in 20% sucrose in 0.2 M potassium phosphate buffer solution. For other immunostaining, adult mice were transcardially perfused with phosphate buffer saline (PBS, pH7.4) and then 4% paraformaldehyde in PBS, postfixed, and cryoprotected as previously described [15]. Brains were frozen in powdered dry ice and series of coronal sections were collected using a cryostat or a sliding microtone. The following primary antibodies were used: AgRP (Phoenix Pharmaceuticals), α-MSH (Millipore), humanized Renilla green fluorescent protein (hrGFP; Stratagene), HuC/D (Invitrogen Life Technologies), vesicular glutamate transporter 2 (Vglut2; Synaptic Systems), vesicular GABA transporter (Vgat; Synaptic Systems), pSTAT3 (Cell Signaling), c-Fos (Calbiochem), and DsRed (Clontech). For fluorescence staining, Alexa Fluor conjugated secondary antibodies (Life Technologies) were used, followed by counterstaining with the fluorescent nuclear marker DAPI, and cover-slipped in Fluoromount G mounting medium (Southern Biotech). For non-fluorescence staining, biotinylated secondary antibodies (Vector Laboratories) were used, followed by the avidin–biotin–peroxidase complex (Vector Laboratories) according to the instructions of the manufacturer. Sections were then developed in 0.05% 3, 3′-diaminobenzidine tetrahydrochloride (Sigma) and 0.001% hydrogen peroxide in 0.1 M Tris-Cl, pH 7.5, mounted onto slides, dehydrated, and cover-slipped with DPX (VWR).
2.4. Image acquisition and analysis
For analysis of axonal fiber density, 30 μm-thick brain sections from Bdnf+/+ and Bdnfklox/klox animals were obtained using a cryostat. Regions of interest in the medial parvicellular part of the PVH (PVHmp), lateral part of the PVH (PVHlp), dorsal and ventral regions of the DMH, suprafornical region of the LHAs, anterior bed nucleus of the stria terminalis (aBNST), or paraventricular thalamus (PVT) were defined using anatomical criteria and imaged using a laser scanning confocal microscope (Zeiss LSM 710) equipped with a 63× oil-corrected objective. Image stacks (10 μm thick) were collected through the z-axis at a frequency of 0.4 μm. The density of AgRP and α-MSH immunoreactive axonal fibers in each region of interest were measured by using Volocity Software (Perkin Elmer) as described in detail elsewhere [20]. Briefly, labeled fibers were identified in image stacks using a threshold intensity value. Identified peptide-containing fibers were then skeletonized to one-pixel thick lines and the total length of each line was measured and summed in each region of interest. Data are expressed as the density of labeled fibers contained in a fixed volume.
2.5. Neuronal count
To quantify numbers of NPY, POMC, and TrkB neurons in the ARH, every fourth brain sections (40 μm) obtained from Npy-hrGFP, Pomc-hrGFP or TrkBCreERT2/+;Ai9/+mice, in either the Bdnf+/+ or Bdnfklox/klox background, were stained with antibodies against hrGFP or DsRed using the non-fluorescence staining protocol described above. Neuronal count was performed using Stereo Investigator software (MicroBright-Field Inc.) on sections containing the ARH region along the anterior-to-posterior axis; brain sections from at least 3 animals were quantified for each genotype.
2.6. Statistical analyses
Statistical significance was determined using GraphPad Prism or Excel software and all data are expressed as mean ± SEM. For two group comparisons, a two-tailed unpaired t test was used. P values <0.05 were considered significant.
3. Results
3.1. Characterization of TrkB-expressing neurons in the ARH
To investigate whether the obese phenotype in Bdnfklox/klox mice is associated with alterations in arcuate neurons, we first examined the expression of TrkB in the ARH and the relation of the TrkB neurons with other ARH neurons known to control energy balance. TrkB neurons were visualized through the utilization of TrkBCreERT2/+;Ai9/+ mice in which TrkB-expressing cells were marked by red fluorescent protein tdTomato, after tamoxifen induction. Abundant TrkB neurons and some TrkB astrocytes were detected through the whole ARH in TrkBCreERT2/+;Ai9/+ animals (Figure 1 and Supplementary Figure 1). Next, we examined whether TrkB neurons in the ARH express POMC since POMCARH → DMH projections are impaired in Bdnfklox/klox mice [15]. We generated Pomc-hrGFP;TrkBCreERT2/+;Ai9/+ mice to quantify TrkB neurons that are positive for POMC. Similarly, we generated Npy-hrGFP;TrkBCreERT2/+;Ai9/+ mice to examine co-expression of TrkB and NPY. In these mice, TrkB cells are labeled by tdTomato, while POMC or NPY neurons by GFP. Analysis of confocal images acquired from series of brain sections collected from Pomc-hrGFP;TrkBCreERT2/+;Ai9/+ mice (n = 3) showed that 13.8 ± 2.9% of the TrkB neurons expressed POMC while 16.5 ± 1.5% of the POMC neurons were TrkB-positive in the ARH (Figure 2A,D). In Npy-hrGFP;TrkBCreERT2/+;Ai9/+ animals (n = 4), 15.7 ± 3.2% of the TrkB neurons expressed NPY while 7.8 ± 2.3% of the NPY neurons were positive for TrkB in the ARH (Figure 2B,D).
Figure 1.
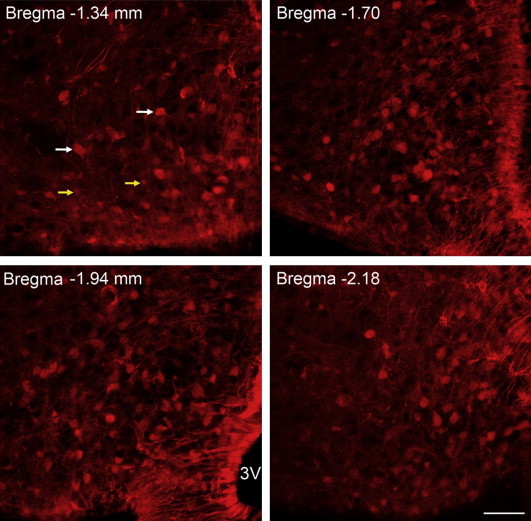
TrkB-expressing cells in the ARH. Representative confocal images acquired from brain sections of adult TrkBCreERT2/+;Ai9/+mice after tamoxifen injection. TrkB positive cells, at different anterior-posterior levels relative to Bregma, were marked by tdTomato in the ARH. White and yellow arrows indicate a few representative TrkB-expressing neurons and astrocytes, respectively. 3V, third ventricle. Scale bar, 50 μm.
Figure 2.
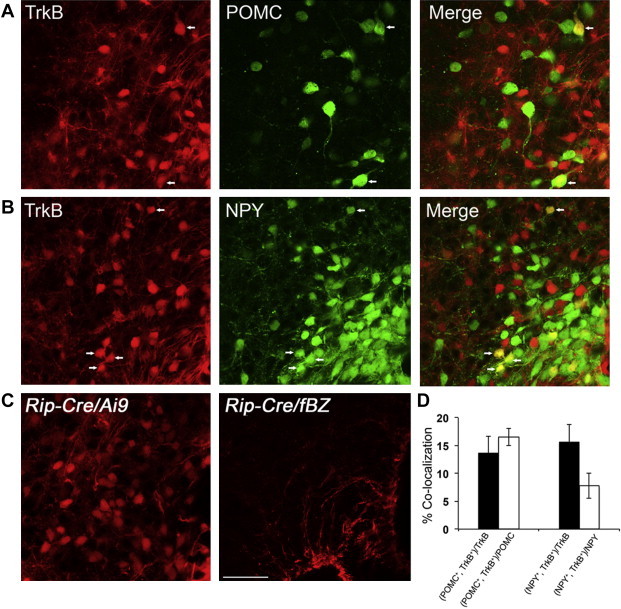
TrkB-expressing neurons represent a distinct subset of ARH neurons. (A) Representative confocal images showing localization of TrkB and POMC neurons in the ARH of Pomc-hrGFP;TrkBCreERT2/+;Ai9/+mice. Arrows denote neurons that express both TrkB and POMC. (B) Representative confocal images showing localization of TrkB and NPY neurons in the ARH of Npy-hrGFP;TrkBCreERT2/+;Ai9/+animals. Arrows denote neurons that express both TrkB and NPY. (C) Arcuate Rip-Cre neurons were labeled by tdTomato in Rip-Cre/+;Ai9/+ animals (left panel). No β-galactosidase-expressing neurons were detected in the ARH of Rip-Cre/+;fBZ/+mice (right panel). Scale bar, 50 μm. (D) Quantification of colocalization of TrkB with either POMC or NPY in the ARH.
Given that the percentage of TrkB neurons co-expressing either POMC or NPY is low, we then examined whether some TrkB neurons in the ARH are GABAergic Rip-Cre neurons, one population of ARH neurons that are distinct from POMC and AgRP neurons [21]. Rip-Cre neurons have been shown to synapse onto PVH neurons that project to the nucleus tractus solitarius to regulate energy expenditure [22]. We generated two genotypes of mice, Rip-Cre/+;Ai9/+ and Rip-Cre/+;fBZ/+, for this study. In Rip-Cre/+;Ai9/+ mice, Rip-Cre-expressing neurons can be identified by tdTomato, whereas in Rip-Cre/+;fBZ/+ mice, TrkB expression in Rip-Cre neurons can be detected by tau-β-galactosidase immunoreactivity when fBZ, a floxed TrkB allele, is deleted by Cre recombinase [23,24]. Using this approach, we detected many Rip-Cre positive neurons in the ARH of Rip-Cre/+;Ai9/+ mice (Figure 2C, left). In contrast, we did not detect cells that were positive for β-galactosidase immunoreactivity in the ARH of Rip-Cre/+;fBZ/+ mice (Figure 2C, right), indicating that TrkB is not expressed in Rip-Cre neurons. Together, these results suggest that the majority of TrkB-expressing neurons likely represent a distinct subset of ARH neurons.
Since TrkB is expressed in some NPY/AgRP or POMC neurons, both of which respond to leptin directly [25–27], we assessed whether all ARH TrkB neurons or only those co-expressing NPY or POMC express leptin receptors. We performed pSTAT3 immunostaining on brain sections of leptin-treated TrkBCreERT2/+;Ai9/+ animals. It has been demonstrated that after leptin administration, immunoreactivity of pSTAT3 is a reliable readout for neurons that express the long-isoform leptin receptor, LepRb [28]. We found that 27.1 ± 3.4% of the TrkB neurons had pSTAT3 signals and that 11.8 ± 2.3% of the pSTAT3 positive cells were TrkB neurons (Figure 3A), indicating that the majority of ARH TrkB neurons do not co-express LepRb and that TrkB- and leptin-signaling are likely two distinctive pathways governing energy homeostasis.
Figure 3.
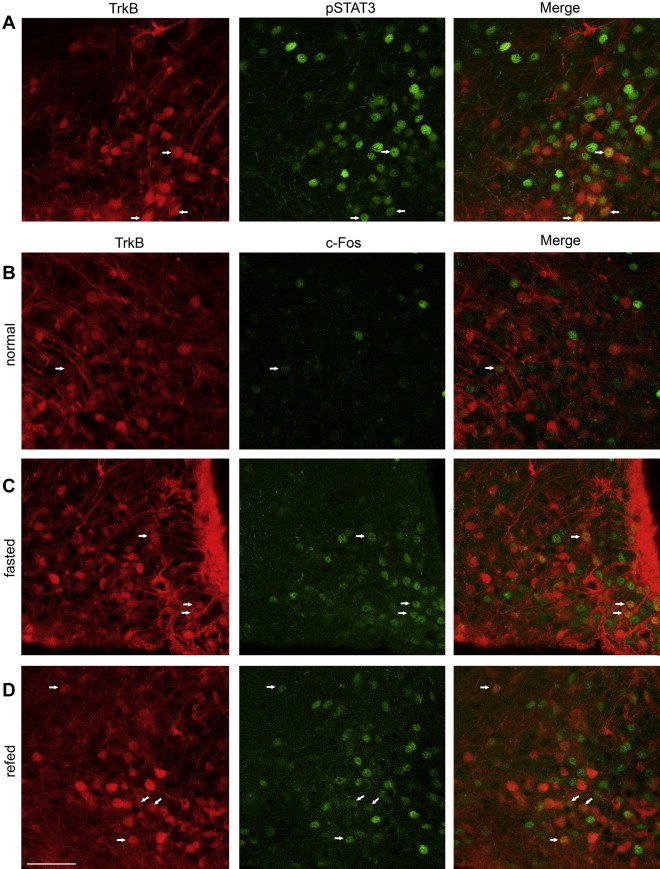
Functional analysis of ARH TrkB neurons. (A) Representative confocal images of brain sections obtained from leptin-treated TrkBCreERT2/+;Ai9/+animals, illustrating some TrkB neurons express LepRb, as identified by pSTAT3 immunoreactivity. Arrows denote representative neurons positive for both TrkB and pSTAT3. (B–D) TrkB neurons in the ARH are activated under fasting (C) or re-feeding (D) conditions relative to the normal feeding condition (B). Arrows denote representative neurons positive for both TrkB and c-Fos. Scale bar, 50 μm.
To gain more insight into the function of ARH TrkB neurons, we examined if they are activated in response to changes in feeding status, as Bdnf expression in the ventromedial nucleus of the hypothalamus (VMH) is selectively regulated by nutritional state [11,29]. We performed c-Fos (a marker of cell activation) immunostaining on brain sections obtained from TrkBCreERT2/+;Ai9/+ animals that had been either fasted for 40h or re-fed for 2h after a period of 40h food deprivation (Figure 3C,D). We found that 20.8 ± 3.9% of TrkB neurons were c-Fos positive under fasting conditions (n = 5), and that 25.1 ± 4.4% of TrkB neurons were c-Fos positive under re-feeding conditions (n = 5), both being significantly higher than the basal levels (Figure 3B), 6.7 ± 2.4% (n = 4), p = 0.024 and p = 0.014, respectively. Of note, fasting-activated TrkB neurons, which are clustered around the base of the third ventricle (Figure 3C), appear to be different from those that are activated by re-feeding, which are more scattered in the ARH (Figure 3D). These observations indicate that ARH TrkB neurons are activated upon changes in nutritional state and suggest the existence of different subpopulations of TrkB neurons in the ARH.
3.2. Bdnfklox/klox mice have normal numbers of POMC, NPY, and TrkB neurons in the ARH
With a better understanding of the function of ARH TrkB neurons and their anatomical relations with NPY/AgRP and POMC neurons, we began investigating whether alterations in POMC, NPY, or TrkB neurons may underlie the obese phenotype in Bdnfklox/klox mice. We first employed cell counts on these three populations of ARH neurons in Bdnf+/+ and Bdnfklox/klox mice at 5 weeks of age when neuronal development is completed. We generated Pomc-hrGFP;Bdnf+/+ vs. Pomc-hrGFP;Bdnfklox/klox and Npy-hrGFP;Bdnf+/+ vs. Npy-hrGFP;Bdnfklox/klox mice to quantify POMC and NPY neurons, respectively. Non-fluorescence immunostaining against hrGFP was conducted on brain sections obtained from these animals (Figure 4A,B), and neurons that were positive for hrGFP immunoreactivity were counted using the Stereo investigator software. We found no difference in the numbers for either POMC or NPY neurons between Bdnf+/+ and Bdnfklox/klox mice (Figure 4D). Consistent with previous report for the POMC cell number [27], the cell count for POMC neurons was 3139 ± 158 in Bdnf+/+ (n = 5) vs. 3319 ± 188 in Bdnfklox/klox (n = 4), p = 0.484. The cell count for NPY neurons was 6168 ± 432 in Bdnf+/+ (n = 4) vs. 6376 ± 193 in Bdnfklox/klox (n = 4), p=0.676. To quantify TrkB neurons, we generated TrkBCreERT2/+;Ai9/+;Bdnf+/+ and TrkBCreERT2/+;Ai9/+;Bdnfklox/klox mice and performed non-fluorescence immunostaining against tdTomato using DsRed antibody (Figure 4C). The number of TrkB neurons between genotypes was also similar (Figure 4D), 3433 ± 74 in Bdnf+/+ (n = 3) vs. 3600 ± 212 in Bdnfklox/klox (n = 3), p = 0.499. Together, these results suggest that BDNF derived from long 3′ UTR Bdnf mRNA is unlikely to have a direct impact on the numbers of ARH neurons and that the obese phenotype in Bdnfklox/klox mice is not a consequence of altered ARH neuron numbers.
Figure 4.
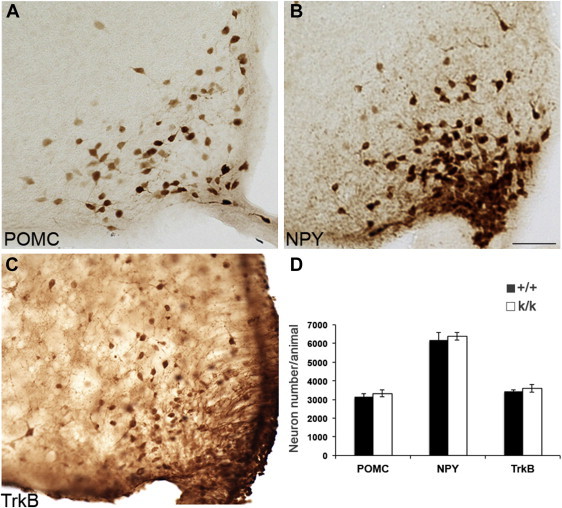
Neuronal counts for POMC, NPY, and TrkB neurons in the ARH. (A) Representative images of POMC neurons as revealed by hrGFP immunoreactivity in Pomc-hrGFP mice. (B) Representative images of NPY neurons as revealed by hrGFP immunoreactivity in Npy-hrGFP mice. Scale bar, 50 μm. (C) Representative images of TrkB neurons as revealed by DsRed immunoreactivity in TrkBCreERT2/+;Ai9/+animals. (D) Numbers of POMC, NPY, and TrkB neurons in Bdnf+/+ (+/+) and Bdnfklox/klox (k/k) mice.
3.3. Bdnfklox/klox mutant exhibits impaired ARH projections
We next investigated whether alterations in ARH neuronal projections may contribute to the obese phenotype in Bdnfklox/klox mice. We employed DiI axonal labeling to label all ARH projections to the PVH in Bdnf+/+ and Bdnfklox/klox mice at P12 as previously described [19,30]. We found that the total fiber length of labeled ARH axons in the periventricular part of the PVH (PVHpv) was drastically reduced in Bdnfklox/klox mice compared to their Bdnf+/+ littermates (Figure 5). The density of labeled fibers also appeared to be reduced in the dorsal component of the medial parvicellular (PVHmpd) and the lateral magnocellular (PVHpml) part of the PVH in Bdnfklox/klox mice, however, these reductions did not achieve statistical significance between genotypes (Figure 5E). This result suggests that BDNF derived from long 3′ UTR Bdnf mRNA is required for growth of axons derived from ARH neurons that target the PVH, especially neurons located in the PVHpv.
Figure 5.
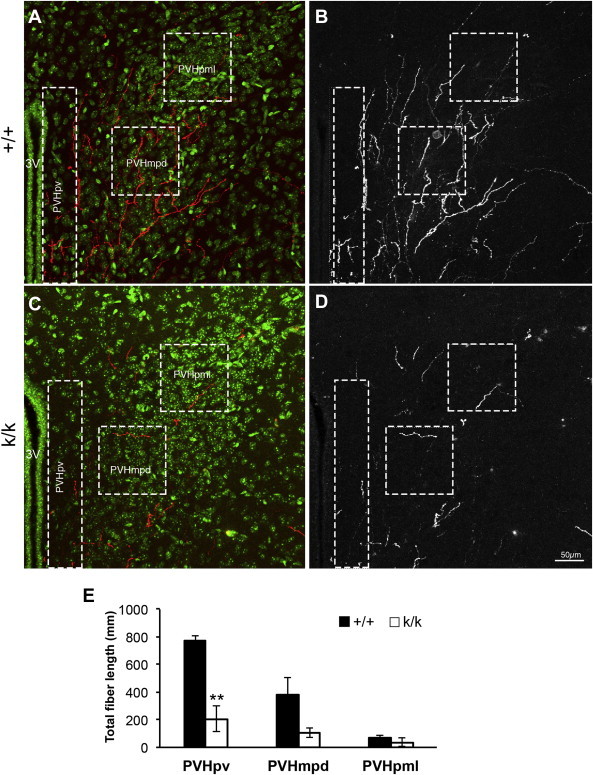
Bdnfklox/kloxmice display impaired axonal projections from the ARH to the PVH. (A–D) Confocal images of DiI-labeled ARH fibers in the PVH of Bdnf+/+ (+/+) and Bdnfklox/klox (k/k) mice at P12. The PVHpv, PVHmpd, and PVHpml subregions of each brain sections were defined and the density of labeled fibers in these regions was measured. (A,C) Representative images of Dil-labeled ARH fibers in the PVH of +/+ and k/k mice. HuC/D staining (green) was used to delineate the morphological boundary of the PVH and Dil-labeled ARH fibers are shown in red. Boxed regions indicate the location of each PVH subregion where fiber density was quantified. 3V, the third ventricle. (B, D) A maximal projection image of +/+ and k/k mice was derived from eight confocal images collected (10× objective) through a total distance of 16 μm in an 80-μm thick section. The scale bar represents 50 μm. (E) Quantification of total fiber length in the PVHpv, PVHmpd, and PVHpml in +/+ (n=4) and k/k (n = 3) mice. **p = 0.005 by unpaired t-test.
3.4. Bdnfklox/klox mice exhibit specific impairments in the development of AgRPARH → PVHlp and POMCARH → DMH projections
To further assess whether the impaired ARH to PVH projections in Bdnfklox/klox mice is attributable to a specific population of ARH neurons, we examined the density of AgRP and α-MSH projections to the PVH in Bdnf+/+ and Bdnfklox/klox mice at P12, an age when this connection has formed [19]. Compared to control littermates, Bdnfklox/klox mice exhibited a significant reduction in the density of AgRP projections to the lateral part of the PVH (PVHlp) (Figure 6D–G). This reduction in innervation was restricted to the caudal subregion of the PVH, as innervation of the more rostral medial parvicellular part of the PVH (PVHmp) was similar between Bdnf+/+ and Bdnfklox/klox (Figure 6A–C). In addition to the PVH, we also analyzed AgRP containing projections to the DMH, LHAs, anterior part of the bed nucleus of the stria terminalis (aBNST), and paraventricular thalamus (PVT). These regions were selected because AgRP neuronal activity has been shown to induce feeding behavior in each of these anatomical sites [31]. We found similar density of AgRP projections in these brain regions between Bdnf+/+ and Bdnfklox/klox mice (μm/1000 μm3): 17.1 ± 0.78 vs. 15.1 ± 1.08, p = 0.219 in dorsal DMH, 13.0 ± 1.23 vs. 10.6 ± 0.90, p = 0.119 in ventral DMH, 14.5 ± 0.84 vs. 13.0 ± 0.89, p = 0.266 in LHAs, 14.3 ± 1.84 vs. 14.9 ± 1.09, p = 0.750 in aBNST, and 12.1 ± 0.99 vs. 12.6 ± 0.83, p = 0.703 in PVT. These results indicate that Bdnfklox/klox mice have a specific impairment in the development of AgRPARH → PVHlp projections.
Figure 6.
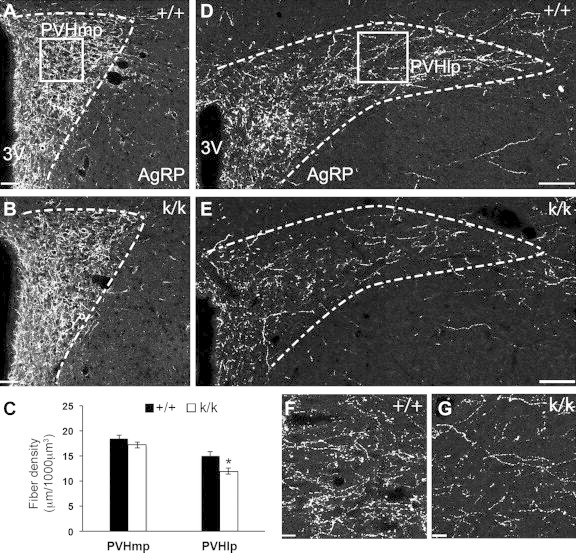
Impaired development of AgRP-containing projections in Bdnfklox/kloxmice. Immunohistochemical labeling of AgRP was performed in Bdnfklox/klox (k/k) animals and Bdnf+/+ (+/+) littermates on P12. (A,B) Representative images of AgRP projections to the PVHmp in +/+ and k/k animals. Dotted lines illustrate the morphological boundaries of the nucleus. 3V, the third ventricle. Scale bar, 42 μm. Square indicates the location of the region in the PVHmp used for quantification. (D,E) Representative images of AgRP projections to the PVHlp in WT and Bdnfklox/klox mice. Scale bar, 80 μm. Square indicates the location of the region in the PVHlp used for quantification, further illustrated by representative high magnification images (acquired by using a 63x oil corrected lens) in (F) and (G). Scale bar, 13 μm. (C) Quantification of AgRP fiber density in +/+ (n=7) and k/k (n = 10) mice. Data are expressed as mean ± SEM of fiber density in a defined volume. *p = 0.014 by unpaired t-test.
We next examined the innervation of α-MSH containing fibers in the PVH. In contrast to AgRP projections, α-MSH projections to the PVH were similar between Bdnf+/+ and Bdnfklox/klox mice at P12 (μm/1000 μm3): 4.08 ± 1.03 vs. 3.74 ± 0.47, p = 0.742 in the PVHmp and 2.86 ± 0.35 vs. 2.67 ± 0.28, p = 0.672 in the PVHlp. However, the density of α-MSH containing projections to both the dorsal (DMHd) and ventral (DMHv) subregions of the DMH in Bdnfklox/klox mice was significantly reduced compared to Bdnf+/+ littermates (Figure 7). This result is consistent with our previous observation in adult Bdnfklox/klox mice [15], indicating that BDNF derived from long 3′ UTR Bdnf mRNA is required for normal development of α-MSH projections to the DMH. The density of α-MSH projections to other analyzed brain areas was similar between Bdnf+/+ and Bdnfklox/klox mice (μm/1000 μm3): 2.11 ± 0.33 vs. 1.93 ± 0.15, p = 0.599 in LHAs, 5.22 ± 1.12 vs. 4.63 ± 0.47, p = 0.578 in aBNST, and 5.46 ± 0.70 vs. 4.65 ± 0.42, p = 0.311 in PVT.
Figure 7.
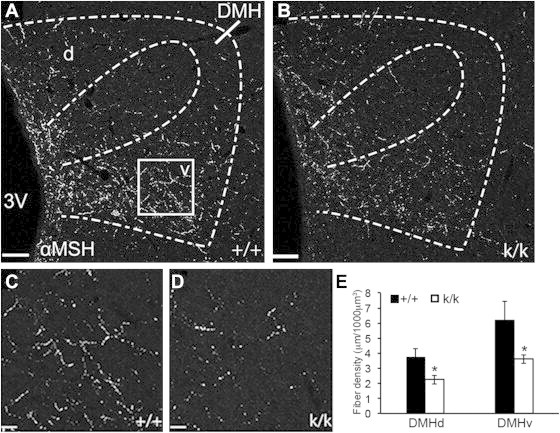
Impaired development of α-MSH-containing projections in Bdnfklox/kloxmice. Immunohistochemical labeling of α-MSH projections was performed in Bdnfklox/klox (k/k) animals and control Bdnf+/+ littermates (+/+) on P12. (A,B) Images of α-MSH innervation of the dorsal (d) and ventral (v) subregions of the DMH in +/+ and k/k animals. Scale bar, 70 μm. Dotted lines illustrate the morphological boundaries of the nucleus and different subregions of the DMH. 3V, the third ventricle. Square shows the location of the region in the DMHv used for quantification, further illustrated by representative high magnification images in (C) and (D). Scale bar, 13 μm. (E) Quantification of α-MSH fiber density in the DMHd and DMHv in +/+ (n=6) and k/k (n = 10) mice. Data are expressed as mean ± SEM of fiber density in a defined volume. *p = 0.029 for DMHd and *p = 0.025 for DMHv, respectively, by unpaired t-test.
To determine whether the deficit in AgRP projections to the PVHlp in P12 Bdnfklox/klox mice also persists into adulthood, as does the deficit in α-MSH projections to the DMH, brain sections collected from Bdnf+/+ and Bdnfklox/klox mice at 5 weeks of age were processed in the same manner as were brain sections derived from mice on P12. Similarly, we observed a significant reduction in AgRP immunoreactive fibers and this reduction was restricted to the lateral part of the PVH in Bdnfklox/klox mice, compared with control Bdnf+/+ littermates (Supplementary Figure 2). To examine whether a late-onset impairment in α-MSH projections to the PVH might have occurred in Bdnfklox/klox mice at 5 weeks of age, we analyzed PVH α-MSH fiber density and found no difference between Bdnf+/+ and Bdnfklox/klox mice (μm/1000 μm3): 5.98 ± 0.73 vs. 6.19 ± 0.95, p = 0.865 in the PVHlp and 3.18 ± 0.26 vs. 3.56 ± 0.08, p = 0.415 in the PVHmp. Together, these data indicate that long 3′ UTR Bdnf mRNA is required for normal development of α-MSH innervation of the DMH and AgRP innervation of the PVHlp, as opposed to mediating a regressive event in adults.
3.5. BDNF differentially regulates synaptic inputs onto POMC and NPY neurons
In addition to promoting axonal growth, BDNF also plays an important role in synaptogenesis and synaptic functions [7,32]. To investigate the impact of long 3′ UTR Bdnf mRNA on synaptic architecture and synaptic function of POMC and NPY/AgRP neurons in Bdnfklox/klox mice, we first used immunohistochemistry to visualize the presynaptic markers Vglut2 and Vgat in order to determine the number of excitatory and inhibitory synapses on the somas of GFP-labeled POMC or NPY neurons in Pomc-hrGFP;Bdnf+/+ and Pomc-hrGFP;Bdnfklox/klox mice or Npy-hrGFP;Bdnf+/+ and Npy-hrGFP;Bdnfklox/klox mice at 5 weeks of age. Using computer-assisted 3D-image analysis as previously described [20], we examined the density of axosomatic inputs onto cell bodies (Figure 8A). We found that the number of presynaptic inhibitory inputs onto cell bodies of both NPY and POMC neurons was comparable between genotypes (inputs/1000 μm3): 78 ± 2 vs. 76 ± 2, p = 0.436 on NPY neurons and 73 ± 6 vs. 80 ± 5, p = 0.411 on POMC neurons for Bdnf+/+ (n = 8) and Bdnfklox/klox (n = 7) mice, respectively (Figure 8B,C). However, excitatory inputs onto POMC and NPY neurons in Bdnfklox/klox mice were different. In POMC neurons, there was a ∼17% increase in the density of terminals labeled for Vglut2 that end on cell bodies in Bdnfklox/klox mice compared with their Bdnf+/+ littermates (76 ± 4 vs. 65 ± 2, respectively; n = 5; p = 0.046; Figure 8C). In contrast, in NPY neurons there was an ∼11.5% decrease in Vglut2 density onto cell bodies in Bdnfklox/klox mice compared to controls (53 ± 2 vs. 60 ± 2, respectively; n = 5; p = 0.013; Figure 8B). These results indicate that lacking long 3′ UTR Bdnf mRNA increases presynaptic excitatory inputs onto the POMC cell bodies, but does the opposite to NPY neurons.
Figure 8.
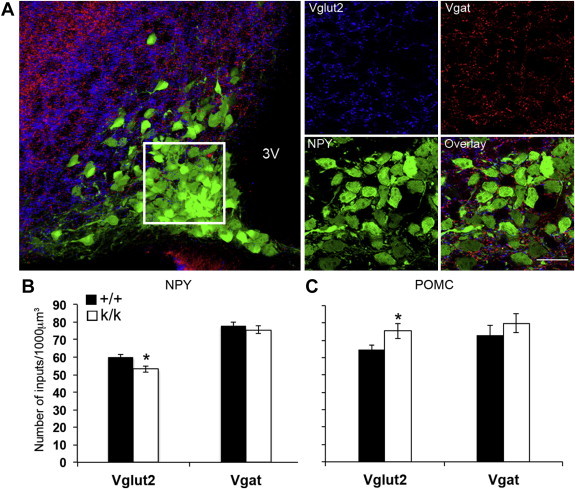
Excitatory and inhibitory presynaptic inputs onto somas of NPY and POMC neurons in the ARH. (A) Confocal images illustrating excitatory (Vglut2) and inhibitory (Vgat) immunoreactive appositions on the somas of ARH NPY neurons visualized by hrGFP in brain sections obtained from Npy-hrGFP mice. The outlined region identifies volume for quantification and is displayed at higher magnification by individual channel to visualize Vglut2 (blue), Vgat (red), and NPY (green) signals, respectively. 3V, third ventricle. Scale bar, 20 μm. (B,C) Quantitative comparison of Vglut2 and Vgat density on the somas of NPY and POMC neurons between Bdnf+/+ (+/+) and Bdnfklox/klox (k/k) mice. Data are expressed as mean ± SEM of inputs per volume sampled. *p = 0.013 for Vglut2 on NPY neurons and *p = 0.046 for Vglut2 on POMC neurons by unpaired t-test.
4. Discussion
We previously showed that BDNF derived from translation of long 3′ UTR Bdnf mRNA, likely in dendrites, is necessary for preventing hyperphagia and obesity in mice [15]. In the present study, we examined the possibility that BDNF affects appetite in part by regulating development of axonal projections and neural inputs of ARH neurons. Our data show that axonal projections of discrete groups of ARH neurons are impaired in Bdnfklox/klox mice that are deficient in long 3′ UTR Bdnf mRNA.
BDNF acts on TrkB-expressing neurons to exert its effect on energy balance [11]. We found that TrkB was expressed in a significant number of neurons and astrocytes in the ARH, a brain structure important for the control of energy balance [33]. Three groups of neurons in the ARH have been shown to play an important role in the control of energy balance; these are POMC neurons, NPY/AgRP neurons, and Rip-Cre neurons [4,22]. Our colocalization experiments indicate that approximately 30% of TrkBARH neurons express either POMC or NPY, but they do not overlap with Rip-Cre neurons. Thus, the majority of TrkBARH neurons represent a population of previously uncharacterized neurons.
TrkBARH neurons are capable of sensing hunger and satiety signals, and it is likely that their projections relay these signals to other brain regions. Our results show that different subsets of TrkBARH neurons are activated in fasting or re-feeding conditions. Furthermore, some TrkBARH neurons express LepRb, in addition to POMC or NPY. It has been demonstrated that fasting and re-feeding induce c-Fos expression in NPY/AgRP and POMC neurons, respectively [34–36]. Given the resemblance in spatial distribution within the ARH between the fasting-activated TrkB neurons and NPY/AgRP neurons and between the re-feeding-activated TrkB neurons and POMC neurons, it is possible that the activated TrkB neurons under these two nutritional states are those that co-express either NPY/AgRP or POMC. In future studies it will be important to manipulate these TrkB neurons genetically in order to understand their precise role in the control of energy balance. Furthermore, TrkB is also expressed in many astrocytes of the ARH, and it remains to be determined whether astrocytic TrkB is involved in the regulation of energy balance.
Some neurons in the brain are dependent on BDNF for survival [37,38]; however, BDNF derived from long 3′ UTR Bdnf mRNA appears not to directly impact the survival of ARH neurons, as Bdnfklox/klox mice have normal numbers of POMC, NPY, and TrkB neurons in the ARH. This result is consistent with our previous observation that the levels of Pomc and Npy mRNAs in Bdnfklox/klox mice are comparable with those in Bdnf +/+ mice [15]. In contrast, BDNF derived from long 3′ UTR Bdnf mRNA does have a profound effect on the growth of axons extending from ARH neurons. A drastic reduction in the projection of ARH neurons to the periventricular part of the PVH was first revealed in Bdnfklox/klox mice through visualization of ARH projections with of Dil axonal labeling. Subsequent analyses further unveiled specific impairments of AgRPARH → PVHlp and POMCARH → DMH projections in Bdnfklox/klox mice, which occurred at P12 and persisted into adulthood. These specific impairments are consistent with our observation that only a small percentage of AgRP or POMC neurons in the ARH express TrkB, because BDNF deficiency should only impair axonal growth of TrkB-expressing neurons. These neuroanatomical results suggest that the POMC+/TrkB+ neurons in the ARH mainly project to the DMH, whereas the NPY+/AgRP+/TrkB+ neurons in the ARH preferentially innervate the PVHlp. The remaining TrkBARH neurons may send axons to the periventricular part of the PVH, or to other targets. In consideration of the marked impact of BDNF deficiency on projections of ARH neurons to the PVH as revealed by DiI axonal labeling, it is possible that TrkB is expressed in more ARH neurons at earlier ages than in adulthood.
BDNF is expressed in the DMH and PVH but not in the ARH [11]. It is conceivable that TrkB neurons in the ARH interact with BDNF-synthesizing neurons in the PVH and DMH in a retrograde manner [39]. Consequently, the lack of dendritically synthesized BDNF in Bdnfklox/klox mice would dampen axonal projection from TrkBARH neurons due to declined formation of BDNF-dependent axodendritic synapses. Alternatively, BDNF-expressing neurons may interact with TrkBARH neurons in an anterograde manner, since immunoreactivity of BDNF terminals is detected in ARH [40] and some populations of PVH neurons have been shown to innervate ARH neurons [41,42]. In addition to PVH and DMH, ARH TrkB neurons may also interact with BDNF-expressing neurons in the VMH, where BDNF is particularly enriched and at least some VMH neurons have been shown to project to the ARH [11,43]. Therefore, it is conceivable that impairments in projections of TrkBARH neurons in Bdnfklox/klox mice are secondary to an altered BDNFVMH → TrkBARH interaction. However, further studies are needed to address whether BDNF derived from long 3′ UTR Bdnf mRNA, likely in somas, is released at axonal terminals. Additionally, the identity of BDNF neurons in the DMH and PVH that interact with TrkBARH neurons also needs to be established.
Impaired ARH to PVH projections have also been demonstrated in the leptin-deficient ob/ob mouse [19,20] and the diet-induced obese (DIO) rat [30]. A recent study reported that maternal high-fat diet feeding during lactation not only predisposes the offspring to obesity but also impairs the formation of AgRP and POMC projections to hypothalamic targets, including the PVH, DMH, and LHA [44]. While relatively little is known about the function of ARH projections to the DMH or LHA, recent studies have clearly demonstrated the significance of the connections between the ARH and the PVH in the control of energy balance [22,41,42,45]. These studies suggest that the observed projection impairments of TrkBARH neurons may contribute in part to the obesity phenotype developed in Bdnfklox/klox mice.
Impaired axonal projections from ARH neurons may occur together with altered synaptic inputs to ARH neurons in Bdnfklox/klox mice. Our immunohistochemical evaluation of excitatory and inhibitory inputs to ARH neurons revealed that there were more glutamatergic synapses on cell bodies of POMC neurons and fewer glutamatergic synapses on cell bodies of NPY neurons in Bdnfklox/klox mice, compared with those of Bdnf+/+ mice. Because these synaptic changes would be expected to inhibit food intake [4], we believe that they represent a compensatory response to hyperphagia displayed by Bdnfklox/klox mice rather than a direct effect of BDNF deficiency. This argument is consistent with our observation that the vast majority of POMC neurons and NPY neurons in the ARH do not express TrkB and thereby would not be affected directly by BDNF deficiency. These results also suggest that BDNF and melanocortin regulate energy balance through distinct neuronal circuits and that an increase in melanocortin signaling could not compensate for the deficit in BDNF signaling to counter hyperphagia.
In conclusion, our results indicate that lack of BDNF derived from long 3′ UTR Bdnf mRNA impairs development of projections of TrkB neurons in the ARH. This deficit should contribute to the massive obesity observed in Bdnfklox/klox mice. Additionally, our results show that the majority of TrkB neurons in the ARH are distinct from POMC neurons, NPY/AgRP neurons, and Rip-Cre neurons in this nucleus and may represent a previously uncharacterized component of ARH projections that are specified by BDNF signaling during development. These TrkB neurons appear to be activated in response to changes in nutritional state and additional studies are needed to elucidate the precise role of these neurons in the control of energy balance.
Acknowledgments
We thank Dr. David Ginty for the TrkBCreERT2/+ mouse strain and Ms. Hye Yun Han
for assistance in neuronal quantification. This work was supported by the grant from
the National Institutes of Health to BX and RBS (R01 DK089237).
Contributor Information
Richard B. Simerly, Email: rsimerly@usc.edu.
Baoji Xu, Email: bxu@scripps.edu.
Conflict of interest
None declared.
Appendix A. Supplementary data
The following is the supplementary data related to this article:
References
- 1.Cone R.D., Cowley M.A., Butler A.A., Fan W., Marks D.L., Low M.J. The arcuate nucleus as a conduit for diverse signals relevant to energy homeostasis. International Journal of Obesity and Related Metabolic Disorders. 2001;25:S63–S67. doi: 10.1038/sj.ijo.0801913. [DOI] [PubMed] [Google Scholar]
- 2.Williams K.W., Elmquist J.K. From neuroanatomy to behavior: central integration of peripheral signals regulating feeding behavior. Nature Neuroscience. 2012;15:1350–1355. doi: 10.1038/nn.3217. [DOI] [PMC free article] [PubMed] [Google Scholar]
- 3.Bouret S.G. Organizational actions of metabolic hormones. Frontiers in Neuroendocrinology. 2013;34:18–26. doi: 10.1016/j.yfrne.2013.01.001. [DOI] [PMC free article] [PubMed] [Google Scholar]
- 4.Cone R.D. Anatomy and regulation of the central melanocortin system. Nature Neuroscience. 2005;8:571–578. doi: 10.1038/nn1455. [DOI] [PubMed] [Google Scholar]
- 5.Chao M.V. Neurotrophins and their receptors: a convergence point for many signalling pathways. Nature Reviews Neuroscience. 2003;4:299–309. doi: 10.1038/nrn1078. [DOI] [PubMed] [Google Scholar]
- 6.Waterhouse E.G., Xu B. New insights into the role of brain-derived neurotrophic factor in synaptic plasticity. Molecular and Cellular Neuroscience. 2009;42:81–89. doi: 10.1016/j.mcn.2009.06.009. [DOI] [PMC free article] [PubMed] [Google Scholar]
- 7.Park H., Poo M.M. Neurotrophin regulation of neural circuit development and function. Nature reviews. Neuroscience. 2013;14:7–23. doi: 10.1038/nrn3379. [DOI] [PubMed] [Google Scholar]
- 8.Rios M. BDNF and the central control of feeding: accidental bystander or essential player? Trends in Neurosciences. 2013;36:83–90. doi: 10.1016/j.tins.2012.12.009. [DOI] [PMC free article] [PubMed] [Google Scholar]
- 9.Vanevski F., Xu B. Molecular and neural bases underlying roles of BDNF in the control of body weight. Frontiers in Neuroscience. 2013;7:37. doi: 10.3389/fnins.2013.00037. [DOI] [PMC free article] [PubMed] [Google Scholar]
- 10.Rios M., Fan G., Fekete C., Kelly J., Bates B., Kuehn R. Conditional deletion of brain-derived neurotrophic factor in the postnatal brain leads to obesity and hyperactivity. Molecular Endocrinology. 2001;15:1748–1757. doi: 10.1210/mend.15.10.0706. [DOI] [PubMed] [Google Scholar]
- 11.Xu B., Goulding E.H., Zang K., Cepoi D., Cone R.D., Jones K.R. Brain-derived neurotrophic factor regulates energy balance downstream of melanocortin-4 receptor. Nature Neuroscience. 2003;6:736–742. doi: 10.1038/nn1073. [DOI] [PMC free article] [PubMed] [Google Scholar]
- 12.Yeo G.S., Connie Hung C.C., Rochford J., Keogh J., Gray J., Sivaramakrishnan S. A de novo mutation affecting human TrkB associated with severe obesity and developmental delay. Nature Neuroscience. 2004;7:1187–1189. doi: 10.1038/nn1336. [DOI] [PubMed] [Google Scholar]
- 13.Gray J., Yeo G.S., Cox J.J., Morton J., Adlam A.L., Keogh J.M. Hyperphagia, severe obesity, impaired cognitive function, and hyperactivity associated with functional loss of one copy of the Brain-Derived Neurotrophic Factor (BDNF) Gene. Diabetes. 2006;55:3366–3371. doi: 10.2337/db06-0550. [DOI] [PMC free article] [PubMed] [Google Scholar]
- 14.Han J.C., Liu Q.R., Jones M., Levinn R.L., Menzie C.M., Jefferson-George K.S. Brain-derived neurotrophic factor and obesity in the WAGR syndrome. The New England Journal of Medicine. 2008;359:918–927. doi: 10.1056/NEJMoa0801119. [DOI] [PMC free article] [PubMed] [Google Scholar]
- 15.Liao G.Y., An J.J., Gharami K., Waterhouse E.G., Vanevski F., Jones K.R. Dendritically targeted Bdnf mRNA is essential for energy balance and response to leptin. Nature Medicine. 2012;18:564–571. doi: 10.1038/nm.2687. [DOI] [PMC free article] [PubMed] [Google Scholar]
- 16.Timmusk T., Palm K., Metsis M., Reintam T., Paalme V., Saarma M. Multiple promoters direct tissue-specific expression of the rat BDNF gene. Neuron. 1993;10:475–489. doi: 10.1016/0896-6273(93)90335-o. [DOI] [PubMed] [Google Scholar]
- 17.An J.J., Gharami K., Liao G.Y., Woo N.H., Lau A.G., Vanevski F. Distinct role of long 3' UTR BDNF mRNA in spine morphology and synaptic plasticity in hippocampal neurons. Cell. 2008;134:175–187. doi: 10.1016/j.cell.2008.05.045. [DOI] [PMC free article] [PubMed] [Google Scholar]
- 18.Gorski J.A., Zeiler S.R., Tamowski S., Jones K.R. Brain-derived neurotrophic factor is required for the maintenance of cortical dendrites. Journal of Neuroscience. 2003;23:6856–6865. doi: 10.1523/JNEUROSCI.23-17-06856.2003. [DOI] [PMC free article] [PubMed] [Google Scholar]
- 19.Bouret S.G., Draper S.J., Simerly R.B. Trophic action of leptin on hypothalamic neurons that regulate feeding. Science. 2004;304:108–110. doi: 10.1126/science.1095004. [DOI] [PubMed] [Google Scholar]
- 20.Bouyer K., Simerly R.B. Neonatal leptin exposure specifies innervation of presympathetic hypothalamic neurons and improves the metabolic status of leptin-deficient mice. Journal of Neuroscience. 2013;33:840–851. doi: 10.1523/JNEUROSCI.3215-12.2013. [DOI] [PMC free article] [PubMed] [Google Scholar]
- 21.Choudhury A.I., Heffron H., Smith M.A., Al-Qassab H., Xu A.W., Selman C. The role of insulin receptor substrate 2 in hypothalamic and beta cell function. Journal of Clinical Investigation. 2005;115:940–950. doi: 10.1172/JCI24445. [DOI] [PMC free article] [PubMed] [Google Scholar]
- 22.Kong D., Tong Q., Ye C., Koda S., Fuller P.M., Krashes M.J. GABAergic RIP-Cre neurons in the arcuate nucleus selectively regulate energy expenditure. Cell. 2012;151:645–657. doi: 10.1016/j.cell.2012.09.020. [DOI] [PMC free article] [PubMed] [Google Scholar]
- 23.Xu B., Zang K., Ruff N.L., Zhang Y.A., McConnell S.K., Stryker M.P. Cortical degeneration in the absence of neurotrophin signaling: dendritic retraction and neuronal loss after removal of the receptor TrkB. Neuron. 2000;26:233–245. doi: 10.1016/s0896-6273(00)81153-8. [DOI] [PubMed] [Google Scholar]
- 24.Liao G.Y., Li Y., Xu B. Ablation of TrkB expression in RGS9-2 cells leads to hyperphagic obesity. Molecular Metabolism. 2013;2:491–497. doi: 10.1016/j.molmet.2013.08.002. [DOI] [PMC free article] [PubMed] [Google Scholar]
- 25.Ahima R.S., Prabakaran D., Mantzoros C., Qu D., Lowell B., Maratos-Flier E. Role of leptin in the neuroendocrine response to fasting. Nature. 1996;382:250–252. doi: 10.1038/382250a0. [DOI] [PubMed] [Google Scholar]
- 26.Schwartz M.W., Baskin D.G., Bukowski T.R., Kuijper J.L., Foster D., Lasser G. Specificity of leptin action on elevated blood glucose levels and hypothalamic neuropeptide Y gene expression in ob/ob mice. Diabetes. 1996;45:531–535. doi: 10.2337/diab.45.4.531. [DOI] [PubMed] [Google Scholar]
- 27.Cowley M.A., Smart J.L., Rubinstein M., Cerdan M.G., Diano S., Horvath T.L. Leptin activates anorexigenic POMC neurons through a neural network in the arcuate nucleus. Nature. 2001;411:480–484. doi: 10.1038/35078085. [DOI] [PubMed] [Google Scholar]
- 28.Munzberg H., Huo L., Nillni E.A., Hollenberg A.N., Bjorbaek C. Role of signal transducer and activator of transcription 3 in regulation of hypothalamic proopiomelanocortin gene expression by leptin. Endocrinology. 2003;144:2121–2131. doi: 10.1210/en.2002-221037. [DOI] [PubMed] [Google Scholar]
- 29.Unger T.J., Calderon G.A., Bradley L.C., Sena-Esteves M., Rios M. Selective deletion of Bdnf in the ventromedial and dorsomedial hypothalamus of adult mice results in hyperphagic behavior and obesity. Journal of Neuroscience. 2007;27:14265–14274. doi: 10.1523/JNEUROSCI.3308-07.2007. [DOI] [PMC free article] [PubMed] [Google Scholar]
- 30.Bouret S.G., Gorski J.N., Patterson C.M., Chen S., Levin B.E., Simerly R.B. Hypothalamic neural projections are permanently disrupted in diet-induced obese rats. Cell Metabolism. 2008;7:179–185. doi: 10.1016/j.cmet.2007.12.001. [DOI] [PMC free article] [PubMed] [Google Scholar]
- 31.Betley J.N., Cao Z.F., Ritola K.D., Sternson S.M. Parallel, redundant circuit organization for homeostatic control of feeding behavior. Cell. 2013;155:1337–1350. doi: 10.1016/j.cell.2013.11.002. [DOI] [PMC free article] [PubMed] [Google Scholar]
- 32.Lu B., Nagappan G., Lu Y. BDNF and synaptic plasticity, cognitive function, and dysfunction. Handbook of Experimental Pharmacology. 2014;220:223–250. doi: 10.1007/978-3-642-45106-5_9. [DOI] [PubMed] [Google Scholar]
- 33.Morton G.J., Cummings D.E., Baskin D.G., Barsh G.S., Schwartz M.W. Central nervous system control of food intake and body weight. Nature. 2006;443:289–295. doi: 10.1038/nature05026. [DOI] [PubMed] [Google Scholar]
- 34.Singru P.S., Sanchez E., Fekete C., Lechan R.M. Importance of melanocortin signaling in refeeding-induced neuronal activation and satiety. Endocrinology. 2007;148:638–646. doi: 10.1210/en.2006-1233. [DOI] [PubMed] [Google Scholar]
- 35.Leshan R.L., Louis G.W., Jo Y.H., Rhodes C.J., Munzberg H., Myers M.G., Jr. Direct innervation of GnRH neurons by metabolic- and sexual odorant-sensing leptin receptor neurons in the hypothalamic ventral premammillary nucleus. Journal of Neuroscience. 2009;29:3138–3147. doi: 10.1523/JNEUROSCI.0155-09.2009. [DOI] [PMC free article] [PubMed] [Google Scholar]
- 36.Liu T., Kong D., Shah B.P., Ye C., Koda S., Saunders A. Fasting activation of AgRP neurons requires NMDA receptors and involves spinogenesis and increased excitatory tone. Neuron. 2012;73:511–522. doi: 10.1016/j.neuron.2011.11.027. [DOI] [PMC free article] [PubMed] [Google Scholar]
- 37.Minichiello L., Klein R. TrkB and TrkC neurotrophin receptors cooperate in promoting survival of hippocampal and cerebellar granule neurons. Genes & Development. 1996;10:2849–2858. doi: 10.1101/gad.10.22.2849. [DOI] [PubMed] [Google Scholar]
- 38.Baydyuk M., Xie Y., Tessaro llo L., Xu B. Midbrain-derived neurotrophins support survival of immature striatal projection neurons. Journal of Neuroscience. 2013;33:3363–3369. doi: 10.1523/JNEUROSCI.3687-12.2013. [DOI] [PMC free article] [PubMed] [Google Scholar]
- 39.Zweifel L.S., Kuruvilla R., Ginty D.D. Functions and mechanisms of retrograde neurotrophin signalling. Nature Reviews Neuroscience. 2005;6:615–625. doi: 10.1038/nrn1727. [DOI] [PubMed] [Google Scholar]
- 40.Conner J.M., Lauterborn J.C., Yan Q., Gall C.M., Varon S. Distribution of brain-derived neurotrophic factor (BDNF) protein and mRNA in the normal adult rat CNS: evidence for anterograde axonal transport. Journal of Neuroscience. 1997;17:2295–2313. doi: 10.1523/JNEUROSCI.17-07-02295.1997. [DOI] [PMC free article] [PubMed] [Google Scholar]
- 41.Krashes M.J., Shah B.P., Madara J.C., Olson D.P., Strochlic D.E., Garfield A.S. An excitatory paraventricular nucleus to AgRP neuron circuit that drives hunger. Nature. 2014;507:238–242. doi: 10.1038/nature12956. [DOI] [PMC free article] [PubMed] [Google Scholar]
- 42.Maejima Y., Sakuma K., Santoso P., Gantulga D., Katsurada K., Ueta Y. Oxytocinergic circuit from paraventricular and supraoptic nuclei to arcuate POMC neurons in hypothalamus. FEBS Letters. 2014;588:4404–4412. doi: 10.1016/j.febslet.2014.10.010. [DOI] [PubMed] [Google Scholar]
- 43.Sternson S.M., Shepherd G.M., Friedman J.M. Topographic mapping of VMH-->arcuate nucleus microcircuits and their reorganization by fasting. Nature Neuroscience. 2005;8:1356–1363. doi: 10.1038/nn1550. [DOI] [PubMed] [Google Scholar]
- 44.Vogt M.C., Paeger L., Hess S., Steculorum S.M., Awazawa M., Hampel B. Neonatal insulin action impairs hypothalamic neurocircuit formation in response to maternal high-fat feeding. Cell. 2014;156:495–509. doi: 10.1016/j.cell.2014.01.008. [DOI] [PMC free article] [PubMed] [Google Scholar]
- 45.Atasoy D., Betley J.N., Su H.H., Sternson S.M. Deconstruction of a neural circuit for hunger. Nature. 2012;488:172–177. doi: 10.1038/nature11270. [DOI] [PMC free article] [PubMed] [Google Scholar]
Associated Data
This section collects any data citations, data availability statements, or supplementary materials included in this article.