

Large-scale genomic studies have shown that half of epithelial ovarian cancers (EOCs) have alterations in genes regulating homologous recombination (HR) repair1. Loss of HR accounts for the genomic instability of EOCs and for their cellular hyper-dependence on alternative poly-ADP ribose polymerase (PARP)-mediated DNA repair mechanisms2-5. Previous studies have implicated the DNA polymerase POLQ6 in a pathway required for the repair of DNA double-strand breaks7-9, referred to as the error-prone microhomology-mediated end-joining (MMEJ) pathway10-13. Whether POLQ interacts with canonical DNA repair pathways to prevent genomic instability remains unknown. Here we report an inverse correlation between HR activity and POLQ expression in EOCs. While knockdown of POLQ in HR-proficient cells up-regulates HR activity and RAD51 nucleofilament assembly, knockdown of POLQ in HR-deficient EOCs enhances cell death. Consistent with these results, genetic inactivation of an HR gene (Fancd2) and Polq in mice results in embryonic lethality. Moreover, POLQ contains RAD51 binding motifs, and it blocks RAD51-mediated recombination. Our results reveal a synthetic lethal relationship between the HR pathway and POLQ-mediated repair in EOCs, and identify POLQ as a novel druggable target for cancer therapy.
To examine changes in polymerase activity between tumors and normal tissues, we screened polymerase gene expression profiles in a broad number of cancers (Supplementary Table 1). Gene set enrichment analysis (GSEA) revealed specific and recurrent overexpression of POLQ in EOCs (Extended Data Fig. 1a-c). POLQ was up-regulated in a grade-dependent manner and its expression positively correlated with numerous mediators of HR (Extended Data Fig. 1d-j). Since POLQ has been suggested to play a role in DNA repair7-10, we investigated a potential role for POLQ in HR repair.
To test the relationship between POLQ expression and HR, we used a cell-based assay which measures the efficiency of recombination of two GFP alleles (DR-GFP)14. Knockdown of POLQ with siRNA (Extended Data Fig. 2a) resulted in an increase in HR efficiency, similar to that observed by depleting the anti-recombinases PARI or BLM15,16. Depletion of POLQ caused a significant increase in basal and radiation (IR)-induced RAD51 foci (Fig. 1a, b and Extended Data Fig. 2b-d), and depletion of POLQ in 293T cells conferred cellular hypersensitivity to mitomycin C (MMC) and an increase in MMC-induced chromosomal aberrations (Extended Data Fig. 2e, f). These findings suggest that human POLQ inhibits HR and participates in the maintenance of genome stability.
Figure 1. POLQ is a RAD51-interacting protein that suppresses HR.
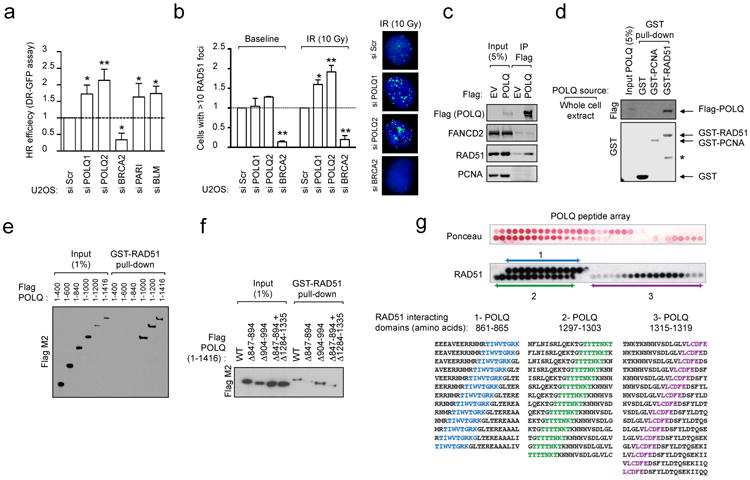
a, DR-GFP assay in U2OS cells transfected with indicated siRNA. b, Quantification of RAD51 foci in U2OS cells transfected with indicated siRNA. c, Endogenous RAD51 co-precipitates in vivo with purified full-length Flag-tagged POLQ from whole cell extracts. d, GST pull-down experiment with full-length Flag-tagged POLQ. (*: non-specific band). e, GST-RAD51 pull-down with in-vitro translated POLQ truncation mutants. f, GST-RAD51 pull-down with in-vitro translated POLQ versions missing indicated amino acids. g, Ponceau staining and immunoblotting of peptide arrays for the indicated POLQ motifs probed with recombinant RAD51. The POLQ amino acids spanning RAD51-interacting motifs are shown. Data in a and b represent mean ± s.e.m.
Given that POLQ shares structural homology with coexpressed RAD51-binding ATPases (Extended Data Fig. 1k, l), we hypothesized that POLQ might regulate HR through an interaction with RAD51. Indeed, RAD51 was detected in Flag-tagged POLQ immunoprecipitates, and purified full-length Flag-POLQ bound recombinant human RAD51 (Fig. 1c, d). Pull-down assays with recombinant GST-RAD51 and in vitro translated POLQ truncation mutants defined a region of POLQ binding to RAD51 spanning amino acid 847-894 (Fig. 1e, f and Extended Data Fig. 2g, h). Sequence homology of POLQ with the RAD51 binding domain of C. elegans RFS-117 identified a second binding region (Extended Data Fig. 2i). Peptides arrays narrowed down the RAD51 binding activity of POLQ to three distinct motifs (Fig. 1g and Extended Data Fig. 2j). Substitution arrays confirmed the interaction and highlighted the importance of the 847–894 POLQ region as both necessary and sufficient for RAD51 binding (Extended Data Fig. 3a, b). Taken together, these results indicate that POLQ is a RAD51-interacting protein that regulates HR.
In order to address the role of POLQ in HR regulation, we assessed the ability of wild-type (WT) or mutant POLQ to complement the siPOLQ-dependent increase in RAD51 foci. Full-length wild-type POLQ fully reduced IR-induced RAD51 foci, unlike POLQ mutated at ATPase catalytic residues (A-dead) or POLQ lacking interaction with RAD51 (ΔRAD51) (Fig. 2a, b). Expression of a POLQ mutant lacking the polymerase domain (ΔPol1) was sufficient to decrease IR-induced RAD51 foci, suggesting that the N-terminal half of POLQ is sufficient to disrupt RAD51 foci (Fig. 2b and Extended Data Fig. 3c, d). We next measured the ability of wild-type or mutant POLQ to complement the siPOLQ-dependent increase in HR efficiency. Again, expression of full-length POLQ or ΔPol1 decreased the recombination frequency when compared to cells expressing other POLQ constructs, suggesting that the N-terminal half of POLQ containing the RAD51 binding domain and the ATPase domain is needed to inhibit HR (Fig. 2c and Extended Data Fig. 3e).
Figure 2. POLQ inhibits RAD51-mediated recombination.
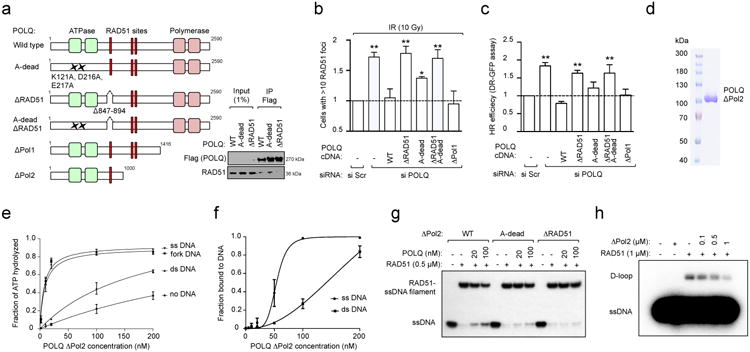
a, Schematic of POLQ mutants used in complementation studies and their interaction with RAD51. b, Quantification of RAD51 foci in U2OS cells transfected with indicated siRNA and POLQ cDNA constructs refractory to siPOLQ1. c, DR-GFP assay in U2OS cells transfected with indicated siRNA and POLQ cDNA constructs refractory to siPOLQ1. d, Coomassie-stained gel of the purified POLQ fragment. e, Quantification of POLQ ATPase activity. f, Quantification of POLQ binding to ssDNA and dsDNA. g, RAD51-ssDNA nucleofilament assembly assay. h, Assessment of RAD51-dependent D-loop formation. Data in b, c, e and f represent mean ± s.e.m.
A purified recombinant POLQ fragment (ΔPol2) from insect cells exhibited low levels of basal ATPase activity, as previously reported18 (Fig. 2d, e). POLQ ATPase activity was selectively stimulated by the addition of single-stranded DNA (ssDNA) or fork DNA (Fig. 2e and Extended Data Fig. 4a). Electrophoretic mobility gel shift assays (EMSA) showed specific binding of POLQ to ssDNA (Fig. 2f and Extended Data Fig. 4b). We incubated ΔPol2 with ssDNA and measured RAD51-ssDNA nucleofilament assembly. Interestingly, RAD51-ssDNA assembly was reduced by wild-type ΔPol2 but not by A-dead or ΔRAD51, indicating that POLQ negatively affects RAD51-ssDNA assembly through its RAD51 binding and ATPase activities (Fig. 2g and Extended Data Fig. 4c-f). Furthermore, POLQ decreased the efficiency of D-loop formation, confirming that POLQ is a negative regulator of HR (Fig. 2h and Extended Data Fig. 4g-j).
Since POLQ is up-regulated in subgroups of cancers associated with HR deficiency (Fig. 3a) and POLQ activity shows specificity for replicative stress-mediated structures (ss and fork DNA) (Fig. 2e, f), we examined the cellular functions of POLQ under replicative stress. Subcellular fractionation revealed that POLQ is enriched in chromatin in response to ultraviolet (UV) light; and RAD51 binding by POLQ was enhanced by UV exposure, suggesting that POLQ regulates HR in cells under replicative stress (Extended Data Fig. 5a, b). POLQ-depleted cells were hypersensitive to cellular stress and DNA damage along with an exacerbated checkpoint activation and increased γH2AX phosphorylation (Fig. 3b, c). Furthermore, the cell cycle progression of POLQ-depleted cells was impaired after DNA damage (Fig. 3d, e). To determine the role of POLQ in replication dynamics, single-molecule analyses were performed on extended DNA fibers19. Abnormalities in replication fork progression were observed in POLQ-depleted cells (Fig. 3f, g and Extended Data Fig. 5c, d). These results suggest that POLQ maintains genomic stability at stalled or collapsed replication forks by promoting fork restart.
Figure 3. POLQ promotes S phase progression and recovery of stalled forks.
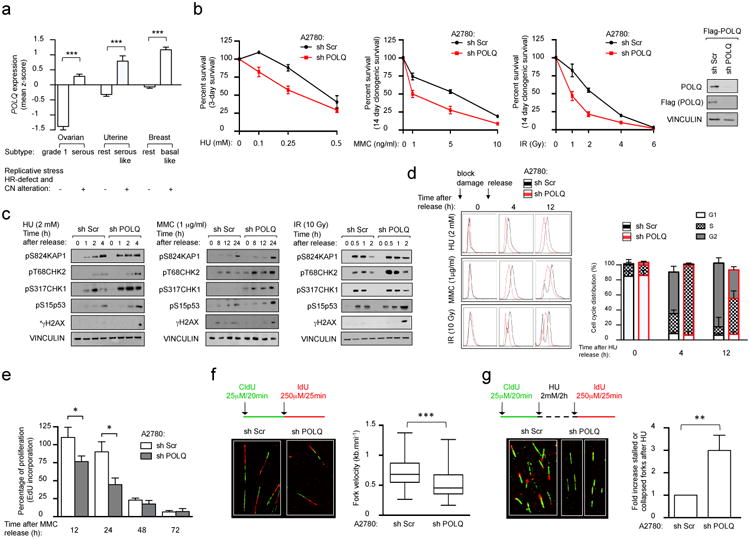
a, POLQ gene expression in subtypes of cancers with HR deficiency. b, Survival assays of A2780 cells exposed to the indicated DNA-damaging agents. Immunoblot showing silencing efficiency. c, Immunoblot analyses following pulse treatments with DNA-damaging agents (*γH2AX: see methods). d, Cell cycle progression of synchronized A2780 cells. A representative cell cycle distribution. e, Fraction of cycling A2780 cells measured by EdU incorporation. f, Quantification of DNA fiber lengths. g, Percentage of stalled forks. All experiments shown in a-d were performed in two cell lines (A2780 and 293T). All data represent mean ± s.e.m. except for box plots in f that show twenty-fifth to seventy-fifth percentiles, with lines indicating the median, and whiskers indicating the smallest and largest values.
To examine the regulation of POLQ, we quantified POLQ expression by RT-qPCR. POLQ was selectively up-regulated in HR-deficient ovarian cancer cell lines. Complementation of a BRCA1 or FANCD2-deficient cell lines, restored normal HR function and reduced POLQ expression to normal levels. Conversely, siRNA-mediated inhibition of HR genes increased POLQ expression (Extended Data Fig. 5e, f). POLQ expression was significantly higher in subgroups of cancers with HR deficiency and a high genomic instability pattern20 (Fig. 3a and Extended Data Fig. 5g). Patients with high POLQ expression had a better response to platinum chemotherapy, a surrogate for HR deficiency, suggesting that POLQ expression inversely correlates with HR activity and may be useful as a biomarker for platinium sensitivity (Extended Data Fig. 5h, i). Together, these data indicate that increased POLQ expression is driven by HR deficiency.
To assess the possible synthetic lethality between HR genes and POLQ, we generated an HR-deficient ovarian tumor cell line, A2780-shFANCD2 cells (Extended Data Fig. 6a-c). These cells, and the parental A2780 cells, were subjected to POLQ depletion, and survival following exposure to cytotoxic drugs was measured. POLQ depletion reduced the survival of HR-deficient cells exposed to inhibitors of PARP (PARPi), cisplatin (CDDP), or MMC (Extended Data Fig. 6d-f). POLQ inhibition impaired the survival of BRCA1-deficient tumors (MDA-MB-436) after PARPi treatment but had no effect on the complemented line (MDA-MB-436 + BRCA1) (Fig. 4a). POLQ-depleted cells were hypersensitive to ATM inhibition, known to create an HR defect phenotype21. Chromosomal breakage, checkpoint activation, and γH2AX phosphorylation in response to MMC were exacerbated by POLQ depletion (Fig. 4b and Extended Data Fig. 6g, h). Furthermore, a whole-genome shRNA screen performed on HR-deficient (FANCA-/-) fibroblasts showed that shRNAs targeting POLQ impair cell survival in MMC (Extended Data Fig. 6i), suggesting that HR-deficient cells cannot survive in the absence of POLQ.
Figure 4. Synthetic lethality between HR and POLQ repair pathways.
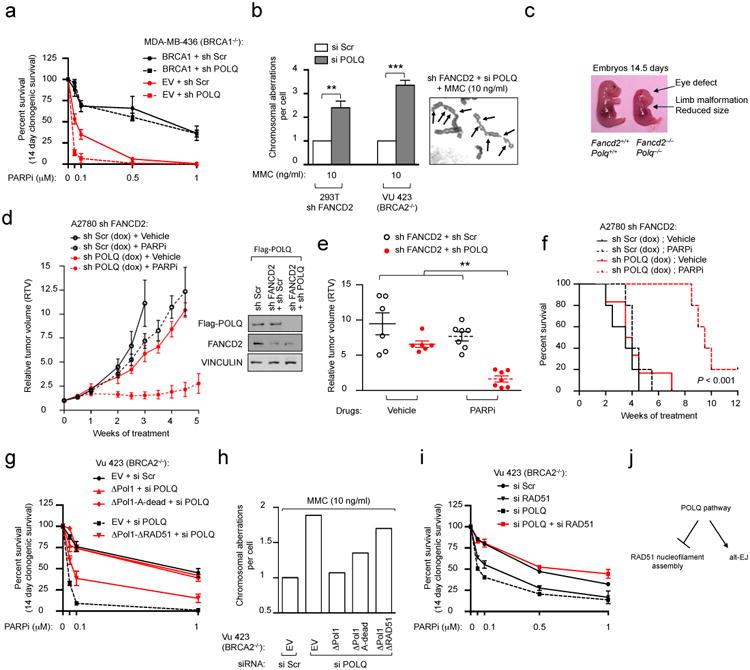
a, Clonogenic formation of BRCA1-deficient (MDA-MB-436) cells expressing indicated cDNA together with indicated shRNA. b, Chromosome breakage analysis of HR-deficient cells transfected with the indicated siRNA. A representative image is shown. Arrows indicate chromosomal aberrations. c, Embryos at day 14 of gestation. d, Growth of indicated xenografts in vivo. Immunoblot showing silencing efficiency. e, Relative tumor volumes (RTV) for individual mice treated in (d) after three weeks of treatment. f, Overall survival for mice treated with vehicle or PARPi. Log-rank P < 10-3. Clonogenic formation (g) and chromosome breakage analysis (h) of BRCA2-deficient cells expressing POLQ cDNA constructs refractory to siPOLQ1 and transfected with the indicated siRNA. i, Clonogenic formation of BRCA2-deficient cells transfected with the indicated siRNA. j, Model for role of POLQ in DNA repair. Data in a, b, g and i represent mean ± s.e.m. For data in d-f, each circle represents data from one tumor and each group represents n ≥ 7 tumors from n ≥ 6 mice. Brackets show mean ± s.e.m.
Next, we investigated the interaction between the HR and POLQ pathways in vivo by interbreeding Fancd2+/− and Polq+/− mice. Although Fancd2-/- and Polq-/- mice are viable and exhibit subtle phenotypes7,22, viable Fancd2−/−Polq−/− mice were uncommon from these matings (Extended Data Fig. 7a). The only surviving Fancd2−/−Polq−/− pups exhibited severe congenital malformations and were either found dead or died prematurely. Fancd2−/−Polq−/− embryos showed severe congenital malformations, and mouse embryonic fibroblasts (MEFs) generated from Fancd2−/−Polq−/− embryos showed hypersensitivity to PARPi (Fig. 4c and Extended Data Fig. 7b-e). These data suggest that loss of the HR and POLQ repair pathways in vivo results in embryonic lethality.
Since xenografts of tumors cells expressing shRNAs against both FANCD2 and POLQ did not stably propagate in mice (Extended Data Fig. 7f), we xenotransplanted A2780-shFANCD2 cells expressing either doxycycline-inducible POLQ or Scr shRNA in athymic nude mice. POLQ depletion significantly impaired tumor growth after PARPi treatment (Fig. 4d, e and Extended Data Fig. 7g, h). Moreover, mice bearing POLQ-depleted tumors had a survival advantage following PARPi treatment compared to control mice (Fig. 4f). POLQ-depleted HR-deficient tumor cells also exhibited decreased survival in in vivo dual-colour competition experiments (Extended Data Fig. 7i-l). Collectively, these data confirm that HR-deficient tumors are hypersensitive to inhibition of POLQ-mediated repair.
To understand which functions of POLQ are required for resistance to DNA-damaging agents, we performed a series of complementation studies in HR-deficient cells. Expression of full-length POLQ or ΔPol1, but not ΔRAD51, in HR-deficient POLQ-depleted cells treated with PARPi or MMC was able to rescue toxicity, suggesting that the anti-recombinase activity of POLQ maintains the genomic stability of HR-deficient cells (Fig. 4g, h and Extended Data Fig. 8a, b). Moreover, the toxicity induced by loss of POLQ in HR-deficient cells was rescued by depletion of RAD51 showing that, in the absence of POLQ, RAD51 is toxic to HR-deficient cells (Fig. 4i). These results suggest a role for POLQ in limiting toxic HR events23 (Extended Data Fig. 4c-f) and may explain why HR-deficient cells overexpress and depend on an anti-recombinase for survival.
High mutation rates have been observed in HR-deficient tumors24. Previous studies have shown that POLQ is an error-prone polymerase25,26 that participates in alternative end-joining (alt-EJ)10. Therefore, we assessed the role of POLQ in error-prone DNA repair in human cancer cells. POLQ inhibition reduced alt-EJ efficiency in U2OS cells, similar to the reduction observed following depletion of PARP1, another critical factor in end-joining27,28 (Extended Data Fig. 9a). Expression of full-length POLQ, ΔRAD51, or A-dead, but not the ΔPol1 mutant, complemented the cells, suggesting that the polymerase domain of POLQ is required for end-joining (Extended Data Fig. 9b). GFP-tagged full-length POLQ formed foci after UV treatment in a PARP-dependent manner (Extended Data Fig. 9c). POLQ inhibition reduced the mutation frequency induced by UV light, and tumors with high POLQ expression harbored more somatic point mutations than those with lower POLQ levels (Extended Data Fig. 9d, e). These results suggest that POLQ contributes to the mutational signature observed in some HR-deficient tumors29.
In human cancers, a deficiency in one DNA repair pathway can result in cellular hyper-dependence on a second compensatory DNA repair pathway4. Here, we show that POLQ is overexpressed in EOCs and other tumors with HR defects30. Wild-type POLQ limits RAD51-ssDNA nucleofilament assembly (Extended Data Fig. 10a) and promotes alt-EJ (Fig. 4j). We demonstrate that HR-deficient tumors are hypersensitive to inhibition of POLQ-mediated repair. Therefore, POLQ appears to channel DNA repair by antagonizing HR and promoting PARP1-dependent error-prone repair (Extended Data Fig. 10b). These results offer a potential new therapeutic target for cancers with inactivated HR.
Methods
Bioinformatic analysis
Gene Set Enrichment Analysis algorithm (GSEA, www.broadinstitute.org) was performed for the datasets summarized in Supplementary Table 1. TransLesion Synthesis (TLS) and polymerase gene sets are described in Supplementary Table 3. Row expression data were downloaded from Gene Expression Omnibus (GEO). Quantile normalizations were performed using the RMA routine through GenePattern. GSEA was run using GenePattern (www.broadinstitute.org) and corresponding P values were computed using 2,000 permutations. The DNA repair gene set used in Extended Data Figure 1g has been determined according to a list of 151 DNA genes previously used31. GSEA analysis for 151 repair genes has been performed on the ovarian serous datasets (GSE14001, GSE14007, GSE18520, GSE16708, GSE10971). The list of 20 genes shown in Extended Data Figure 1g represents the top 20 expressed gene in cancer samples (median of the 5 datasets). The waterfall plot in Extended Data Figure 1h was generated as follows: the 20 genes defined in (g) were used as a gene set; GSEA for indicated data sets was performed and the nominal P values were plotted. Supervised analysis of gene expression for GSE9891 was performed with respect to differential expression that differentiated the third of tumors with highest POLQ expression from the 2 third with lowest POLQ levels. A list of the 200 most differentially expressed probe sets between the 2 groups (Supplementary Table 2) with false discovery rate <0.05 was analyzed for biological pathways (hypergeometrical test; www.broadinstitute.org). TCGA datasets were accessed through the public TCGA data portal (www.tcga-data.nci.nih.gov). Figure 3a reflects POLQ gene expression in the ovarian carcinoma dataset GSE9891, uterine carcinoma TCGA and breast carcinoma TCGA. Normalization of POLQ expression values across datasets was performed using z-score transformation. POLQ expression values were subdivided in subgroups reflecting the stage of the disease (for GSE9891: grade 3 ovarian serous carcinoma, n=143 compared to type 1 (grade 1) ovarian cancers, n=20; for uterine: serous like tumors, n=60 compared to the rest of the tumors, n=172; for breast: basal like breast carcinoma, n=80 compared to the rest of the tumors, n=421). Progression-free survival curves were generated by the Kaplan-Meier method and differences between survival curves were assessed for statistical significance with the log-rank test. In the absence of a clinically defined cutoff point for POLQ expression levels we divided patients into 2 groups: those with POLQ mRNA levels equal to or above the median (POLQ high group) and those with values below the median (POLQ low group). We then analyzed the correlation of POLQ with outcome in each group. Patients with CCNE amplification (resistant to CDDP) were excluded from the analysis. For mutation count, we accessed data from tumors included in the TCGA datasets for which gene expression and whole-exome DNA sequencing was available. Data were accessed through the public TCGA data portal and the cBioPortal for Cancer Genomics (www.cbioportal.org). For each TCGA dataset, non-synonymous mutation count was assessed in tumors with the highest POLQ expression (top 33%) and compared to tumors with low POLQ expression (the remaining, 67%). In the uterine TCGA20, we curated all tumors except the ultra and hyper-mutated group (i.e, POLE and MSI tumors). In the breast TCGA32, all tumors were analyzed. In the ovarian TCGA1, we curated tumors harbouring molecular alterations (via mutation and epigenetic silencing) of the HR pathway.
Plasmid construction
To facilitate subcloning, a silent mutation (A390A) was introduced into the POLQ gene sequence to remove the unique Xho1 cutting site. Full-length or truncated POLQ cDNA were PCR-amplified and subcloned into pcDNA3-N-Flag, pFastBac-C-Flag, pOZ-C-Flag-HA, or GFP-C1 vectors to generate the various constructs. Point mutations and loop deletions were introduced by QuikChange II XL Site-Directed Mutagenesis Kit (Agilent Technologies) and confirmed by DNA sequencing. For POLQ rescue experiments (Fig. 4g, h and Extended Data Fig. 3d, e), POLQ cDNA constructs resistant to siPOLQ1 were generated into the pOZ-C-Flag-HA vector and the construct were stably expressed in indicated cell line by retroviral transduction. The POLQ ATPase catalytically-dead mutant (A-dead) was generated by mutating the walker A and B motifs (K121A and D216A, E217A, respectively). pOZ-C-Flag-HA POLQ constructs were generated for retroviral transduction, and stable cells were selected using magnetic Dynabeads (Life Technologies) conjugated to the IL2R antibody (Millipore).
SiRNA and shRNA sequence information
For siRNA-mediated knockdown, the following target sequences were used: POLQ (Qiagen POLQ_1 used as siPOLQ1 and Qiagen POLQ_6 used as siPOLQ2); BRCA1 (Qiagen BRCA1_13); PARP1 (Qiagen PARP1_6); REV1 (5′-CAGCGCAUCUGUGCCAAAGAA-TT-3′); BRCA2 (5′-GAAGAAUGCAGGUUUAAUATT-3′); BLM (5′-AUCAGCUAGAGGCGAUCAATT-3′); FANCD2 (5′-GGAGAUUGAUGGUCUACUATT-3′) and PARI (5′-AGGACACAUGUAAAGGGAUUGUCUATT-3′). AllStars negative control siRNA (Qiagen) served as the negative control. ShRNAs targeting human FANCD2 was previously generated in the pTRIP/DU3-MND-GFP vector33. ShRNAs targeting human POLQ (CGGGCCTCTTTAGATATAAAT), human BRCA2 (AAGAAGAATGCAGGTTTAATA) or Control (Scr, scramble) were generated in the pLKO-1 vector. POLQ (V2THS_198349) and non-silencing TRIPZ-RFP doxycycline-inducible shRNA were purchased from Open Biosystems. All shRNAs were transduced using lentivirus.
Immunoblot analysis, fractionation and pull-down assays
Cells were lysed with 1 % NP40 lysis buffer (1 % NP40, 300 mM NaCl, 0.1 mM EDTA, 50 mM Tris [pH 7.5]) supplemented with protease inhibitor cocktail (Roche), resolved by NuPAGE (Invitrogen) gels, and transferred onto nitrocellulose membrane, followed by detection using the LAS-4000 Imaging system (GE Healthcare Life Sciences). For immunoprecipitation, cells were lysed with 300 mM NaCl lysis buffer, and the lysates were diluted to 150 mM NaCl before immunoprecipitation. Lysates were incubated with anti-Flag agarose resin (Sigma) followed by washes with 150 mM NaCl buffer. In vitro transcription and translation reactions were carried out using the TNT T7 Quick Coupled Transcription-Translation System (Promega). For cellular fractionation, cells were incubated with low salt permeabilization buffer (10 mM Tris [pH 7.3], 10 mM KCl 1.5 mM MgCl2) with protease inhibitor on ice for 20 minutes. Following centrifugation, nuclei were resuspended in 0.2 M HCl and the soluble fraction was neutralized with 1 M Tris-HCl [pH 8.0]. Nuclei were lysed in 150 mM NaCl and following centrifugation, the chromatin pellet was digested by micrococcal nuclease (Roche) for 5 minutes at room temperature. Recombinant GST-RAD51 and GST-PCNA fusion protein were expressed in BL21 strain and purified using glutathione-Sepharose beads (GE Healthcare) as previously described15. Beads with equal amount of GST or GST-RAD51 were incubated with in vitro–translated Flag-tagged POLQ variants in 150 mM NaCl lysis buffer.
Antibodies and chemicals
Antibodies used in this study included: anti-PCNA (PC-10), anti-FANCD2 (FI-17), anti-RAD51 (H-92), anti-GST (B14), and Histone H3 (FL-136) and anti-vinculin (H-10) (Santa Cruz); anti-Flag (M2) (Sigma); anti-pS317CHK1 (2344), anti-pT68CHK2 (2661) (Cell signalling); anti-pS824KAP-1 (A300-767A) (Bethyl); anti-pS317γH2AX (05636) (Millipore); anti-pS15p53 (ab1431) and anti-POLQ (ab80906) (abcam); anti-BrdU (555627) (BD Pharmingen). Mitomycin C (MMC), cis-diamminedichloroplatinum(II) (Cisplatin, CDDP), and Hydroxyurea (HU) were purchased from Sigma. The PARPi rucaparib (AG-014699) was purchased from Selleckchem and ABT-888 from AbbVie. Rucaparib was used for all in vitro assays and ABT-888 was used for all in vivo experiments.
Chromosomal breakage analysis
293T and Vu 423 cells were twice-transfected with siRNAs for 48 hours and incubated for 48 hours with or without the indicated concentrations of MMC. For complementation studies on 293T shFANCD2, POLQ cDNA constructs were transfected 24 hours after the first siRNA transfection. Cells were exposed for 2 hours to 100 ng/ml of colcemid and treated with a hypotonic solution (0.075 M KCl) for 20 minutes and fixed with 3:1 methanol/acetic acid. Slides were stained with Wright's stain and 50 metaphase spreads were scored for aberrations. The relative number of chromosomal breaks was calculated relative to control cells (si Scr). For clarity of the Figure 4b, radial figures were excluded from the analysis.
Reporter assays and immunofluorescence
HR and alt-EJ efficiency was measured using the DR-GFP (HR efficiency) and the alt-EJ reporter assay, performed as previously described14,27,34. Briefly, 48 hours before transfection of SceI cDNA, U20S-DR-GFP cells were transfected with indicated siRNA or PARPi (1 μM). The HR activity was determined by FACS quantification of viable GFP-positive cells 96 hours after SceI was transfected. For RAD51 immunofluorescence experiments, cells were transfected with indicated siRNA 48 hours before treatment with HU (2 mM) or IR (10 Gy). For complementation studies, POLQ cDNA constructs were either transfected 24 hours after siRNA transfection (Fig. 2b, 2c and Extended Data Fig. 9b) or stably expressed in indicated cell line (Extended Data Fig. 3d, e). 6 hours after HU or IR treatment, cells were fixed with 4% paraformaldehyde for 10 minutes at room temperature, followed by extraction with 0.3% Triton X-100 for 10 minutes on ice. Antibody staining was performed at room temperature for 1 hour. For quantification of RAD51 foci in BrdU positive cells, cells were transfected with indicated siRNA 48 hours before treatment with IR (10 Gy). 2 hours after IR treatment, cells were treated with BrdU pulse (10 μM) for 2 hours and subsequently fixed with 4% paraformaldehyde and stained for RAD51 as described above. Cells were then fixed in ethanol (4°C, over night), treated with 1.5 M HCL for 30 minutes and stained for BrdU antibody. The relative number of cells with more than 10 RAD51 foci was calculated relative to control cells (si Scr). Statistical differences between cells transfected with siRNAs (si POLQ1, si POLQ2, si BRCA2, si PARI or si BLM relative to control (si Scr) were assessed. For GFP fluorescence, cells were grown on coverslip, treated with UV (24 hours after GFP-POLQ transfection; 20 J/m2), fixed with 4% paraformaldehyde for 10 min at 25 °C 4 hours after the UV treatment, washed three times with PBS and mounted with DAPI-containing mounting medium (Vector Laboratories). When indicated cells were treated with PARPi (1 μM) 24 hours before GFP-POLQ transfection. Images were captured using a Zeiss AX10 fluorescence microscope and AxioVision software. Cells with GFP foci were quantified by counting number of cells with more than five foci. At least 150 cells were counted for each sample.
Cell survival assays
For assessing cellular cytotoxicity, cells were seeded into 96-well plates at a density of 1000 cells/well. Cytotoxic drugs were serially diluted in media and added to the wells. At 72 hours, CellTiter-Glo reagent (Promega) was added to the wells and the plates were scanned using a luminescence microplate reader. Survival at each drug concentration was plotted as a percentage of the survival in drug-free media. Each data point on the graph represents the average of three measurements, and the error bars represent the standard deviation. For clonogenic survival, 1000 cells/well were seeded into six-well plates and treated with cytotoxic drugs the next day. For MMC and PARPi, cells were treated continuously with indicated drug concentrations. For CDDP, cells were treated for 24 hours and cultured for 14 days in drug-free media. Colony formation was scored 14 days after treatment using 0.5% (w/v) crystal violet in methanol. Survival curves were expressed as a percentage ± s.e.m. over three independent experiments of colonies formed relative to the DMSO-treated control.
Cell cycle analysis
A2780 cells expressing Scr or POLQ shRNA were synchronized by a double thymidine block (Sigma) and subsequently exposed to MMC (1 μg/ml for 2 hours), IR (10 Gy) or HU (2 mM, over night). At the indicated time points following drug release, cells were fixed in chilled 70% ethanol, stored overnight at -20°C, washed with PBS, and resuspended in propidium iodide. A fraction of those cells was analyzed by immunoblotting for DNA damage response proteins. The immunoblot analysis of γH2AX shows staining after 0, 24, 48 and 72 hours of HU treatment. For proliferation experiments, cells were incubated with 5-ethynyl-2′-deoxyuridine (EdU) (10 μM) for 1 hour at each time point after MMC exposure (1 μg/ml for 2 hours). Cells were washed and resuspended in culture medium for 2 hours prior to be analyzed by flow cytometry. Edu Staining was performed using the Click-iT EdU kit (Life Technologies).
DNA Fiber Analysis
A2780 cells expressing Scr or POLQ shRNA were incubated with 25 μM chlorodeoxyuridine (CldU) (Sigma, C6891) for 20 minutes. Cells were then treated with 2 mM hydroxyurea (HU) for 2 hours and incubated in 250 μM iododeoxyuridine (ldU) (Sigma, I7125) for 25 minutes after washout of the drug. Spreading of DNA fibers on glass slides was done as reported19. Glass slides were then washed in distilled water and in 2.5 M HCl for 80 minutes followed by three washes in PBS. The slides were incubated for 1 hour in blocking buffer (PBS with 1% BSA and 0.1% NP40) and then for 2 hours in rat anti-BrdU antibody (1:250, Abcam, ab6326). After washing with blocking buffer the slides were incubated for 2 hours in goat anti-rat Alexa 488 antibody (1:1000, Life Technologies, A-11006). The slides were then washed with PBS and 0.1% NP40 and then incubated for 2 hours with mouse anti-BrdU antibody diluted in blocking buffer (1:100, BD Biosciences, 347580). Following an additional wash with PBS and 0.1% NP40, the fibers were stained for 2 hours with chicken anti-mouse Alexa 594 (1:1000, Life Technologies, A-21201). At least 150 fibers were counted per condition. Pictures were taken with an Olympus confocal microscope and the fibers were analyzed by ImageJ software. The number of stalled or collapsed forks were measured by DNA fibers that had incorporated only CIdU. Stalled or collapsed forks counted in POLQ-depleted cells is expressed as fold-change after HU treatment relative to the fold-change observed in control cells, which was arbitrarily set to 1.
SupF mutagenesis assay
293T cells twice-transfected with siRNAs for 48 hours were then transfected with undamaged or damaged (UVC, 1,000 J/m2) pSP189 plasmids using GeneJuice (Novagen). After 48 hours, plasmid DNA was isolated with a miniprep kit (Promega) and digested with DpnI. After ethanol precipitation, extracted plasmids were transformed into the β-galactosidase–MBM7070 indicator strain through electroporation (GenePulsor X Cell; Bio-Rad) and plated onto LB plates containing 1 mM IPTG, 100 μg/ml 5-bromo-4-chloro-3-indolyl-β-D-galactopyranoside and 100 μg/ml ampicillin. White and blue colonies were scored using ImageJ software, and the mutation frequency was calculated as the ratio of white (mutant) to total (white plus blue) colonies.
POLQ gene expression
RNA samples extracted using the TRIzol Reagent (Invitrogen) were reverse transcribed using the Transcriptor Reverse Transcriptaze kit (Roche) and oligo dT primers. The resulting cDNA was use to analyzed POLQ expression by RT-qPCR using with QuantiTect SYBRGreen (Qiagen), in an iCycler machine (Bio-Rad). POLQ gene expression values were normalized to expression of the housekeeping gene GAPDH, using the ΔCT method and are shown on a log2 scale. The primers used for POLQ are as follows: POLQ primer 1 (Forward: 5′-TATCTGCTGGAACTTTTGCTGA-3′; Reverse: 5′-CTCACACCATTTCTTTGATGGA-3′); POLQ primer 2 (Forward: 5′-CTACAAGTGAAGGGAGATGAGG-3′; Reverse: 5′-TCAGAGGGTTTCACCAATCC-3′).
POLQ purification from insect SF9 cells
A POLQ fragment (ΔPol2) containing the ATPase domain with a RAD51 binding site (amino acids 1 to 1000) was cloned into pFastBac-C-Flag and purified from baculovirus-infected SF9 insect cells as previously described35. Briefly, SF9 cells were seeded in 15-cm dishes at 80-90% confluency and infected with baculovirus. Three days post-infection, cells were harvested and lysed in 500 mM NaCl lysis buffer (500 mM NaCl, 0.01 % NP40, 0.2 mM EDTA, 20% Glycerol, 1 mM DTT, 0.2 mM PMSF, 20 mM Tris [pH 7.6]) supplemented with Halt protease inhibitor cocktail (Thermo Scientific) and Calpain I inhibitor (Roche) and the protein was eluted in lysis buffer supplemented with 0.2 mg/ml of Flag peptide (Sigma). The protein was concentrated in lysis buffer using 10 kDa centrifugal filters (Amicon). The protein was quantified by comparing its staining intensity (Coomassie-R250) with that of BSA standards in a 7% tris-glycine SDS-PAGE gel. Purified protein was flash-frozen in small aliquots in liquid nitrogen and stored at -80°C.
Radiometric ATPase assay
Each 10 μl reaction consisted of 200 nM ATP, reaction buffer (20 mM Tris-HCl [pH 7.6], 5 mM MgCl2, 0.05 mg/ml BSA, 1 mM DTT), and 5 μCi of [γ-32P]-ATP. For corresponding reactions, ssDNA, dsDNA, and forked DNA were added to the reaction in excess at a final concentration of 600 nM. Once all of the non-enzymatic reagents were combined, recombinant POLQ was added to start the ATPase reaction. After incubation for 90 minutes at room temperature, stop buffer (125 mM EDTA [pH 8.0]) was added and approximately ∼0.05 μCi was spotted onto PEI-coated thin-layer chromatography (TLC) plates (Sigma). Unhydrolyzed [γ-32P]-ATP was separated from the released inorganic phosphate [32Pi] with 1 M acetic acid, 0.25 M lithium chloride as the mobile phase. TLC plates were exposed to a phosphor screen and imaged with the BioRad Imager PMC. ssDNA, dsDNA, and forked DNA were generated as previously described35. To remove any contaminating ssDNA, dsDNA and forked DNA were gel purified after annealing. Spots corresponding to [γ-32P]-ATP and the released inorganic phosphate [32Pi] were quantified (in units of pixel intensity) and the fraction of ATP hydrolyzed calculated for each POLQ concentration.
Electrophoretic Mobility Gel Shift Assay (EMSA)
Binding of POLQ to ssDNA was assessed using EMSA. 60-mer single-stranded DNA (ssDNA) or double-stranded DNA (dsDNA) oligonucleotides (5 nM) were incubated with increasing amount of POLQ (0, 5, 10, 50, or 100 nM) in 10 μl of binding buffer (20 mM HEPES-K+, [pH 7.6], 5 mM magnesium acetate, 0.1 μg/μl BSA, 5% glycerol, 1 mM DTT, 0.2 mM EDTA, and 0.01% NP-40) for one hour on ice. POLQ protein was added at a 10-fold dilution so that the final salt concentration was approximately 50 mM NaCl. The ssDNA probes are 5′ fluorescently-labeled with IRDye-700 (IDT). After incubation, the samples were analyzed on a 5% native polyacrylamide/0.5 × TBE gel at 4°C. A fluorescent imager (Li-Cor) was used to visualize the samples in the gel.
RAD51 purification
Human GST-RAD51 was purified from bacteria as described36. Xenopus RAD51 (xRAD51) was purified as follow. N-terminally His-tagged SUMO-RAD51 was expressed in BL21 pLysS cells. Three hours after induction with 1 mM IPTG cells were harvested and resuspended in Buffer A (50 mM Tris-Cl [pH 7.5], 350 mM NaCl, 25% Sucrose, 5 mM β-mercaptoethanol, 1 mM PMSF and 10 mM imidazole). Cells were lysed by supplementation with Triton X-100 (0.2% final concentration), three freeze-thaw cycles and sonication (20 pulses at 40% efficiency). Soluble fraction was separated by centrifugation and incubated with 2 mL of Ni-NTA resin (Qiagen) for 1 hour at 4°C. After washing the resin with 100 mL of wash buffer (Buffer A supplemented with 1 M NaCl, final concentration) the salt concentration was brought down to 350 mM. His-SUMO-RAD51 was eluted with a linear gradient of imidazole from 10 mM - 300 mM in Buffer A. Eluted fractions were analyzed by SDS-PAGE. His-SUMO-RAD51 containing fractions were pooled and supplemented with Ulp1 protease to cleave the His-SUMO tag and dialyzed overnight into Buffer B (50 mM Tris-Cl [pH 7.5], 350 mM NaCl, 25% Sucrose, 10% Glycerol, 5 mM β-mercaptoethanol, 10 mM imidazole and 0.05% Triton X-100). The dialyzed fraction was incubated with Ni-NTA resin for 1 hour at 4°C and the RAD51 containing flow-through fraction was collected and dialyzed overnight into Buffer C (100 mM Potassium phosphate [pH 6.8], 150 mM NaCl, 10% Glycerol, 0.5 mM DTT and 0.01% Triton-X). RAD51 was further purified by Hydroxyapatite (Bio-Rad) chromatography. After washing with ten column volumes of Buffer C, RAD51 was eluted with a linear gradient of Potassium phosphate [pH 6.8] from 100 mM - 800 mM. RAD51 containing fractions were analyzed by SDS-PAGE and dialyzed into storage buffer (20 mM HEPES-KOH [pH 7.4], 150 mM NaCl, 10% Glycerol, 0.5 mM DTT). Purified protein was flash-frozen in small aliquots in liquid nitrogen and stored at -80°C.
D-loop assay
D-loop formation assays were performed using xRAD51 and conducted as previously described37. Briefly, nucleofilaments were first formed by incubating RAD51 (1 μM) with end-labeled 90-mer ssDNA (3 μM nt) at 37 °C for 10 minutes in reaction buffer containing 20 mM HEPES-KOH [pH 7.4], 1 mM ATP, 1 mM Mg(Cl)2, 1 mM DTT, BSA (100 μg/mL), 20 mM phosphocreatine and creatine phosphokinase (20 μg/mL). After the 10 minutes incubation increasing amounts of POLQ (0, 0.1, 0.5, or 1.0 μM) and RPA (200 nM) were added and incubated for an additional 15 minutes at 37°C. Reaction was then supplemented with 1 mM CaCl2 followed by further incubation at 37°C for 15 minutes. D-loop formation was initiated by the addition of supercoiled dsDNA (pBS-KS (-), 79 μM bp) and incubation at 37°C for 15 minutes. D-loops were analyzed by electrophoresis on a 0.9% agarose gel after deproteinization. Gel was dried and exposed to a PhosphoImager (GE Healthcare) screen for quantification.
Substitution peptide arrays and RAD51-ssDNA filament experiments
Subtitution peptide arrays were performed as previously described17. RAD51 displacement assays were performed as follow. Binding reactions (10 μl) contained 5′-32P-end-labelled DNA substrates (0.5 ng of 60 mer ssDNA) and various amounts of human RAD51 and/or POLQ in binding buffer (40 mM Tris-HCl [pH 7.5], 50 mM NaCl, 10 mM KCl, 2 mM DTT, 5 mM ATP, 5 mM MgCl2, 1 mM DTT, 100 mg/ml BSA) were conducted at room temperature. After 5 minutes incubation with POLQ and a further 5 minutes incubation with RAD51 or vice versa, an equimolar amount of cold DNA substrate was added to the reaction. Products were then analyzed by electrophoresis through 10% PAGE (200V for 40 min in 0.5×Tris-borate-EDTA buffer) and visualized by autoradiography.
Interbreeding of the Fancd2 and Polq mice
For the characterization of Fancd2/Polq conditional knockouts, we crossed C57BL/6J mice (Jackson Laboratory). Fancd2+/-Polq+/+ mice, previously generated in our laboratory22, were crossed with Fancd2+/+Polq+/- mice7 to generate Fancd2+/-Polq+/- mice. These double heterozygous mice were then interbred, and the offspring from these mating pairs were genotyped using PCR primers for Fancd2 and Polq. A statistical comparison of the observed with the predicted genotypes was performed using a 2-sided Fisher's exact test. Primary MEFs were generated from E13.5 to E15 embryos and cultured in RPMI supplemented with 15% fetal bovine serum and 1% penicillin-streptomycin. All data generated in the study were extracted from experiments performed on primary MEFs from passage 1 to passage 4. The primers used for mice genotyping are as follows: Fancd2 PCR primers OST2cF (5′-CATGCATATAGGAACCCGAAGG-3′), OST2aR (5′-CAGGACCTTTGGAGAAGCAG-3′) and LTR2bF (5′-GGCGTTACTTAAGCTAGCTTG-3′); Polq PCR primers IMR5973 (5′-TGCAGTGTACAGATGTTACTTTT-3′), IMR 5974 (5′-TGGAGGTAGCATTTCTTCTC-3′), IMR 5975 (5′-TCACTAGGTTGGGGTTCTC-3′) and IMR 5976 (5′-CATCAGAAGCTGACTCTAGAG-3′). Specific PCR conditions are available upon request.
Studies of xenograft-bearing CrTac:NCr-Foxn1nu mice
The Animal Resource Facility at The Dana-Farber Cancer Institute approved all housing situations, treatments and experiments using mice. No more than five mice were housed per air-filtered cage with ad libitum access to standard diet and water, and were maintained in a temperature and light-controlled animal facility under pathogen-free conditions. All mice described in this text were drug and procedure naïve before the start of the experiments. For every xenograft study, we subcutaneously implanted approximately 1.0 × 10⁶ A2780 cells (1:1 in Matrigel Matrix, BD Biosciences) into both flanks of 6-8 week old female CrTac:NCr-Foxn1nu mice (Taconic). Doxycycline (Sigma) was added to the food (625 PPM) and bi-weekly (Tuesday and Friday) to the water (200 μg/ml) for mice bearing tumors that reached 100-200 mm3. Roughly one week (5-6 days) after the addition of Doxycycline to the diet, mice were randomized to twice daily treatment schedules with vehicle (0.9% NaCl) or PARPi (ABT-888; 50 mg per kg body weight) by oral gavage administration for the indicated number of weeks. Overall survival was determined using Kaplan-Meier analyses performed with Log-Rank tests to assess differences in median survival for each shRNA condition (shScr or shPOLQ) and each treatment condition (vehicle or PARPi) (GraphPad Prism 6 Software). For competition assays, A2780 cells expressing FANCD2-GFP shRNA (GFP cells) or a combination of FANCD2-GFP shRNA with (doxycycline inducible) Scr-RFP or POLQ-RFP shRNA (GFP-RFP cells) were mixed at an equal ratio of GFP to GFP-RFP cells, and thereafter injected into nude mice given doxycycline-containing diets and treated with either vehicle or PARPi or CDDP. For competition assays, mice received identical doxycycline and PARPi drug treatment. For the Cisplatin competition assay, mice were randomized into semi-weekly treatment regimens with vehicle (0.9% NaCl) or CDDP (5 mg per kg body weight) by intraperitoneal injection. After three to four weeks of treatment, mice were euthanized and tumors were grown in vitro, in the presence of doxycycline (2 μg/ml for 4 days). The relative ratio of GFP to GFP-RFP cells was determined by FACS analysis. Tumor volumes were calculated bi-weekly using caliper measurements (length × width2)/2. Growth curves were plotted as the mean tumor volume (mm3) for each treatment group; relative tumor volume (RTV) indicates change in tumor volume at a given time point relative to that at the day before initial dosing (=1). Mice were unbiasedly assigned into different treatment groups. Drug treatment and outcome assessment was performed in a blinded manner. Mice were monitored every day and euthanized by CO2 inhalation when tumor size (≥2 cm), tumor status (necrosis/ulceration) or body weight loss (≥20%) reached ethical endpoint, according to the rules of the Animal Resource Facility at The Dana-Farber Cancer Institute.
Immunohistochemical staining
We stained formalin-fixed paraffin-embedded sections of harvested xenografts with antibodies specific for γ-H2AX (pSer139) (Upstate Biotechnology) and Ki67 (Dako). At least two xenografts were scored for each treatment. Tumors were collected three weeks after treatment. At least five 40× fields were scored. The mean ± s.e.m. percentage of positive cells from five images in each treatment group was calculated.
Statistical analysis
Unless stated otherwise, all data are represented as mean ± s.e.m. over at least three independent experiments, and significance was calculated using the Student's t test. Asterisks indicate statistically significant (*, P < 0.05; **, P < 10-2; ***, P < 10-3) values. All the in vivo experiments were run with at least 6 tumors from 6 mice for each condition.
Extended Data
Extended Data Figure 1. POLQ is highly expressed in epithelial ovarian cancers (EOCs) and POLQ expression correlates with expression of HR genes.
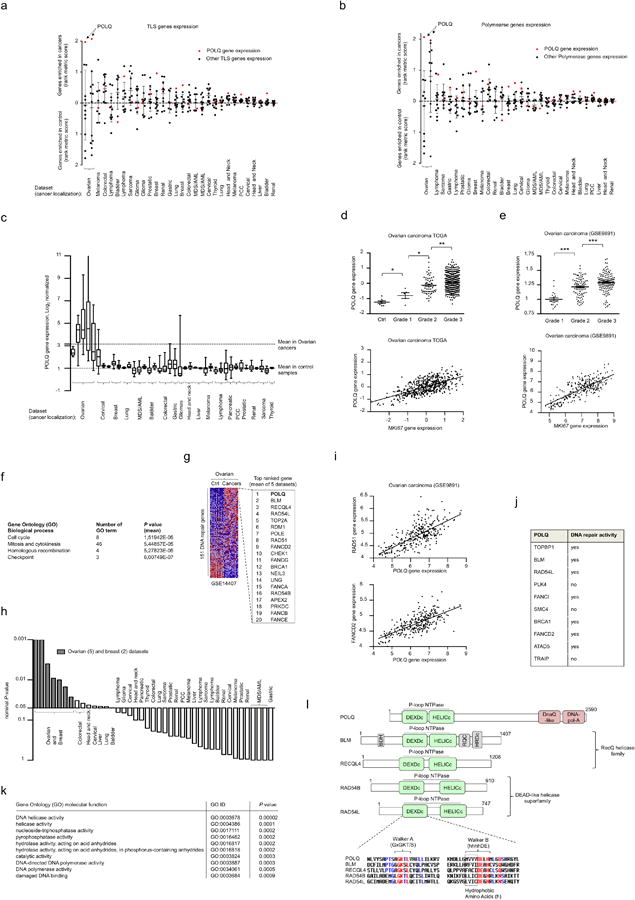
Gene set enrichment analysis (GSEA) for expression of TransLesion Synthesis (TLS) (a) and polymerase (b) genes between primary cancers and control samples in 28 independent datasets from 19 different cancers types. Enrichment values (represented as a single dot for each gene in a defined dataset) were determined using the rank metric score to compare expression values between cancers and control samples. Dots above the dashed line reflect enrichment in cancer samples, whereas dots below the dashed line show gene expression enriched in control samples. Datasets were ranked based on the amplitude of the rank metric score and plotted as shown. c, POLQ gene expression in 40 independent datasets from 19 different cancer types. For each dataset, POLQ values were expressed as fold-change differences relative to the mean expression in control samples, which was arbitrarily set to 1. d, POLQ expression correlates with tumor grade and MKi67 gene expression in the ovarian TCGA (n=494 patients with ovarian carcinoma (grade 1, n=5; grade 2, n=61; grade 3, n=428) and control samples, n=8). e, POLQ expression correlates with tumor grade MKi67 gene expression in the ovarian dataset GSE9891 (n=251 patients with ovarian serous and endometrious carcinoma for which grade status was available (grade 1, n=20; grade 2, n=88; grade 3, n=143)). Statistical correlation was assessed using the Pearson test (for d: r=0.65, P < 10-3; for e: r=0.77, P < 10-3). f, Top-ranked biological pathways differentially expressed between samples expressing high levels of POLQ (high POLQ, 1st 33%, n=95) relative to samples with low POLQ expression (low POLQ, 67%, n=190) on the ovarian dataset GSE9891 (n=285 patients with ovarian carcinoma). Significance values were determined by the hypergeometrical test using the 200 most differentially expressed probesets between the 2 groups (high POLQ and low POLQ). g, GSEA for expression of DNA repair genes between primary cancers and control samples in 5 independent ovarian cancer datasets. A representative heat map showing differential gene expression between ovarian cancers and controls is shown from GSE14407. For each dataset, DNA repair genes were ranked based on the metric score reflecting their enrichment in cancer samples. The top 20 DNA repair genes primarily expressed in cancer samples compared to control samples is shown on the right. h, GSEA for the top 20 DNA repair genes defined in (g) between primary cancers and control samples in 40 independent cancer datasets. The nominal P-value was used as a measure of the expression enrichment in cancer samples and represented as a waterfall plot. When the gene set expression was enriched in control samples, the P-value was arbitrarily set to 1. i, POLQ expression correlates with RAD51 and FANCD2 gene expression in 285 samples from the ovarian dataset GSE9891. Statistical correlation was assessed using the Pearson test (r=0.71, P < 10-3). j, Top 10 genes that most closely correlated with POLQ expression (gene neighbors analysis) for 1046 cell lines from the CCLE collection. DNA repair activity for these genes is indicated in the table. Increased HR gene expression is known to positively correlate with improved response to platinum based chemotherapy (a surrogate of HR deficiency) and thus can be predictive of decreased HR activity31,38. Conceptually, a state of HR deficiency may lead to compensatory increased expression of other HR genes. k, Top-ranked Gene Ontology (GO) terms for the molecular functions encoded by the top 20 DNA repair genes defined in Extended Data Figure 1g. l, Schematic representation of POLQ domain structure with the helicases (BLM, RECQL4, RAD54B and RAD54L) that co-expressed with POLQ (from Extended Data Figure 1g). Conserved amino-acid sequences of ATP binding and hydrolysis motifs (namely Walker A and B) are indicated. Cox plots in c that show twenty-fifth to seventy-fifth percentiles, with lines indicating the median, and whiskers indicating the smallest and largest values. For d and e (top panels), each dot represents the expression value from one patient, brackets show mean ± s.e.m.
Extended Data Figure 2. POLQ is a RAD51-interacting protein required for maintenance of genomic stability.
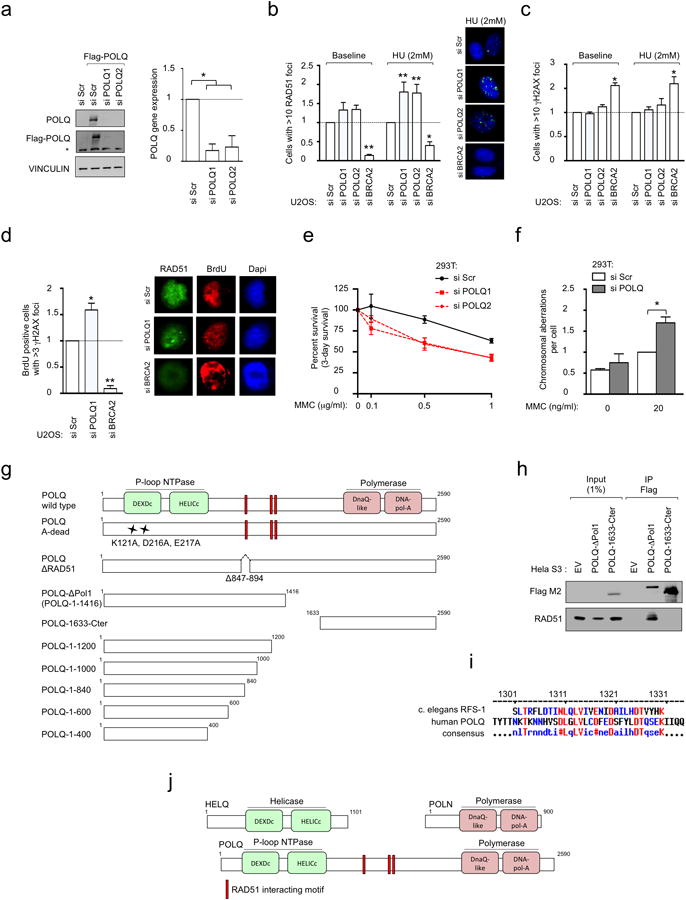
a, siRNA sequences (siPOLQ1 and siPOLQ2) efficiently down-regulate exogenously transfected POLQ protein. POLQ levels were detected by immunoblotting with Flag or POLQ antibody (left) and by RT-qPCR using 2 different sets of POLQ primers (right). The asterisk on the immunoblot indicates a non-specific band. Expression was normalized using GAPDH as a reference gene. POLQ gene expression values are displayed as fold-change differences relative to the mean expression in control cells, which was arbitrarily set to 1. b, Quantification of baseline and HU-induced RAD51 foci in U2OS cells transfected with indicated siRNA. c, Quantification of baseline and HU-induced γH2AX foci in U2OS cells transfected with indicated siRNA. d, Quantification of IR-induced RAD51 foci in BrdU-positive U2OS cells transfected with indicated siRNA. e, POLQ inhibition by siRNA induced a decrease in the cellular survival of 293T cells treated with MMC in a 3-day survival assay. f, Quantification of chromosomal aberrations in 293T cells transfected with indicated siRNA. g, Schematic representation of POLQ truncation proteins used for RAD51 interaction studies. h, Endogenous RAD51 co-precipitates with Flag-tagged POLQ-ΔPol1 (POLQ-1-1416) but not POLQ-1633-Cter, each stably expressed in HeLa cells. i, Sequence alignment between the RAD51-interacting motifs of C. elegans RFS-1 and human POLQ. j, Schematic of POLQ domain structure with its homologs HELQ and POLN. All data show mean ± s.e.m.
Extended Data Figure 3. Characterization of RAD51-interacting motifs in POLQ.
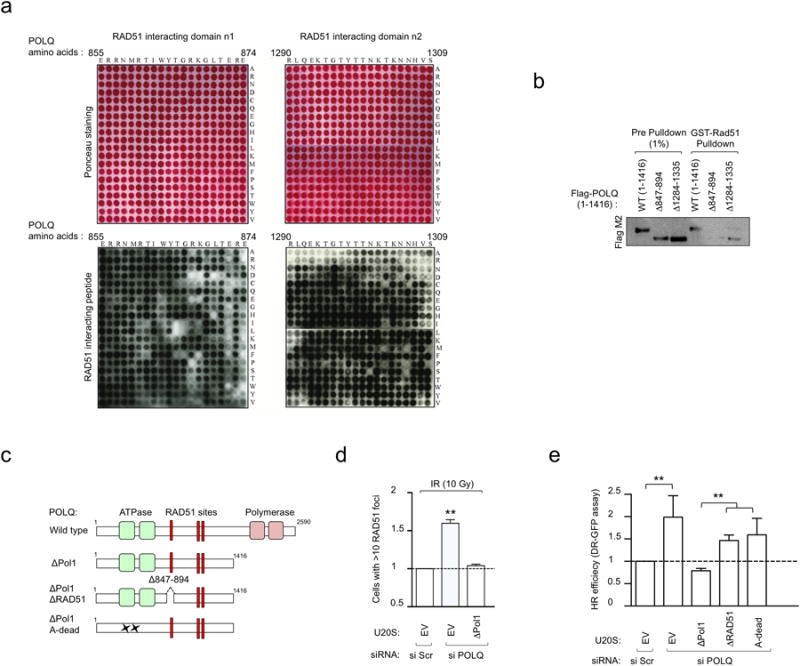
a, Substitution peptide array probed with recombinant RAD51 and analyzed by immunoblotting. A 20-mer peptide spanning each of the RAD51 binding sites (shown in Fig. 1g) were created in which each amino acid of the original peptide was mutated to each of the 20 amino acids and RAD51 binding activity was tested. The amino acid change for each of the amino acids of the RAD51 interacting domain of POLQ is shown on the right. Ponceau staining was used to visualize position of the peptides within the array. b, GST-RAD51 pull-down with in vitro-translated POLQ proteins missing indicated amino acids. c, Schematic of POLQ mutants used in complementation studies. d, Quantification of IR-induced RAD51 foci in U2OS cells stably integrated with empty vector (EV) or POLQ- ΔPol1 cDNA, that is refractory to siPOLQ1. Cells were transfected with indicated siRNA and subsequently treated with IR. The number of cells with more than 10 RAD51 foci was calculated relative to control cells (si Scr). e, DR-GFP assay in U2OS cells stably integrated with empty vector (EV) or indicated POLQ cDNA constructs refractory to siPOLQ1 and transfected with indicated siRNA. All data show mean ± s.e.m.
Extended Data Figure 4. POLQ is an ATPase that suppresses RAD51-ssDNA nucleofilament assembly and formation of RAD51-dependent D-loop structures.
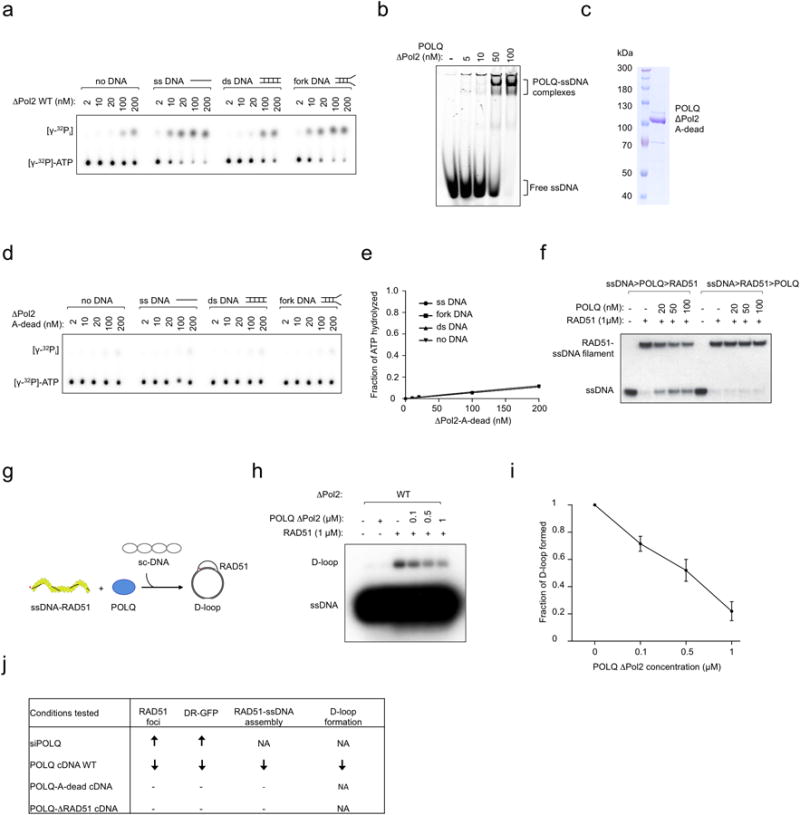
a, Representative ΔPol2 WT radiometric ATPase assay. b, Gel mobility shift assays with ΔPol2 WT and ssDNA. c, Coomassie-stained gel showing the purified ΔPol2-A-dead fragment. d, Representative ΔPol2-A-dead radiometric ATPase assay. e, Quantification of ΔPol2-A-dead ATPase activity. (ssDNA: single-stranded DNA; dsDNA: double-stranded DNA). f, Assembly/disruption of RAD51-ssDNA filaments in the presence of increasing amounts of ΔPol2 WT. The order in which each component was added to the reaction is noted above. g, Schematics of the formation of RAD51-dependent D-loop structures. h Formation of RAD51-containing D-loop structures following the addition of increasing amounts of ΔPol2 WT. i, Fraction of D-loop formed following the addition of increasing amounts of ΔPol2 WT. j, Effect of POLQ expression levels and HR status on tumor sensitivity to cisplatin or PARPi. Data in i shows mean ± s.e.m.
Extended Data Figure 5. POLQ functions under replicative stress and is induced by HR deficiency.
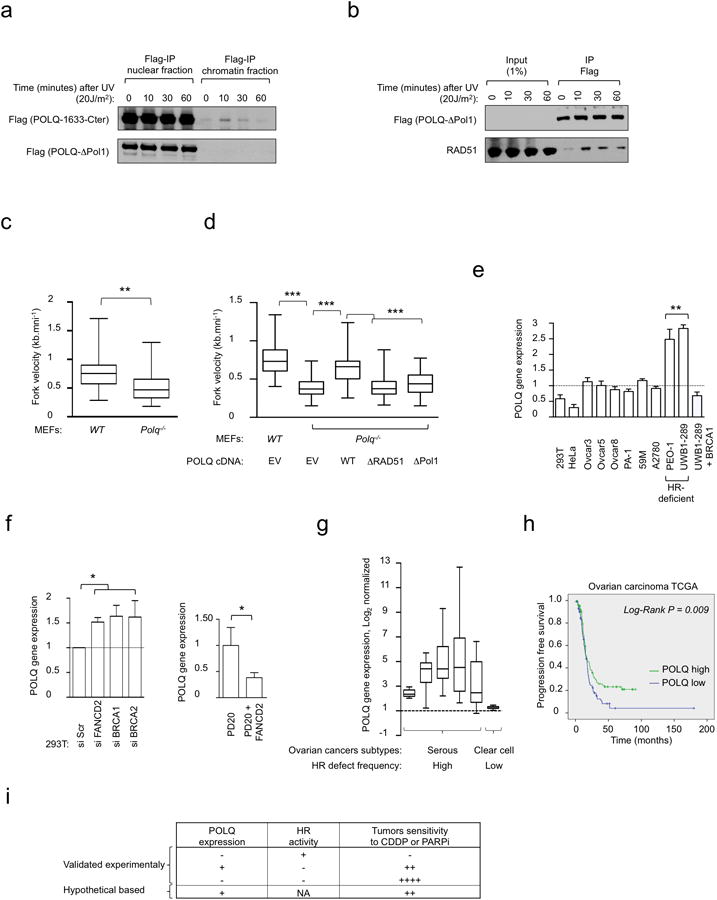
a, POLQ recruitment to the chromatin is enhanced by UV treatment. HeLa cells stably integrated with either Flag-tagged ΔPol1 or POLQ-1633-Cter (Extended Data Fig. 2g) were subjected to UV treatment. Cells were collected at indicated time points after UV treatment and IPs were performed on nuclear and chromatin fractions. b, HeLa cells stably integrated with ΔPol1 were treated with UV and harvested at indicated time points following UV exposure. POLQ and RAD51 co-precipitation is enhanced by UV treatment. c, Quantification of DNA fiber lengths isolated from WT or Polq-/- MEFs. d, Quantification of DNA fiber lengths isolated from WT or Polq-/- MEFs transfected with either EV, or POLQ cDNA constructs. e, POLQ gene expression was analyzed by RT-qPCR in HR-deficient ovarian cancer cell lines (PEO-1 and UWB1-289) compared with other ovarian cancer cell lines, HeLa (cervical cancer) cells and 293T (transformed human embryonic kidney) cells. Expression was normalized using GAPDH gene as a reference. POLQ expression values are displayed as fold-change relative to the mean expression in HR-proficient control cells, which was arbitrarily set to 1. f, POLQ gene expression analysis (RT-qPCR) in 293T cells transfected with siRNA targeting FANCD2, BRCA1 or BRCA2 (left panel) and in corrected PD20 cells (PD20 + FANCD2) relative to FANCD2-deficient cells (PD20) (right panel). Expression was normalized using GAPDH gene as a reference. POLQ expression values are presented as fold-change relative to the mean expression in control cells, which was arbitrarily set to 1. g, POLQ gene expression in 5 datasets of serous epithelial ovarian carcinoma (frequently associated with an HR deficiency) and 1 dataset of clear cell ovarian carcinoma (subgroup not associated with HR alterations). For each dataset, POLQ expression values are displayed as fold-change differences relative to the mean expression in control samples, which was arbitrarily set to 1. h, Progression-free survival (PFS) after first line platinum chemotherapy for patients with ovarian carcinoma (ovarian carcinoma TCGA). Statistical significance was assessed by the Log-Rank test (P < 10-2). i, Effect of siPOLQ and the different POLQ cDNA constructs on HR read-out. NA: not applicable. Box plots in c, d, and g show twenty-fifth to seventy-fifth percentiles, with lines indicating the median, and whiskers indicating the smallest and largest values. Data in e and f show mean ± s.e.m.
Extended Data Figure 6. POLQ inhibition sensitizes HR-deficient tumors to cytotoxic drug exposure.
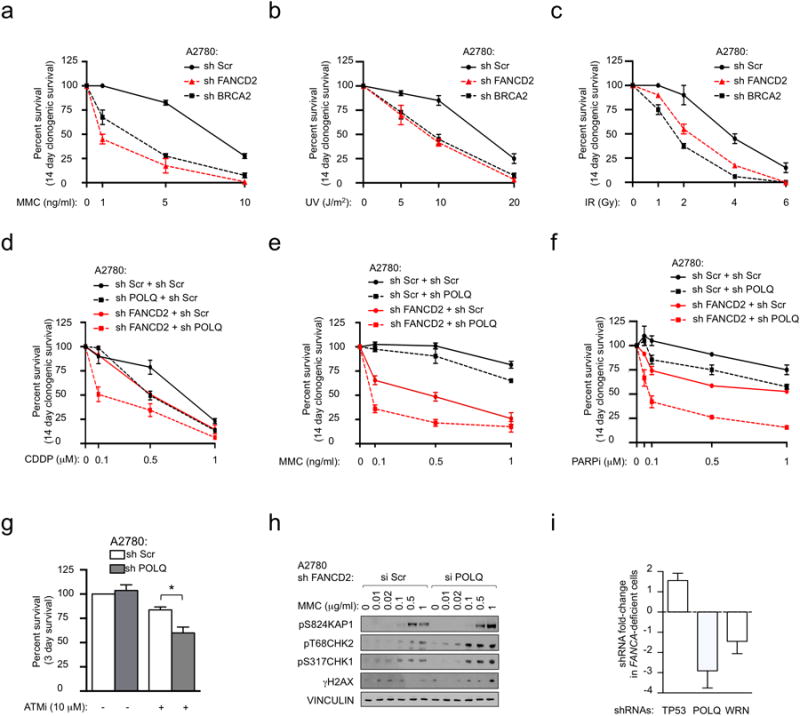
Clonogenic formation of A2780 cells expressing Scrambled (Scr) shRNA or shRNAs against FANCD2 or BRCA2 with increasing amounts of MMC (a), UV (b) or IR (c). Clonogenic formation of A2780 cells expressing Scrambled (Scr) or FANCD2 shRNA, together with shRNA targeting POLQ, in increasing concentrations of CDDP (d), MMC (e) or PARPi (f). g, Inhibition of POLQ reduces the survival of A2780 cells after 3 days of continuous exposure to the ATM inhibitor Ku55933. h, Immunoblot analyses in A2780 cells expressing FANCD2 shRNA together with siRNA targeting POLQ or Scr at 24 hours after indicated MMC pulse treatment. i, FANCA-deficient fibroblasts (GM6418) were infected with a whole-genome shRNA library and treated with MMC for 7 days. The fold-change enrichment of each shRNA after MMC treatment was determined by sequencing relative to the infected cells before treatment. TP53 depletion is known to improve survival of FANCA-/- cells33. WRN depletion has recently been shown to be synthetically lethal with HR deficiency39. Each column represents the mean of at least 2 independent shRNAs. All data show mean ± s.e.m.
Extended Data Figure 7. HR and POLQ repair pathways are synthetical lethal in vivo.
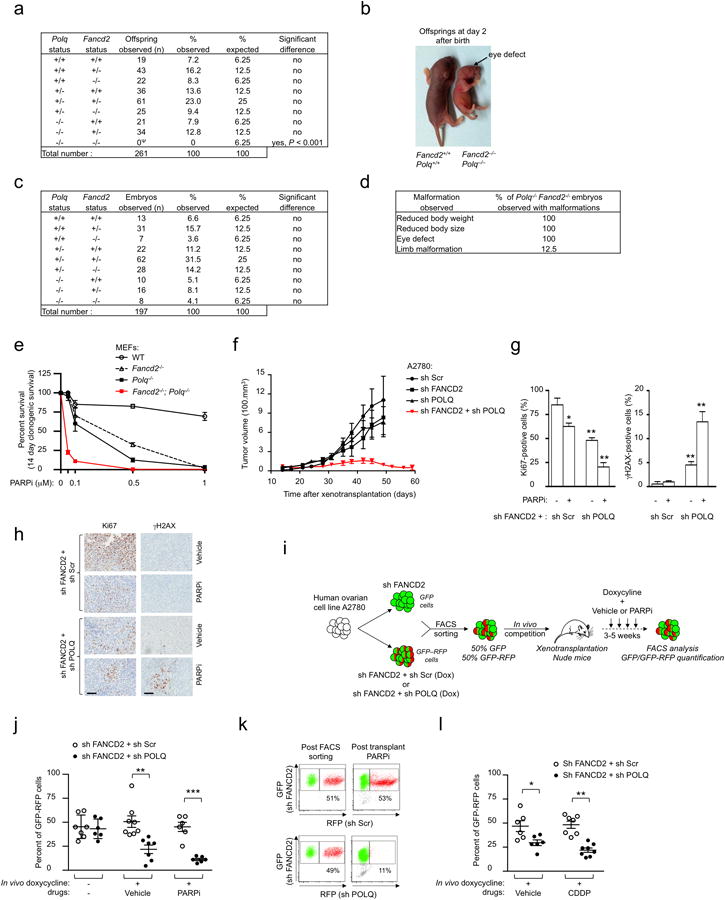
a, Genotypes frequencies of offspring from interbred Fancd2+/−Polq+/− mice. Ψ: four Fancd2-/-Polq-/- offsprings were observed with several congenital malformations and premature death within 48 hours of birth. b, Description of Fancd2−/−Polq−/− offspring generated in the study. The offspring presented congenital malformations (i.e., eye defects) together with reduced size and body weight. The arrow shows absence of the right eye. c, Genotypes frequencies of E13.5 to E15 embryos (13.5 to 15 days post coitum) from interbred Fancd2+/−Polq+/− mice. d, Description of congenital malformations and their measured frequencies observed in E13.5 to E15 Fancd2−/−Polq−/− embryos generated in the study. e, Clonogenic formation of WT, Fancd2-/-, Polq-/- and Fancd2−/−Polq−/− MEFs with increasing concentrations of PARPi. f, A2780 cells were transduced with indicated shRNAs and xenotransplanted into both flanks of athymic nude mice. The tumor volumes for individual mice were measured biweekly for 8 weeks. Each group represents n ≥ 5 tumors from n ≥ 5 mice. g, Ki67 and γH2AX quantification in tumors treated with either vehicle or PARPi. h, Representative Ki67 and γH2AX staining of A2780-shFANCD2 xenografts expressing sh Scr or sh POLQ in athymic nude mice, treated with either vehicle or PARPi. Scale bars, 100 μM. i, In vivo competition assay design. j, Tumor chimerism post xenotransplantation for indicated conditions. k, Representative flow cytometry analysis of tumors before xenotransplantation (post FACS sorting) or after xenotransplantation (post transplant, PARPi). The percentage of GFP-RFP cells is indicated. l, Tumor chimerism post xenotransplantation for indicated conditions. For Data in j and l, each circle represents data from one tumor and each group represents n ≥ 7 tumors from n ≥ 6 mice. Brackets show mean ± s.e.m. Data in e-g show mean ± s.e.m. For f each group represents n ≥ 6 tumors from n ≥ 6 mice.
Extended Data Figure 8. POLQ is required for HR-deficient cell survival and limits the formation of RAD51 structures in HR-deficient cells.
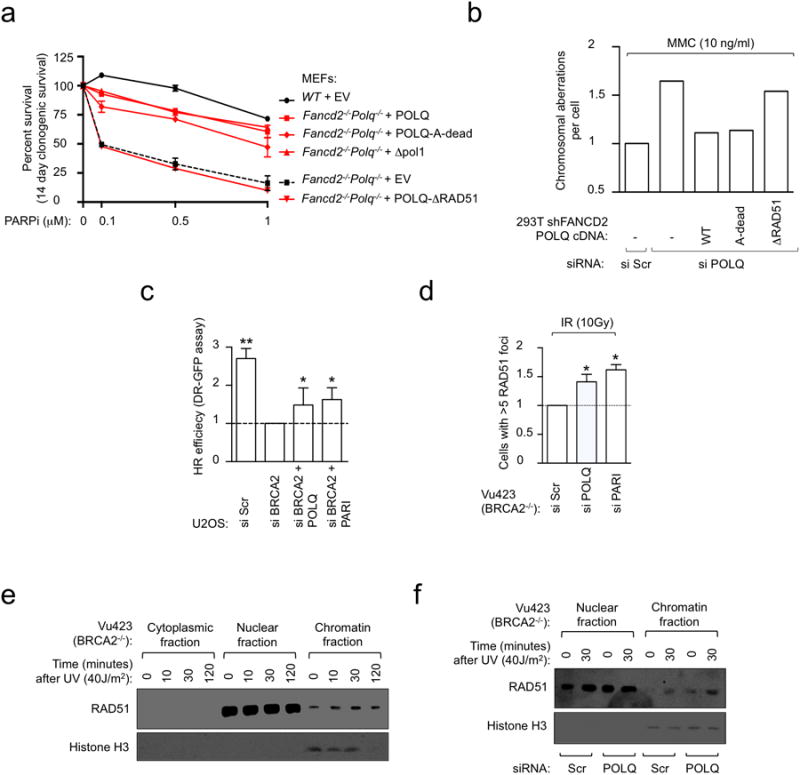
a, Clonogenic formation of Fancd2-/-Polq-/- MEFs transfected with full-length POLQ cDNA constructs in the presence of increasing concentrations of PARPi. b, Chromosome breakage analysis of FANCD2-depleted cells that were first transfected with the indicated siRNA and full-length POLQ cDNA constructs refractory to siPOLQ1 and then exposed to MMC. c, DR-GFP assay in U2OS cells transfected with indicated siRNA. d, Quantification of baseline and IR-induced RAD51 foci in U2OS cells transfected with indicated siRNA. e, RAD51 recruitment to chromatin is enhanced by UV treatment. Vu423 cells (BRCA2-/-) were collected at indicated time points after UV treatment and immunoblotting performed on the cytoplasmic, nuclear and chromatin fractions. f, RAD51 recruitment to chromatin in Vu423 cells (BRCA2-/-) transfected with indicated siRNA. Histone H3 was used as a control for chromatin fractionation. All data show mean ± s.e.m.
Extended Data Figure 9. POLQ participates in error-prone DNA repair.
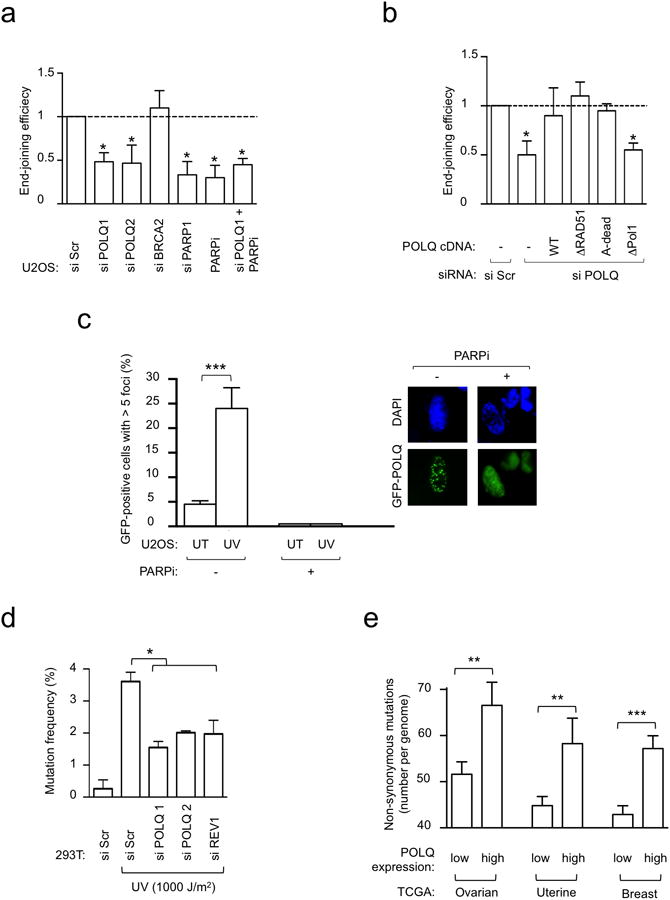
a, End-joining reporter assay in U2OS cells transfected with indicated siRNA and/or treated with PARPi. b, End-joining reporter assay in U2OS cells transfected with indicated siRNA and POLQ cDNA constructs refractory to siPOLQ1. c, UV damage-induced POLQ foci formation in U2OS cells. POLQ foci were abolished by pre-treatment with PARPi. d, Mutation frequency was determined in damaged supF plasmid, recovered from siRNA-treated 293T cells. e, Non-synonymous mutation count in ovarian, uterine and breast TCGA. All data show mean ± s.e.m.
Extended Data Figure 10. Model depicting the role of POLQ in DNA repair.
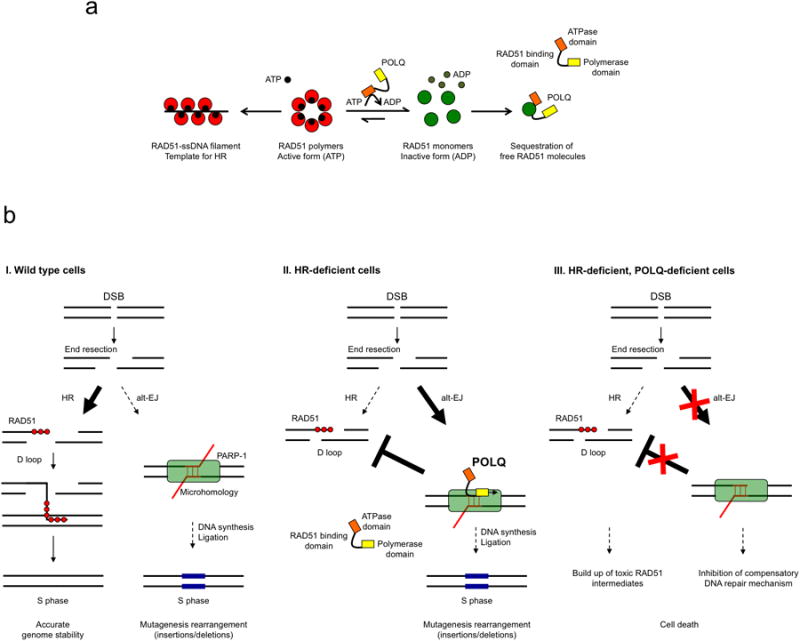
a, Mechanistic model for how POLQ limits RAD51-ssDNA filament assembly. According to this model, the ATPase domain of POLQ may prevent the assembly of RAD51 monomers into RAD51 polymers, perhaps by depleting local ATP concentrations. The RAD51 binding domains in the central region of POLQ may then sequester the RAD51 monomers, preventing filament assembly. b, I. Under physiological conditions, POLQ expression is low and its impact on repqir of DNA double-strand breaks (DSB) is limited. II. When HR deficiency occurs, POLQ is then highly expressed and channels DSB repair toward alt-EJ. III. In the case of an HR-defect, the loss of POLQ leads to cell death through the persistence of toxic RAD51 intermediates and inhibition of alt-EJ.
Supplementary Material
Acknowledgments
We thank Naoko Shima (University of Minnesota, USA), Dipanjan Chowdhury, Geoffrey Shapiro, Johannes Walter, David Kozono, Julien Ablain, Marc Delord, Jean-Bernard Lazaro and members of the D'Andrea laboratory for helpful discussions. We also thank Hyungjin Kim for providing DNA constructs, Lucian Moldovan for providing GST tagged RAD51, Shawn Johnson for providing MDA-MB 436 cells, Adam Y. Li for technical assistance, Lisa Moreau for chromosomal breakage analysis, and Kent Mouw for critical reading of the manuscript. We thank Haojian Zhang for providing access to shRNA screening data shown in Extended Data Figure 6i. We thank Christophe Cazaux and Jean-Sebastien Hoffmann (University of Toulouse, France) for providing pcDNA Flag-tagged POLQ. R.C. received support from the Philippe Foundation and is a recipient of the Ovarian Cancer Research Fellowship (OCRF). This work was supported by NIH grants P50CA168504 and R01HL52725 and by grants from OCRF and BCRF.
Footnotes
Author Contributions: R.C conceived the study, performed experiments, and wrote the manuscript. J.L. purified POLQ fragments from insect cells and performed ATPase and gel shift assays. R.A performed D-loop formation assays. I.H. performed DNA fibers assay. B.P. performed mice work and analyzed in vivo data. M.P and S.B performed the POLQ peptide array and the RAD51-ssDNA filament assembly and release assays. K.W.O scored RAD51 foci. P.A.K curated TCGA datasets for Figure 3a and Extended Data Figures 5h, 9e and provided clinical perspectives. A.D.D conceived the study and wrote the manuscript. All authors approved the final version of the manuscript.
References
- 1.Cancer Genome Atlas Research, N. Integrated genomic analyses of ovarian carcinoma. Nature. 2011;474:609–615. doi: 10.1038/nature10166. [DOI] [PMC free article] [PubMed] [Google Scholar]
- 2.Farmer H, et al. Targeting the DNA repair defect in BRCA mutant cells as a therapeutic strategy. Nature. 2005;434:917–921. doi: 10.1038/nature03445. [DOI] [PubMed] [Google Scholar]
- 3.Bryant HE, et al. Specific killing of BRCA2-deficient tumours with inhibitors of poly(ADP-ribose) polymerase. Nature. 2005;434:913–917. doi: 10.1038/nature03443. [DOI] [PubMed] [Google Scholar]
- 4.Kennedy RD, D'Andrea AD. DNA repair pathways in clinical practice: lessons from pediatric cancer susceptibility syndromes. Journal of clinical oncology : official journal of the American Society of Clinical Oncology. 2006;24:3799–3808. doi: 10.1200/JCO.2005.05.4171. [DOI] [PubMed] [Google Scholar]
- 5.Bast RC, Jr, Hennessy B, Mills GB. The biology of ovarian cancer: new opportunities for translation. Nature reviews Cancer. 2009;9:415–428. doi: 10.1038/nrc2644. [DOI] [PMC free article] [PubMed] [Google Scholar]
- 6.Yousefzadeh MJ, Wood RD. DNA polymerase POLQ and cellular defense against DNA damage. DNA repair. 2013;12:1–9. doi: 10.1016/j.dnarep.2012.10.004. [DOI] [PMC free article] [PubMed] [Google Scholar]
- 7.Shima N, Munroe RJ, Schimenti JC. The mouse genomic instability mutation chaos1 is an allele of Polq that exhibits genetic interaction with Atm. Molecular and cellular biology. 2004;24:10381–10389. doi: 10.1128/MCB.24.23.10381-10389.2004. [DOI] [PMC free article] [PubMed] [Google Scholar]
- 8.Yoshimura M, et al. Vertebrate POLQ and POLbeta cooperate in base excision repair of oxidative DNA damage. Molecular cell. 2006;24:115–125. doi: 10.1016/j.molcel.2006.07.032. [DOI] [PMC free article] [PubMed] [Google Scholar]
- 9.Muzzini DM, Plevani P, Boulton SJ, Cassata G, Marini F. Caenorhabditis elegans POLQ-1 and HEL-308 function in two distinct DNA interstrand cross-link repair pathways. DNA repair. 2008;7:941–950. doi: 10.1016/j.dnarep.2008.03.021. [DOI] [PubMed] [Google Scholar]
- 10.McVey M, Lee SE. MMEJ repair of double-strand breaks (director's cut): deleted sequences and alternative endings. Trends in genetics : TIG. 2008;24:529–538. doi: 10.1016/j.tig.2008.08.007. [DOI] [PMC free article] [PubMed] [Google Scholar]
- 11.Chan SH, Yu AM, McVey M. Dual roles for DNA polymerase theta in alternative end-joining repair of double-strand breaks in Drosophila. PLoS genetics. 2010;6:e1001005. doi: 10.1371/journal.pgen.1001005. [DOI] [PMC free article] [PubMed] [Google Scholar]
- 12.Yu AM, McVey M. Synthesis-dependent microhomology-mediated end joining accounts for multiple types of repair junctions. Nucleic acids research. 2010;38:5706–5717. doi: 10.1093/nar/gkq379. [DOI] [PMC free article] [PubMed] [Google Scholar]
- 13.Koole W, et al. A Polymerase Theta-dependent repair pathway suppresses extensive genomic instability at endogenous G4 DNA sites. Nature communications. 2014;5:3216. doi: 10.1038/ncomms4216. [DOI] [PubMed] [Google Scholar]
- 14.Nakanishi K, et al. Human Fanconi anemia monoubiquitination pathway promotes homologous DNA repair. Proceedings of the National Academy of Sciences of the United States of America. 2005;102:1110–1115. doi: 10.1073/pnas.0407796102. [DOI] [PMC free article] [PubMed] [Google Scholar]
- 15.Moldovan GL, et al. Inhibition of homologous recombination by the PCNA-interacting protein PARI. Molecular cell. 2012;45:75–86. doi: 10.1016/j.molcel.2011.11.010. [DOI] [PMC free article] [PubMed] [Google Scholar]
- 16.Ira G, Malkova A, Liberi G, Foiani M, Haber JE. Srs2 and Sgs1-Top3 suppress crossovers during double-strand break repair in yeast. Cell. 2003;115:401–411. doi: 10.1016/s0092-8674(03)00886-9. [DOI] [PMC free article] [PubMed] [Google Scholar]
- 17.Ward JD, et al. Overlapping mechanisms promote postsynaptic RAD-51 filament disassembly during meiotic double-strand break repair. Molecular cell. 2010;37:259–272. doi: 10.1016/j.molcel.2009.12.026. [DOI] [PubMed] [Google Scholar]
- 18.Seki M, Marini F, Wood RD. POLQ (Pol theta), a DNA polymerase and DNA-dependent ATPase in human cells. Nucleic acids research. 2003;31:6117–6126. doi: 10.1093/nar/gkg814. [DOI] [PMC free article] [PubMed] [Google Scholar]
- 19.Jackson DA, Pombo A. Replicon clusters are stable units of chromosome structure: evidence that nuclear organization contributes to the efficient activation and propagation of S phase in human cells. The Journal of cell biology. 1998;140:1285–1295. doi: 10.1083/jcb.140.6.1285. [DOI] [PMC free article] [PubMed] [Google Scholar]
- 20.Cancer Genome Atlas Research, N et al. Integrated genomic characterization of endometrial carcinoma. Nature. 2013;497:67–73. doi: 10.1038/nature12113. [DOI] [PMC free article] [PubMed] [Google Scholar]
- 21.Morrison C, et al. The controlling role of ATM in homologous recombinational repair of DNA damage. The EMBO journal. 2000;19:463–471. doi: 10.1093/emboj/19.3.463. [DOI] [PMC free article] [PubMed] [Google Scholar]
- 22.Parmar K, et al. Hematopoietic stem cell defects in mice with deficiency of Fancd2 or Usp1. Stem cells. 2010;28:1186–1195. doi: 10.1002/stem.437. [DOI] [PMC free article] [PubMed] [Google Scholar]
- 23.Hu Y, et al. PARP1-driven Poly-ADP-ribosylation Regulates BRCA1 Function in Homologous Recombination Mediated DNA Repair. Cancer discovery. 2014 doi: 10.1158/2159-8290.CD-13-0891. [DOI] [PMC free article] [PubMed] [Google Scholar]
- 24.Yang D, et al. Association of BRCA1 and BRCA2 mutations with survival, chemotherapy sensitivity, and gene mutator phenotype in patients with ovarian cancer. JAMA : the journal of the American Medical Association. 2011;306:1557–1565. doi: 10.1001/jama.2011.1456. [DOI] [PMC free article] [PubMed] [Google Scholar]
- 25.Seki M, et al. High-efficiency bypass of DNA damage by human DNA polymerase Q. The EMBO journal. 2004;23:4484–4494. doi: 10.1038/sj.emboj.7600424. [DOI] [PMC free article] [PubMed] [Google Scholar]
- 26.Seki M, Wood RD. DNA polymerase theta (POLQ) can extend from mismatches and from bases opposite a (6-4) photoproduct. DNA repair. 2008;7:119–127. doi: 10.1016/j.dnarep.2007.08.005. [DOI] [PMC free article] [PubMed] [Google Scholar]
- 27.Zhang Y, Jasin M. An essential role for CtIP in chromosomal translocation formation through an alternative end-joining pathway. Nature structural & molecular biology. 2011;18:80–84. doi: 10.1038/nsmb.1940. [DOI] [PMC free article] [PubMed] [Google Scholar]
- 28.Chiruvella KK, Liang Z, Wilson TE. Repair of double-strand breaks by end joining. Cold Spring Harbor perspectives in biology. 2013;5:a012757. doi: 10.1101/cshperspect.a012757. [DOI] [PMC free article] [PubMed] [Google Scholar]
- 29.Alexandrov LB, et al. Signatures of mutational processes in human cancer. Nature. 2013;500:415–421. doi: 10.1038/nature12477. [DOI] [PMC free article] [PubMed] [Google Scholar]
- 30.Lemee F, et al. DNA polymerase theta up-regulation is associated with poor survival in breast cancer, perturbs DNA replication, and promotes genetic instability. Proceedings of the National Academy of Sciences of the United States of America. 2010;107:13390–13395. doi: 10.1073/pnas.0910759107. [DOI] [PMC free article] [PubMed] [Google Scholar]
Additional References
- 31.Kang J, D'Andrea AD, Kozono D. A DNA repair pathway-focused score for prediction of outcomes in ovarian cancer treated with platinum-based chemotherapy. Journal of the National Cancer Institute. 2012;104:670–681. doi: 10.1093/jnci/djs177. [DOI] [PMC free article] [PubMed] [Google Scholar]
- 32.Cancer Genome Atlas N. Comprehensive molecular portraits of human breast tumours. Nature. 2012;490:61–70. doi: 10.1038/nature11412. [DOI] [PMC free article] [PubMed] [Google Scholar]
- 33.Ceccaldi R, et al. Bone marrow failure in Fanconi anemia is triggered by an exacerbated p53/p21 DNA damage response that impairs hematopoietic stem and progenitor cells. Cell stem cell. 2012;11:36–49. doi: 10.1016/j.stem.2012.05.013. [DOI] [PMC free article] [PubMed] [Google Scholar]
- 34.Bennardo N, Cheng A, Huang N, Stark JM. Alternative-NHEJ is a mechanistically distinct pathway of mammalian chromosome break repair. PLoS genetics. 2008;4:e1000110. doi: 10.1371/journal.pgen.1000110. [DOI] [PMC free article] [PubMed] [Google Scholar]
- 35.Yusufzai T, Kadonaga JT. HARP is an ATP-driven annealing helicase. Science. 2008;322:748–750. doi: 10.1126/science.1161233. [DOI] [PMC free article] [PubMed] [Google Scholar]
- 36.Barber LJ, et al. RTEL1 maintains genomic stability by suppressing homologous recombination. Cell. 2008;135:261–271. doi: 10.1016/j.cell.2008.08.016. [DOI] [PMC free article] [PubMed] [Google Scholar]
- 37.Amunugama R, Groden J, Fishel R. The HsRAD51B-HsRAD51C stabilizes the HsRAD51 nucleoprotein filament. DNA repair. 2013;12:723–732. doi: 10.1016/j.dnarep.2013.05.005. [DOI] [PMC free article] [PubMed] [Google Scholar]
- 38.Pitroda SP, et al. DNA repair pathway gene expression score correlates with repair proficiency and tumor sensitivity to chemotherapy. Science translational medicine. 2014;6:229ra242. doi: 10.1126/scitranslmed.3008291. [DOI] [PMC free article] [PubMed] [Google Scholar]
- 39.Aggarwal M, Sommers JA, Shoemaker RH, Brosh RM., Jr Inhibition of helicase activity by a small molecule impairs Werner syndrome helicase (WRN) function in the cellular response to DNA damage or replication stress. Proceedings of the National Academy of Sciences of the United States of America. 2011;108:1525–1530. doi: 10.1073/pnas.1006423108. [DOI] [PMC free article] [PubMed] [Google Scholar]
Associated Data
This section collects any data citations, data availability statements, or supplementary materials included in this article.