

Abstract
NK cells are a heterogenous population of innate lymphocytes with diverse functional attributes critical for early protection from viral infections. We have previously reported a decrease in influenza-induced NK cell cytotoxicity in 6-mo-old C57BL/6 calorically restricted (CR) mice. In the current study, we extend our findings on the influence of CR on NK cell phenotype and function in the absence of infection. We demonstrate that reduced mature NK cell subsets result in increased frequencies of CD127+ NK cells in CR mice, skewing the function of the total NK cell pool. NK cells from CR mice produced TNF-α and GM-CSF at a higher level, whereas IFN-γ production was impaired following IL-2 plus IL-12 or anti-NK1.1 stimulation. NK cells from CR mice were highly responsive to stimulation with YAC-1 cells such that CD27−CD11b+ NK cells from CR mice produced granzyme B and degranulated at a higher frequency than CD27−CD11b+ NK cells from ad libitum fed mice. CR has been shown to be a potent dietary intervention, yet the mechanisms by which the CR increases life span have yet to be fully understood. To our knowledge, these findings are the first in-depth analysis of the effects of caloric intake on NK cell phenotype and function and provide important implications regarding potential ways in which CR alters NK cell function prior to infection or cancer.
Caloric restriction (CR) is a dietary intervention that has been shown to extend the life span of laboratory animals (1). Whereas excess energy intake has been associated with increased incidence of disease, CR has been found to decrease the severity of autoimmune disease, and decrease the incidence of cardiac, kidney, or nervous system dysfunction (1–4). Other benefits of CR include decreased triglycerides and blood pressure, lower central adiposity, improved insulin sensitivity, and delayed age-related immunosenescence (5, 6). It has been established that, in laboratory conditions, CR reduces the incidence of spontaneous tumors and cancers in aged rodents, and slows the age-related decline in T cell proliferation, cytokine production, and CTL activity that is often observed during aging (7, 8). Lifelong CR of mice preserves thymopoiesis in the face of aging, and has been shown to enhance influenza-specific Abs and splenic lymphocyte proliferation after vaccination of mice with influenza (8, 9). These beneficial changes to the adaptive immune system have been well characterized; however, it has also been found that CR influences innate immune function (10, 11). Several decades ago, Weindruch et al. (12) reported that CR resulted in decreased splenic NK cell cytotoxicity compared with aged matched controls, although this could be ameliorated by polyinosinic:polycytidylic acid. More recently, we have shown CR results in increased susceptibility to primary influenza infection and decreased influenza-induced NK cell cytotoxicity in young and aged mice (13, 14). This was accompanied by the observation that NK cell numbers and frequency are decreased in the spleen of young CR mice (14). Overall, these findings have raised concerns about the effects of CR on innate immunity, and may predispose CR individuals to suffer more severe primary infections (10, 15). However, at this time, few studies have focused on understanding the effects of CR on innate immune cell development and function.
NK cells are responsible for recognizing virally infected cells, as well as transformed cells, including neoplasms and tumor cells (16–18). Development of NK cells takes place mainly in the bone marrow (BM), and signals from stromal cells and cytokines result in the microenvironment required for NK cell generation (19, 20). NK cell commitment takes place through upregulation of the shared IL-2/IL-15R β-chain (CD122), followed by acquisition of the NK cell marker NK1.1 in B6 mice (19, 21). Interactions with stromal cells within the BM regulate gene expression leading to programmed expression of surface molecules, including integrins, cytokine receptors, and a family of NK cell receptors (22–25). NK cell maturation is classified by using both surface phenotype and functional capacity. Phenotypic maturation takes place in stepwise fashion; expression of the integrin CD49b (DX5) is used to define early mature NK cells (26). Following acquisition of DX5, NK cells in the BM upregulate CD11b and CD43, which correlates strongly with the capability of a NK cell to produce large amounts of IFN-γ (19). Once mature, NK cells seed various lymphoid and nonlymphoid peripheral tissues, with the majority of NK cells expressing high levels of DX5, CD11b, and CD43 (19, 27).
After emigrating from the BM via the blood and seeding peripheral tissues, DX5+ NK cells continue to adapt to their environment; the downregulation of CD27 and TRAIL and upregulation of killer cell lectin-like receptor G1 (KLRG1) are associated with peripheral NK cell maturation (28, 29). The application of the marker CD27 has allowed the DX5+ NK cell pool to be further divided into subsets in mice in which there is a linear progression from CD27+CD11b− early mature NK cells to CD27+CD11b+ (double-positive [DP]) NK cells, followed by development into CD27−CD11b+ NK cells. These phenotypic changes further reflect changes to NK cell function, as DP NK cells exhibit a greater responsiveness to in vitro culture with dendritic cells, whereas CD27−CD11b+ KLRG1+ NK cells are terminally differentiated NK cells that are tightly regulated with reduced capacity to proliferate or elicit effector function during viral infection, such as murine CMV (29, 30).
Recent studies have begun to identify the molecular mechanisms that regulate NK cell development, egress, and differentiation. These studies have identified transcription factors required for NK cell commitment and differentiation into mature NK cells. Among these transcription factors, ID2, TOX, and E4BP4 are thought to regulate the earliest developmental stages, whereas other studies have established a role for the transcription factors T-bet, Eomesodermin (Eomes), Blimp-1, IFN regulatory factor-2, and Gata-3 in the generation of terminally differentiated CD43+ KLRG1+ NK cells (31–34). Similar to their role in T cell function, several of these transcription factors regulate aspects of NK cell function. For example, T-bet is involved in the expression of granzyme B in NK cells, whereas NK cells lacking Eomes are capable of producing more TNF-α than their Eomes+ counterparts (31).
Based on the above studies, we sought to understand how CR impacts NK cell development and function independent of aging or infection in 6-mo-old mice. In this study, we show that NK cells are reduced in frequency in peripheral tissues and exhibit an altered phenotype in the spleens of CR mice. We characterize these changes by analyzing the expression of a variety of cell surface markers associated with the maturation process, such as CD94, CD127, DX5, CD11b, CD43, and KLRG1. Most studies of murine NK cells focus on splenocytes, which normally express low levels of CD127. However, we discovered that CR results in an increased fraction of NK cells that express CD127 in the spleen and lymph nodes (LN), accompanied with an increase in the frequency of NK cells in the thymus, of which the majority are CD127+. These cells are thought to have low cytotoxic potential and produce a variety of cytokines, and are normally found at the highest frequency in the thymus and LN. Comparison of the distribution of NK cell subsets between AL and CR mice revealed CR results in significant reductions to the CD27−CD11b+ NK cell pool, suggesting caloric intake plays a role in regulating peripheral NK cell maturation or homeostasis. We used various stimuli to test the functional competence of NK cells from CR mice, and found that alterations to NK cell function in CR mice are specific to the stimulus used. Our results suggest that CR significantly alters NK cell subset distribution, resulting in a heterogeneous pool of NK cells displaying unique functional characteristics.
Materials and Methods
Mice and diets
Specific pathogen-free young adult (6-mo) ad libitum (AL) and young adult (6-mo) CR male C57BL/6 mice were purchased from the National Institute on Aging (NIA) colony maintained by Charles River Laboratories (Wilmington, MA). The animal use protocol for this study was approved by Michigan State University Institutional Animal Care and Use Committee. Upon arrival, mice were housed individually in microisolator cages in the American Association for the Accreditation of Laboratory Animal Care–accredited containment facility at Michigan State University and were acclimated at least 10–14 d prior to the initiation of each experiment. Both CR (NIH-31/NIA-fortified) and AL (NIH-31) diets were purchased from the NIA, the compositions of which have been reported in detail previously (14). The composition of the CR diet is sufficient in micronutrients and minerals, but results in restriction of total energy intake. The CR regimen initiated by the NIA is designed to gradually achieve 40% restriction in mice by 4 mo of age, such that they are weight stable upon arrival at 6 mo of age. All experiments were repeated at least twice using four to five mice per diet treatment per experiment, unless otherwise noted.
Body composition, food intake, and metabolic profile
Body composition (fat, lean, water) was determined by daily magnetic resonance imaging (MRI) during the feeding protocol. Mice were individually housed, allowing food intake to be recorded each day. All mice were weighed daily between 0800 and 0900, after which they were fed. The protocol to assess body composition using the EchoMRI-500 (Echo Medical Systems) has been validated and described in detail previously (35). Briefly, after calibration using a rapeseed oil standard, individual mice are placed in a MRI holding tube. The advantages of this system are that it is rapid, allows for repeated measurements, and does not require anesthesia, enabling mice to recover immediately after MRI. Serum concentrations of corticosterone, albumin, and leptin were quantified by commercially available ELISA kits, according to the manufacturer’s instructions (Assaypro; Life Diagnostics, R&D Systems, respectively). Serum concentrations of glucose, cholesterol, and triglycerides were determined using colorimetric assays, as per the manufacturer’s instructions (Cayman Chemical). Plates were read at 450 nm wavelength using a Synergy HT plate reader (Bio-Tek), and concentrations were determined using a standard curve for each respective assay.
Lymphocyte isolation
Following euthanasia, blood was collected by cardiac puncture into heparinized syringes. Following cardiac puncture, spleens, lungs, LN (inguinal, auxiliary, and brachial), and thymus were excised and weighed. Isolation of mononuclear cells from spleens and lungs has been previously described (35). Briefly, single-cell suspensions were obtained from spleens using homogenization. BM cells were isolated from the femur and tibia by flushing with a 25 5/8 needle and syringe containing RPMI 1640. The resulting cell suspensions were lysed of RBCs using an ammonium chloride buffer. Lungs were excised, weighed, and minced using a Miltenyi GentleMACs system. Cells were then incubated for 30 min at 37°C in RPMI 1640 containing 5% FBS, 1 mg/ml collaganase D (Roche, Indianapolis, IN), and 80 Kuntz Units DNase (Roche). Cell suspensions from digested lungs or blood were diluted with PBS and layered onto 1083-Histopaque (Sigma-Aldrich) for isolation of mononuclear cells by density gradient centrifugation. Isolation of cells from LN and thymus was performed by pressing the LN and thymus through 40-μm cell strainers (BD Falcon). All cell suspensions were washed in PBS and resuspended for counting using trypan blue viability dye.
Flow cytometry
Cells from various tissues were resuspended in FACS buffer (0.1% sodium azide, 1% FBS, in Dulbecco’s PBS) at a concentration of 2 × 10⁷ cells/ml. A total of 1–4 × 10⁶ cells was incubated on ice for 10 min with anti-CD32/ CD16 Ab (2.4G2) (BD Biosciences) to block FcγRII/III-mediated non-specific binding. Samples were then incubated with a mixture containing various combinations of the following fluorochrome-conjugated Abs (eBioscience, BD Biosciences, or BioLegend) at optimal concentrations determined in our laboratory: NK1.1 (allophycocyanin or PE-Cy7), CD3 (Alexafluor700 [500A2]), CD94/NKG2 (PE [HP-3D9]), CD27 (PE or PerCP-eFluor710 [LG.7F9]), CD127 (PE or PerCP-Cy5.5 [A7R.34]), CD51 (biotin [RMV-7]), CD49b (allophycocyanin or PE-Cy7 [DX5]), CD11b (PE-Cy7 or V500 [M1/70]), glucocorticoid-induced TNFR-related protein (FITC [DTA-1]), B220 (allophycocyanin [RA3-6B2]), CD43 (allophycocyanin-Cy7 [1B11]), Ly49C/I/F/H (FITC or PE [14B11]), Ly49-G2 (allophycocyanin [4D11]), Ly49D (FITC [4E5]), Ly49H (biotin [3D10]), and KLRG1 (allophycocyanin [2F1]). Biotinylated Abs were detected using streptavidin-conjugated PerCP-Cy5.5 or allophycocyanin-Cy7. Cells were incubated in staining cocktails on ice in the dark for 30 min. To detect transcription factor expression, cells were fixed and permeabilized using eBioscience Foxp3 staining kit, according to the manufacturer’s instructions, and then incubated with Abs against T-bet (PE-Cy7 [4B10]) and Eomes (Alexafluor488 [Dan11mag]) (eBioscience). Viable lymphocytes were gated based on light-scattering properties, after which NK cells were characterized as NK1.1+ CD3−, unless otherwise noted. Samples were analyzed using an LSR II flow cytometer (BD Biosciences) or a FACS Canto II flow cytometer (BD Biosciences) with FlowJo software (Tree Star).
Cytokines, granzyme B production, and degranulation
NK cell capacity to produce IFN-γ and degranulate was measured using flow cytometry, according to previously published methods (36). Briefly, high-affinity 96-well plates (Thermo-Fisher) were coated with a mAb against NK1.1 (25 μg/ml [PK136]) or NKp46 (15 μg/ml [29A1.4]) for 18 h at 4°C. Plates were then washed with PBS three times, and freshly prepared splenocytes (1–4 × 10⁶) in complete media were added. Alternatively, splenocytes in complete media were added to uncoated 96-well plates, and IL-2 (1000 U) plus IL-12 (10 ng/ml) or YAC-1 cells (10:1 E:T ratio) were added. Anti-CD107a (FITC or PE-Cy7 [1D4B]), a marker of degranulation, was also added to NK1.1 and YAC-1–stimulated splenocyte cultures (36, 37). Plates were incubated for 4–8 h, during which brefeldin A and monensin were added after the first 30 min. To elicit GM-CSF and TNF-α production, NK cells were incubated with IL-2 (1000 U) and IL-12 (10 ng/ml) for 18 h, followed by PMA (50 ng/ml) and ionomycin (1 μg/ ml), with brefeldin A being added during the last 4 h to block cytokine secretion and raise intracellular cytokine stores, as reported by Vosshenrich et al. (34). Following incubation, cells were stained with lineage-specific Abs and then fixed and permeabilized using BD cytofix/cytoperm kits, according to manufacturers’ protocol. Intracellular cytokines and granzyme B were detected using mAbs against IFN-γ (FITC or PE-Cy7 [XMG1.2]), granzyme B (PE [GB11]), TNF-α (PE [MP6-XT22]), and GM-CSF (FITC [MP1-22E9]) (BD Biosciences).
Statistics
Statistics were performed using GraphPad Prism 4 software (La Jolla, CA). Values in text are means ± SEM. Body composition, food intake, weight, serum metabolic profile, immune cell populations, and NK cell function were analyzed using Student t test to determine significant differences between diet groups. Statistical significance was set at p < 0.05.
Results
Physiological parameters influenced by CR
CR is initiated at 14 wk of age (10% restriction), and at 15 wk of age the restriction is increased to 25%. Finally, at 16 wk, mice are fed a 40% restricted diet that is maintained throughout the life of the animal. For this study, our CR protocol supplied mice with 3 g food daily in the form of a vitamin- and mineral-supplemented cookie supplied by the NIA, whereas AL mice consumed ~4.53 g food daily (Fig. 1A). Our data indicate feeding CR mice with a 3 g cookie resulted in a 34% restriction rather than 40%; however, we still observed physiological changes indicating our CR protocol induced CR characteristics, which is supported by the notion that even mild CR (10–25%) is effective in increasing life span (1). Restriction resulted in mice with reduced body weight (Fig. 1A) achieved by a reduction in both lean and fat mass, as well as reduced body fat percentages (Fig. 1B). True CR exists independently from protein energy malnutrition (PEM), a deficiency resulting in nutritional stress shown to negatively impact the immune system and increase circulating glucocorticoids (38). To determine whether this CR protocol induced PEM, we assessed circulating levels of corticosterone, the major endogenous glucocorticoid (Fig. 1C), and serum albumin levels, a marker of protein status (Fig. 1C) (38). Consistent with the reports of others, CR resulted in increased circulating corticosterone; however, we found no difference in serum albumin levels between CR and AL mice, indicating NIH-31/NIA–fortified diet contains sufficient protein (18%). These findings support the notion that CR is a nutritional stress resulting in increased circulating glucocorticoids, but any immunological observations are independent of PEM (39). Other physiological parameters influenced by CR included reduced levels of serum cholesterol, triglycerides, and leptin, but normal blood glucose (Fig. 1C, 1D).
FIGURE 1.

Food intake and physiological parameters altered by CR. (A) Food intake and body weight were recorded daily for 7 d, and averages for AL and CR mice are shown. (B) Body composition was assessed by MRI on the day animals were sacrificed, and body fat percentage was calculated as the portion of fat mass relative to total mass. (C) Circulating levels of corticosterone, albumin, and leptin were determined in serum from AL and CR mice by ELISA on the day of sacrifice. (D) Serum glucose, triglycerides, and cholesterol from AL and CR mice were measured on day of sacrifice by colorimetric assays. Data are means ± SEM. *Indicates significance, p < 0.05 (n = 8–10 mice/group).
CR results in altered NK cells in distribution in peripheral tissues
We have previously shown that the percentage of NK1.1+ lymphocytes in the spleens, but not the lungs, is reduced in CR mice (14). However, it is possible that in this prior analysis NKT cells were included. Therefore, we assessed NK cell percentages (NK1.1+ CD3−) in the spleen, blood, BM, LN, and lungs of 6-mo-old AL and CR mice and found that CR results in a significant reduction in the frequency of cells that are NK cells in the spleen, lungs, and blood (Fig. 2A). In contrast, NK cells were found to be present at normal frequencies in LN and at an increased frequency in the BM (Fig. 2A). Because of differences in body weight and spleen mass, we normalized the absolute number of NK cells in various tissues to the weight of each tissue harvested (Fig. 2C–E). As NK cell frequency was reduced in the lungs and spleen, we expected to find a reduced number of NK cells after normalizing cell numbers to the weight of the respective tissues. Indeed, there were fewer NK cells in the lungs and spleens of CR than AL mice on a per mg of tissue basis (Fig. 2D, 2E). There was no detectable difference in NK cell numbers in the BM of CR mice compared with AL mice (Fig. 2C). Thus, the reduced frequency of NK cells in CR is not due to an increase in another cell population, but rather reflects a direct change to NK cells resulting from CR as both frequency and numbers of NK cells are reduced.
FIGURE 2.

Tissue weight and distribution of NK cells in CR mice. (A) The percentage of NK1.1+ CD3− cells of total lymphocytes was determined in various tissues known to contain NK cells and was found to be significantly reduced in the lungs, blood, and spleen (SPL) of CR mice. (B) Wet tissue weights from AL and CR mice were taken immediately following sacrifice of AL and CR mice. NK cell numbers from BM (C), spleen (D), and lungs (E) of CR and AL mice expressed as the number of NK cells per femur or per mg tissue. The absolute number of NK cells was calculated based on the frequency of NK cells of total cells analyzed by flow cytometry and divided by the wet tissue weight. Experiments were repeated twice. Data are means ± SEM. *Indicates significance, p < 0.05 (n = 5 mice/group/experiment).
CR alters expression of NK cell maturation markers
NK cells are a heterogeneous population of cells, undergoing a developmental process within the BM before seeding peripheral tissues (19, 29). Based on our observation that CR results in changes to NK cell frequency in the spleen, we investigated whether this was due to a reduction in total NK cells or reflected that a specific stage of maturation was reduced in CR. We found CR results in decreased percentages of splenic NK cells expressing the maturation markers CD11b, CD43, and KLRG1, but not DX5 (Fig. 3A). Similarly, fewer NK cells expressed Ly49C/I/F/H, indicating that NK cells in CR mice exhibit an immature phenotype (Fig. 3B). We also found NK cells from CR mice displayed increased expression of αv integrin (CD51), CD127, and CD94 (Fig. 3A), markers normally not expressed at high levels on mature NK cells (19). Further phenotypic marker examination showed that NK cells from CR mice exhibited higher expression of several activation markers such as CD69, B220, and glucocorticoid-induced TNFR-related protein (Fig. 3B). Overall, CR results in NK cells with an activated and immature phenotype, leading us to hypothesize that a lack of mature NK cells is the cause for reduced NK cell frequency and number in peripheral tissues of CR mice.
FIGURE 3.
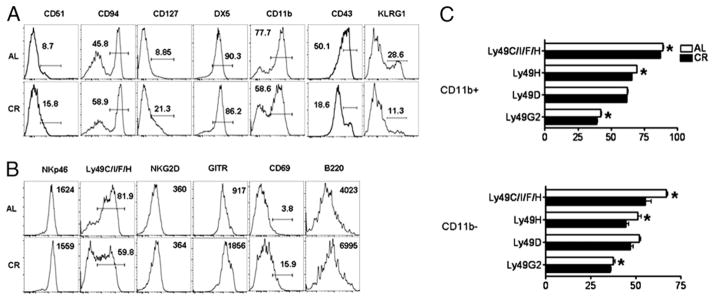
Characterization of surface phenotype of splenic NK cells in CR mice. Histograms are representative and contain either percentage of NK cells within the positive gate for the indicated cell surface Ag or the median fluorescence intensity of the indicated marker (when no gate is shown). (A) Expression of surface markers associated with NK cell maturation on splenic NK cells gated NK1.1+ CD3− from 6-mo-old AL and CR mice. (B) Expression of NK cell receptors and activation markers on splenic NK cells from CR and AL mice. (C) Ly49 repertoire on both CD11b+ (top) and CD11b− (bottom) NK cells. Data are mean ± SEM. Experiments were repeated twice. *Indicates significance, p < 0.05 (n = 5 mice/group/experiment).
Activating and inhibitory receptor expression is altered by CR
Our data indicate that the frequency of mature NK cells is altered by CR; therefore, we investigated whether expression of receptors involved in NK cell function was also influenced by CR. We found no difference in the median fluorescence intensity of the activating receptors NKp46 and NKG2D, but did observe a decreased frequency of NK cells stained with a mAb that recognizes Ly49C/I/ F/H (40). Furthermore, we observed a decrease in the frequency of NK cells expressing Ly49D, Ly49H, and Ly49G2 (data not shown). Because Ly49s are acquired during the maturation process, we investigated whether CR influenced the Ly49 receptor repertoire on mature (CD11b+) and immature (CD11b−) NK cells from CR and AL mice. CD11b+ NK cells from CR mice expressed slightly, but significantly reduced levels of Ly49H, Ly49G2, and Ly49C/I/F/H than CD11b+ NK cells from AL mice (Fig. 3C). Similarly, CD11b− NK cells from CR mice expressed significantly lower levels of Ly49H, Ly49G2, and Ly49C/I/F/H, although neither group showed significantly different expression of Ly49D (Fig. 3C).
CD127+ NK cells are increased in frequency, but not in number, in the BM, spleen, and LN of CR mice
NK cells expressing the IL-7Rα (CD127) are normally found at a high frequency in the thymus and LN; however, the origin of CD127+ NK cells remains to be fully resolved (34, 41). Athymic (foxn1−/ −) mice demonstrate a significant reduction in the frequency of CD127+ NK cells in the spleen and LN, supporting the notion that the thymus is a major source of CD127+ NK cells in peripheral tissues (34). However, it has also been postulated the thymic NK cell developmental pathway is an extension of a pathway normally occurring in the BM (21). Analysis of CD127 expression on NK cells from the spleen, LN, and BM of CR mice revealed a significantly greater proportion of NK cells in CR mice expressed CD127 in all three tissues (Fig. 4A). Because we observed a significant increase in CD127 expression on NK cells from CR mice (Fig. 3A), but changes in the frequency of total NK cells (Fig. 2A), we compared the absolute number of CD127+ NK cells between AL and CR mice (Fig. 4B). Whereas CD127+ NK cells represented a larger percentage of the total cell pool (data not shown), when we compared the absolute number of CD127+ NK cells present in AL and CR mice, we found no difference in CD127+ cell numbers in the spleen, LN, or BM (Fig. 4B), suggesting that CD127+ NK cell numbers are maintained in CR mice, whereas other NK cell subsets are reduced. The surface phenotype of CD127+ NK cells in CR mice also differed slightly from CD127+ NK cells from AL mice: in the spleen, DX5 and CD11b were both expressed at higher levels on CD127+ NK cells from CR mice than CD127+ NK cells from AL mice (Fig. 4C), whereas these cells had low expression of Ly49s compared with CD127− NK cells from either diet group. Similar to the spleen, DX5 expression was found to be higher on BM CD127+ NK cells from CR mice compared with CD127+ BM NK cells from AL mice (Fig. 4C). Because the thymus is known to be important for the generation of CD127+ NK cells, we assessed CD127+ NK cell frequencies in the thymi of CR and AL mice by first gating NK1.1+ CD3− cells (Fig. 4D) and comparing the frequency of NK cells expressing CD127, ~80% of NK cells in both AL and CR (Fig. 4D). Compared with AL mice, NK cells were increased in frequency (Fig. 4E) in the thymi of CR mice, but not in number after correcting for differences in thymic size (Fig. 4E), whereas total cells within the thymus were significantly reduced with CR (Fig. 4F). Taken together, the fact that CD127+ NK cells are present in comparable numbers between AL and CR mice, combined with similar numbers of CD127+ NK cells per mg thymus, suggests thymic output of NK cells is normal in CR mice and the increased frequency represents changes in frequencies of other NK cell populations in CR.
FIGURE 4.

A greater fraction of NK cells from CR mice expresses CD127. (A) CD127 expression on spleen (SPL), LN, and BM NK cells from AL and CR mice. (B) The absolute number of CD127+ NK cells (NK1.1+ CD3−) in the spleen, LN, and BM of AL and CR mice. (C) Surface phenotype of splenic and BM CD127+ NK cells from gates indicated in (A). Filled gray histogram represents CD127+ NK cells from AL; solid line represents CD127+ NK cells from CR; and dotted line represents splenic CD127− NK cells from AL mice. (D) Gating strategy for identification of thymic NK cells that are identified as NK1.1+ CD3− (top) and CD127+ (bottom). (E) Frequency of NK cells in the thymus represented both as frequency of thymocytes (top) and number of NK cells per mg thymus collected (bottom). (F) Absolute counts of various cell populations identified in the thymus of AL and CR are shown. Flow plots are representative and contain the percentage of NK cells positive for the indicated gates. Experiments were repeated twice. Data are mean ± SEM. *Indicates significance, p < 0.05 (n = 5 mice/group/experiment).
CD127+ NK cell cytokine production, but not cytotoxicity, is significantly altered by CR
NK cells can be classified into distinct functional subsets based on the cell surface phenotype and degree of cytokine production and cytotoxicity exhibited. In humans, CD16brightCD56dim NK cells are enriched in LN and produce high levels of cytokines, but have limited cytotoxicity, and it has been reported murine CD127+ NK cells have similar functional attributes (34). Because we observed an increased frequency of CD127+ NK cells in the spleen and LN of CR mice, we measured the capacity of LN and splenic NK cells to produce TNF-α and GM-CSF. Following stimulation, significantly more NK cells from CR mice stained positive for TNF-α and GM-CSF (Fig. 5A, 5B), correlating with the increased frequency of CD127+ NK cells (Fig. 4A). When gating on CD127+ NK cells from either the spleen or LN of CR mice, we found these cells produced TNF-α and GM-CSF at a higher frequency than CD127+ NK cells from AL mice (Fig. 5C), indicating a direct change in the activity of these cells on a per cell basis. Next, because we observed an increase in cytokine production by CD127+ NK cells from CR mice, we investigated whether these cells exhibited higher cytotoxic potential than CD127+ NK cells from AL mice when stimulated with YAC-1 cells. In general, CD127+ NK cells produced less granzyme B and degranulated at a lower frequency than CD127− NK cells in both CR and AL mice (data not shown); however, we observed no difference in the frequency of CD127+ NK cells staining positive for granzyme B or CD107a between CR and AL mice (Fig. 5C).
FIGURE 5.

Functional characterization of CD127+ NK cells from CR mice. (A) Analysis of cytokine production by NK cells (NK1.1+ CD3−) from AL and CR mice in nonstimulated (NS) controls (top), cells isolated from spleen (middle), and LN (bottom) stimulated with IL-2 (1000 U/ml), IL-12 (10 ng/ml), and PMA (50 ng/ml) plus ionomycin (1 μg/ml). (B) Summary of the frequency of cytokine-producing NK cells in the spleen (top) and LN (bottom) of AL and CR mice. (C) Splenic lymphocytes were gated NK1.1+ CD3−CD127+ and analyzed for cytokine production and cytotoxicity. Histograms of TNF-α and GM-CSF production following IL-2 plus IL-12 stimulation (top) and granzyme B and CD107a (bottom) staining following stimulation with YAC-1 cells (10:1 E:T ratio) in CD127+ NK cells from CR and AL mice. Filled gray histogram represents AL; solid line represents CR; and dotted line represents cells with no stimulation (NS) from CR mice. Flow plots and histograms are representative and contain the percentage of NK cells positive for the indicated gates. Experiments were repeated twice. Data are mean ± SEM. *Indicates significance, p < 0.05 (n = 5 mice/group/experiment).
NK cell subset distribution is sensitive to energy intake
In mice, upregulation of CD11b on NK cells is associated with functional maturity; however, Hayakawa and Smyth (28) have proposed that CD11b+ NK cells can be divided into functional subsets based on expression of CD27. We found that terminally differentiated NK cells (CD27−CD11b+) made up a significantly smaller portion of NK cells in both the spleen and BM of CR mice (Fig. 6A), although terminally differentiated NK cells are found at a relatively low frequency in the BM (Fig. 6A). Immature NK cells (CD11b−) and NK cells coexpressing CD27 and CD11b (DP) represented a larger portion of the total NK cell pool in CR mice compared with AL mice (Fig. 6A). To determine whether immature and DP NK cells were actually increased or whether this was due to a decrease in mature NK cells, we compared the frequency of NK cell subsets of total splenocytes and we found a 2-fold reduction in the frequency of DP NK cells and a 4-fold reduction in CD27−CD11b+ NK cells in the spleen of CR mice (Fig. 6B). Comparison of the frequency of CD27−CD11b− (double-negative [DN]) or CD27+CD11b− NK cells among total splenocytes revealed no differences between CR and AL. Upon assessing the frequency of NK cell subsets in the BM relative to total cells harvested, we found CD27+CD11b− and DP NK cells were increased in CR mice. This finding can be extrapolated to the observed increased frequency of NK cells in the BM of CR mice (Fig. 2A), which is due to an increase in CD27+CD11b− and DP NK cells. These data suggest that whereas modest changes to NK cells exist within the BM of CR mice, the majority of differences present in CR mice are found in peripheral NK cell tissues such as the spleen.
FIGURE 6.

Altered distribution of NK cell subsets in the BM and spleen of CR mice. (A) Distribution of NK cell (NK1.1+ CD3−) subsets based on expression of CD27 and CD11b in the BM (top) and spleens (bottom) of AL and CR mice. (B) Summary of the frequency of NK cells in each subset both as a percentage of NK cells (top) and as a percentage of total cells recovered (bottom). NK cell subsets were defined as CD27−CD11b− (DN), CD27+CD11b−, CD27+CD11b+ (DP), and CD27−CD11b+. (C) Gating strategy for transcription factor analysis (left) and summary of transcription factor expression in splenic NK cells from AL and CR mice (right). (D) Expression of KLRG1 and CD43 on splenic CD27−CD11b+ NK cells from AL and CR mice. Flow plots are representative and contain the percentage of NK cells positive for the indicated gates. Experiments were repeated twice. Data are mean ± SEM. *Indicates significance, p < 0.05 (n = 4–5 mice/group/experiment).
CR results in differential expression of T-bet and Eomes in NK cells
Although the precise molecular mechanisms that regulate NK cell maturation remain to be elucidated, it has been suggested that terminal maturation of NK cells is at least partially dependent on the transcription factors Eomes and T-bet (31). To understand whether changes in NK cell maturation were related to altered transcription factor expression, we analyzed the expression pattern of T-bet and Eomes within splenic NK cell subsets from CR and AL mice (Fig. 6C). With respect to Eomes, we found fewer DN, CD27+CD11b−, and DP NK cells from CR mice expressed Eomes when compared with the corresponding NK cell subsets from AL mice (Fig. 6C). There was no difference in the expression of T-bet when comparing CD27+CD11b− or DP NK cells from CR or AL mice. However, we detected DN and CD27−CD11b+ NK cells from CR mice expressed significantly lower levels of T-bet than CD27−CD11b+ NK cells from AL mice (Fig. 6C). Finally, after finding CD27−CD11b+ NK cells expressed altered levels of T-bet, we compared the frequency of CD27−CD11b+ NK cells from AL and CR mice expressing terminal maturation markers KLRG1 and CD43 (Fig. 6D), as the upregulation of these markers is thought to be at least partially dependent on T-bet expression. Consistent with reduced T-bet expression, both CD43 and KLRG1 were decreased on CD27−CD11b+ NK cells from CR mice, suggesting terminal differentiation of NK cells in CR mice is incomplete.
NK cells from CR mice have altered functional responses
We found NK cells from CR mice to be phenotypically immature and have altered distribution of functional subsets, and therefore began a series of experiments to determine whether these cells were also functionally immature. We found that BM NK cells from CR and AL mice were equally capable of IFN-γ production, although this tended to be lower in CR mice (Fig. 7A), possibly due to the decrease in CD27−CD11b+ NK cells in the CR BM (Fig. 6A). In contrast, stimulation of splenic NK cells with IL-2 plus IL-12 or anti-NK1.1 resulted in significantly fewer NK cells producing IFN-γ from CR mice (Fig. 7A, 7B). To determine whether the observed changes in NK cell IFN-γ production were due to a functional impairment or simply because of altered distribution of NK cell subsets, we compared IFN-γ production by CD27+ CD11b−, DP, and CD27−CD11b+ NK cells from CR and AL mice following stimulation known to elicit IFN-γ production by mature NK cells (IL-2 + IL-12) (Fig. 7A) (42). We observed no difference in IFN-γ production between NK cell subsets from AL and CR mice, suggesting the observed changes in IFN-γ production are due to alterations in NK cell subset distribution. NK cells from CR mice stimulated with plate-bound anti-NK1.1 or anti-NKp46 degranulated at a lower frequency than NK cells from AL mice, as defined by reduced surface CD107a (Fig. 7B, 7C). Similarly, granzyme B production was significantly diminished in NK cells from CR mice following activation receptor ligation by Abs (Fig. 7B, 7C). Interestingly, we found stimulation with YAC-1 cells resulted in increased surface CD107a and IFN-γ by NK cells from CR mice (Fig. 7D) as well as enhanced CD69 expression (data not shown) compared with NK cells from AL mice. Although the use of anti-NK1.1 or anti-NKp46 to activate NK cells resulted in a decreased frequency of NK cells from CR mice producing granzyme B, we found no difference in granzyme B production between CR and AL NK cells following YAC-1 stimulation (Fig. 7D). Taken together, our data suggest CR influences the distribution of NK cell subsets and results in NK cells that are less functional following stimulation with cytokines or plate-bound Abs, but retain high levels of responsiveness when faced with target cells.
FIGURE 7.
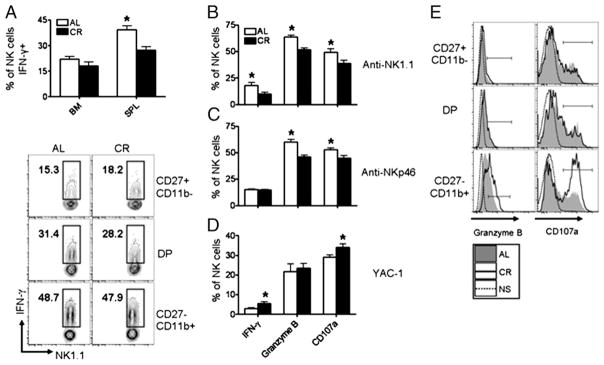
Function of NK cells from CR mice is altered after interrogation with various stimuli. (A) IFN-γ production by BM and splenic NK cells (NK1.1+ CD3−) stimulated with IL-2 (1000 U/ml) plus IL-12 (50 ng/ml) (top) and the frequency of splenic NK cell subsets producing IFN-γ from AL and CR mice (bottom). (B–D) Splenic NK cells from AL and CR mice were stimulated with (B) anti-NK1.1 (25 μg/ml), (C) anti-NKp46 (15 μg/ml), and (D) YAC-1 cells (10:1 E:T ratio), and DX5+ CD3− cells were analyzed for production of IFN-γ, granzyme B, and surface CD107a. (E) Histograms representing granzyme B and CD107a staining in NK cell subsets following stimulation of splenic NK cells with YAC-1 cells. NK cells from AL and CR mice were gated DX5+ CD3−, and the indicated NK cell subset was analyzed for granzyme B or CD107a expression. Filled gray histogram represents AL; solid line represents CR; and dotted line represents cells from CR mice that received no stimulation (NS). Flow plots and histograms are representative and contain the percentage of NK cells positive for the indicated gates. Experiments were repeated twice. Data are mean ± SEM. *Indicates significance, p < 0.05 (n = 5 mice/group/experiment).
CR results in functional changes to CD27−CD11b+ NK cells
Whereas IFN-γ production by NK cell subsets was comparable following cytokine stimulation, we observed NK cells from CR mice responded robustly to YAC-1 cells in vitro (Fig. 7D) and asked whether any of our previous observations, such as decreased expression of markers of terminal maturation on CD27−CD11b+ NK cells from CR mice (Fig. 6D), were related to increased responsiveness. We stimulated NK cells from AL and CR mice with YAC-1 cells and measured the functionality of individual NK cell subsets (Fig. 7E). The function of CD27+CD11b− and DP NK cells was comparable between AL and CR mice; however, CD27− CD11b+ NK cells from CR mice produced granzyme B and degranulated at a higher frequency than CD27−CD11b+ NK cells from AL controls (Fig. 7E). IFN-γ production was not different between any of the NK cell subsets analyzed following YAC-1 stimulation (data not shown), suggesting the increase in IFN-γ+ NK cells from CR mice was related to changes in NK cell subset distribution.
Discussion
It has been put forth that NK cells are sensitive to dietary manipulation; excessive and restricted energy intake, alcohol consumption, vitamins, and minerals as well as bioactive food components have all been suggested to influence NK cell cytotoxicity or NK cell development (43–51). However, detailed analysis of how dietary manipulation influences NK cell function and homeostasis is limited. Although CR has been shown repeatedly to have beneficial effects on T cell senescence, the implications of CR on innate immunity and NK cell homeostasis have been understudied. Prompted by our observation that NK cells are reduced in frequency and numbers in most peripheral tissues of CR mice, we further investigated functional and developmental changes to the NK cell pool in adult CR mice. In addition to reduced frequency of total NK cells, our results suggest that generation of NK cells in the BM is relatively unimpaired in CR, whereas the generation and/or maintenance of NK cells in peripheral tissues such as the spleen appear most affected. Furthermore, using CD27 and CD11b to classify NK cell subsets, our data indicate CR mainly influences the homeostasis of mature NK cell subsets in mice, as DN and CD27+CD11b− NK cells represented a comparable fraction of total splenocytes, but CD11b+ NK cells were significantly reduced.
In contrast to reduced mature NK cells, we observed an increased frequency of CD127+ NK cells not only in LN of CR mice, but also in the spleen and BM of CR mice, suggesting that CD127+ NK cells compose a larger portion of the NK cell pool in CR mice. Because we observed comparable numbers of CD127+ NK cells between AL and CR mice, we hypothesize that CD127+ NK cell output is not impaired in CR, whereas classical mature NK cell development is impaired, resulting in a greater frequency of NK cells being CD127+. CD127+ NK cells are normally recognized as having poor cytolytic potential, but high proinflammatory cytokine production (34); thus, we were not surprised to find NK cells from the LN and spleens of CR mice produced TNF-α and GM-CSF at a higher frequency than NK cells from AL mice. However, when we compared the capacity of CD127+ NK cells from AL mice and CR mice to produce TNF-α and GM-CSF, we consistently observed higher production of these cytokines by CD127+ NK cells from CR mice. The unique functional characteristics of CD127+ NK cells have been attributed to their limited Ly49 receptor repertoire (34); however, we did not detect any differences in the frequency of splenic CD127+ NK cells expressing Ly49C/I/ F/H. In contrast, we show DX5 and CD11b are expressed at higher levels on CD127+ NK cells from CR mice, tempting us to speculate that perhaps increased cytokine production is related to a more mature phenotype of these cells. Alternatively, BM CD127+ NK cells from CR mice expressed higher levels of Ly49 receptors, possibly acquiring increased functional competence early in development.
In this study, we show NK cells from CR mice are impaired in their ability to respond to stimulation through cytokine and activation receptors; however, we also demonstrate that NK cells from CR mice respond more robustly to YAC-1 cells than NK cells from AL mice. The observation that NK cells may harbor an immature phenotype, yet retain cytotoxicity against YAC-1 cells has been reported previously (32, 52, 53), suggesting that cytotoxicity is acquired at an early stage of NK cell development (52). Furthermore, the hyperresponsiveness of CR NK cells to YAC-1 cells is at least partially related to the increased frequency of DP NK cells in CR mice, as these cells are known to respond more robustly to YAC-1 cells, have a lower activation threshold, and exhibit cytotoxicity against YAC-1 cells through both NKG2D-dependent and independent mechanisms (28). We also observed enhanced responsiveness to YAC-1 cells in the CD27−CD11b+ NK cell subset from CR mice compared with AL mice. This phenomenon appears limited to NK cell activation mediated through cell–cell interactions, as we did not observe differences between the function of CD27−CD11b+ NK cells from AL and CR mice after stimulation with cytokines or Abs against major activating receptors. Investigation of potential causes for this observation revealed lower KLRG1 expression on CD27−CD11b+ NK cells from CR mice, which is often associated with hyporesponsive NK cells (30, 54). Thus, it is likely the increased responsiveness of CR NK cells to YAC-1 cells is due to both an increased frequency of DP NK cells as well as increased cell–cell responsiveness of CD27−CD11b+ NK cells.
Little is known about the molecular events required for acquisition of KLRG1 and downregulation of CD27 on CD11b+ NK cells in the periphery; however, this process is thought to be mediated through coordinated expression of several transcription factors (55, 56). NK cell development and homeostasis rely on numerous transcription factors, such as Id2, IFN regulatory factor-2, Eomes, T-Bet, Gata-3, Blimp1, and E4BP4 (31, 55). It has been suggested that terminal maturation of NK cells takes place in the spleen in a T-bet–dependent manner, with upregulation of KLRG1 and CD43 being severely impaired in T-bet–deficient (tbx21−/ −) mice, whereas Eomes appears to play an opposite role by promoting downregulation of markers associated with immature NK cells (31, 56). In this study, we investigated whether T-bet or Eomes deficiencies in NK cells from CR mice could explain the observed reduction in terminally mature NK cells. We found T-bet to be expressed at lower levels in DN and, importantly, CD27− CD11b+ NK cells. Based on this finding, we further analyzed the surface phenotype of CD27−CD11b+ NK cells in CR mice and found that significantly fewer CD27−CD11b+ NK cells expressed CD43 and KLRG1. Our data suggest dietary regimes, such as CR, can result in altered expression of transcription factors important for NK cell maturation such as Eomes and T-bet, possibly resulting in changes to NK cell phenotype and function.
Recent studies have highlighted the central role of the energy-sensitive serine/threonine kinase, mammalian target of rapamycin (mTOR), in regulating the expression of transcription factors such as Eomes and T-bet in T cells. Inhibition of mTOR by treatment of CD8+ T cells with a CR mimetic, rapamycin, results in the inhibition of IL-12–induced T-bet expression, suggesting a direct relationship between energy status and development of lymphocytes into effector subtypes (57). However, although becoming increasingly established in T cells, the relationship between metabolism and NK cell maturation and function is somewhat less well understood. Leptin, a cytokine involved in the upstream activation of PI3K and AKT, was shown in this study to be reduced in CR mice (58, 59). Importantly, NK cells express the leptin receptor (CD295), and leptin has been shown to be important in maintaining NK cell numbers, making our observations pertaining to decreased leptin in CR mice a potential candidate through which some of the immunomodulatory effects of CR are mediated (60, 61). In NK cells, inhibition of PI3K signaling, a kinase with a central role in the integration of metabolic signals upstream of mTOR, results in phenotypic and functional changes to NK cells, some of which are similar to the results reported in this study in our model of CR, such as high expression of CD127 and reduced terminal maturation (62, 63).
In the BM and periphery, IL-15 has been firmly established to play a critical role in the generation and maintenance of NK cells (64). Mice deficient in IL-15 have few detectable NK cells, and it has been shown IL-15 signaling regulates NK cell development in the BM and NK cell homeostasis and terminal maturation in the periphery (65). Because we observed a significant reduction in NK cells in CR mice, one hypothesis is that CR may result in reduced levels of IL-15 trans-presentation. This is supported by the observation that CR results in apoptosis of senescent memory T cells in aged mice, which are thought to be dependent on IL-7 and IL-15 (65–67). However, we observed no difference in IL-15Rα levels on splenic monocytes from CR mice (E. Gardner, unpublished observations) and did not observe a significant reduction in NK cells in the BM, resulting in inconclusive findings about the implications of CR on IL-15 production or trans-presentation. Furthermore, CR has been shown to reduce chronic inflammation that arises during aging or in models of chronic inflammation through reducing production of inflammatory cytokines such as C-reactive protein, IL-6, TNF-α, and leptin, as well as increasing circulating glucocorticoids (68). Overall, these changes result in a significantly altered cytokine milieu in vivo, leading us to hypothesize that the changes to NK cells observed are due to a multitude of adaptations to the CR homeostatic environment, confounding the isolation of a single specific cause.
It should be noted that the tissues we observed decrease in NK cell frequency in CR mice generally house NK cells that have made significant maturational progress. For example, in AL mice, tissues such as the lungs and blood house mostly terminally differentiated CD27−CD11b+ NK cells (28), a subset of NK cells that we show to be significantly reduced in CR mice. This suggests the lack of mature NK cells in CR mice contributes greatly to the decreased frequency of NK cells observed throughout the body of CR mice. The inability of NK cells to robustly populate the lungs and blood of CR mice could also be related to decreased expression of chemokine receptors, as CR has been previously shown to influence chemokine receptor expression on T cells (69). Among these chemokine receptors, S1P5 has been shown to regulate emigration of NK cells from BM sinusoids in a T-bet–dependent manner, suggesting reduced T-bet expression may be the cause for increased BM NK cells in CR mice. However, we do not believe this to be the case, as we only observed decreased T-bet expression in DN and CD27−CD11b+ NK cells, rather than CD27+CD11b− or DP NK cells, the likely candidates for BM egress. Furthermore, we do not believe impaired emigration from the BM of CR mice can completely explain the decreased frequency of NK cells in peripheral tissues of CR mice, as the increased frequency of NK cells in the BM did not result in differences between the total number of NK cells recovered from the femurs of CR and AL mice.
CR without malnutrition is a dietary intervention used in both gerontological and oncological research, yet CR protocols are varied, despite attempts at unifying and standardizing the dietary intervention (38, 69). However, we employed the best documented and studied CR protocols, established by the NIA, which have been repeatedly shown to increase the life span of laboratory animals when initiated early in life (1). Furthermore, our studies in young adult CR mice allow us to study the effect of CR on NK cells independent of aging. We and others have found adult mice subjected to CR early in life suffer increased susceptibility to pathogens, thus raising the question of whether CR is only useful in a laboratory setting (10, 13, 15, 39, 70–72). Infection via these pathogens results in substantial weight loss, which could be detrimental to CR mice because of limited energy reserves (7). However, it is also plausible that CR initiated before adulthood results in immunological changes such as those presented in this work, that increase susceptibility to specific pathogens, limiting the usefulness of this intervention in humans. However, future studies are required to determine whether this is specific for respiratory viruses as we have shown, or whether other viral infections such as HSV-1, mousepox, and murine CMV pose a greater threat to CR mice as well (16, 73). Our study utilizing dietary manipulation in a mouse model led us to wonder whether CR has a similar effect on NK cells in humans. Indeed, the NIA has begun a series of human trials to determine the efficacy of CR in humans; this study, known as the Comprehensive Assessment of the Long-Term Effects of Reducing Intake of Energy (CALERIE), should allow for further study of the influence of CR on immune function in humans (74). Furthermore, because CR is designed as a dietary intervention to delay aging, it will be interesting to determine whether any age-related changes in NK cell phenotype that occur in mice are ameliorated or exacerbated by CR in humans and mice (36, 73).
Acknowledgments
This work was supported by National Institutes of Health Grant R01AG034949-01A1 (to E.M.G.).
We thank Dr. Jeannine Scott for insightful discussion regarding the manuscript. We also thank Brooke Roman for technical assistance.
Abbreviations in this article
- AL
ad libitum
- BM
bone marrow
- CR
caloric restriction
- DN
double-negative
- DP
double-positive
- Eomes
eomesodermin
- KLRG1
killer cell lectin-like receptor G1
- LN
lymph node
- MRI
magnetic resonance imaging
- mTOR
mammalian target of rapamycin
- NIA
National Institute on Aging
- PEM
protein energy malnutrition
Footnotes
Disclosures
The authors have no financial conflicts of interest.
References
- 1.Turturro A, Witt WW, Lewis S, Hass BS, Lipman RD, Hart RW. Growth curves and survival characteristics of the animals used in the Biomarkers of Aging Program. J Gerontol A Biol Sci Med Sci. 1999;54:B492–B501. doi: 10.1093/gerona/54.11.b492. [DOI] [PubMed] [Google Scholar]
- 2.Turturro A, Blank K, Murasko D, Hart R. Mechanisms of caloric restriction affecting aging and disease. Ann N Y Acad Sci. 1994;719:159–170. doi: 10.1111/j.1749-6632.1994.tb56827.x. [DOI] [PubMed] [Google Scholar]
- 3.Anderson RM, Weindruch R. Metabolic reprogramming, caloric restriction and aging. Trends Endocrinol Metab. 2010;21:134–141. doi: 10.1016/j.tem.2009.11.005. [DOI] [PMC free article] [PubMed] [Google Scholar]
- 4.Weindruch R. The retardation of aging by caloric restriction: studies in rodents and primates. Toxicol Pathol. 1996;24:742–745. doi: 10.1177/019262339602400618. [DOI] [PubMed] [Google Scholar]
- 5.Dorshkind K, Montecino-Rodriguez E, Signer RA. The ageing immune system: is it ever too old to become young again? Nat Rev Immunol. 2009;9:57–62. doi: 10.1038/nri2471. [DOI] [PubMed] [Google Scholar]
- 6.Jolly CA. Dietary restriction and immune function. J Nutr. 2004;134:1853–1856. doi: 10.1093/jn/134.8.1853. [DOI] [PubMed] [Google Scholar]
- 7.Messaoudi I, Fischer M, Warner J, Park B, Mattison J, Ingram DK, Totonchy T, Mori M, Nikolich-Zugich J. Optimal window of caloric restriction onset limits its beneficial impact on T-cell senescence in primates. Aging Cell. 2008;7:908–919. doi: 10.1111/j.1474-9726.2008.00440.x. [DOI] [PMC free article] [PubMed] [Google Scholar]
- 8.Nikolich-Zugich J, Messaoudi I. Mice and flies and monkeys too: caloric restriction rejuvenates the aging immune system of non-human primates. Exp Gerontol. 2005;40:884–893. doi: 10.1016/j.exger.2005.06.007. [DOI] [PubMed] [Google Scholar]
- 9.Effros RB, Walford RL, Weindruch R, Mitcheltree C. Influences of dietary restriction on immunity to influenza in aged mice. J Gerontol. 1991;46:B142–B147. doi: 10.1093/geronj/46.4.b142. [DOI] [PubMed] [Google Scholar]
- 10.Sun D, Muthukumar AR, Lawrence RA, Fernandes G. Effects of calorie restriction on polymicrobial peritonitis induced by cecum ligation and puncture in young C57BL/6 mice. Clin Diagn Lab Immunol. 2001;8:1003–1011. doi: 10.1128/CDLI.8.5.1003-1011.2001. [DOI] [PMC free article] [PubMed] [Google Scholar]
- 11.Reynolds MA, Dawson DR, Novak KF, Ebersole JL, Gunsolley JC, Branch-Mays GL, Holt SC, Mattison JA, Ingram DK, Novak MJ. Effects of caloric restriction on inflammatory periodontal disease. Nutrition. 2009;25:88–97. doi: 10.1016/j.nut.2008.07.003. [DOI] [PMC free article] [PubMed] [Google Scholar]
- 12.Weindruch R, Devens BH, Raff HV, Walford RL. Influence of dietary restriction and aging on natural killer cell activity in mice. J Immunol. 1983;130:993–996. [PubMed] [Google Scholar]
- 13.Gardner EM. Caloric restriction decreases survival of aged mice in response to primary influenza infection. J Gerontol A Biol Sci Med Sci. 2005;60:688–694. doi: 10.1093/gerona/60.6.688. [DOI] [PubMed] [Google Scholar]
- 14.Ritz BW, Aktan I, Nogusa S, Gardner EM. Energy restriction impairs natural killer cell function and increases the severity of influenza infection in young adult male C57BL/6 mice. J Nutr. 2008;138:2269–2275. doi: 10.3945/jn.108.093633. [DOI] [PMC free article] [PubMed] [Google Scholar]
- 15.Kristan DM. Chronic calorie restriction increases susceptibility of laboratory mice (Mus musculus) to a primary intestinal parasite infection. Aging Cell. 2007;6:817–825. doi: 10.1111/j.1474-9726.2007.00345.x. [DOI] [PubMed] [Google Scholar]
- 16.Vivier E, Tomasello E, Baratin M, Walzer T, Ugolini S. Functions of natural killer cells. Nat Immunol. 2008;9:503–510. doi: 10.1038/ni1582. [DOI] [PubMed] [Google Scholar]
- 17.Bryceson YT, Ljunggren HG. Tumor cell recognition by the NK cell activating receptor NKG2D. Eur J Immunol. 2008;38:2957–2961. doi: 10.1002/eji.200838833. [DOI] [PubMed] [Google Scholar]
- 18.Culley FJ. Natural killer cells in infection and inflammation of the lung. Immunology. 2009;128:151–163. doi: 10.1111/j.1365-2567.2009.03167.x. [DOI] [PMC free article] [PubMed] [Google Scholar]
- 19.Kim S, Iizuka K, Kang HS, Dokun A, French AR, Greco S, Yokoyama WM. In vivo developmental stages in murine natural killer cell maturation. Nat Immunol. 2002;3:523–528. doi: 10.1038/ni796. [DOI] [PubMed] [Google Scholar]
- 20.Roth C, Rothlin C, Riou S, Raulet DH, Lemke G. Stromal-cell regulation of natural killer cell differentiation. J Mol Med. 2007;85:1047–1056. doi: 10.1007/s00109-007-0195-0. [DOI] [PubMed] [Google Scholar]
- 21.Huntington ND, Vosshenrich CA, Di Santo JP. Developmental pathways that generate natural-killer-cell diversity in mice and humans. Nat Rev Immunol. 2007;7:703–714. doi: 10.1038/nri2154. [DOI] [PubMed] [Google Scholar]
- 22.Sola C, André P, Lemmers C, Fuseri N, Bonnafous C, Bléry M, Wagtmann NR, Romagné F, Vivier E, Ugolini S. Genetic and antibody-mediated reprogramming of natural killer cell missing-self recognition in vivo. Proc Natl Acad Sci USA. 2009;106:12879–12884. doi: 10.1073/pnas.0901653106. [DOI] [PMC free article] [PubMed] [Google Scholar]
- 23.Chiossone L, Chaix J, Fuseri N, Roth C, Vivier E, Walzer T. Maturation of mouse NK cells is a 4-stage developmental program. Blood. 2009;113:5488–5496. doi: 10.1182/blood-2008-10-187179. [DOI] [PubMed] [Google Scholar]
- 24.Kamizono S, Duncan GS, Seidel MG, Morimoto A, Hamada K, Grosveld G, Akashi K, Lind EF, Haight JP, Ohashi PS, et al. Nfil3/ E4bp4 is required for the development and maturation of NK cells in vivo. J Exp Med. 2009;206:2977–2986. doi: 10.1084/jem.20092176. [DOI] [PMC free article] [PubMed] [Google Scholar]
- 25.Wilk E, Kalippke K, Buyny S, Schmidt RE, Jacobs R. New aspects of NK cell subset identification and inference of NK cells’ regulatory capacity by assessing functional and genomic profiles. Immunobiology. 2008;213:271–283. doi: 10.1016/j.imbio.2007.10.012. [DOI] [PubMed] [Google Scholar]
- 26.Yokoyama WM, Kim S, French AR. The dynamic life of natural killer cells. Annu Rev Immunol. 2004;22:405–429. doi: 10.1146/annurev.immunol.22.012703.104711. [DOI] [PubMed] [Google Scholar]
- 27.Colucci F, Caligiuri MA, Di Santo JP. What does it take to make a natural killer? Nat Rev Immunol. 2003;3:413–425. doi: 10.1038/nri1088. [DOI] [PubMed] [Google Scholar]
- 28.Hayakawa Y, Smyth MJ. CD27 dissects mature NK cells into two subsets with distinct responsiveness and migratory capacity. J Immunol. 2006;176:1517–1524. doi: 10.4049/jimmunol.176.3.1517. [DOI] [PubMed] [Google Scholar]
- 29.Huntington ND, Tabarias H, Fairfax K, Brady J, Hayakawa Y, Degli-Esposti MA, Smyth MJ, Tarlinton DM, Nutt SL. NK cell maturation and peripheral homeostasis is associated with KLRG1 up-regulation. J Immunol. 2007;178:4764–4770. doi: 10.4049/jimmunol.178.8.4764. [DOI] [PubMed] [Google Scholar]
- 30.Robbins SH, Nguyen KB, Takahashi N, Mikayama T, Biron CA, Brossay L. Cutting edge: inhibitory functions of the killer cell lectin-like receptor G1 molecule during the activation of mouse NK cells. J Immunol. 2002;168:2585–2589. doi: 10.4049/jimmunol.168.6.2585. [DOI] [PubMed] [Google Scholar]
- 31.Gordon SM, Chaix J, Rupp LJ, Wu J, Madera S, Sun JC, Lindsten T, Reiner SL. The transcription factors T-bet and Eomes control key checkpoints of natural killer cell maturation. Immunity. 2012;36:55–67. doi: 10.1016/j.immuni.2011.11.016. [DOI] [PMC free article] [PubMed] [Google Scholar]
- 32.Samson SI, Richard O, Tavian M, Ranson T, Vosshenrich CA, Colucci F, Buer J, Grosveld F, Godin I, Di Santo JP. GATA-3 promotes maturation, IFN-gamma production, and liver-specific homing of NK cells. Immunity. 2003;19:701–711. doi: 10.1016/s1074-7613(03)00294-2. [DOI] [PubMed] [Google Scholar]
- 33.Sun JC, Lanier LL. NK cell development, homeostasis and function: parallels with CD8+ T cells. Nat Rev Immunol. 2011;11:645–657. doi: 10.1038/nri3044. [DOI] [PMC free article] [PubMed] [Google Scholar]
- 34.Vosshenrich CA, García-Ojeda ME, Samson-Villéger SI, Pasqualetto V, Enault L, Richard-Le Goff O, Corcuff E, Guy-Grand D, Rocha B, Cumano A, et al. A thymic pathway of mouse natural killer cell development characterized by expression of GATA-3 and CD127. Nat Immunol. 2006;7:1217–1224. doi: 10.1038/ni1395. [DOI] [PubMed] [Google Scholar]
- 35.Clinthorne JF, Adams DJ, Fenton JI, Ritz BW, Gardner EM. Short-term re-feeding of previously energy-restricted C57BL/6 male mice restores body weight and body fat and attenuates the decline in natural killer cell function after primary influenza infection. J Nutr. 2010;140:1495–1501. doi: 10.3945/jn.110.122408. [DOI] [PMC free article] [PubMed] [Google Scholar]
- 36.Beli E, Clinthorne JF, Duriancik DM, Hwang I, Kim S, Gardner EM. Natural killer cell function is altered during the primary response of aged mice to influenza infection. Mech Ageing Dev. 2011;132:503–510. doi: 10.1016/j.mad.2011.08.005. [DOI] [PMC free article] [PubMed] [Google Scholar]
- 37.Alter G, Malenfant JM, Altfeld M. CD107a as a functional marker for the identification of natural killer cell activity. J Immunol Methods. 2004;294:15–22. doi: 10.1016/j.jim.2004.08.008. [DOI] [PubMed] [Google Scholar]
- 38.Cerqueira FM, Kowaltowski AJ. Commonly adopted caloric restriction protocols often involve malnutrition. Ageing Res Rev. 2010;9:424–430. doi: 10.1016/j.arr.2010.05.002. [DOI] [PubMed] [Google Scholar]
- 39.Piccio L, Stark JL, Cross AH. Chronic calorie restriction attenuates experimental autoimmune encephalomyelitis. J Leukoc Biol. 2008;84:940–948. doi: 10.1189/jlb.0208133. [DOI] [PMC free article] [PubMed] [Google Scholar]
- 40.Lanier LL. Up on the tightrope: natural killer cell activation and inhibition. Nat Immunol. 2008;9:495–502. doi: 10.1038/ni1581. [DOI] [PMC free article] [PubMed] [Google Scholar]
- 41.Luther C, Warner K, Takei F. Unique progenitors in mouse lymph node develop into CD127+ NK cells: thymus-dependent and thymus-independent pathways. Blood. 2011;117:4012–4021. doi: 10.1182/blood-2010-07-298901. [DOI] [PubMed] [Google Scholar]
- 42.Kim S, Song YJ, Higuchi DA, Kang HP, Pratt JR, Yang L, Hong CM, Poursine-Laurent J, Iizuka K, French AR, et al. Arrested natural killer cell development associated with transgene insertion into the Atf2 locus. Blood. 2006;107:1024–1030. doi: 10.1182/blood-2005-04-1493. [DOI] [PMC free article] [PubMed] [Google Scholar]
- 43.Tanaka S, Koizumi S, Makiuchi N, Aoyagi Y, Quivy E, Mitamura R, Kano T, Wakita D, Chamoto K, Kitamura H, Nishimura T. The extract of Japanese soybean, Kurosengoku activates the production of IL-12 and IFN-γ by DC or NK1.1(+) cells in a TLR4- and TLR2-dependent manner. Cell Immunol. 2011;266:135–142. doi: 10.1016/j.cellimm.2010.09.009. [DOI] [PubMed] [Google Scholar]
- 44.Atasever B, Ertan NZ, Erdem-Kuruca S, Karakas Z. In vitro effects of vitamin C and selenium on NK activity of patients with beta-thalassemia major. Pediatr Hematol Oncol. 2006;23:187–197. doi: 10.1080/08880010500506420. [DOI] [PubMed] [Google Scholar]
- 45.Zhang H, Meadows GG. Chronic alcohol consumption perturbs the balance between thymus-derived and bone marrow-derived natural killer cells in the spleen. J Leukoc Biol. 2008;83:41–47. doi: 10.1189/jlb.0707472. [DOI] [PubMed] [Google Scholar]
- 46.Heuser G, Vojdani A. Enhancement of natural killer cell activity and T and B cell function by buffered vitamin C in patients exposed to toxic chemicals: the role of protein kinase-C. Immunopharmacol Immunotoxicol. 1997;19:291–312. doi: 10.3109/08923979709046977. [DOI] [PubMed] [Google Scholar]
- 47.Horimoto T, Kawaoka Y. Designing vaccines for pandemic influenza. Curr Top Microbiol Immunol. 2009;333:165–176. doi: 10.1007/978-3-540-92165-3_8. [DOI] [PMC free article] [PubMed] [Google Scholar]
- 48.Lee KN, Kang HS, Jeon JH, Kim EM, Yoon SR, Song H, Lyu CY, Piao ZH, Kim SU, Han YH, et al. VDUP1 is required for the development of natural killer cells. Immunity. 2005;22:195–208. doi: 10.1016/j.immuni.2004.12.012. [DOI] [PubMed] [Google Scholar]
- 49.Ohara T, Yoshino K, Kitajima M. Possibility of preventing colorectal carcinogenesis with probiotics. Hepatogastroenterology. 2010;57:1411–1415. [PubMed] [Google Scholar]
- 50.Smith AG, Sheridan PA, Harp JB, Beck MA. Diet-induced obese mice have increased mortality and altered immune responses when infected with influenza virus. J Nutr. 2007;137:1236–1243. doi: 10.1093/jn/137.5.1236. [DOI] [PubMed] [Google Scholar]
- 51.Ritz BW, Nogusa S, Ackerman EA, Gardner EM. Supplementation with active hexose correlated compound increases the innate immune response of young mice to primary influenza infection. J Nutr. 2006;136:2868–2873. doi: 10.1093/jn/136.11.2868. [DOI] [PubMed] [Google Scholar]
- 52.Taki S, Nakajima S, Ichikawa E, Saito T, Hida S. IFN regulatory factor-2 deficiency revealed a novel checkpoint critical for the generation of peripheral NK cells. J Immunol. 2005;174:6005–6012. doi: 10.4049/jimmunol.174.10.6005. [DOI] [PubMed] [Google Scholar]
- 53.Townsend MJ, Weinmann AS, Matsuda JL, Salomon R, Farnham PJ, Biron CA, Gapin L, Glimcher LH. T-bet regulates the terminal maturation and homeostasis of NK and Valpha14i NKT cells. Immunity. 2004;20:477–494. doi: 10.1016/s1074-7613(04)00076-7. [DOI] [PubMed] [Google Scholar]
- 54.Robbins SH, Tessmer MS, Mikayama T, Brossay L. Expansion and contraction of the NK cell compartment in response to murine cytomegalovirus infection. J Immunol. 2004;173:259–266. doi: 10.4049/jimmunol.173.1.259. [DOI] [PubMed] [Google Scholar]
- 55.Martín-Fontecha A, Lord GM, Brady HJ. Transcriptional control of natural killer cell differentiation and function. Cell Mol Life Sci. 2011;68:3495–3503. doi: 10.1007/s00018-011-0800-9. [DOI] [PMC free article] [PubMed] [Google Scholar]
- 56.Soderquest K, Powell N, Luci C, van Rooijen N, Hidalgo A, Geissmann F, Walzer T, Lord GM, Martín-Fontecha A. Monocytes control natural killer cell differentiation to effector phenotypes. Blood. 2011;117:4511–4518. doi: 10.1182/blood-2010-10-312264. [DOI] [PubMed] [Google Scholar]
- 57.Rao RR, Li Q, Odunsi K, Shrikant PA. The mTOR kinase determines effector versus memory CD8+ T cell fate by regulating the expression of transcription factors T-bet and Eomesodermin. Immunity. 2010;32:67–78. doi: 10.1016/j.immuni.2009.10.010. [DOI] [PMC free article] [PubMed] [Google Scholar]
- 58.Maya-Monteiro CM, Almeida PE, D’Avila H, Martins AS, Rezende AP, Castro-Faria-Neto H, Bozza PT. Leptin induces macrophage lipid body formation by a phosphatidylinositol 3-kinase- and mammalian target of rapamycin-dependent mechanism. J Biol Chem. 2008;283:2203–2210. doi: 10.1074/jbc.M706706200. [DOI] [PubMed] [Google Scholar]
- 59.Maya-Monteiro CM, Bozza PT. Leptin and mTOR: partners in metabolism and inflammation. Cell Cycle. 2008;7:1713–1717. doi: 10.4161/cc.7.12.6157. [DOI] [PubMed] [Google Scholar]
- 60.Lo CK, Lam QL, Yang M, Ko KH, Sun L, Ma R, Wang S, Xu H, Tam S, Wu CY, et al. Leptin signaling protects NK cells from apoptosis during development in mouse bone marrow. Cell Mol Immunol. 2009;6:353–360. doi: 10.1038/cmi.2009.46. [DOI] [PMC free article] [PubMed] [Google Scholar]
- 61.Tian Z, Sun R, Wei H, Gao B. Impaired natural killer (NK) cell activity in leptin receptor deficient mice: leptin as a critical regulator in NK cell development and activation. Biochem Biophys Res Commun. 2002;298:297–302. doi: 10.1016/s0006-291x(02)02462-2. [DOI] [PubMed] [Google Scholar]
- 62.Tassi I, Cella M, Gilfillan S, Turnbull I, Diacovo TG, Penninger JM, Colonna M. p110gamma and p110delta phosphoinositide 3-kinase signaling pathways synergize to control development and functions of murine NK cells. Immunity. 2007;27:214–227. doi: 10.1016/j.immuni.2007.07.014. [DOI] [PubMed] [Google Scholar]
- 63.Gingras AC, Raught B, Sonenberg N. mTOR signaling to translation. Curr Top Microbiol Immunol. 2004;279:169–197. doi: 10.1007/978-3-642-18930-2_11. [DOI] [PubMed] [Google Scholar]
- 64.Cooper MA, Bush JE, Fehniger TA, VanDeusen JB, Waite RE, Liu Y, Aguila HL, Caligiuri MA. In vivo evidence for a dependence on interleukin 15 for survival of natural killer cells. Blood. 2002;100:3633–3638. doi: 10.1182/blood-2001-12-0293. [DOI] [PubMed] [Google Scholar]
- 65.Boyman O, Krieg C, Homann D, Sprent J. Homeostatic maintenance of T cells and natural killer cells. Cell Mol Life Sci. 2012;69:1597–1608. doi: 10.1007/s00018-012-0968-7. [DOI] [PMC free article] [PubMed] [Google Scholar]
- 66.Schluns KS, Williams K, Ma A, Zheng XX, Lefrançois L. Cutting edge: requirement for IL-15 in the generation of primary and memory antigen-specific CD8 T cells. J Immunol. 2002;168:4827–4831. doi: 10.4049/jimmunol.168.10.4827. [DOI] [PubMed] [Google Scholar]
- 67.Spaulding CC, Walford RL, Effros RB. The accumulation of non-replicative, non-functional, senescent T cells with age is avoided in calorically restricted mice by an enhancement of T cell apoptosis. Mech Ageing Dev. 1997;93:25–33. doi: 10.1016/s0047-6374(96)01808-8. [DOI] [PubMed] [Google Scholar]
- 68.Leakey JE, Chen S, Manjgaladze M, Turturro A, Duffy PH, Pipkin JL, Hart RW. Role of glucocorticoids and “caloric stress” in modulating the effects of caloric restriction in rodents. Ann N Y Acad Sci. 1994;719:171–194. doi: 10.1111/j.1749-6632.1994.tb56828.x. [DOI] [PubMed] [Google Scholar]
- 69.Yung R, Mo R, Grolleau-Julius A, Hoeltzel M. The effect of aging and caloric restriction on murine CD8+ T cell chemokine receptor gene expression. Immun Ageing. 2007;4:8. doi: 10.1186/1742-4933-4-8. [DOI] [PMC free article] [PubMed] [Google Scholar]
- 70.Abe T, Nakajima A, Satoh N, Ohkoshi M, Sakuragi S, Koizumi A. Suppression of experimental autoimmune uveoretinitis by dietary calorie restriction. Jpn J Ophthalmol. 2001;45:46–52. doi: 10.1016/s0021-5155(00)00303-8. [DOI] [PubMed] [Google Scholar]
- 71.Luan X, Zhao W, Chandrasekar B, Fernandes G. Calorie restriction modulates lymphocyte subset phenotype and increases apoptosis in MRL/lpr mice. Immunol Lett. 1995;47:181–186. doi: 10.1016/0165-2478(95)00091-5. [DOI] [PubMed] [Google Scholar]
- 72.Phelan JP, Rose MR. Why dietary restriction substantially increases longevity in animal models but won’t in humans. Ageing Res Rev. 2005;4:339–350. doi: 10.1016/j.arr.2005.06.001. [DOI] [PubMed] [Google Scholar]
- 73.Fang M, Roscoe F, Sigal LJ. Age-dependent susceptibility to a viral disease due to decreased natural killer cell numbers and trafficking. J Exp Med. 2010;207:2369–2381. doi: 10.1084/jem.20100282. [DOI] [PMC free article] [PubMed] [Google Scholar]
- 74.Rochon J, Bales CW, Ravussin E, Redman LM, Holloszy JO, Racette SB, Roberts SB, Das SK, Romashkan S, Galan KM, et al. CALERIE Study Group. Design and conduct of the CALERIE study: comprehensive assessment of the long-term effects of reducing intake of energy. J Gerontol A Biol Sci Med Sci. 2011;66A:97–108. doi: 10.1093/gerona/glq168. [DOI] [PMC free article] [PubMed] [Google Scholar]