

Abstract
Breast cancer is a collection of diseases with distinct molecular traits, prognosis, and therapeutic options. Luminal A breast cancer is the most heterogeneous, both molecularly and clinically. Using genomic data from over 1,000 Luminal A tumors from multiple studies, we analyzed the copy number and mutational landscape of this tumor subtype. This integrated analysis revealed four major subtypes defined by distinct copy-number and mutation profiles. We identified an atypical Luminal A subtype characterized by high genomic instability, TP53 mutations, and increased Aurora kinase signaling; these genomic alterations lead to a worse clinical prognosis. Aberrations of chromosomes 1, 8, and 16, together with PIK3CA, GATA3, AKT1, and MAP3K1 mutations drive the other subtypes. Finally, an unbiased pathway analysis revealed multiple rare, but mutually exclusive, alterations linked to loss of activity of co-repressor complexes N-Cor and SMRT. These rare alterations were the most prevalent in Luminal A tumors and may predict resistance to endocrine therapy. Our work provides for a further molecular stratification of Luminal A breast tumors, with potential direct clinical implications.
Electronic supplementary material
The online version of this article (doi:10.1007/s10549-013-2699-3) contains supplementary material, which is available to authorized users.
Keywords: Luminal A breast cancer, Breast cancer genomics
Introduction
Evidence from multiple studies converges in defining breast cancer as a collection of distinct diseases with different molecular traits, prognosis, and therapeutic options.
These diseases are mostly characterized by the status of hormone and growth factor receptors. Estrogen receptor (ER), progesterone receptor (PR), and the Her2 tyrosine kinase play a major role in determining the molecular phenotype of the tumor and dictate treatment [1–5]. In the clinic, the most frequently occurring type of breast cancer is Her2−, ER+, and/or PR+, which represents ~150,000 cases each year in the US.
RNA expression-based signatures [6, 7] provided further insights into the diversity of breast tumors. By expression profiling, the large majority of ER+ and/or PR+ tumors are of the “luminal subtypes” [7, 8]. These tumors can be subdivided into Luminal A and Luminal B, with the former being typically low grade and associated with a better prognosis [9]. Luminal A is overall the most frequently occurring breast cancer expression subtype in the population. mRNA-derived subtypes also include Basal-like breast tumors, which are predominantly negative for ER, PR, and Her2, and Her2-enriched tumors, which are positive for Her2 (Fig. 1a).
Fig. 1.
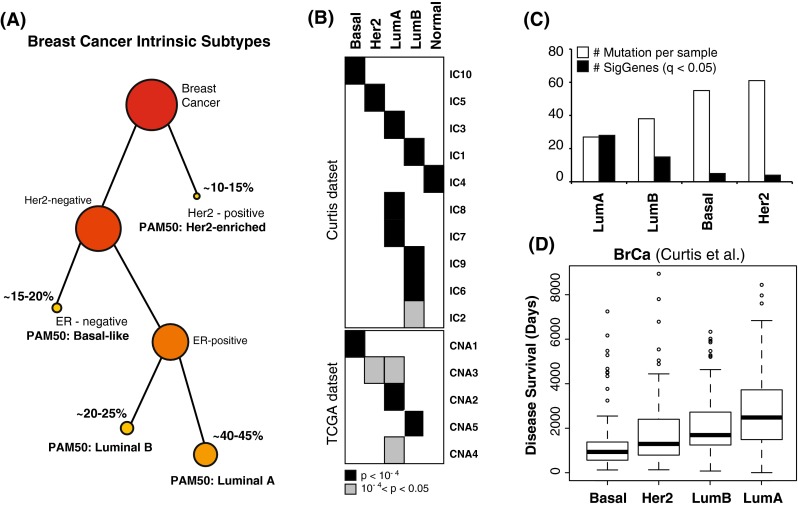
a Schematic stratification of breast cancer subtypes based on receptor status, ER and Her2, and PAM50 mRNA-derived signatures. b The table shows statistically significant intersections between the PAM50 subtypes (arranged horizontally) and copy number-driven clusters (arranged vertically) from the METABRIC and TCGA datasets. c Average number of mutations per sample (white) and number of recurrently mutated genes (black) are shown for the four major PAM50 subtypes. Luminal tumors have fewer mutations per samples, but they tend to affect similar genes. d Boxplot statistics of disease survival is shown for deceased patients from the METABRIC dataset across the four major PAM50 subtypes. While Luminal A tumors have the longest average survival, they also have the largest diversity
Recently, major genomic studies further investigated the heterogeneity of breast tumors using multiple genomic technology platforms and approaches [10–16]. The most comprehensive of these studies, from The Cancer Genome Atlas (TCGA), assayed over 800 breast tumors with six different platforms including SNP arrays for DNA copy number alterations (CNA), whole exome sequencing, mRNA expression microarrays, DNA methylation, and protein expression and phosphorylation using reverse phase protein arrays (RPPA) [10]. Collectively, these studies revealed further complexity and diversity between and within the known subtypes.
In particular, a rather heterogeneous spectrum of CNAs and somatic mutations has been observed across luminal tumors [10–12]. Luminal A and Luminal B tumors have been associated with multiple and distinct copy number-driven clusters in both the dataset from TCGA [10] and the one from METABRIC [12], indicating that different copy number changes characterize subsets of these tumors (Fig. 1b). Similarly, despite an overall low mutation rate per tumor, Luminal B and especially Luminal A tumors have the highest number of genes mutated more frequently than expected by chance as a class [10]. We confirmed this trend by integrating three different datasets (TCGA [10], Broad [16], and WashU [11]) and estimated the statistical significance of recurrence in the unified dataset (Fig. 1c; Table 1). Importantly, Luminal heterogeneity extends to tumor prognosis. Luminal A tumors, while associated with the highest median overall survival, are also characterized by the most variability in survival (Fig. 1d). Moreover, it has been shown that the risk of late mortality in this subtype persists at least over 10 years after initial diagnosis, and is higher than in the other subtypes in the long term [17].
Table 1.
Luminal A breast cancer cohorts
| Cohort | No. of samples | Data analyzed in this study | Reference |
|---|---|---|---|
| TCGA | 209 | Copy number alterations (CNA) | TCGA [10] |
| Somatic mutations | |||
| Pathway | |||
| METABRIC | 721 | CNA | Curtis et al. [12] |
| Survival | |||
| Broad | 45 | Somatic mutations | Banerji et al. [16] |
| Sanger | 79a | Somatic mutations | Nik-Zainal et al. [14, 15] |
| Wash U | 25 | Somatic mutations | Ellis et al. [11] |
| Chin | 42 | CNA | Russnes et al. [19] |
| Survival | |||
| MicMa | 9 | CNA | |
| Survival | |||
| ULL | 26 | CNA | |
| Survival |
a(ER+ tumors)
These preliminary observations point to Luminal A breast cancer as the most heterogeneous both molecularly and clinically. The diversity and incidence of this tumor call for in depth genomic studies to explain its molecular heterogeneity and link it to clinical outcome.
To this purpose, we integrated data from six different datasets to explore the genomic complexity of over 1,000 Luminal A tumors (Table 1). We used the TCGA dataset consisting of 209 Luminal A tumors as a discovery dataset (Table S1) and confirmed our findings in the other cohorts. We identified reproducible subgroups within this subtype, each of which showed distinct DNA CNA, somatic mutations, pathway alterations, and clinical outcome.
Materials and methods
Genomic data
Data from the TCGA study is accessible through the TCGA web portal at https://tcga-data.nci.nih.gov/tcga/tcgaHome2.jsp. Data from METABRIC dataset was made available upon request and is now accessible through the European Genome–phenome Archive (EGA) with the accession number EGAS00000000083. Raw and pre-processed aCGH data for the Russnes et al. combined dataset can be accessed through the Gene Expression Omnibus (GEO) repository with accession numbers: GSE8757 [18], GSE20394 [19], and GSE19425 [20]. Mutation data for the Ellis et al. and Banerji et al. dataset are available as supplemental information within the respective publications. The datasets used in this manuscript can be explored using the cBio Cancer Genomics Portal at http://www.cbioportal.org/public-portal/ [21].
Recurrent mutations in breast cancer subtypes
In this work, we account for somatic mutations reported by multiple studies [10, 11, 16]. To estimate statistical significance of recurrent mutations across multiple datasets, we integrated the full set of reported mutations from these studies and used the binomial distribution to model the somatic mutation frequencies of genes. Given N samples, to estimate if a gene had a higher somatic mutation rate (mutations per nucleotide) than expected by chance, we evaluated if a gene with K observed non-silent mutations (summed over all tumor samples: ) and a global coding sequence of length L (summed over all tumor samples: L = l * N) had more mutations than expected, i.e., the average somatic mutation rate for all genes (G) with observed somatic mutations
Thus:
From the set of p-values we estimated corresponding false discovery rates, or q-values, using the Benjamini–Hochberg procedure [22].
Copy number clustering
DNA copy number data were produced and processed for TCGA at the Broad Institute [10]. Briefly, copy number levels were inferred from Affymetrix SNP 6.0 CEL files by Birdseed and tangent normalization. Segmentation was then performed by Circular Binary Segmentation [23]. Copy number clustering was performed on normalized and segmented copy number data. A unified breakpoint profile (region by sample matrix) was derived by combining all breakpoints across all samples and determining the minimal common regions of change. Unified breakpoint profiles were computed using the R package CNTools [24] from Bioconductor [25] (http://bioc.ism.ac.jp/2.5/bioc/html/CNTools.html). Hierarchical clustering was done using the R function hclust, with manhattan distance and Ward’s agglomeration method [26].
Cluster centroids for each copy number cluster derived from the Luminal A TCGA dataset were computed by averaging cluster member features (unified breakpoints).
For each centroid we determined the most intrinsically variable breakpoints using the median absolute deviation (MAD) measure. Unified breakpoints with MAD > 0.1 were selected to define the cluster centroids. Average MAD values for this subset is threefold higher than the average of the remaining breakpoints, and twofold higher than the overall average (Fig. S1).
Samples from the METABRIC dataset have been assigned to the cluster whose centroid shows the highest correlation. Pearson correlation coefficient is a scale-independent measure and, thus, able to overcome the difficulty of comparing copy number values obtained with different platforms and on different scales. Nonetheless, we identified few samples (20 out of 594) with low correlation values with each centroids (pearson < 0.1). This subset is characterized by flat copy number spectra, such that all probes have identical values close to zero, with the exception of a few isolated probes likely to be either artifacts of the array or germline copy number variation (CNV). These flat samples have been assigned to the Copy Number Quiet subtype.
The quality of the clusters obtained with the centroids has been evaluated by different metrics: the clusters show similar proportions as those observed for the TCGA dataset (Fig. 1b), in-group proportion (IGP) values determined as in [27] are statistically significant (p < 0.001 for all clusters, Fig. 1b), and copy number pattern of alterations are remarkably similar to those observed in the TCGA dataset (Fig. S2).
Survival analysis
Survival analysis on the METABRIC dataset has been performed using the R package survival (http://cran.r-project.org/web/packages/survival/index.html) [26]. Patient follow-up has been limited to 15 years, and deaths related to other causes have been ignored in the analysis. The same analysis was performed for the Russnes et al. [19] dataset consisting of 77 Luminal A samples and combined three different cohorts: Ull cohort [19] (26 Luminal A samples), MicMa cohort [20] (9), and Chin cohort [18] (42).
Cox regression multivariate analysis was performed suing the
coxph
function from the
survival
R package. Multivariate analysis was used to assess dependencies between the classification induced by the Copy Number High (CNH) cluster and multiple covariates: tumor size, grade, stage, and age at diagnosis. This information was available for 468 Luminal A samples in the METABRIC dataset.
Subtype enrichment analysis
Given the tremendous heterogeneity displayed by Luminal A breast tumors, we analyzed the overall spectrum of genomic alterations across different subtypes looking for copy number subtype-specific patterns. Our approach relies on the general abstraction of gene alteration per sample, where each alteration belongs to one of the three categories: (a) gene is altered by mutations; (b) gene is primarily altered by CNA, and mRNA expression levels correlate with copy number changes; (c) “Wild-card” events (e.g., gene shows aberrant mRNA expression and/or methylation status independent of mutations and copy number).
These categories rely on two systematic approaches: for mutations we selectively analyzed the list of SMGs identified by the algorithm MuSiC [28], for copy number we analyzed frequently amplified and deleted region of interest (ROI) as identified by GISTIC [29]. We used the set of wide copy number gains and losses as the wild-card events. First, we selected the chromosome arms that were found to be recurrently gained or lost by GISTIC in [10]. Second, for each event we classified a sample as altered if segments accounting for at least 50 % of the whole chromosome arm length had values above (gain) or below (loss) selected thresholds. In this study, we used T = 0.15 as the absolute value for the threshold, where gains are defined by copy number level >T and losses by copy number levels <−T.
To systematically look for subtype-specific genomic events, we developed a method called Subtype-Enriched Alterations (SEA). Subtype enrichment is tested in two steps: (1) the distribution of alterations is compared to the expected distribution given in the number of samples that belong to each subtype by a goodness-of-fit test; (2) a hypergeometric p-value is derived for the subtype with the highest percentage of alterations when compared against all others. Enrichment p-values are then corrected for multiple testing [22]. Alterations in each category are tested separately and treated independently.
Differential mRNA expression analysis
To characterize the CNH subtype, beyond CNA and somatic mutations, we looked for genes differentially expressed between CNH tumors and the rest of Luminal A. We tested each gene by ANOVA, computed nominal p-values and corrected for multiple testing. High level amplification of the 8q region in the CNH group strongly influences this analysis with a high presence of genes located in this region. For this reason we used slightly less strict thresholds to select genes with nominal p-value < 0.05 and FDR-corrected q-value < 0.2.
Using this procedure we extracted two lists, one for genes that are up-regulated in CNH tumors, and one for genes that are down-regulated in the same set when compared to the other Luminal A tumors. Each list has been tested for functional enrichment using the DAVID Functional Annotation Tool [30].
Interestingly, despite a high number of genes from the highly amplified genomic region 8q21–24, only 3 out of 59 genes associated to “mitotic cell cycle” (GO: 0000278) are in this locus. Thus, mRNA up-regulation driven by this amplification does not seem to be related with mitosis regulation, spindle assembly, and chromatids segregation. We repeated the same functional enrichment test [30] after removing genes from 8q21–24, and separately for the up-regulated genes in this region to untangle potential different phenotypes associated to this copy number amplification and to other mRNA aberrations independent of it.
Up-regulated genes in CNH Luminal A that are not in the 8q21–24 region are similarly highly enriched for “mitosis cell cycle” (GO: 0000278), but also for related processes like “cell division” (GO: 0051301), “spindle” (GO: 000581), and “nuclear division” (GO: 0000280). These categories show elevated expression of both Aurora kinase A and B, as well as several genes in their pathways (e.g., PLK1, CDC25B, CCNA2, CDK1, INCENP, BIRC5, CDCA3/5/8, KIF2C). On the other hand, up-regulated genes in 8q21–24 were not found to be enriched for any functional annotation.
Mutual exclusivity analysis
All pairwise tests of mutual exclusivity were done using the switching permutation procedure described in [31]. This permutation strategy has the desirable property of preserving both number of alterations per gene and number of alterations per samples.
Mutual exclusivity modules (MEMo) were identified using the algorithm MEMo [31]. MEMo automatically identifies mutually exclusive alterations targeting frequently altered genes that are likely to belong to the same pathway. Genomic events were defined, as described in the previous section, following the “gene alteration per sample” abstraction and including focal copy number altered regions from GISTIC and recurrently mutated genes identified by MuSiC. Wild-card events included NF1 down-regulation (<1.5 standard deviations from the average) observed in 12 cases. The corresponding oncoprints for these modules are shown in Fig. S3 highlighting sample specific alterations in each module (samples are in the columns, altered genes in the rows). Module oncoprints were generated using the cBio Cancer Genomics Portal [21].
Results
The landscape of Luminal A CNA
Luminal A tumors show great heterogeneity in terms of somatic mutations and CNA [10], indicating that additional substructure may be present within this large group. Dissecting the genetics of this tumor could be fundamental to inform therapeutics and predict clinical outcome.
We first explored the spectrum of copy number changes across Luminal A tumors, to identify novel and subset-specific alterations. We performed hierarchical clustering of Affymetrix 6.0 SNP copy number data from 209 Luminal A tumors from the TCGA dataset. Segments of uniform copy number value for each patient were compared to compute the set of unified breakpoints across the whole dataset, and the so determined set of minimal segments of change were used as features for the clustering procedure. Hierarchical clustering of copy number changes across the whole genome on the TCGA dataset revealed a complex structure of recurrent patterns of alterations. Based on clustering results and recurrent CNA, we were able to identify four major characteristic patterns and a mixed group (Fig. 2a; Table S1).
Fig. 2.
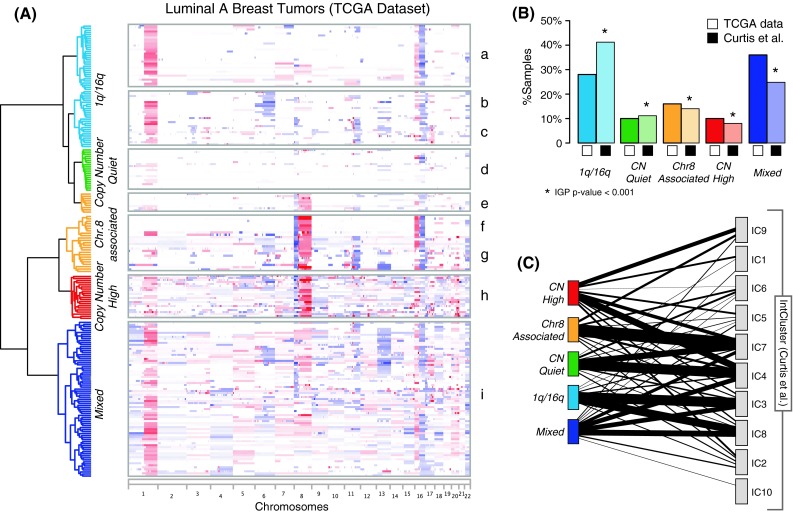
Copy number clustering of Luminal A breast tumors. a Hierarchical clustering of copy number data from 209 Luminal A tumors from the TCGA dataset reveals four distinct patterns of alterations, plus a mixed subgroup. Chromosomes are arranged from left to right, and tumors are arranged vertically and grouped according to cluster membership. Red indicates copy number gain, blue copy number losses, with color intensity proportional to absolute copy number values. b Cluster centroids were used to classify the METABRIC dataset (721 samples). Clusters in the METABRIC dataset show similar proportions to the TCGA counterparts, and the quality of the clusters is confirmed by statistically significant IGP. c Clusters determined from the METABRIC dataset are compared with the breast cancer subtypes proposed in [12]. Lines connect clusters with non-empty overlap with a thickness proportional to the extent of overlap
The first major pattern is characterized by 1q gain and 16q loss (1q/16q pattern, clusters a, b, and c). This pattern has been frequently observed in breast tumors and has been associated with the translocation der(1;16) [32, 33]. The 1q/16q pattern is dominant in cluster a, which features otherwise mostly diploid genomes. By contrast, cluster b is characterized by a broad deletion occurring on 6q, and cluster c has concurrent 11q13–14 focal amplification and 11q loss. High level amplification of the 11q13 and 11q14 loci is frequently observed in breast tumors and minimal regions of overlap target CCND1 and PAK1, respectively. Notably, these amplicons significantly co-occur with loss of the remaining part of the 11q arm across all tumors in the TCGA dataset (p = 6E−8, by one-tail-Fisher’s exact test).
Another group of Luminal A patients is characterized by a surprisingly quiet copy number spectrum (Copy Number Quiet pattern). These tumors (cluster d) have almost completely diploid genomes, with only few cases showing whole arm loss of 16q.
The third group includes clusters e, f, and g, and is strongly characterized by CNA of chromosome 8, with loss of 8p and gain of 8q (Chr8-associated pattern). Within this group, cluster f shows an interesting pattern of CNA, where 8p loss and 8q gain co-occur with 16p gain and 16q loss. These gains and losses affect the whole arms of the chromosomes, and in this group they do not co-occur with other CNAs. Cluster g, on the other hand, displays more copy number changes and is enriched for focal amplifications of 8p11.23–22 (FGFR1, ZNF703, and WSHC1L1), 8p11.21 (IKBKB), and 11q13–14 (Table S2).
The fourth group is characterized by the highest level of genomic instability among Luminal A tumors, including multiple focal CNAs (CNH pattern, cluster h). This group shows recurrent 20q gain, 5q loss, 8p loss, 8q gain, and is enriched for focal amplifications of the MYC oncogene on 8q24.21 (Table S2). Finally, the Mixed group is characterized by frequent whole-arm and whole-chromosome gains and losses, lacking the recognizable patterns seen in the other four groups (cluster i).
We validated our clusters using the 721 Luminal A samples from the METABRIC dataset [12]. We classified these tumors using centroids derived from the TCGA Luminal A dataset to identify clusters with the same alteration patterns (Fig. S2; Table S3). The clusters obtained from the METABRIC dataset occurred in similar proportions as the TCGA clusters and their quality was confirmed by the IGP [27] measure (Fig. 2b). Interestingly, the CN-Quiet and Chr.8-associated clusters show strong correspondences with two of the Luminal-enriched clusters from METABRIC and colleagues (IC4 and IC7, respectively), whereas components of the Mixed and CN-High groups are spread across multiple clusters (Fig. 2c).
The landscape of Luminal A somatic mutations
Distinct copy number patterns frequently come in tandem with equally variable landscapes of somatic mutations. Indeed, despite the lowest mutation rate among breast cancer subtypes, the Luminal A subtype shows the largest number of genes mutated with statistically significant recurrence (Fig. 3a; Table 2).
Fig. 3.
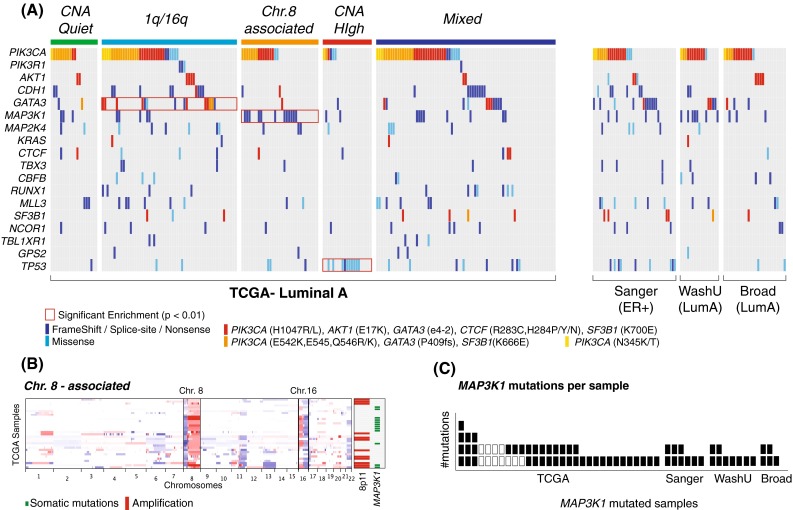
Landscape of Luminal A somatic mutations. a An unbiased enrichment analysis shows that PIK3CA mutations are significantly enriched in the 1q/16q subgroup, MAP3K1 mutations in the Chr8-associated, and TP53 mutations in the CNH subtgroup. All recurrent Luminal A mutations are displayed (one mutated gene per row). Mutations are color coded based on type (dark blue frame-shift, splice-site, and nonsense/light blue missense) and recurrent hotspots (red). All TCGA tumors, grouped by copy-number subtype, are shown in columns, together with mutated cases from the Sanger [13], WashU [11], and Broad [16] datasets. b MAP3K1 mutations are strongly associated with a subset of the Chr8-associated cluster characterized by 8p−/8q+/16p+/16q−. The heatmap shows copy number profiles for all the Chr.8-associated samples (arranged vertically). The panel on the right shows that high level amplification in 8p11 and mutations at MAP3K1 are largely mutually exclusive and characterize distinct subgroups of tumors in this Luminal A subtype. c Most patients affected by MAP3K1 mutations have more than one mutation, suggesting bi-allelic inactivation. The plot shows all samples with at least one MAP3K1 mutation (X axis), and the actual number of MAP3K1 mutations for each sample (Y axis)
Table 2.
| Subtype | No. of non-silent mutations per sample (avg) | No. of recurrently mutated (RM) genes | RM genes: FDR < 0.05 |
|---|---|---|---|
| Luminal A | 27 | 28 | PIK3CA, MAP3K1, GATA3, TP53, CDH1, MLL3, MAP2K4, NCOR1, AKT1, PTEN, RUNX1, CTCF, CBFB, SF3B1, MED23, WNT7A, TBL1XR1, TBX3, GPS2, FOXA1, DGKG, SMCHD1, KRAS, CCND3, NKAIN4, HIST2H2BE, HIST1H3B, SHD, GPR32 |
| Luminal B | 38 | 15 | PIK3CA, TP53, GATA3, CDH1, MAP3K1, RUNX1, PTEN |
| OR2L2, TBX3, MAP2K4, AKT1, KCNB2, RB1, PRRX1, HIST1H3B | |||
| Basal-like | 55 | 5 | TP53, PIK3CA, PNPLA3, C11orf85, HLF |
| Her2-enriched | 61 | 4 | TP53, PIK3CA, SRPR, PIK3R1 |
The most frequently mutated genes (>10 %) are PIK3CA, GATA3, MAP3K1, and TP53. Interestingly, all show significant associations with recurrent copy number patterns. PIK3CA and GATA3 mutations are mostly found in tumors with low CNA (CN-Quiet and 1q/16q), and in particular GATA3 mutations are enriched for the 1q/16q subgroup (pGATA3 = 0.009). Notably, 9 out of 15 hotspot mutations for GATA3 are in this subgroup. MAP3K1 mutations are enriched in the Chr.8-associated subgroup (pMAP3K1 = 4.22E−04). MAP3K1 mutations strongly co-occur with the 8p−/8q+/16p+/16q− pattern observed in cluster f (pMAP3K1(f) = 1.9E−5), and thus, are largely mutually exclusive with focal amplification of 8p11.23–21 (Fig. 3b). All MAP3K1-mutated cases harbor at least one inactivating mutation, indicating loss of function, and most of them have at least two mutations, suggesting bi-allelic inactivation (Fig. 3c). Finally, the CNH subgroup shows an overall depletion for all recurrent Luminal A mutations, except for a strong presence of TP53 mutations (pTP53 = 9.35E−6).
Luminal A tumors show also an interesting presence of hotspot mutations beyond PIK3CA and GATA3. AKT1 E17K activating mutations were observed in 3 out of 4 datasets and predominantly in Luminal A tumors (14 out of 20). Interestingly these mutations are perfectly mutually exclusive with those targeting PIK3CA. Additional hotspot mutations include those targeting KRAS (G12V/D), splicing factor SF3B1 (K666E, K700E), and c-Myc transcriptional repressor CTCF (R283C, H284P/Y/N).
Associations with clinical outcome reveal high-risk Luminal A subtype
The characterization of Luminal A tumors provided so far clearly identifies distinct subgroups within this tumor subtype, whose clinical relevance needs to be addressed now. The large dataset analyzed by Curtis et al. [12] has extensive clinical follow-up, enabling a reliable survival analysis. Kaplan–Meier analysis showed significantly different disease survival within the Luminal A subgroups (log-rank p = 0.015, Fig. S4). In particular, the CNH subgroup had significantly worse outcome (log-rank p = 4.6E−5, Fig. 4a) despite receiving similar treatments (Table S3). We validated the poor prognosis for the CNH tumors in an independent dataset consisting of 77 Luminal A tumors from three different cohorts [19] (log-rank p = 0.003, Fig. 4b; Table S4).
Fig. 4.
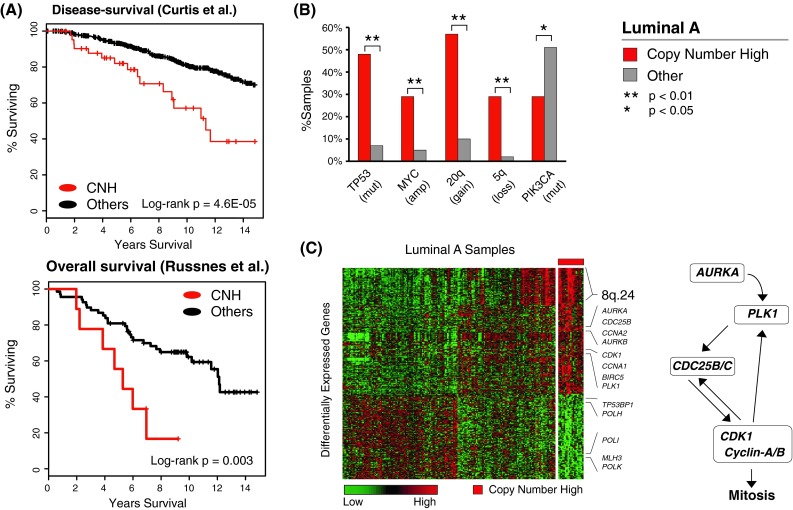
CNH tumors. a Survival analysis across two independent datasets shows significantly worse outcome for the CNH Luminal A tumors. b Unbiased enrichment analysis of genomic alterations found CNH tumors to be enriched for TP53 mutations, focal amplification of MYC, 5q loss, 20q gain, and depleted for PIK3CA mutations. c Differential expression analysis shows that significantly up-regulated genes in CNH tumors are enriched for regulators of mitosis and Aurora kinase pathway components. The heatmap shows all genes that are differentially expressed in CNH tumors when compared to other Luminal A samples (red indicates high expression, green low expression). Aurora kinase is a mitotic serine/threonine kinase that phosphorylates multiple proteins including PLK1 and Cdc25; it is required for CDK1 activation and regulates mitotic events
To assess dependencies between the CNH classification and other clinical covariates, we used Cox multivariate regression. We tested for dependencies for tumor grade, stage, size, and age at diagnosis. We found independent statistically significant association with outcome for tumor size (p = 6E−05), age at diagnosis (p = 0.004), and CNH classification (p = 0.01); no association was found between these covariates. The overall log-rank p-value for the combined covariates is p = 2E−08. The CNH classification showed, therefore, independent prognostic value (Table S5).
Finally, we compared scores derived from research-based versions of Oncotype DX [1], Mammaprint [34], and PAM50 Risk of Recurrence (ROR-S) [8] across Luminal A subgroups. We found that the CNH subgroup is consistently associated with a higher risk than the other Luminal A subgroups (Fig. S5), confirming the prediction of a worse prognosis.
As shown above, the CNH tumors are (1) characterized by high genomic instability, (2) depleted for typical Luminal A mutations (e.g., PIK3CA, 29 vs. 51 %, pPIK3CA = 0.04), (3) highly enriched for TP53 mutations (48 vs. 7 % on average in the other Luminal A samples), and (4) tend to have MYC focal amplification, 20q gain and 5q loss (Fig. 4c). Interestingly, genes that are significantly over-expressed in CNH tumors compared to the rest of Luminal A cases are enriched for regulators of mitosis including Aurora kinases A and B, PLK1, Cyclin-A, Cyclin-E, CDK1, and Cdc25 (Fig. 4d; Table S6). A similar set of genes was previously found to be associated with 5q loss in Basal-like breast cancers [12]. Most of these genes have also been identified as “proliferation marker” genes [35]. The observed clinical outcome for CNH tumors, confirmed in two independent datasets, is therefore strongly associated to high genomic instability and proliferation as revealed by their molecular features.
Integrated pathway analysis reveals mechanisms of resistance to endocrine therapy
The great diversity of genomic lesions observed in Luminal A tumors maps to different cellular processes. To explore the role of these alterations in a pathway context, we used the MEMo algorithm [31], which identifies micro-pathways or modules whose components are frequently altered in a mutually exclusive manner. Statistically significant mutual exclusivity between recurrent alterations strengthens the hypothesis of functional relatedness and, more importantly, may reflect either functional redundancy, highlighting multiple ways to de-regulate the same pathway, or synthetic lethal interactions [31].
Modules extracted by MEMo in a Luminal A-only analysis highlight frequent alteration to the PI(3)K/Akt, MAP-kinase, and Ras/ERK signaling cascades (Figs. 5a, S3; Table S7). Alterations include PTEN inactivation, mutations of PIK3CA and AKT1, inactivation of MAP3K1 and MAP2K4, amplification of receptor tyrosine kinases (ERBB2 and IGF1R), and RAS activation either through activating mutations of KRAS or NF1 depletion by either DNA homozygous deletion or mRNA down-regulation (Fig. S6). Mutually exclusive inactivation of MAP3K1 and MAP2K4 was confirmed in the Ellis et al. [11] dataset, corroborating the hypothesis of reduced JNK signaling in Luminal A tumors and providing further insights into MAP3K1 mutations.
Fig. 5.
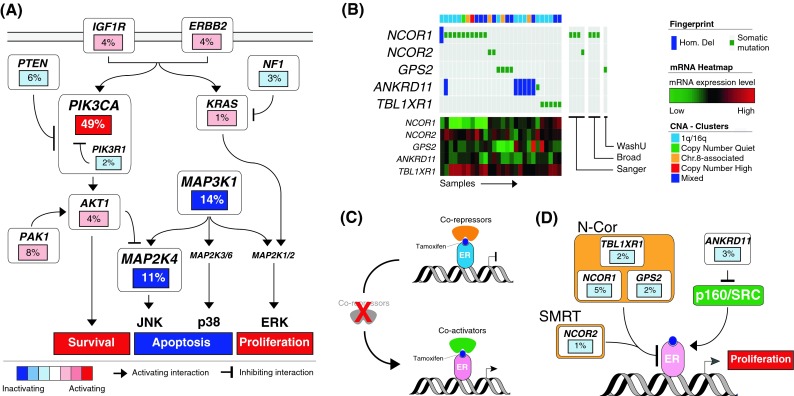
Pathway analysis. Altered pathways across Luminal A tumors identified by the MEMo algorithm. a MEMo identified multiple modules recapitulating Akt, MAPK, and Ras signaling. Gene activation is shown in shades of red, inactivation in shades of blue. b MEMo found network modules highlighting multiple alterations of nuclear co-repressors. Genes are arranged vertically, and altered tumors from left to right. c Nuclear co-repressors and co-activators regulate ER transcription and Tamoxifen anti-proliferative effects. d Alterations identified by MEMo compromise co-repressor activities and may predict response to therapy
MEMo also identified a set of less frequent alterations targeting the N-Cor and SMRT complexes (Fig. 5b). While not statistically significant due to the small number of altered samples (28 out of 209 in total), alterations in these modules are almost completely mutually exclusive. Alterations include recurrent mutations targeting core components of the nuclear co-repressor complex (NCOR1, TBL1XR1, and GPS2) and the nuclear co-repressor 2 (NCOR2) or SMRT. Most of these mutations are either frame-shift or nonsense and thereby likely inactivating, they correlate with low mRNA expression, and frequently co-occur with hemizygous loss of the target gene. The modules also include homozygous deletions of ANKRD11, consistent with its ability to inhibit p160 steroid receptor co-activator recruitment [36, 37].
Co-repressor and co-activator complexes play a major role in regulating ER-α transcription and the inhibitory activity of Tamoxifen. Tamoxifen-bound ER has an increased affinity to co-repressors and specifically to N-Cor/SMRT. These co-repressors are required for the anti-proliferative effects of Tamoxifen (Fig. 4c). Repressing the NCor and SMRT complexes in human breast cancer cell lines turns Tamoxifen into an agonist of cell proliferation [38, 39], and lower or absent mRNA expression of NCor in patients correlates with shorter relapse [40, 41]. Here, for the first time, we identify distinct molecular mechanisms of inactivation of these complexes in patients. We directly link multiple genomic alterations, occurring in 13 % of the patients, to loss of co-repressors activity (Fig. 4d). These alterations may predict resistance to endocrine therapy.
Discussion
Recently, multiple studies of human breast cancer provided novel insights into the biology of this cancer and its intrinsic subtypes [7], as well as an unprecedented amount of genomic information still not completely explored and understood. This information is fundamental to inform patient treatments with targeted agents [42, 43]. Our work aimed at complementing recent breast cancer genomic studies, with an in-depth analysis of the most diverse breast cancer subtype: Luminal A. We dissected the genomics of Luminal A tumors in multiple datasets and have explained more of its molecular and clinical heterogeneity.
We identified four major subgroups of Luminal A tumors that are characterized by distinct patterns of CNA, somatic mutations, and clinical outcomes (Table 3). These include a subgroup (i.e., CNH) presenting molecular features atypical of Luminal tumors and associated with worse prognosis. Poor clinical outcome was confirmed in multiple datasets and is independent of other markers, such as tumor size, grade, stage, and age of diagnosis. Interestingly, the CNH distinction was also associated with higher scores coming from current clinical assays for breast cancer prognosis/prediction (Oncotype DX, Mammaprint, PAM50 ROR-S), thus providing a molecular explanation for these gene expression risk assays. This subtype shows a high level of CNA, recurrent TP53 mutations, and over-expression of mitotic regulators including Aurora kinases A and B (Table 3). Over-expression of these genes has been associated with high genomic instability and tumorigenesis [44, 45] and, more importantly, Aurora kinases are targets of specific inhibitors currently in clinical trials [46].
Table 3.
Genomic features of Luminal A Copy Number Subtypes
| Focal CNA | Whole-arm events | Somatic mutations | |
|---|---|---|---|
| 1q/16q | 16q23-24 HomDel (ANKRD11) | 1q gain, 16q loss | PIK3CA, PIK3R1, GATA3, AKT1, KRAS |
| Copy Number Quiet | None | None | PIK3CA, AKT1 |
| Chr8-associated | 8p11.23-22 Amp (ZNF703, WHSC1L1, FGFR1) | 8p loss, 8q gain, 16p gain, 16q loss | MAP3K1 |
| 8p11.21 Amp (IKBKB) | |||
| Copy Number High | 8p24.21 Amp (MYC) | 8q gain, 5q loss, 20q gain | TP53 |
| 20q13.2 Amp (AURKA, ZNF217) |
Integrated analysis of CNA and mutations showed a significant prevalence of GATA3 and PIK3CA hotspot mutations in tumors characterized by 1q gain and 16q loss; thus, the tumors with the fewest copy number changes showed not only associations with mutations within specific genes, but associations with distinct types of mutations within these genes. These results suggest that one type of mutation within GATA3 (i.e., intron 4 CA deletion) is strongly associated Luminal A 1q/16q cancers, while other mutations (exon 5 frameshifts) cause Luminal B cancers; thus, these mutations are likely to be cancer driving events, and early events within the evolution of these tumors.
Mutations within the PI3K pathway became of particular clinical interest with the advent of many specific PIK3CA inhibitors now in clinical trials [42, 47]. Of particular interest will be if the different pathway mutation types (PIK3CA mutation vs. PTEN mutation vs. AKT1 mutation) are all biomarkers of PIK3CA inhibitor sensitivity, and how these might interact with the different inhibitors, many of which have differing affinities for the PI(K) family of kinases. Lastly, multiple inactivating mutations in MAP3K1 were found in tumors with whole-arm events on chromosome 8 and 16. Alterations of these genes point to deregulated AKT and MAPK signaling, and this was confirmed by an unbiased pathways analysis. In particular, MAP3K1 and its direct target MAP2K4 negatively regulate JNK-mediated cell death, possibly compromising response to chemotherapeutic agents [48]; thus, a pressing clinical question is do mutations in MAP3K1 and/or MAP2K4 predict for lower response rates to chemotherapy and endocrine therapy, which can be addressed retrospectively if mutation detection can be performed using FFPE materials from existing clinical trial archives.
Our analysis of deregulation of cellular pathways in Luminal A tumors also revealed inactivation of the ER co-repressors N-Cor/SMRT. We identified multiple rare, but mutually exclusive, alterations targeting components of these complexes, as well as ANKRD11, an inhibitor of p160 co-activator complexes. Nuclear co-repressors regulate ER transcriptional activity and are required for the anti-proliferative effects of Tamoxifen [40, 41]. Alterations of these complexes may, therefore, promote ER-driven proliferation in the presence of Tamoxifen, and predict a lack of response to endocrine therapy. These alterations were observed almost exclusively in Luminal A tumors. Indeed, the same unbiased pathway analysis performed on the whole TCGA breast cancer dataset was unable to highlight them [10].
Our work integrated multiple genomic and genetic data types within the Luminal A breast cancer subtype and spanned multiple data sets. Our results have shed new light on the intrinsic heterogeneity within this subtype and strengthen the importance of genomic studies within tumor subpopulations. These in-depth analyses already show intrinsic heterogeneity in other breast cancer subtypes. Her-2 positive tumors have been shown to be composed of two main groups defined by different ER and EGFR status [10], and recently Her-2 mutations have been shown to be activating and tumorigenic [49] in tumors without DNA amplification of the Her-2 locus. Moreover, these mutations are prominent in relapsed invasive lobular breast cancer [50]. Similarly, basal-like and triple negative breast cancers have been object of extensive investigations due their aggressive nature [51–53]. We can now add Luminal A disease to the list of heterogeneous diseases with distinct subtypes within this previously defined single subtype. The wealth of genomic data available today enables these in-depth analyses of selected tumor subgroups and highlights the need for comprehensive genomic characterization of tumor samples to inform clinical trials and therapeutic choices.
Electronic supplementary material
Below is the link to the electronic supplementary material.
Acknowledgments
We wish to acknowledge Tari King, Sarat Chandarlapaty, and Elisa Oricchio for helpful discussions and critical reading of the manuscript. This work was funded by the National Cancer Institute Cancer Genome Atlas Grant U24-CA143840 and U24-CA143848, the National Resource for Network Biology Grant P41 GM103504, and the SU2C-AACR-DT0209 Dream Team Translational Research Grant. This work was also supported by funds from the NCI Breast SPORE program (P50-CA58223-09A1), and the Breast Cancer Research Foundation.
Conflict of interest
C.M. Perou serves as a board member and has an ownership interest (including patents) in University Genomics and Bioclassifier LLC.
Footnotes
The corresponding email address reaches GC, CP, CS, and NS
References
- 1.Paik S, et al. A multigene assay to predict recurrence of tamoxifen-treated, node-negative breast cancer. N Engl J Med. 2004;351(27):2817–2826. doi: 10.1056/NEJMoa041588. [DOI] [PubMed] [Google Scholar]
- 2.Paik S, et al. Gene expression and benefit of chemotherapy in women with node-negative, estrogen receptor-positive breast cancer. J Clin Oncol. 2006;24(23):3726–3734. doi: 10.1200/JCO.2005.04.7985. [DOI] [PubMed] [Google Scholar]
- 3.Romond EH, et al. Trastuzumab plus adjuvant chemotherapy for operable HER2-positive breast cancer. N Engl J Med. 2005;353(16):1673–1684. doi: 10.1056/NEJMoa052122. [DOI] [PubMed] [Google Scholar]
- 4.Slamon DJ, Romond EH, Perez EA (2006) Advances in adjuvant therapy for breast cancer. Clin Adv Hematol Oncol 4(3 Suppl 7): suppl 1, 4–9; discussion suppl 10; quiz 2 p following suppl 10 [PubMed]
- 5.Perez EA, et al. Four-year follow-up of trastuzumab plus adjuvant chemotherapy for operable human epidermal growth factor receptor 2-positive breast cancer: joint analysis of data from NCCTG N9831 and NSABP B-31. J Clin Oncol. 2011;29(25):3366–3373. doi: 10.1200/JCO.2011.35.0868. [DOI] [PMC free article] [PubMed] [Google Scholar]
- 6.Sorlie T, et al. Gene expression patterns of breast carcinomas distinguish tumor subclasses with clinical implications. Proc Natl Acad Sci USA. 2001;98(19):10869–10874. doi: 10.1073/pnas.191367098. [DOI] [PMC free article] [PubMed] [Google Scholar]
- 7.Perou CM, et al. Molecular portraits of human breast tumours. Nature. 2000;406(6797):747–752. doi: 10.1038/35021093. [DOI] [PubMed] [Google Scholar]
- 8.Parker JS, et al. Supervised risk predictor of breast cancer based on intrinsic subtypes. J Clin Oncol. 2009;27(8):1160–1167. doi: 10.1200/JCO.2008.18.1370. [DOI] [PMC free article] [PubMed] [Google Scholar]
- 9.Fan C, et al. Concordance among gene-expression-based predictors for breast cancer. N Engl J Med. 2006;355(6):560–569. doi: 10.1056/NEJMoa052933. [DOI] [PubMed] [Google Scholar]
- 10.TCGA Comprehensive molecular portraits of human breast tumors. Nature. 2012;490:61–70. doi: 10.1038/nature11412. [DOI] [PMC free article] [PubMed] [Google Scholar]
- 11.Ellis MJ, et al. Whole-genome analysis informs breast cancer response to aromatase inhibition. Nature. 2012;486(7403):353–360. doi: 10.1038/nature11143. [DOI] [PMC free article] [PubMed] [Google Scholar]
- 12.Curtis C, et al. The genomic and transcriptomic architecture of 2,000 breast tumours reveals novel subgroups. Nature. 2012;486(7403):346–352. doi: 10.1038/nature10983. [DOI] [PMC free article] [PubMed] [Google Scholar]
- 13.Stephens PJ, et al. The landscape of cancer genes and mutational processes in breast cancer. Nature. 2012;486(7403):400–404. doi: 10.1038/nature11017. [DOI] [PMC free article] [PubMed] [Google Scholar]
- 14.Nik-Zainal S, et al. The life history of 21 breast cancers. Cell. 2012;149(5):994–1007. doi: 10.1016/j.cell.2012.04.023. [DOI] [PMC free article] [PubMed] [Google Scholar]
- 15.Nik-Zainal S, et al. Mutational processes molding the genomes of 21 breast cancers. Cell. 2012;149(5):979–993. doi: 10.1016/j.cell.2012.04.024. [DOI] [PMC free article] [PubMed] [Google Scholar]
- 16.Banerji S, et al. Sequence analysis of mutations and translocations across breast cancer subtypes. Nature. 2012;486(7403):405–409. doi: 10.1038/nature11154. [DOI] [PMC free article] [PubMed] [Google Scholar]
- 17.Haque R, et al. Impact of breast cancer subtypes and treatment on survival: an analysis spanning two decades. Cancer Epidemiol Biomarkers Prev. 2012;21(10):1848–1855. doi: 10.1158/1055-9965.EPI-12-0474. [DOI] [PMC free article] [PubMed] [Google Scholar]
- 18.Chin K, et al. Genomic and transcriptional aberrations linked to breast cancer pathophysiologies. Cancer Cell. 2006;10(6):529–541. doi: 10.1016/j.ccr.2006.10.009. [DOI] [PubMed] [Google Scholar]
- 19.Russnes HG, et al. Genomic architecture characterizes tumor progression paths and fate in breast cancer patients. Sci Transl Med. 2010;2(38):38ra47. doi: 10.1126/scitranslmed.3000611. [DOI] [PMC free article] [PubMed] [Google Scholar]
- 20.Hicks J, et al. Novel patterns of genome rearrangement and their association with survival in breast cancer. Genome Res. 2006;16(12):1465–1479. doi: 10.1101/gr.5460106. [DOI] [PMC free article] [PubMed] [Google Scholar]
- 21.Cerami E, et al. The cBio cancer genomics portal: an open platform for exploring multidimensional cancer genomics data. Cancer Discov. 2012;2(5):401–404. doi: 10.1158/2159-8290.CD-12-0095. [DOI] [PMC free article] [PubMed] [Google Scholar]
- 22.Benjamini Y, Hochberg Y. Controlling the false discovery rate—a practical and powerful approach to multiple testing. J R Stat Soc Ser B. 1995;57(1):289–300. [Google Scholar]
- 23.Olshen AB, et al. Circular binary segmentation for the analysis of array-based DNA copy number data. Biostatistics. 2004;5(4):557–572. doi: 10.1093/biostatistics/kxh008. [DOI] [PubMed] [Google Scholar]
- 24.Zhang J, CNTools: Convert segment data into a region by sample matrix to allow for other high level computational analyses. R package (Version 1.6.0.)
- 25.Gentleman RC, et al. Bioconductor: open software development for computational biology and bioinformatics. Genome Biol. 2004;5(10):R80. doi: 10.1186/gb-2004-5-10-r80. [DOI] [PMC free article] [PubMed] [Google Scholar]
- 26.R-Development-Core-Team (2010) R: a language and environment for statistical computing. R Foundation for Statistical Computing, Vienna
- 27.Kapp AV, Tibshirani R. Are clusters found in one dataset present in another dataset? Biostatistics. 2007;8(1):9–31. doi: 10.1093/biostatistics/kxj029. [DOI] [PubMed] [Google Scholar]
- 28.Dees ND, et al. MuSiC: identifying mutational significance in cancer genomes. Genome Res. 2012;22:1589–1598. doi: 10.1101/gr.134635.111. [DOI] [PMC free article] [PubMed] [Google Scholar]
- 29.Beroukhim R, et al. Assessing the significance of chromosomal aberrations in cancer: methodology and application to glioma. Proc Natl Acad Sci USA. 2007;104(50):20007–20012. doi: 10.1073/pnas.0710052104. [DOI] [PMC free article] [PubMed] [Google Scholar]
- 30.Dennis G, et al. DAVID: database for annotation, visualization, and integrated discovery. Genome Biol. 2003;4(5):P3. doi: 10.1186/gb-2003-4-5-p3. [DOI] [PubMed] [Google Scholar]
- 31.Ciriello G, et al. Mutual exclusivity analysis identifies oncogenic network modules. Genome Res. 2012;22(2):398–406. doi: 10.1101/gr.125567.111. [DOI] [PMC free article] [PubMed] [Google Scholar]
- 32.Flagiello D, et al. Highly recurrent der(1;16)(q10;p10) and other 16q arm alterations in lobular breast cancer. Genes Chromosomes Cancer. 1998;23(4):300–306. doi: 10.1002/(SICI)1098-2264(199812)23:4<300::AID-GCC4>3.0.CO;2-N. [DOI] [PubMed] [Google Scholar]
- 33.Tsuda H, et al. der(16)t(1;16)/der(1;16) in breast cancer detected by fluorescence in situ hybridization is an indicator of better patient prognosis. Genes Chromosomes Cancer. 1999;24(1):72–77. doi: 10.1002/(SICI)1098-2264(199901)24:1<72::AID-GCC10>3.0.CO;2-M. [DOI] [PubMed] [Google Scholar]
- 34.van de Vijver MJ, et al. A gene-expression signature as a predictor of survival in breast cancer. N Engl J Med. 2002;347(25):1999–2009. doi: 10.1056/NEJMoa021967. [DOI] [PubMed] [Google Scholar]
- 35.Whitfield ML, et al. Common markers of proliferation. Nat Rev Cancer. 2006;6(2):99–106. doi: 10.1038/nrc1802. [DOI] [PubMed] [Google Scholar]
- 36.Zhang A, et al. Identification of a novel family of ankyrin repeats containing cofactors for p160 nuclear receptor coactivators. J Biol Chem. 2004;279(32):33799–33805. doi: 10.1074/jbc.M403997200. [DOI] [PubMed] [Google Scholar]
- 37.Zhang A, Li CW, Chen JD. Characterization of transcriptional regulatory domains of ankyrin repeat cofactor-1. Biochem Biophys Res Commun. 2007;358(4):1034–1040. doi: 10.1016/j.bbrc.2007.05.017. [DOI] [PMC free article] [PubMed] [Google Scholar]
- 38.Keeton EK, Brown M. Cell cycle progression stimulated by tamoxifen-bound estrogen receptor-alpha and promoter-specific effects in breast cancer cells deficient in N-CoR and SMRT. Mol Endocrinol. 2005;19(6):1543–1554. doi: 10.1210/me.2004-0395. [DOI] [PubMed] [Google Scholar]
- 39.Cutrupi S, et al. Targeting of the adaptor protein Tab 2 as a novel approach to revert tamoxifen resistance in breast cancer cells. Oncogene. 2012;31:4353–4361. doi: 10.1038/onc.2011.627. [DOI] [PubMed] [Google Scholar]
- 40.Girault I, et al. Expression analysis of estrogen receptor alpha coregulators in breast carcinoma: evidence that NCOR1 expression is predictive of the response to tamoxifen. Clin Cancer Res. 2003;9(4):1259–1266. [PubMed] [Google Scholar]
- 41.Green AR, et al. The prognostic significance of steroid receptor co-regulators in breast cancer: co-repressor NCOR2/SMRT is an independent indicator of poor outcome. Breast Cancer Res Treat. 2008;110(3):427–437. doi: 10.1007/s10549-007-9737-y. [DOI] [PubMed] [Google Scholar]
- 42.Ellis MJ, Perou CM. The genomic landscape of breast cancer as a therapeutic roadmap. Cancer Discov. 2013;3(1):27–34. doi: 10.1158/2159-8290.CD-12-0462. [DOI] [PMC free article] [PubMed] [Google Scholar]
- 43.Zardavas D, Baselga J, Piccart M. Emerging targeted agents in metastatic breast cancer. Nat Rev Clin Oncol. 2013;10(4):191–210. doi: 10.1038/nrclinonc.2013.29. [DOI] [PubMed] [Google Scholar]
- 44.Gautschi O, et al. Aurora kinases as anticancer drug targets. Clin Cancer Res. 2008;14(6):1639–1648. doi: 10.1158/1078-0432.CCR-07-2179. [DOI] [PubMed] [Google Scholar]
- 45.Nishida N, et al. High copy amplification of the Aurora-A gene is associated with chromosomal instability phenotype in human colorectal cancers. Cancer Biol Ther. 2007;6(4):525–533. doi: 10.4161/cbt.6.4.3817. [DOI] [PubMed] [Google Scholar]
- 46.Dar AA, et al. Aurora kinase inhibitors—rising stars in cancer therapeutics? Mol Cancer Ther. 2010;9(2):268–278. doi: 10.1158/1535-7163.MCT-09-0765. [DOI] [PMC free article] [PubMed] [Google Scholar]
- 47.Juric D, Baselga J. Tumor genetic testing for patient selection in phase I clinical trials: the case of PI3K inhibitors. J Clin Oncol. 2012;30(8):765–766. doi: 10.1200/JCO.2011.39.6390. [DOI] [PubMed] [Google Scholar]
- 48.Small GW, et al. Mitogen-activated protein kinase phosphatase-1 is a mediator of breast cancer chemoresistance. Cancer Res. 2007;67(9):4459–4466. doi: 10.1158/0008-5472.CAN-06-2644. [DOI] [PubMed] [Google Scholar]
- 49.Bose R, et al. Activating HER2 mutations in HER2 gene amplification negative breast cancer. Cancer Discov. 2013;3(2):224–237. doi: 10.1158/2159-8290.CD-12-0349. [DOI] [PMC free article] [PubMed] [Google Scholar]
- 50.Ross JS, et al. Relapsed classic E-cadherin (CDH1) mutated invasive lobular breast cancer demonstrates a high frequency of HER2 (ERBB2) gene mutations. Clin Cancer Res. 2013;19:2668–2676. doi: 10.1158/1078-0432.CCR-13-0295. [DOI] [PubMed] [Google Scholar]
- 51.Prat A, et al. Molecular characterization of basal-like and non-basal-like triple-negative breast cancer. Oncologist. 2013;18(2):123–133. doi: 10.1634/theoncologist.2012-0397. [DOI] [PMC free article] [PubMed] [Google Scholar]
- 52.O’Toole SA, et al. Therapeutic targets in triple negative breast cancer. J Clin Pathol. 2013;66:530–542. doi: 10.1136/jclinpath-2012-201361. [DOI] [PubMed] [Google Scholar]
- 53.Pacheco JM, et al. Racial differences in outcomes of triple-negative breast cancer. Breast Cancer Res Treat. 2013;138(1):281–289. doi: 10.1007/s10549-012-2397-6. [DOI] [PMC free article] [PubMed] [Google Scholar]
Associated Data
This section collects any data citations, data availability statements, or supplementary materials included in this article.