

Abstract
Coarse-grained (CG) simulation methods are now widely used to model the structure and dynamics of large biomolecular systems. One important issue for using such methods – especially with regard to using them to model, for example, intracellular environments – is to demonstrate that they can reproduce experimental data on the thermodynamics of protein-protein interactions in aqueous solutions. To examine this issue, we describe here simulations performed using the popular coarse-grained MARTINI force field, aimed at computing the thermodynamics of lysozyme and chymotrypsinogen self-interactions in aqueous solution. Using molecular dynamics simulations to compute potentials of mean force between a pair of protein molecules, we show that the original parameterization of the MARTINI force field is likely to significantly overestimate the strength of protein-protein interactions to the extent that the computed osmotic second virial coefficients are orders of magnitude more negative than experimental estimates. We then show that a simple down-scaling of the van der Waals parameters that describe the interactions between protein pseudo-atoms can bring the simulated thermodynamics into much closer agreement with experiment. Overall, the work shows that it is feasible to test explicit-solvent CG force fields directly against thermodynamic data for proteins in aqueous solutions, and highlights the potential usefulness of osmotic second virial coefficient measurements for fully parameterizing such force fields.
Introduction
The often extreme computational expense associated with performing molecular dynamics (MD) simulations of biomolecular systems at full atomic resolution has in recent years spurred the development of a number of simplified, ‘coarse-grained’ (CG) simulation models (for reviews, see refs. 1–4). The advantages of using structurally simplified models are at least three-fold: first, reducing the number of particles in a given simulation system reduces the number of nonbonded interactions that need to be computed, and so reduces the computer time required to perform each simulation step; second, with softer force constants used for the pseudo-bond stretch and angle terms, timesteps can be much longer than those used in conventional all-atom MD simulations; third, since the solution viscosity in CG models is often artificially low – or can be made so – the timescales over which conformational transitions occur can be abbreviated. These features mean that it is often possible to observe or sample phenomena in simulations that use CG models that cannot be achieved by corresponding atomically detailed simulations.5
One application for which CG models might prove to be especially valuable is in modeling the highly crowded interiors of biological cells. Simulating such systems in a meaningful way requires the inclusion of very large numbers of macromolecules which, if simulations on a microsecond timescale are to be performed, currently rules out the use of explicit-solvent all-atom MD simulations. To mitigate the unavoidable expense involved with the calculations, previous efforts to model the bacterial cytoplasm, for example, have treated macromolecules as rigid bodies and have used implicit-solvent representations of the solution environment;6–9 only one of these studies has thus far considered in detail the use of atomically detailed models of macromolecules.8 Such simulations have proven useful for exploring the effects of steric,7 energetic8 and hydrodynamic9 interactions on macromolecular diffusion and for determining the relative roles of crowding effects and energetic interactions on the thermodynamics of protein folding and associations.8 But treating all macromolecules as rigid bodies in the simulations rules out modeling the dynamics of highly flexible macromolecules such as mRNAs and intrinsically disordered proteins, and treating the solvent implicitly (i.e. by omitting solvent molecules) means that special, expensive steps must be taken to incorporate the hydrodynamic interactions that play a major role in slowing rates of diffusion in vivo.9
Given these two drawbacks, it is worth considering whether explicit-solvent CG models might be the next step on the way to developing fully atomic models of intracellular environments. In particular, explicit-solvent CG models developed specifically for conformationally flexible biomolecules could allow interesting questions about the internal dynamics of macromolecules in crowded conditions to be asked and, by modeling the solvent explicitly, should, at least in principle, provide a much more straightforward way to include the effects of hydrodynamic interactions. But if such models are to be used for problems as ambitious as modeling the cytoplasm, it is important to determine first whether they can accurately reproduce experimental data on the thermodynamics of macromolecular interactions in aqueous solution, and, if not, whether it is practical to consider systematically parameterizing them so that they do. It is with this question that the present manuscript is concerned. Specifically, we focus on using a popular explicit-solvent CG model to compute the osmotic second virial coefficient, B22, of two well studied model proteins in aqueous solution: hen egg-white lysozyme (referred to simply as ‘lysozyme’ for the remainder of this manuscript) and bovine chymotrypsinogen. While B22 values of both proteins have been reported over a wide range of pH and salt concentrations,10 for reasons of computational expense we consider here only pH 7 and 100 mM NaCl as these are the conditions, of those for which data have been reported, that are closest to typical intracellular conditions.
Although a large number of CG methods have been developed with the purpose of modeling the structure and dynamics of biomolecular systems,1–4 we have chosen here to use the MARTINI force field.11 MARTINI was originally developed for modeling lipid membranes but it has since been extended to proteins12 and carbohydrates;13 importantly, it is an explicit-solvent CG model, with one water pseudo-molecule nominally representing four ‘real’ water molecules.11 Because of its potential applicability to a wide range of biomolecules, and because of the seamless way that the MARTINI developers have integrated their force field and protocols with the extremely popular molecular dynamics (MD) program GROMACS,14 MARTINI is probably the most widely used CG simulation model available today.
The purpose of this work is to show that with advances in computer power the thermodynamics of weak protein-protein interactions can now be measured directly with explicit-solvent CG simulation models such as MARTINI, and that we can therefore explore how well such force fields describe the interactions of proteins in aqueous solutions. We show that while the original MARTINI parameterization results in interaction thermodynamics that are too favorable, they can be made much more realistic by judicious scaling of the van der Waals interactions between the pseudo-atoms (‘beads’) of the proteins. Although we do not claim to have fully reparameterized the force field so that it will accurately model the thermodynamics of all protein-protein interactions, the results presented here do demonstrate the feasibility of systematically parameterizing methods such as MARTINI against experimental thermodynamic data, and point the way toward developing such methods to the point that they can be used to model intracellular environments.
Methods
Protein structures were obtained from the Protein Databank (http://www.rcsb.org). As in our previous work,15 pdb code 1HEL was used for hen egg-white lysozyme and 2CGA was used for chymotrypsinogen; although the latter file contains two copies of the protein only the first copy (chain A) was used in simulations. The conversions of the all-atom models into their corresponding MARTINI CG models – and all other steps involved in setting up the simulations – were performed using standard scripts kindly made available by the Marrink group (http://md.chem.rug.nl/cgMARTINI/). Since our goal was to compare with experimental B22 measurements performed at neutral pH, standard charge states were applied to all ionizable residues; histidines (of which there are only 1 and 2 in lysozyme and chymotrypsinogen respectively) were assigned zero net charge. To maintain the conformations of both proteins near their native state conformations a simple elastic network model16 was used, which was set up using a combination of the GROMACS tool ‘genrestr’ and the MARTINI developers’ ‘select-restr. pl’ script. This procedure places weak harmonic restraints between main chain pseudoatoms that are within 5 Å of each other in the native state structure; it places no restraints on pseudo-atoms used to represent the amino acid sidechains so the model has modest internal flexibility, although large-scale conformational changes are prohibited. The force constant applied to these harmonic restraints was 500 kJ/mol/nm2 as recommended by the MARTINI developers.
All molecular dynamics (MD) simulations were performed using GROMACS 4.5.1.14 All simulations were carried out in large cubic simulation boxes so that the proteins were free to tumble without experiencing any change in the effective system dimensions. For the lysozyme system, two copies of the protein were placed in a box of dimensions 200 × 200 × 200 Å (see Figure 1a); for the somewhat larger chymotrypsinogen system, two copies of the protein were placed in a box of dimensions 225 × 225 × 225 Å. Each system was neutralized by the addition of counter-ions: 8 Cl− ions per lysozyme molecule and 4 Cl− ions per chymotrypsinogen. Additional Na+ and Cl− ions were then added, using standard GROMACS protocols, to give a 100mM NaCl solution. Each simulation box was solvated using the standard MARTINI water model (not the ‘polarizable’ model developed more recently17), and, following the suggestion of the MARTINI developers, 10% of these water molecules were replaced by so-called ‘anti-freeze’ particles11 that have the effect of limiting the water model’s artefactual tendency to freeze. For lysozyme, this meant that the final simulation system contained 283 beads per protein, 482 Na+ ions, 498 Cl− ions, 57123 water pseudo-molecules, and 6455 ‘antifreeze’ particles, for a total of 65124 MARTINI particles. For chymotrypsinogen, the final system comprised 511 beads per protein, 641 Na+ ions, 649 Cl− ions, 83567 water pseudo-molecules, and 9428 ‘antifreeze’ particles, for a total of 95307 MARTINI particles. We note that in terms of size, these systems are ~3 to ~4 times larger than those considered in a very recent MARTINI study of GPCR dimerization18 and the computational demands of simulations of identical length are therefore somewhat greater.
Figure 1. MARTINI simulations of lysozyme-lysozyme interactions in aqueous solution.

A. Snapshot of the simulation system showing the two CG lysozyme models in yellow/pink, sodium ions in blue and chloride ions in red; solvent particles are omitted for clarity. B. Plots of the computed ΔGint (i.e. the PMF) versus the center-to-center distance of two lysozyme molecules obtained with the original MARTINI parameterization.
All MD simulations used protocols suggested by the MARTINI developers: a timestep of 25 fs was used, van der Waals interactions were treated with a shift function that acted from 9 to 12 Å and Coulombic interactions were treated with a shift function that acted from 0 to 12 Å; a constant relative dielectric constant of 15 was also applied.11 Simulations were performed in the NPT ensemble; the thermostats and barostats due to Berendsen19 were used to maintain the temperature and pressure at 298K and 1 atm respectively. In all simulations, an initial energy minimization was first carried out using the steepest descent algorithm for 1000 steps; this was then followed by a 300 ps run of ‘equilibration’ that involved a stepwise heating of the system from 50 K to 298 K (through 100 K, 150 K, 200 K, and 250 K), with a further 1 ns of ‘equilibration’ performed at 298K. Following this, ‘production’ simulations were run with snapshots (and center-to-center distances) saved every 1 ps for further analysis.
In order to compute the PMF for interaction of the two proteins (i.e. ΔGint versus their center-to-center distance), a series of umbrella sampling simulations were performed. In each case, a harmonic potential connecting the centers of mass of the two proteins was used to maintain their separation at or near a desired value; this restraint potential was implemented using the ‘pull’ code in GROMACS with a force constant of 250 kJ/mol/nm2. For PMFs calculated using conventional replica exchange protocols, a total of 40 such simulations were performed differing only in the length of the center-to-center harmonic bond. For lysozyme, the shortest harmonic bond length used in any such simulation was 23.5 Å, at which distance the surfaces of the two proteins are essentially crushed together; in the remaining 39 simulations the restraint bond length was incremented by 1.5 Å so that the longest distance studied was 82 Å. For chymotrypsinogen, the shortest harmonic bond length used in any simulation was 33.5 Å; again, in the remaining 39 simulations the restraint bond length was incremented by 1.5 Å so that the longest distance studied in this case was 92 Å. The combination of (a) force constant and (b) distance between adjacent simulations ensured that there was good overlap between the histograms of center-to-center distances sampled throughout the entire range of inter-protein distances studied.
For the particular case of lysozyme, we additionally performed replica-exchange simulations in order to improve the sampling of intermolecular geometries over the range of distances at which interactions were significant. These replica-exchange umbrella sampling simulations,20 which were performed with bash scripts written for the purpose, involved 48 ‘replicas’ of the system, with restraint bond lengths covering the range 20.5 to 45.5 Å in 0.5 Å intervals. Exchanges between adjacent replicas were attempted every 10 ps with the exchanges being accepted with probability min(1, exp(Δ)), where Δ = ((Eiold − Einew) − (Ejnew − Ejold))/RT, with Eiold being the energy of the i’th replica evaluated using its restraint distance prior to the exchange, Einew the energy of the same replica evaluated using the exchanged restraint distance, etc. Exchanges alternated every 10 ps, with exchanges between replicas 1 and 2, for example, being attempted at 0, 20, 40 ps etc. and exchanges between replicas 2 and 3 being attempted at 10, 30, 50 ps etc.
For both the ‘conventional’ (i.e. non-replica-exchange) and the replica-exchange simulations, PMFs were computed from the distribution of center-to-center distances sampled at each window using the Weighted Histogram Analysis Method (WHAM)21 implemented in a script kindly made available by Dr. Alan Grossfield.22 For the ‘conventional’ simulations, PMFs were shifted by a systematic offset in order to be zero at the furthest center-to-center distance for which the PMF appeared to be reasonably flat, i.e. at 80.5 and 90.5 Å for lysozyme and chymotrypsinogen respectively. For the replica-exchange simulations, which do not reach a center-to-center distance at which the PMF can be assumed to be flat, the PMFs were instead offset so as to coincide with the PMF obtained from the corresponding ‘conventional’ simulation at the furthest center-to-center distance sampled in the simulations (45.5 Å).
Having computed the PMF, the osmotic second virial coefficient, B22, was calculated by integrating the PMF using the following equation:10
| [4] |
Here, NA is Avogadro’s constant, MW is the molecular weight of the protein in Daltons, R is the Gas Constant, T is the temperature, and r is the center-to-center distance of the two proteins. All integrations were carried out using scripts implementing Simpson’s rule. It is to be noted that the use of this equation represents an implicit assumption that full Boltzmann-weighted averaging over all possible intermolecular orientations occurs at each value of the center-to-center distance of the two proteins.
For reasons outlined in Results, it quickly became apparent from simulations using the original MARTINI force field that the strength of protein-protein interactions in aqueous solution was overestimated by the force field. In order to investigate the extent to which the computed B22 values might be brought into better agreement with experiment we made adjustments to the MARTINI force field in the following way. We deliberately chose not to adjust parameters that had previously been given significant attention by the MARTINI developers: this included, in particular, the water-water and protein-water interactions as these have already been carefully parameterized.11,12 Instead, therefore, we restricted our attention to the van der Waals parameters describing direct interactions of pseudo-atoms in the two proteins.
With few exceptions, we adjusted the strength of all van der Waals interactions involving pairs of protein pseudo-atoms without changing the strength of their interactions with the solvent. The only exceptions were interactions involving the ‘P4’, ‘Qa’ and ‘Qd’ bead types which were left completely unchanged since the same bead types are also used for water, chloride and sodium ions respectively (whose interactions we do not wish to change); the only protein bead types left unchanged, therefore, are those of the alanine and glutamine sidechains (which use the ‘P4’ bead type), and the interactions of the charged sidechains of aspartate, glutamate, lysine and arginine (which use the ‘Qa’ and ‘Qd’ bead types). For all other bead type-bead type interactions we scaled (interpolated) the well-depth, ε, of the van der Waals potential between: (a) the value set in the original MARTINI force field, and (b) the value used by the MARTINI force field for describing nominally repulsive bead-bead interactions; we made no changes to the σ parameters that control the effective diameters of the beads. This scaling was done using a scaling parameter, α, with α = 1 corresponding to the use of the original MARTINI force field for all bead-bead interactions, and α = 0 corresponding to the use of the weakest possible MARTINI interaction for all bead-bead interactions: this is the so-called class VIII ‘repulsive’ interaction, for which MARTINI sets the well-depth to 2.0 kJ/mol. For a given value of α, the value of the well-depth, εα, applied to any particular interaction, is determined using: εα = εrepulsive + α (εoriginal − εrepulsive); here εrepulsive is the well-depth used for the class VIII interaction, and εoriginal is the original MARTINI well-depth used for the interaction of interest. An example should make the scheme clearer. In the case of a so-called class I ‘attractive’ interaction, the original MARTINI parameterization sets the well-depth to 5.0 kJ/mol. In simulations in which α is set to 0.2, therefore, the well-depth applied to this type of interaction becomes instead 2.0 + 0.2 × (5.0 − 2.0) = 2.6 kJ/mol.
Results
As a preliminary to our main results, it may be helpful to start by considering how simple energetic models might be used to match experimental B22 values. In particular, doing so will enable us to estimate what strength we should expect interactions to be in an accurate simulation model of protein-protein interaction thermodynamics. Although there are many energetic models that might be used to rationalize or fit B22 data we will begin by considering the simplest possible model in which protein-protein interactions are modeled using only a single Lennard-Jones type interaction acting between the centers of the two proteins (which, therefore, are also implicitly assumed to be spherical). Specifically, we will adopt the following functional form for the excess interaction free energy, ΔGint, – also known as the potential of mean force (PMF) – of the two protein molecules as a function of their center-to-center separation:
| [1] |
Here, σ is the distance at which ΔGint is at its minimum value, ε is the depth of the free energy-well at this distance, and r is the center-to-center distance of the two protein molecules. With a functional form for ΔGint specified, we can compute the resulting B22 value by integration with respect to r (see Methods). Doing this, and assuming that σ for two lysozyme molecules is 30 Å, we find that the well depth, ε, must be 0.64 kcal/mol in order for the simple Lennard-Jones interaction model to match the experimental B22 value of −0.0003 mol.ml/g2 reported by Velev et al.10 for lysozyme at pH 7 and in 100 mM NaCl. The fitted value of ε changes by only a small amount when we try other reasonable values of σ: for example, with σ = 25 and 35 Å, the fitted values of ε are 0.85 and 0.53 kcal/mol respectively.
If we assume instead that the interaction has a shorter-range attractive component of the following form:
| [2] |
then the fitted values of ε become 1.12, 0.87 and 0.71 kcal/mol for σ values of 25, 30 and 35 Å respectively. To make the attractive component even shorter in range, we can also consider a square-well potential function, with ΔGint being negative, for example, from 30 to 31 Å, infinitely positive for distances shorter than 30 Å, and zero for all distances greater than 31 Å. With this model, the depth of the square-well potential must be 1.98 kcal/mol in order to match the data of Velev et al.10
Not surprisingly, the fitted parameters change again if the energy model is made somewhat more elaborate. For example, we can include (repulsive) electrostatic interactions between the two proteins by adding a simple Debye-Hückel term:
| [3] |
Here, q is the net charge on the protein, κ is the so-called Debye-Hückel screening parameter (related to the square root of the ionic strength of the solution) and D is the relative dielectric constant of the solvent (78.4 for water at 298 K). Assuming that the net charge on each lysozyme molecule is +8 e at pH 7, the values of ε required to match the experimental data of Velev et al. become 1.67, 1.02 and 0.71 kcal/mol for σ values of 25, 30 and 35 Å. Finally, when the Debye-Hückel term is instead added to the square-well model, the energy well depth required to match experiment becomes instead 2.09 kcal/mol.
Although other energy functions could easily be imagined, and although the exact parameters that result will vary depending on the form of the energy function that is used, the above estimates provide us with a useful order-of-magnitude idea of how favorable we might expect the computed PMFs for lysozyme self-interactions to be if the simulated interaction thermodynamics are to be consistent with the experimental B22. The above estimates are helpful for another reason, however, which is that since they show that we should expect rather weak interactions, they give us hope that accurately computing B22 values from computer simulations might be achievable. This will only be true, of course, if the simulation force field’s description of the protein-protein interaction thermodynamics is close to being accurate.
Given the above, we attempted to compute the PMF (i.e. ΔGint versus center-to-center distance) for lysozyme self-interactions using umbrella sampling simulations with the MARTINI force field. In order to do so, we performed 40 independent 1 μs MD simulations with the center-to-center distances of two lysozyme molecules harmonically restrained to values ranging from 23.5 to 82.0 Å (Figure 1A; see Methods). Unfortunately, in these simulations we found that at short separation distances the surfaces of the two protein molecules rapidly became stuck to each other. On the one hand, this meant that it was impossible for us to compute the interaction thermodynamics with great precision using the standard MARTINI force field. On the other hand, it provided an indication that the MARTINI-simulated thermodynamics of the lysozyme self-interaction were likely to be much too favorable. In particular, the computed PMF had a well depth of more than 10 kcal/mol (Figure 1B), i.e. much deeper than might be expected based on the simpler but experimentally-consistent energy models discussed above. As a consequence, the resulting computed B22 value is orders of magnitude too negative (data not shown). The finding that the PMF computed using simulation data from 0.5 μs to 1.0 μs is even more favorable than that computed using simulation data from 0 to 0.5 μs indicates that running the simulations for longer periods of time is not likely to improve the results significantly (Figure 1B).
These results suggested to us that changes might be needed to be made to the MARTINI force field in order to bring the interaction thermodynamics into closer agreement with experiment. Although there are multiple ways to do this, we focused on modifying (i.e. weakening) the van der Waals parameters for bead-bead interactions in which both beads were pseudo-atoms of the proteins; importantly, care was taken to do this in such a way as to leave unchanged MARTINI’s description of protein-water and water-water interactions as these have already been subject to considerable scrutiny by the force field’s developers.11,12 As discussed in Methods, we elected to scale the van der Waals parameters by a factor, α, that allowed the interaction strengths to vary between, at one extreme, the weakest type of van der Waals interaction already assigned to any bead-bead interaction in the MARTINI force field to, at the other extreme, the original MARTINI parameterization (see Methods). In an attempt to narrow down an optimal value of α, we performed independent PMF calculations using 11 different values of α ranging from 0.0 to 1.0 in increments of 0.1. Each PMF calculation involved performing a (comparatively short) 100 ns MD simulation at each of 40 different values of the center-to-center distance of the two lysozyme molecules.
The PMFs resulting from the exploratory scan of α values for the lysozyme self-interaction are shown in Figure 2A. The PMFs obtained from simulations that used near-original MARTINI van der Waals parameters (i.e. high α values) all have very favorable free energy minima; those obtained from simulations that used only very weakly attractive van der Waals parameters (i.e. low α values) have very shallow free energy minima that are more consistent with our expectations – based on the very simple energetic models presented earlier – of what is required to reproduce experiment. Notably, there is a clear trend in the shapes and depths of the computed PMFs at short distances as α changes, and the PMFs are essentially independent of α at longer distances. The latter result is as it should be: since we left unchanged MARTINI’s description of the protein-water and protein-ion interactions as well as its electrostatic interactions, changes in the PMFs with α should only be seen at separation distances where beads of the two proteins are within the interaction cutoff (see Methods). The fact that the PMFs change smoothly with α and do not change drastically where they should not (i.e. at center-to-center distances beyond ~45 Å), suggests that while the simulations used in this scan are rather short, the resulting PMFs are likely to be sufficiently reliable to identify candidate values of α for more quantitative evaluation (see below).
Figure 2. Dependence of the computed PMFs and B22 values on the scaling factor α.
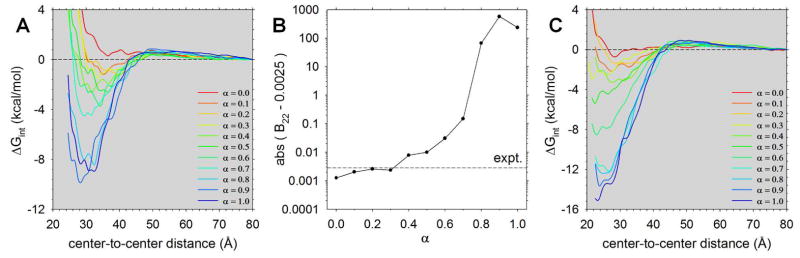
A. Plots of ΔGint versus center-to-center distance for the lysozyme self-interaction computed with different values of α. B. Plot of the computed ‘transformed’ B22 values (see text) versus α for the lysozyme self-interaction; the horizontal line represents the experimental value determined by Velev et al.10 C. Same as A but showing PMFs computed from simulations that set all protein partial charges to zero and omit NaCl.
When the PMFs shown in Figure 2A are integrated in order to compute the B22 (see Methods) we obtain the results shown in Figure 2B. B22 values can be difficult to represent graphically because they have an exponential dependence on ΔGint and yet can take on both positive and negative values, which can make it impossible to plot them together on a logarithmic axis. Here we have avoided this issue and simplified the visual comparison of the B22 values obtained with the different values of α by re-expressing them in a somewhat arcane form. We first subtract 0.0025 mol.ml/g2 from the computed B22 value and then take the absolute value of the result; this second step allows us to plot the ‘transformed’ B22 values on a logarithmic scale, thereby greatly facilitating visual comparison; the first step ensures that prior to taking the absolute value, all of the values have the same sign (negative). For reference, the original, untransformed B22 values are presented in tabular form in Table S1. Also plotted in Figure 2B is a horizontal line indicating the experimental value reported by Velev et al.10 From the figure, therefore, we can see that the results obtained with α values in the range 0.1 – 0.4 are much closer to experiment than those obtained with the original MARTINI parameterization (α = 1.0). We note again that although there will be significant uncertainties in the calculated PMFs at the high α values, these uncertainties will not be sufficient to account for the fact that the computed B22 values are in error by four or five orders of magnitude.
Importantly, a qualitatively identical picture emerges when we repeat the entire analysis outlined above with a quite different protein, chymotrypsinogen (Figure S1). When the original MARTINI parameterization is used (α = 1.0) we again obtain very favorable interactions between the two chymotrypsinogen molecules when their surfaces are in contact, i.e. at center-to-center distances of ~40 Å (Figure S1A), and when the van der Waals interactions between beads representing protein-protein interaction terms are weakened, the PMFs again become significantly less favorable. As with lysozyme, despite the use of comparatively short (100 ns) MD simulations at each of the 40 center-to-center distances, there is a clear trend to the computed PMFs with increasing α. And again, when the computed PMFs are integrated to give the B22, we find that low α values give numbers that are much more consistent with the experimental value10 of −0.0004 mol.ml/g2 (Figure S1B). Given that the interactions of chymotrypsinogen molecules are thought to have a quite different electrostatic nature from the primarily repulsive interactions seen with lysozyme,23 this suggests that the problem with excessively strong interactions is likely to be general, i.e. is not restricted to lysozyme.
To determine the extent to which MARTINI’s apparent overestimation of the strength of protein-protein interactions might be a result of its description of electrostatic interactions, we repeated the scan of α values for the lysozyme self-interaction with simulations in which all charges on the proteins were set to zero and in which Na+ and Cl− ions were omitted. The PMFs resulting from these simulations are shown in Figure 2C. In comparison with the values obtained from the simulations that included electrostatic interactions (Figure 2A), the ΔGint values are uniformly more negative and shifted inwards so that the proteins are able to approach each other more closely than they can in the presence of electrostatic interactions. This suggests that while the electrostatic interactions in the MARTINI model – at least with the original ‘non-polarizable’ water model used here – are somewhat simplified, they are at least qualitatively capturing the electrostatic repulsions that are expected to occur between the like-charged protein molecules. Interestingly, however, the behavior of the PMFs at long distances is very similar in the two sets of simulations; this indicates, perhaps surprisingly, that the repulsion seen at long distances in the simulations is not a result of electrostatic interactions. We have determined that this is not a trivial result of any issues with the convergence of the WHAM calculations21,22 used to construct the PMFs: the long-range repulsion remains when the tolerance on such calculations is increased by a factor of 1000 and when the PMF is calculated using only simulation data from center-to-center distances between 60 and 80 Å (data not shown).
While the above scans suggest that scaling of the van der Waals parameters can make the interaction thermodynamics more realistic, they are not sufficient to accurately determine which value of α produces behavior that is most consistent with experiment. In an attempt to narrow down the best value of α, therefore, we carried out additional simulations for a number of selected values of α for lysozyme. We first selected α = 0.2 and ran conventional 2 μs MD simulations at each window; in order to study any dependence of the results on the simulation time periods, we also separately analyzed the data in separate blocks of 500 ns. The PMFs resulting from such simulations are shown in Figure S2A; they show a clear tendency for the PMFs to become more favorable as later segments of the simulation trajectories are used, and examination of structural snapshots sampled during the simulations indicates that, even with these relatively weak van der Waals interactions, the protein molecules are again settling into one or two very favorable orientations at short separation distances (see, e.g. Figure S2B).
To improve the sampling of intermolecular geometries at shorter separation distances, therefore, we performed additional simulations using replica-exchange techniques in conjunction with umbrella sampling20 for center-to-center distances between 20.5 and 45.5 Å (see Methods). These simulations were performed at each of the values α = 0.2, 0.3 and 0.4 and the results combined with the data from the 1 μs long α = 0.2 simulation for distances beyond 45.5 Å in order to obtain much more solidly converged PMFs; additional simulations were also performed with α = 1.0. The resulting PMFs for α = 0.2 are shown in Figure 3A, while those for α = 0.3, 0.4 and 1.0 are shown in Figure S3; while the α = 1.0 PMFs again show a tendency to become more favorable as successive blocks of data are used, they confirm the general conclusion that the interactions with the original MARTINI parameterization are much too strong. The much better sampling of close geometries obtained with the replica-exchange simulations is illustrated in Figure S4, which compares the distributions of intermolecular geometries obtained with the two simulation approaches at both 30.5 Å (i.e. the most energetically favorable distance for interaction), and 45.5 Å (i.e. the furthest distance sampled in the replica-exchange simulations). The extent to which the various replicas exchanged with one another during the α = 0.2 simulations is shown in Figure S5; this indicates that while fully converged sampling has not been achieved (since not all replicas exchange to all possible center-to-center distances), the replicas nevertheless sample a wide range of center-to-center distances. Finally, the resulting B22 values calculated with α = 0.2, 0.3 and 0.4 are shown in Figure 3B: encouragingly, the three α values straddle the experimental value, with α = 0.2 producing a B22 that is too thermodynamically unfavorable, α = 0.4 producing a B22 that is too favorable, and α = 0.3 providing the closest agreement with experiment.
Figure 3. Computed PMFs and B22 values for the lysozyme self-interaction obtained from replica-exchange umbrella sampling simulations.

A. Plots of ΔGint versus center-to-center distance for the lysozyme self-interaction computed using α = 0.2; different lines represent PMFs calculated from different blocks of simulation data. Note that the PMFs from the replica-exchange umbrella sampling simulations – which covered the range 20.5 Å to 45.5 Å – have been made to coincide at a center-to-center distance of 45.5 Å with the PMF obtained from 2 μs (non-replica exchange) umbrella sampling simulations performed at α = 0.2 over the center-to-center distance range 23.5 Å to 82 Å. B. Plot of the computed ‘transformed’ B22 values (see text) versus simulation time for the lysozyme self-interaction computed from replica-exchange umbrella sampling simulations using α = 0.2, 0.3 and 0.4; the horizontal line represents the experimental value determined by Velev et al.10
Discussion
The motivation for the present work has been to establish the feasibility of testing, and if necessary modifying, an explicit-solvent CG simulation model against experimental data that would be of relevance to modeling behavior in intracellular conditions. We have chosen to focus on the computation of the osmotic second virial coefficient as it provides a reasonably direct measurement of the interaction thermodynamics of pairs of protein molecules in aqueous solution.23 Importantly, although B22 values are typically measured at protein concentrations of < 10 mg/mL, i.e. far below the concentrations encountered inside biological cells, our group15 and the Wade group24 have independently shown, using rigid-body Brownian dynamics simulation methods, that parameters optimized to reproduce B22 values can still perform well when used at much higher concentrations (e.g. up to 333 mg/mL24). This suggests that attempting to reproduce B22 values is likely to be a valuable component of efforts to validate simulation methods suitable for modeling intracellular conditions.
The two proteins that we have modeled here are by no means the only ones that could have been selected: osmotic second virial coefficient data have been reported for a number of other proteins such as T4 lysozyme,25 BSA,26 and ovalbumin.27 From a computational perspective, however, lysozyme and chymotrypsinogen are attractive to study for two reasons. First, at 129 and 245 residues respectively, they are both reasonably small, which means that comparatively small simulation boxes can be used in the PMF calculations; given that explicit-solvent CG simulations can still be computationally expensive to perform, this is a significant advantage. Second, the two proteins are interesting to study because electrostatic interactions are thought to play fundamentally different roles in their interaction thermodynamics: based on their qualitatively different responses to the addition of NaCl at pH 7, the electrostatic interactions of lysozyme molecules appear to be predominantly repulsive, while those of chymotrypsinogen molecules are primarily attractive.10,23 Testing simulation models against both proteins, therefore, is potentially valuable for identifying where inadequacies in the model’s energy description are likely to lie.
There have been a number of previous efforts to compute and rationalize the osmotic second virial coefficients of lysozyme and chymotrypsinogen in aqueous solution using structurally realistic models; up to now, all of these studies have used rigid-body models and implicit solvent representations. Calculations of B22 values for proteins were pioneered by the Lenhoff group who used random sampling of intermolecular configurations to demonstrate the importance of modeling protein structure in atomic detail in calculations of B22.23 The same group also first noted the quite different role of electrostatic forces in lysozyme and chymotrypsinogen self-interactions and highlighted the potentially dominant role of short-range attractive interactions in determining B22 values.10,28 Finally, the same group established the notion that the effects of single-residue mutations might be understood using structure-based approaches.25 Following the Lenhoff group, calculations of B22 values with atomically detailed models of lysozyme and chymotrypsinogen were used by Elcock and McCammon to parameterize a continuum electrostatics-based energy model for describing weak protein-protein interactions;29 that study also established accurate reproduction of B22’s pH-dependence as a significant technical challenge owing to the need to model protonation state changes in the proteins at pH values where ionizable groups are likely to titrate. Lund and Jönsson30 used Monte Carlo methods combined with both atomic-level and residue-level models of proteins to compute B22 values for both lysozyme and chymotrypsinogen; importantly, they were the first to include explicit salt ions in the simulations. Subsequently, the same authors extended their model31 with a Monte Carlo scheme allowing protonation state changes to occur, and showed, in line with ref. 29, that this resulted in significantly more favorable protein-protein interactions. The Hummer group32 parameterized a residue-level energy model for CG simulations in part by parameterizing against B22 data for lysozyme, doing so by adjusting statistical interaction potentials originally derived by Miyazawa and Jernigan.33 Finally, our group15 and the Wade group24,34 used BD simulation methods, again employing atomically detailed protein models, to reproduce the B22 values of lysozyme and chymotrypsinogen by explicitly simulating solutions of the two proteins at the same concentrations used to measure B22 experimentally. In addition to showing that energy models parameterized against B22 data could be used to accurately simulate proteins at very high concentrations (see above), these latter studies also showed that the effects of single residue mutations on B22 values could be predicted with surprising accuracy.15,34
Compared with these previous studies, the use here of the MARTINI simulation model introduces two important new features and complications. First, this is – to our knowledge – the first study in which B22 calculations of proteins have been performed with an explicit solvent model. The inclusion of explicit solvent means that the calculations are near the limit of what is feasible with routinely available computer resources, but has the potential advantage of allowing the thermodynamic and kinetic effects of desolvation, and the diffusive effects of hydrodynamic interactions, to be modeled more naturally than is possible with implicit-solvent approaches. Second, this is also the first study in which B22 calculations of proteins have been performed with at least some degree of internal conformational flexibility allowed. It should be stressed that the flexibility in the present model is quite restricted since harmonic potentials are used to maintain the proteins in their native structures.16 For the future, however, less restrictive models could in principle be used although more computer time would be required owing to the need to simultaneously sample over internal degrees of freedom and over relative orientations of the two protein molecules.
Although the MARTINI simulation model has a number of potential advantages, we have found that in its original form it leads to excessively strong (favorable) interactions between proteins in aqueous solution. While this is a somewhat disappointing result, it is important to note that it should not necessarily be a surprise: after all, MARTINI was not explicitly designed to provide a quantitative description of the thermodynamics of protein interactions in aqueous solutions. Instead, the force field appears to be much more ‘at home’ in the lipid membrane where it has been used successfully to model the association behavior of membrane proteins and peptides.18,35,36 For example, MARTINI’s predicted dimerization free energy of a so-called ‘WALP’ peptide of 23-residues length has been shown to be in excellent agreement with experiment.36 Furthermore, in a recent study that is in many respects complementary to the present work, the MARTINI developers have used umbrella sampling methods to compute PMFs for a number of different modes of association of two rhodopsin molecules in the 2D environment of the lipid bilayer.18 The depths of the free energy minima reported in that work are, for the strongest modes of association, similar to those reported here, although in that case there are no thermodynamic data with which to directly compare: it is clear, however, that the most favorable mode of interaction predicted by the MARTINI force field is consistent with a variety of experimental data.18 Given the force field’s origins, it is reasonable to expect that protein-protein PMFs predicted by the original MARTINI force field will be more reliable for associations in lipid bilayers than in aqueous solution.
Although, therefore, the original MARTINI parameterization appears to result in protein-protein interactions that are too strong in aqueous solution, we have shown here that it is quite feasible to make comparatively minor adjustments to the force field in order to dramatically improve its agreement with experiment. As described in detail in Methods, we have focused here on scaling the van der Waals parameters for interactions that involve only pairs of protein pseudo-atoms: this has the advantage of leaving unchanged those parts of the force field that have already been subject to extensive adjustment by the original developers. For lysozyme, we have used replica-exchange umbrella sampling techniques to establish that a scaling factor α = 0.3 produces results that appear to be in closest agreement with experiment; for reasons of computational expense, we have not done the same for chymotrypsinogen, but a preliminary scan of α values indicates that it too would require a significant down-scaling of the inter-bead van der Waals interactions to produce results in close agreement with experiment. While we have opted here for an essentially uniform scaling of parameters, it is possible that a more targeted approach – perhaps requiring that certain interactions be ‘corrected’ more than others – might ultimately be necessary. Again, this would not be a major surprise since recent work by the Marrink group has shown that, in comparison with all-atom MD simulation data, the interactions of aliphatic and aromatic residues in water are somewhat too strong.37 Efforts to improve selected aspects of MARTINI’s protein force field have, in fact, already been made. For example, the Tieleman group recently reported using extensive all-atom MD simulations of a number of amyloid- and elastin-like peptides in order to derive improved parameters for protein backbone dihedral terms.38 In addition, as this work was being completed, the Marrink group introduced new topology files for phenylalanine, tryptophan and proline residues, and made substantial alterations to the way that charged and polar residues are treated;39 the latter changes, however, were made primarily with a view to improving behavior in apolar media, not in aqueous solution.
It is to be noted that we have not used the more recently developed MARTINI ‘polarizable’ water model17 only for reasons of computational expense as it has been reported to be approximately three times slower for pure water simulations than the original water model used here.17 It is of course quite likely that the optimal value of α will change somewhat if the newer water model were used instead, but we think that this will not alter our basic conclusion that MARTINI’s van der Waals terms for protein-protein interactions are too favorable. We base this statement primarily on the observation that interactions of beads with the two MARTINI water models appear to differ in only comparatively minor ways. For uncharged beads, for example, the well-depths of the van der Waals terms for interactions with water are only 5% smaller in the ‘polarizable’ water model than in the original water model, and the computed hydration free energies of uncharged beads are essentially identical with the two water models.17 For charged beads, simulations of NaCl solutions indicate that the two water models produce identical radial distribution functions for ion-water interactions but differ in their descriptions of ion-ion interactions, with cation-cation interactions being somewhat less favorable and cation-anion interactions significantly more favorable in the ‘polarizable’ water model. One might argue that, at least for lysozyme, the slightly more repulsive cation-cation interactions obtained with the ‘polarizable’ water model could lead to protein-protein interactions that are more realistic (i.e. less favorable). On the other hand, however, one might also argue that the much stronger cation-anion interactions obtained with the ‘polarizable’ water model might lead to greater binding of Cl− to lysozyme molecules, a concomitant decrease in the electrostatic repulsion of the two proteins, and, as a result, even stronger (i.e. less realistic) interactions. Since one might make either argument it is difficult to predict what might happen in a complicated protein-ion-water system, except to say that given the very significant overestimation of the strengths of protein-protein interactions in aqueous solution obtained with the original MARTINI model we think it is unlikely to be fixed by use of the newer water model.
That said, since the newer water model has been shown to quite accurately describe the dielectric properties of water, 17 one area where it might offer significant help is in the treatment of long-range electrostatic interactions at very low salt concentrations. In particular, the integral used to calculate B22 contains an r2 term that magnifies the importance of long-range terms (see Methods) and while long-range electrostatic repulsions of proteins are generally quite effectively screened by the added salt concentrations studied here (100 mM), they can play a major role in determining the B22 at very low salt concentrations (e.g. 5 mM).15 Since the simpler water model employed here is suggested by the developers for use with comparatively short-range cutoffs of 12 Å (see Methods), it is unlikely to be of use in modeling the latter conditions. Further consideration of long-range interactions might also help to uncover the origins of the non-electrostatic long-range repulsion seen in the simulations reported here. The origins of this repulsion remain obscure, although they may be connected with the inclusion of ‘anti-freeze’ molecules in the simulations (see Methods), but it is important to note that this repulsion does not affect our principal conclusion that protein-protein interactions in aqueous solution computed with the original MARTINI model are likely to be excessively strong: removal of the repulsion from the computed PMFs results in B22 values that are even more favorable (i.e. less realistic) than before.
Finally, we note that while the simulations reported here are near the limits of what is routinely achievable with typical computer resources, the availability of B22 data for a number of different proteins in a range of conditions of pH and ionic strength offers an excellent opportunity in the near future to undertake a systematic parameterization of MARTINI – and other explicit-solvent CG force fields – to match thermodynamic data on the interactions of proteins in aqueous solution. Reproduction of pH effects in particular, which in the past have proven challenging to incorporate into B22 calculations,29,31 might be facilitated by a recent combination of the MARTINI model with constant pH MD simulations reported by the Tieleman group.40 A successful parameterization of the MARTINI model against these kinds of data would, in turn, open the door to performing very large-scale, explicit-solvent CG simulation studies of intracellular environments.
Supplementary Material
Acknowledgments
A.C.S. gratefully acknowledges the guidance of Dr. Shun Zhu in setting up his molecular dynamics simulations. All authors are very grateful to Professor Alan Grossfield (University of Rochester Medical Center) for making available his WHAM code. This work was supported by NIH R01 GM087290 awarded to A.H.E.
Footnotes
Table listing the computed B22 values as a function of α for lysozyme and chymotrypsinogen self-interactions.
References
- 1.Tozzini V. Coarse-grained models for proteins. Curr Opin Struct Biol. 2005;15:144–150. doi: 10.1016/j.sbi.2005.02.005. [DOI] [PubMed] [Google Scholar]
- 2.Ayton GS, Noid WG, Voth GA. Multiscale modeling of biomolecular systems: in serial and in parallel. Curr Opin Struct Biol. 2007;17:192–198. doi: 10.1016/j.sbi.2007.03.004. [DOI] [PubMed] [Google Scholar]
- 3.Hills RD, Jr, Brooks CL., III Insights from coarse-grained Go models for protein folding and dynamics. Int J Mol Sci. 2009;10:889–905. doi: 10.3390/ijms10030889. [DOI] [PMC free article] [PubMed] [Google Scholar]
- 4.Takada S. Coarse-grained molecular simulations of large biomolecules. Curr Opin Struct Biol. 2012;22:130–137. doi: 10.1016/j.sbi.2012.01.010. [DOI] [PubMed] [Google Scholar]
- 5.Shih AY, Freddolino PL, Arkhipov A, Schulten K. Assembly of lipoprotein particles revealed by coarse-grained molecular dynamics simulations. J Struct Biol. 2006;157:579–592. doi: 10.1016/j.jsb.2006.08.006. [DOI] [PubMed] [Google Scholar]
- 6.Bicout DJ, Field MJ. Stochastic dynamics simulations of macromolecular diffusion in a model of the cytoplasm of Escherichia coli. J Phys Chem. 1996;100:2489–2497. [Google Scholar]
- 7.Ridgway D, Broderick G, Lopez-Campistrous A, Ru’aini M, Winter P, Hamilton M, Boulanger P, Kovalenko A, Ellison MJ. Coarse-grained molecular simulation of diffusion and reaction kinetics in a crowded virtual cytoplasm. Biophys J. 2008;94:3748–3759. doi: 10.1529/biophysj.107.116053. [DOI] [PMC free article] [PubMed] [Google Scholar]
- 8.McGuffee SR, Elcock AH. Diffusion, crowding & protein stability in a dynamic molecular model of the bacterial cytoplasm. PLoS Comput Biol. 2010;6:e1000694. doi: 10.1371/journal.pcbi.1000694. [DOI] [PMC free article] [PubMed] [Google Scholar]
- 9.Ando T, Skolnick J. Crowding and hydrodynamic interactions likely dominate in vivo macromolecular motion. Proc Natl Acad Sci USA. 2010;107:18457–18462. doi: 10.1073/pnas.1011354107. [DOI] [PMC free article] [PubMed] [Google Scholar]
- 10.Velev OD, Kaler EW, Lenhoff AM. Protein interactions in solution characterized by light and neutron scattering: comparison of lysozyme and chymotrypsinogen. Biophys J. 1998;75:2682–2697. doi: 10.1016/S0006-3495(98)77713-6. [DOI] [PMC free article] [PubMed] [Google Scholar]
- 11.Marrink SJ, Risselada HJ, Yefimov S, Tieleman DP, de Vries AH. The MARTINI force field: coarse grained model for biomolecular simulations. J Phys Chem B. 2007;111:7812–7824. doi: 10.1021/jp071097f. [DOI] [PubMed] [Google Scholar]
- 12.Monticelli L, Kandasamy SK, Periole X, Larson RG, Tieleman DP, Marrink SJ. The MARTINI coarse-grained force field: extension to proteins. J Chem Theor Comput. 2008;4:819–834. doi: 10.1021/ct700324x. [DOI] [PubMed] [Google Scholar]
- 13.Lopez CA, Rzepiela AJ, de Vries AH, Dijkhuizen L, Hünenberger PH, Marrink SJ. MARTINI coarse-grained force field: extension to carbohydrates. J Chem Theor Comput. 2009;5:3195–3210. doi: 10.1021/ct900313w. [DOI] [PubMed] [Google Scholar]
- 14.Hess B, Kutzner C, van der Spoel D, Lindahl E. GROMACS 4: algorithms for highly efficient, load-balanced and scalable molecular simulation. J Chem Theor Comput. 2008;4:435–447. doi: 10.1021/ct700301q. [DOI] [PubMed] [Google Scholar]
- 15.McGuffee SR, Elcock AH. Atomically detailed simulations of concentrated protein solutions: the effects of salt, pH, point mutations and protein concentration in simulations of 1000-molecule systems. J Am Chem Soc. 2006;128:12098–12110. doi: 10.1021/ja0614058. [DOI] [PubMed] [Google Scholar]
- 16.Periole X, Cavalli M, Marrink SJ, Ceruso MA. Combining an elastic network with a coarse-grained molecular force field: structure, dynamics, and intermolecular recognition. J Chem Theor Comput. 2009;5:2531–2543. doi: 10.1021/ct9002114. [DOI] [PubMed] [Google Scholar]
- 17.Yesylevskyy SO, Schäfer LV, Sengupta D, Marrink SJ. Polarizable water model for the coarse-grained MARTINI force field. PLoS Comput Biol. 2010;6:e1000810. doi: 10.1371/journal.pcbi.1000810. [DOI] [PMC free article] [PubMed] [Google Scholar]
- 18.Periole X, Knepp AM, Sakmar TP, Marrink SJ, Huber T. Structural determinants of the supra-molecular organization of G protein-coupled receptors in bilayers. J Am Chem Soc. 2012;134:10959–10965. doi: 10.1021/ja303286e. [DOI] [PMC free article] [PubMed] [Google Scholar]
- 19.Berendsen HJC, Postma JPM, van Gunsteren WF, DiNola A, Haak JR. Molecular-dynamics with coupling to an external bath. J Chem Phys. 1984;81:3684–3690. [Google Scholar]
- 20.Sugita Y, Kitao A, Okamoto Y. Multidimensional replica-exchange method for free-energy calculations. J Chem Phys. 2000;113:6042–6051. [Google Scholar]
- 21.Kumar S, Bouzida D, Swendsen RH, Kollman PA, Rosenberg JM. The weighted histogram analysis method for free-energy calculations on biomolecules. I. The method. J Comput Chem. 1992;13:1011–1021. [Google Scholar]
- 22.Grossfield A. WHAM: the weighted histogram analysis method. version 2.0. http://membrane.urmc.rochester/content/wham.
- 23.Neal BL, Asthagiri D, Lenhoff AM. Molecular origins of osmotic second virial coefficients of proteins. Biophys J. 1998;75:2469–2477. doi: 10.1016/S0006-3495(98)77691-X. [DOI] [PMC free article] [PubMed] [Google Scholar]
- 24.Mereghetti P, Wade RC. Atomic detail Brownian dynamics simulations of concentrated protein solutions with a mean field treatment of hydrodynamic interactions. J Phys Chem B. 2012;116:8523–8533. doi: 10.1021/jp212532h. [DOI] [PubMed] [Google Scholar]
- 25.Chang RC, Asthagiri D, Lenhoff AM. Measured and calculated effects of mutations in bacteriophage T4 lysozyme on interactions in solution. Proteins – Struct Funct Genet. 2000;41:123–13. [PubMed] [Google Scholar]
- 26.Tessier PM, Sandler SI, Lenhoff AM. Direct measurement of protein osmotic second virial cross coefficients by cross-interaction chromatography. Protein Sci. 2004;13:1379–1390. doi: 10.1110/ps.03419204. [DOI] [PMC free article] [PubMed] [Google Scholar]
- 27.Teske CA, Blanch HW, Prausnitz JM. Chromatographic measurement of interactions between unlike proteins. Fluid Phase Equil. 2004;219:139–148. [Google Scholar]
- 28.Neal BL, Lenhoff AM. Excluded volume contribution to the osmotic second virial coefficient for proteins. AIChE J. 1995;41:1010–1014. [Google Scholar]
- 29.Elcock AH, McCammon JA. Calculation of weak protein-protein interactions: the pH dependence of the second virial coefficient. Biophys J. 2001;80:613–625. doi: 10.1016/S0006-3495(01)76042-0. [DOI] [PMC free article] [PubMed] [Google Scholar]
- 30.Lund M, Jönsson B. A mesoscopic model for protein-protein interactions in solution. Biophys J. 2003;85:2940–2947. doi: 10.1016/S0006-3495(03)74714-6. [DOI] [PMC free article] [PubMed] [Google Scholar]
- 31.Lund M, Jönsson B. On the charge regulation of proteins. Biochemistry. 2005;44:5722–5727. doi: 10.1021/bi047630o. [DOI] [PubMed] [Google Scholar]
- 32.Kim YC, Hummer G. Coarse-grained models for simulations of multiprotein complexes: application to ubiquitin binding. J Mol Biol. 2008;375:1416–1433. doi: 10.1016/j.jmb.2007.11.063. [DOI] [PMC free article] [PubMed] [Google Scholar]
- 33.Miyazawa S, Jernigan RL. Residue-residue potentials with a favorable contact pair term and an unfavorable high packing density term for simulation and threading. J Mol Biol. 1996;256:623–644. doi: 10.1006/jmbi.1996.0114. [DOI] [PubMed] [Google Scholar]
- 34.Mereghetti P, Gabdoulline RR, Wade RC. Brownian dynamics simulation of protein solutions: structural and dynamic properties. Biophys J. 2010;99:3782–3791. doi: 10.1016/j.bpj.2010.10.035. [DOI] [PMC free article] [PubMed] [Google Scholar]
- 35.Periole X, Huber T, Marrink SJ, Sakmar TP. G protein-coupled receptors self-assemble in dynamics simulations of model bilayers. J Am Chem Soc. 2007;129:10126–10132. doi: 10.1021/ja0706246. [DOI] [PubMed] [Google Scholar]
- 36.Schafer LV, de Jong DH, Holt A, Rzepiela AJ, de Vries AH, Poolman B, Killian JA, Marrink SJ. Lipid packing drives the segregation of transmembrane helices into disordered lipid domains in model biomembranes. Proc Natl Acad Sci USA. 2011;108:1343–1348. doi: 10.1073/pnas.1009362108. [DOI] [PMC free article] [PubMed] [Google Scholar]
- 37.de Jong DH, Periole X, Marrink SJ. Dimerization of amino acid side chains: lessons from the comparison of different forcefields. J Chem Theor Comput. 2011;8:1003–1014. doi: 10.1021/ct200599d. [DOI] [PubMed] [Google Scholar]
- 38.Seo M, Rauscher S, Pomes S, Tieleman DP. Improving internal peptide dynamics in the coarse-grained MARTINI model: toward large-scale simulations of amyloid- and elastin-like peptides. J Chem Theor Comput. 2012;8:1774–1785. doi: 10.1021/ct200876v. [DOI] [PMC free article] [PubMed] [Google Scholar]
- 39.de Jong DH, Singh G, Bennett WFD, Arnarez C, Wassenaar TA, Schäfer LV, Periole X, Tieleman DP, Marrink SJ. Improved parameters for the MARTINI coarse-grained protein force field. J Chem Theor Comput. 2012;9:687–697. doi: 10.1021/ct300646g. [DOI] [PubMed] [Google Scholar]
- 40.Bennett W, Chen A, Donnini S, Groenhof G, Tieleman P. Constant pH simulations with the coarse-grained MARTINI model: application to oleic acid aggregates. Can J Chem. 2013 doi: 10.1139/cjc-2013-0010. [DOI] [Google Scholar]
Associated Data
This section collects any data citations, data availability statements, or supplementary materials included in this article.