

Abstract
Significance
Wound repair is a complex biological process that integrates multiple physiologic pathways to restore skin homeostasis after a wide array of gross and anatomical insults. As such, a scientific examination of the wound typically requires broad sampling of numerous factors and is commonly achieved through DNA microarray analysis.
Critical Issues
In the last several years, it has become increasingly evident that the granularity afforded by such traditional population-based assays may be insufficient to capture the complex relationships in heterogeneous processes such as those associated with wound healing and stem cell biology.
Recent Advances
Several emerging technologies have recently become available that permit high-throughput single-cell gene expression analysis in a manner which provides novel insights into the relationships of complex tissue. The most prominent among these employs microfluidic-based devices to achieve a high-resolution analysis of tissue samples.
Future Directions
The intrinsically heterogeneous nature of injured tissue, in conjunction with its temporal dynamics, makes wound repair and tissue regeneration an attractive target for high-throughput single-cell analysis. Given the staggering costs associated with chronic and non-healing wounds, the development of predictive and diagnostic tools using this technology would likely be attractive to healthcare providers.

Geoffrey C. Gurtner, MD
Scope and Significance
Chronic and non-healing wounds represent a significant source of morbidity and mortality in the United States.1–4 Normal wound healing proceeds through a carefully orchestrated reparative process that results in a durable restoration of anatomic and functional integrity. However, various physiologic and environmental factors may impair the healing response, resulting in the failure to proceed through the usual stepwise progression and culminating in a chronic or non-healing wound.3 These factors may be either local (e.g., trauma, infection, hypoxia) or systemic (e.g., diabetes, malnutrition), and the pathophysiology associated with these phenotypes is frequently studied using small and large animal models. This review provides a general overview of the traditional analytical techniques for wound healing, as well as a survey of novel single-cell technologies, with an emphasis on the role of microfluidic-based devices in achieving high-throughput analysis of tissue samples.
Translational Relevance
An array of powerful new technologies have been developed to interrogate complex cell populations, providing an unprecedented level of molecular detail into previously uncharacterized biological processes. Translating these new insights into clinical advances represents an ongoing challenge for physician scientists.
Clinical Relevance
Impaired wound healing is associated with considerable morbidity and mortality in the United States. The methods discussed in this review are aimed at developing novel, data-driven approaches to augment wound healing through cell-based therapeutics.
Background
The complex nature of wound healing, even without overt pathology, is such that the number of potential factors which would need to be studied in order to draw robust conclusions is typically greater than that routinely evaluated using single-gene or single-protein measurement techniques such as quantitative polymerase chain reaction (qPCR) and Western blots. Furthermore, the dynamic nature of the wound healing process is such that tracking any one variable in isolation may be insufficient to capture the dependencies underlying the overt physiologic processes.
Recent technological advances have helped ameliorate this dilemma by permitting the simultaneous capture of large numbers of variables. Most notably, the advent of the DNA microarray in the late 1990s made it possible to interrogate the expression levels of tens of thousands of genes.5 This technology has become so ubiquitous that scientists are now compelled by most major journals to share their data on the Internet, and there are currently more than one million chips publicly available.6,7
However, in the last several years, it has become increasingly evident that the granularity afforded by traditional population-based assays such as the DNA microarray may be insufficient to capture the complex relationships in heterogeneous samples such as those associated with wound healing and stem cell biology.8,9 Several emerging technologies have recently become available that permit high-throughput single-cell gene expression analysis in a manner that provides novel insights into the relationships of complex tissue.10–12
Discussion of Findings and Relevant Literature
DNA microarray technology
Microarray technology was first applied to gene expression analysis in the early 1990s, utilizing high-density arrays prepared by high-speed robotic printing of microliter levels of specific complementary DNA (cDNA) sequences known as probes.5 This technology enables the parallel detection of hybridization between sample genomic data and tens of thousands of probes constituting a cDNA library, which can effectively cover all genes in the human or mouse genome.13 The accuracy of this technique relies on the ability to pool large quantities of messenger RNA (mRNA) from thousands of cells in order to ensure adequate coverage across all probes. At present, the most common application of microarrays is to compare the gene expression patterns between two or more tissue samples, and numerous analytical methods have been developed to facilitate the extraction of biologically meaningful information from the large volumes of data generated.14,15
DNA microarray provides a valuable tool for studying wound repair and regeneration, particularly in small animals, for which it is generally feasible to extract small tissue samples.16 It has been used for numerous applications, such as comparing differentially expressed genes in keloids and normal skin,17,18 as well as studying burns in small and large animal models.19,20 Microarray-based methods may be used to compare the changes in gene expression over time throughout the wound healing process,21,22 as well as to study these differences in wounds from various stages of early fetal development.23,24 In addition, a microarray provides a ready means for evaluating the composition of engineered skin substitutes after implantation and for gathering information about the associated biological processes.25,26
Despite the overwhelming success of microarray technology, it has become increasingly clear in the last several years that the granularity afforded by such traditional population-averaging techniques is often insufficient to capture the complex patterns inherent in heterogeneous populations (Fig. 1). Since these approaches rely on pooling together mRNA from hundreds of thousands of cells and reporting aggregate expression levels, significant variations attributable to subpopulations within samples are undetectable. This is particularly concerning for rare, dynamic cell types as observed with stem-cell-mediated regeneration or cancer biology, and these concerns have become increasingly obvious.8,9,27 Given the intrinsic heterogeneity of wound beds, particularly with regard to the time-related oscillations of inflammatory mediators, it is reasonable to assume that many differences may exist that are below the detection threshold afforded by mass cell analysis.28 It is likely that more precise measurement tools will be required to capture the true variability in such systems.
Figure 1.

Limitations of mass cell analysis. Consider a theoretical tissue sample consisting of five individual cells, represented by black circles, for which the mRNA content of one specific gene (gray) is measured. Using population-averaging techniques, such as traditional microarray analysis, all mRNA are pooled together, from all five or 5 million cells, and the aggregate expression level is reported. This approach is useful for studying relatively homogeneous data (left) however, for heterogeneous populations (right), as commonly observed in cancer biology and stem cells, where different cell types may have unique expression patterns, such an approach can lead to considerable information loss. mRNA, messenger RNA.
Advantages of single-cell analysis
There are numerous situations in which being able to study gene or protein expression in individual cells rather than for aggregate populations would be advantageous. In the most basic case of phenotypic heterogeneity, such as a mixed population containing unknown fractions of inflammatory cells, it is impossible to accurately ascribe expression levels to specific cell types without complex deconvolution algorithms that rely on external data sources. However, if our observations were specific to single cells or even single cell groups, we could extract comparative data that would enhance our understanding of the aggregate tissue in question, namely by precisely understanding the transcriptome of every constituent cell in that tissue. Furthermore, even within populations typically thought of as containing only one cell type, recent evidence has suggested that specific sub-populations may exist in meta-states, which function in concert to maintain a stable but adaptable population equilibrium.27,29,30 In such situations, it is desirable to study the effects of various treatments or other external stimuli on the behavior of specific subpopulations to obtain information that cannot be inferred by simply examining the aggregate effects on the parent population.
Given these concerns, it is not surprising that lower-throughput techniques such as single-cell qPCR and single-cell microarray have become valuable companions to traditional DNA microarray experiments.31,32 However, the former is a time-intensive technique that is not scalable to large numbers of genes, and the latter, although capable of simultaneously evaluating the expression of thousands of genes, requires considerable global mRNA amplification which introduces significant noise in the resulting measurements.33 Furthermore, considering the stochastic nature of transcription and translation,34,35 which can themselves introduce variability in excess of two-fold expression change, it is often necessary to study individual cells in larger numbers in order to account for the underlying temporal variation.36 Higher-throughput methods such as immunohistochemistry and fluorescent activated cell sorting (FACS) are viable alternatives that can simultaneously evaluate thousands and millions of cells, respectively. However, both techniques are severely limited in the number of genes or proteins that may be simultaneously interrogated.
Single-cell gene expression analysis using microfluidics
Microfluidic large-scale integration technology, or microfluidics,37 refers to devices in which thousands of integrated fluid channels, valve control surfaces, and reagent/reservoir chambers are used to perform massively parallel quantitative PCR reactions—all contained on a 12 cm×8 cm plastic chip (Fig. 2). This novel technology allows for large-scale rapid characterization of transcriptional profiles from single cells with the ability to prepare thousands of reactions in <1 h.38 In addition, the sensitivity of the technology exceeds that of standard qPCR, thereby allowing for single molecules of cDNA to be detected in volumes a thousand times smaller than are traditionally required for qPCR reactions.39 Furthermore, the use of synthesized RNA standards for each gene allows for quantification of RNA copy number expressed by each cell in the analysis.9 The other strength of this approach is the number of cells that can be interrogated quickly. Figure 3, adapted from Glotzbach et al., outlines the procedure.40 Briefly, a single cell is sorted into each well of a 96-well plate that has been preloaded with reverse-transcription polymerase chain reaction (RT-PCR) reagents (reverse transcriptase enzyme and primers for each gene target) using FACS. A low-cycle RT-PCR pre-amplification step creates cDNA for each gene target within each individual cell. Single-cell cDNA is then loaded onto the microfluidics chip along with the primer-probe sets for the gene targets. A BioMark machine (Fluidigm, South San Francisco, CA) performs qPCR for each cell across all 48 or 96 gene targets in parallel, resulting in 2,304 or 9,216 data points for each chip run. This approach is highly flexible; it can be used to analyze any cell population that can be prepared as a single-cell suspension and stained with FACS antibodies. By using commercially available primer-probe sets, the efficiency and fidelity of the process is very high.
Figure 2.
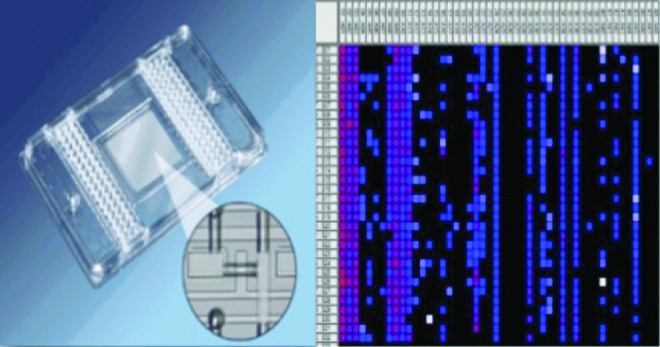
Microfluidic large-scale integration technology. Microfluidics refers to chips that possess thousands of integrated microfluidic channels, micro-mechanical valve surfaces, and reagent/reservoir chambers (left), permitting single-cell analysis across 48 or 96 genes (right). Each square represents single-cell transcriptomes by qPCR. Source chip provided by Fluidigm (South San Francisco, CA). qPCR, quantitative polymerase chain reaction. To see this illustration in color, the reader is referred to the web version of this article at www.liebertpub.com/wound
Figure 3.

Singe cell gene expression analysis using microfluidics. High-throughput single-cell transcriptional analysis using a microfluidic-based approach. Single cells are sorted by FACS in each well of a 96-well plate that has been pre-loaded with reverse-transcriptase PCR reagents and primers for each gene of interest. After a low-cycle preamplification, cDNA for each gene of interest across each individual cell is loaded onto the microfluidics chip along with the primer for each gene of interest. The microfluidic large-scale integration chip then performs parallel qPCR reactions for all gene targets across all cells, producing a complex array of gene expression data, which is initially displayed as a heatmap. Using a novel bioinformatics-based computational analysis, the single-cell data are clustered based on gene expression patterns across the individual cells, which allows clustering of cells with similar transcriptional profiles. Adapted from Glotzbach et al.40 cDNA, complementary DNA; FACS, fluorescent activated cell sorting. To see this illustration in color, the reader is referred to the web version of this article at www.liebertpub.com/wound
Up to this point, high-throughput, high-resolution single-cell transcriptional analysis has been elusive. A single-cell microarray requires significant pre-amplification in order to generate sufficient cDNA for detection with the array, which increases the probability of errors (amplification of random noise within the sample).41 In addition, the high cost and labor-intensive process of a single-cell microarray makes the analysis of a large number of cells difficult using this method.42 Other array-based methods, such as oligonucleotide arrays, have similar limitations.43 Laser capture microdissection has the capability to isolate a single type of cell from a fixed tissue sample,44 but requires pooling of mRNA from all the isolated cells before applying microarray analysis of gene expression.45 In order to overcome these shortcomings, the microfluidic-based approach described earlier analyzes hundreds of cells from a given population in a quantitative fashion, which allows thorough characterization of the gene expression profiles within a group of cells. Furthermore, the highly covariate nature of these data allows us to infer more complex distance metrics based on multivariate inference,46 which permits a more sophisticated analysis of heterogeneity and subpopulations as described next.40
Applications
Heterogeneity analysis
Although recent studies have increasingly employed technologies for analyzing gene expression within individual cells,9,42,47,48 these investigations demonstrate significant variations in gene expression across individual cells, making it clear that this transcriptional heterogeneity must be addressed in order to adequately describe a cell population.49,50 High-throughput microfluidic technology may provide an ideal tool for examining the relationship between stochastic variations of gene expression within individual cells and heterogeneous transcriptional profiles across a population of cells (Fig. 4).
Figure 4.

A transcriptional distribution-based model of population homogeneity. Given the noisiness inherent to transcription, an individual cell will exhibit a variable transcriptional signature if measured precisely over time (A). A cell population can be considered “homogeneous” if all individual cell transcriptomes are governed by identical steady-state probability functions (i.e., all cells are drawn from a single probability field). It follows that the transcriptional fingerprint of a homogeneous population measured at a single timepoint (B) should, through the transcriptional states of all individual cells, recapitulate the single distribution observed for any one cell measured across multiple time points (A). By contrast, if the distribution of individual cell transcriptomes from a population at a single timepoint (D) more closely reflects that of two (or more) independent probability functions (C), then the population may be designated as heterogeneous. Adapted from Glotzbach et al.40 To see this illustration in color, the reader is referred to the web version of this article at www.liebertpub.com/wound
In 2011, we employed a microfluidic-based approach to examine the transcriptional variability within a well-studied and putatively homogenous population of hematopoietic stem cells (HSCs).40 We proposed that establishing the homogeneity of a given population, Pn, was equivalent to demonstrating that no set of subpopulations P′1∪P′2∪…∪P′s=Pn exists for which the observed data (T1,…Tn) would be more likely to have arisen from their joint probability distribution than from Pn itself. We then used Akaike Information Criterion, a common information theoretic metric of data consistency, to demonstrate that the variability observed within this population of more than 300 cells was above that expected based on random variation at a level observed through background sampling of the dataset (Fig. 5). Thus, despite the common functional attributes of the HSCs in this population, significant transcriptional differences were detectable and could be used to delineate subpopulations on the basis of gene expression patterns.
Figure 5.

A multivariate, information-theoretic approach permits characterization of patterns in higher-order correlated gene expression. (A) Hierarchical clustering of simultaneous expression of 43 genes among 300 individual hematopoietic stem cells. Gene expression is presented as fold change from median on a color scale from yellow (high expression, 32-fold above median) to blue (low expression, 32-fold below median). (B) Iterative application of Akaike Information Criterion (with a second-order correction for small sample sizes57) to determine optimal clustering parameters. An exhaustive approach was used to determine the information loss (z-axis) associated with different permutations of the number of clusters (y-axis) and the fuzziness coefficient (x-axis). The trough of the three dimensional plot (gray asterisk) represents the optimal set of clustering parameters for the given data set that will minimize theoretical information loss. (C) Fuzzy c-means clustering of HSC single-cell transcriptional data using the optimal clustering parameters (three clusters and a fuzziness coefficient of 1.05). For visual simplicity, only a subset of the most significant genes is displayed. Adapted from Glotzbach et al. 2011.40 To see this illustration in color, the reader is referred to the web version of this article at www.liebertpub.com/wound
Given the ability of microfluidic-based single-cell gene expression analysis to detect heterogeneity within such a well-defined, highly purified population, it is reasonable to assume that an even stronger signal would be clearly detectable in the considerably more heterogeneous wound tissue. Furthermore, it is likely that the state of the healing wound could, in theory, be tracked according to the quantifiable heterogeneity within its tissue as it evolves over time. One would expect the heterogeneity of the wound bed to decrease monotonically (on a macro-scale) over time, as the native healing mechanisms compensate for the disturbances to normal physiology. Perhaps, though monitoring the temporal evolution of heterogeneity, it would be possible to observe a breakpoint between the processes accompanying normal wound healing and those associated with chronic or non-healing wounds. This is simply one extension of transcriptional analysis that is made possible by the resolution of high-throughput single-cell gene expression profiling.
Subpopulation discovery
If a population of cells is, in fact, heterogeneous, as defined earlier, it follows that there exists some set of subpopulations whose distribution explains the observed variability in the parent population. Although the mathematical demonstration of heterogeneity in a dataset is a somewhat straightforward endeavor, it is a much more difficult task to establish the precise identity of optimal subpopulations. That is, one can demonstrate that a given set of subpopulations better explain the observed variability than the single-population hypothesis, but it is considerably less straightforward to determine the optimal set of subpopulations which maximally explains this variability. This is due to the current technological limitations of microfluidic-based single-cell analysis techniques, which restrict the maximum number of gene targets to 96. As such, our confidence in the best distribution of cells into subpopulations is only as good as our belief in the representative sampling of these genes. Nevertheless, the prospect of discovering novel subpopulations that may exhibit traits different from their parent tissue is highly attractive, particularly for cancer biology, where tumor heterogeneity has been linked to relapse after chemotherapy.51
In 2011, Dalerba et al. used microfluidic-based single-cell gene expression analysis to examine the transcriptional heterogeneity of human colon cancer tumors.52 They showed that colon cancer tissues contained distinct cell populations whose transcriptional identities mirrored those of the different cellular lineages of the normal colon. Standard hierarchical clustering was employed in conjunction with principal component analysis, and dendrograms were used to delineate subpopulations on the basis of similar expression patterns. They used this information to develop two-gene classifier systems that predicted clinical outcomes with superior hazard ratios compared with standard pathological grades and comparable to microarray-derived multi-gene expression signatures.52
In addition to cancer biology, subpopulation discovery is widely applicable for the study of stem cell populations,53,54 and this approach may also hold considerable potential for wound healing. Although the entire wound bed is likely to be too heterogeneous for meaningful discernment of subpopulations, isolation of individual cell types based on surface antigen expression would provide an ideal situation for single-cell analysis to determine the identity and behavior of subgroups. Examining the evolving vasculature of nascent wound beds, for example, would be possible through selection of endothelial markers such as CD31, and could potentially provide insights into the roles of various candidate progenitor cell types that may facilitate the formation of new blood vessels.
Subpopulation enrichment
Once an advantageous subpopulation has been identified, it would be desirable to prospectively isolate cells belonging to that population for further in vitro or in vivo analysis. However, current cell sorting technologies do not allow for the separation of cells on the basis of mRNA content, but rather require that we identify differential surface antigen profiles with which to distinguish among subpopulations using FACS. The obvious goal then is to correlate transcriptional programs with expression of surface proteins, and to identify specific surface proteins whose presence can disambiguate among multiple (transcriptionally defined) subgroups. Given two subpopulations with differential clinical efficacy, for example, it would be highly desirable to enrich one population over the other in order to optimize treatment strategies. Unfortunately, simply a brute-force evaluation of all possible combinations of the nearly 400 known surface markers55 would require more FACS sorts than there are atoms in the universe, suggesting the need for a more intelligent heuristic.
In 2011, Levi et al. employed supervised machine learning in conjunction with microfluidic-based single-cell gene expression analysis to enrich a subpopulation of human adipose-derived progenitor cells with enhanced capacity for osteogenic differentiation.56 Transcriptionally defined subpopulations were identified among adipose-derived stem cells based on expression of 30 osteogenic and stemness genes, and roughly 15% of these cells clustered into a single subpopulation whose gene expression profile was determined to be highly pro-osteogenic. The authors used a linear discriminate analysis to identify a minimal set of genes whose expression patterns were sufficient to distinguish the desired subpopulation from other cells in the parent population. They then ran several additional microfluidic experiments comparing the expression of this minimal gene set against that of a panel of candidate surface markers in order to identify transcriptional correlations which might be predictive of protein-level associations on the cell surface (Fig. 6). One surface marker, Endoglin (CD105), was identified whose expression would heavily enrich cells in the desired subpopulation. This association was verified using FACS, and the differential efficacy of these cells was confirmed through subsequent in vitro and in vivo osteogenic assays.
Figure 6.

LDA for isolation of transcriptionally defined subpopulations. Given a set of transcriptionally defined subpopulations, or clusters, one is designated as the “cluster of interest” (COI), and the remaining clusters are combined into one aggregate group referred to simply as nCOI. LDA is applied to the 48- or 96-dimensional gene expression data from cells in each class (COI and nCOI) to determine those genes whose expression patterns maximally differ between these two groups. By exploiting the covariate nature of our data, LDA is capable of identifying not only individual genes but also gene combinations with maximum differentiating capacity. This is achieved through an iterative process, with each pass evaluating one specific combination of genes, and we employ a step-wise implementation of the Wilks lambda cost function (F-value thresholds of 2 and 1 to add or remove a gene) to guide selection of gene combinations and reduce computational load. For each gene set, COI and nCOI cells are compared based on their expression of the specific subset of genes (1). In a simplified three gene case, this would correspond to examining spheres (individual cells) in three space, where each axis corresponds to a single gene (2). LDA determines the plane that maximally separates cells of one group from the other, described by a separation function corresponding to a weighted sum of the expressions of each selected gene. In the general case (n genes), this is equivalent to maximizing binary separation in n space, and the partition function assumes the form of a linear hyperplane. ROC analysis is employed to evaluate the appropriateness of the partition function (2). The end result of a “trained” LDA is a feature subset (generally 8–10 genes) and a corresponding partition function. The partition function provides a heuristic for the classification of future (unknown) cells on the basis solely of expression of genes in this subset (3). In order to evaluate the efficacy of various surface markers, additional microfluidic single-cell analyses are then performed on a parallel sample of cells. Here, the microfluidic chip will be modified to interrogate those genes selected by our LDA, with the remaining genes replaced by candidate surface markers drawn from the known pool of CD genes (4). The gene set for each new chip will consist of a small set of known genes from the LDA, and the remaining targets comprise candidate surface markers, with the resulting data evaluated first solely on the basis of the LDA-defined genes. The partition function (previously determined) is then used to classify each new cell as either COI or nCOI on the basis of expression of these known genes. Once each cell has been classified as either COI or nCOI, the expression profiles of the remaining genes are then compared for these two groups, again using LDA. Here, LDA is used to identify those surface marker genes whose expression is best able to distinguish these two groups (5). Adapted from Levi et al.56 CD, cluster differentiating; COI, cluster of interest; LDA, linear discriminant analysis; ROC, receiver operating characteristic. To see this illustration in color, the reader is referred to the web version of this article at www.liebertpub.com/wound
The success of Levi et al.56 provides a clear blueprint for the application of high-throughput single-cell gene expression analysis to not only describe complex cell populations, but also facilitate the extraction of beneficial components for therapeutic applications.
Integration with microarray analysis
As we have seen, single-cell analysis offers many advantages compared with traditional microarray-based methods. These two approaches may also be used in tandem to leverage the broad net cast by microarray's exhaustive gene cataloguing with the increased granularity afforded by a microfluidic-based single-cell analysis to more comprehensively characterize tissue samples. A microarray screen of all 20,000 genes in a target tissue can, in conjunction with a thorough literature review, serve as a blueprint in selecting an optimal gene panel for subsequent single-cell interrogation, thereby enhancing the yield of such gene-limited assays. High-throughput single-cell analysis can also serve as a validation tool to corroborate the results of microarray experiments through an evaluation of differential gene expression using high-resolution measurements, and moreover, this approach will also provide new information about the homogeneity of cells in each tissue relative to the global gene expression patterns observed across samples, thus lending insight into the underlying cellular mechanisms.
We recently used DNA microarray technology in conjunction with gene enrichment and pathway analysis to demonstrate that focal adhesion kinase (FAK) links mechanical force to skin fibrosis through inflammatory signaling in cutaneous tissue injury.28 In this analysis, we were able to identify several subsets of genes that were up-regulated in murine wounds loaded with mechanical strain after 6 and 14 days after injury (Fig. 7A–C). Although these differences suggested significant alterations in the transcriptional programs of cells in cutaneous wounds under stress, it was not clear whether these differences were the result of global patterns in gene expression common to all keratinocytes, or rather changes in expression among a critical subset of cells linking inflammation and fibrosis.
Figure 7.

Integrating microarray and singe cell gene expression data. (A–C) Wild-type wounds at day 6 (±48 h loading) and day 14 post-injury (±10 days loading) were analyzed using a microarray. (A) Hierarchical clustering of 1,046 differentially expressed genes (day 6=189 genes, day 14=847 genes, both day 6 and 14=73 genes). Rows=genes; columns=samples (n=4/group). Yellow and blue indicate up- and down-regulation, respectively. (B) Gene ontology categories significantly altered by loading. Number of genes/category italicized. (C) Ingenuity Pathways Analysis-constructed transcriptome networks. Solid=direct; dashed=indirect interactions; orange=internetwork connections. Adapted from Wong et al. 28 (D) Hierarchical clustering of simultaneous expression of 46 genes among 310 keratinocytes from FAK-knockout (left) and wild-type (right) mice evaluated using a microfluidic-based single-cell gene expression analysis. Gene expression is presented as a fold change from the median on a color scale from yellow (high expression, 32-fold above median) to blue (low expression, 32-fold below median). (E) Optimal fuzzy c-means clustering of single-cell transcriptional data using three clusters. Although cluster 2 is divided evenly between cell groups, clusters 1 and 3 are comprised almost entirely of FAK-knockout and wild type keratinocytes, respectively. FAK, focal adhesion kinase. To see this illustration in color, the reader is referred to the web version of this article at www.liebertpub.com/wound
To differentiate between these two mechanisms, we applied a microfluidic-based single-cell analysis as described earlier. Specifically, we examined cultured keratinocytes from wild-type and FAK-knockout mice using a panel of genes selected based on our microarray findings (Fig. 7D). In addition to the clear absence of FAK mRNA (Ptk2) among cells from knockout mice, we observed significant differences in the expression of numerous genes related to inflammation and mechanotransduction, including Itga6, Itga8, and Col4a1. We applied cluster analysis to evaluate whether these differences were limited to select keratinocytes subgroups and found that, with the exception of a small subset of cells common to both wild-type and FAK-knockout mice, the majority of cells were clearly separable based on transcriptional programs (Fig. 7E). These results suggest that our earlier microarray findings represent global changes across all keratinocytes rather than a mechanoresponsive subset.
Potential clinical applications
Although at present high-throughput single-cell gene expression analysis tools are used primarily for research purposes, these methods could easily be extended to develop predictive and diagnostic tools for wound analysis. As discussed earlier, heterogeneity assessment is one key form of evaluation afforded by this technology, and if it were possible to correlate transcriptional heterogeneity in a wound bed with outcomes such as time to closure or propensity to recur, such a tool could be used clinically for risk stratification and directed intervention. Likewise, given the ability of this technology to identify transcriptionally defined subpopulations, if the ratios of wound subgroups could be associated clinically with recidivism or other outcomes (presumably through supervised machine learning), then the detection of such cells in patient samples could be used for diagnostic purposes. Although the overhead in deploying this technology for such applications would not be insignificant, given the magnitude of the healthcare costs associated with chronic and non-healing wounds, such a strategy may, nevertheless, be attractive.
Summary
DNA microarray has proven widely successful for the analysis of gene expression from tissue and cell culture samples, and remains the gold standard for large-scale transcriptional interrogations. However, the recent advent of high-resolution single-cell gene expression analysis techniques provides a viable alternative for more precise measurements with the unique ability to assess heterogeneity, identify subpopulations, and develop novel protocols for the prospective isolation of subgroups. While this methodology has gained considerable traction in fields such as stem cell biology and radiation oncology, its applications for wound healing have remained limited. Nevertheless, the intrinsically heterogeneous nature of injured tissue, in conjunction with its temporal dynamics, should make wound repair and tissue regeneration an attractive target for high-throughput single-cell analysis.
Take-Home Messages.
The complex nature of wound healing requires simultaneous evaluation of numerous cells to adequately capture its spatiotemporal dynamics.
DNA microarray is the gold standard for transcriptional analysis, but may be insufficient for rare and complex cell types such as those seen in wound healing and cancer biology.
High-resolution single-cell gene expression analysis provides several marked advantages compared with traditional microarray analysis.
Predictive and diagnostic tools that take advantage of the increased granularity afforded by single-cell technologies have the potential to reduce healthcare costs and improve the quality of wound care.
Abbreviations and Acronyms
- CD
cluster differentiating
- cDNA
complementary DNA
- COI
cluster of interest
- FACS
fluorescent activated cell sorting
- FAK
focal adhesion kinase
- HSCs
hematopoietic stem cells
- LDA
linear discriminant analysis
- mRNA
messenger RNA
- qPCR
quantitative polymerase chain reaction
- ROC
receiver operating characteristic
- RT-PCR
reverse-transcription polymerase chain reaction
Author Disclosure and Ghostwriting
No competing financial interests exist. The content of this article was expressly written by the authors listed. No ghostwriters were used to write this article.
About the Authors
Dr. Geoffrey C. Gurtner is a Professor of Surgery and Materials Science Engineering at Stanford University. He also serves as the Associate Chairman for Research in the Department of Surgery. Dr. Gurtner completed a general surgery residency at the Massachusetts General Hospital, a plastic surgery residency at the NYU School of Medicine, and received advanced training in microsurgery at the University of Texas M.D. Anderson Cancer Center. He is the author of more than 120 peer-reviewed publications in both the scientific and surgical literature. He is an Editor for two major text books in the field: Grabb & Smith's Plastic Surgery and Plastic Surgery (Third Edition). Dr. Gurtner runs an NIH and DoD-funded laboratory that seeks to understand the importance of physical stimuli (mechanical and chemical) in the human response to injury. This has led to the development of novel technologies in a wide variety of clinical areas. Dr. Michael Januszyk is a post-doctoral research fellow in Dr. Gurtner's laboratory and is currently pursuing a PhD in Biomedical Informatics at Stanford University. His research interests focus on characterizing the heterogeneity inherent in adult stem cell populations in order to improve their efficacy for intraoperative therapy.
References
- 1.Bauer SM. Bauer RJ. Velazquez OC. Angiogenesis, vasculogenesis, and induction of healing in chronic wounds. Vasc Endovasc Surg. 2005;39:293. doi: 10.1177/153857440503900401. [DOI] [PubMed] [Google Scholar]
- 2.Boulton AJ. Vileikyte L. Ragnarson-Tennvall G. Apelqvist J. The global burden of diabetic foot disease. Lancet. 2005;366:1719. doi: 10.1016/S0140-6736(05)67698-2. [DOI] [PubMed] [Google Scholar]
- 3.Gurtner GC. Werner S. Barrandon Y. Longaker MT. Wound repair and regeneration. Nature. 2008;453:314. doi: 10.1038/nature07039. [DOI] [PubMed] [Google Scholar]
- 4.Tentolouris N. Al-Sabbagh S. Walker MG. Boulton AJ. Jude EB. Mortality in diabetic and nondiabetic patients after amputations performed from 1990 to 1995: a 5-year follow-up study. Diabetes Care. 2004;27:1598. doi: 10.2337/diacare.27.7.1598. [DOI] [PubMed] [Google Scholar]
- 5.Schena M. Shalon D. Davis RW. Brown PO. Quantitative monitoring of gene expression patterns with a complementary DNA microarray. Science. 1995;270:467. doi: 10.1126/science.270.5235.467. [DOI] [PubMed] [Google Scholar]
- 6.Barrett T. Troup DB. Wilhite SE. Ledoux P. Evangelista C. Kim IF. Tomashevsky M. Marshall KA. Phillippy KH. Sherman PM. Muertter RN. Holko M. Ayanbule O. Yefanov A. Soboleva A. NCBI GEO: archive for functional genomics data sets—10 years on. Nucleic Acids Res. 2011;39:D1005. doi: 10.1093/nar/gkq1184. [DOI] [PMC free article] [PubMed] [Google Scholar]
- 7.Edgar R. Domrachev M. Lash AE. Gene expression omnibus: NCBI gene expression and hybridization array data repository. Nucleic Acids Res. 2002;30:207. doi: 10.1093/nar/30.1.207. [DOI] [PMC free article] [PubMed] [Google Scholar]
- 8.Walling MA. Shepard JR. Cellular heterogeneity and live cell arrays. Chem Soc Rev. 2011;40:4049. doi: 10.1039/c0cs00212g. [DOI] [PubMed] [Google Scholar]
- 9.Warren L. Bryder D. Weissman IL. Quake SR. Transcription factor profiling in individual hematopoietic progenitors by digital RT-PCR. Proc Natl Acad Sci USA. 2006;103:17807. doi: 10.1073/pnas.0608512103. [DOI] [PMC free article] [PubMed] [Google Scholar]
- 10.Lee PJ. Hung PJ. Rao VM. Lee LP. Nanoliter scale microbioreactor array for quantitative cell biology. Biotechnol Bioeng. 2006;94:5. doi: 10.1002/bit.20745. [DOI] [PubMed] [Google Scholar]
- 11.Ottesen EA. Hong JW. Quake SR. Leadbetter JR. Microfluidic digital PCR enables multigene analysis of individual environmental bacteria. Science. 2006;314:1464. doi: 10.1126/science.1131370. [DOI] [PubMed] [Google Scholar]
- 12.Whitesides GM. The origins and the future of microfluidics. Nature. 2006;442:368. doi: 10.1038/nature05058. [DOI] [PubMed] [Google Scholar]
- 13.Pollack JR. Perou CM. Alizadeh AA. Eisen MB. Pergamenschikov A. Williams CF. Jeffrey SS. Botstein D. Brown PO. Genome-wide analysis of DNA copy-number changes using cDNA microarrays. Nat Genet. 1999;23:41. doi: 10.1038/12640. [DOI] [PubMed] [Google Scholar]
- 14.Subramanian A. Tamayo P. Mootha VK. Mukherjee S. Ebert BL. Gillette MA. Paulovich A. Pomeroy SL. Golub TR. Lander ES. Mesirov JP. Gene set enrichment analysis: a knowledge-based approach for interpreting genome-wide expression profiles. Proc Natl Acad Sci USA. 2005;102:15545. doi: 10.1073/pnas.0506580102. [DOI] [PMC free article] [PubMed] [Google Scholar]
- 15.Tusher VG. Tibshirani R. Chu G. Significance analysis of microarrays applied to the ionizing radiation response. Proc Natl Acad Sci USA. 2001;98:5116. doi: 10.1073/pnas.091062498. [DOI] [PMC free article] [PubMed] [Google Scholar]
- 16.Wong DJ. Chang HY. Learning more from microarrays: insights from modules and networks. J Invest Dermatol. 2005;125:175. doi: 10.1111/j.0022-202X.2005.23827.x. [DOI] [PubMed] [Google Scholar]
- 17.Chen W. Fu X. Sun X. Sun T. Zhao Z. Sheng Z. Analysis of differentially expressed genes in keloids and normal skin with cDNA microarray. J Surg Res. 2003;113:208. doi: 10.1016/s0022-4804(03)00188-4. [DOI] [PubMed] [Google Scholar]
- 18.Smith JC. Boone BE. Opalenik SR. Williams SM. Russell SB. Gene profiling of keloid fibroblasts shows altered expression in multiple fibrosis-associated pathways. J Invest Dermat. 2008;128:1298. doi: 10.1038/sj.jid.5701149. [DOI] [PMC free article] [PubMed] [Google Scholar]
- 19.Price JA. Rogers JV. McDougal JN. Shaw MQ. Reid FM. Kiser RC. Graham JS. Gene expression analysis of bromine-induced burns in porcine skin. Toxicol Lett. 2008;82:69. doi: 10.1016/j.toxlet.2008.08.007. [DOI] [PubMed] [Google Scholar]
- 20.Xing D. Liu L. Marti GP. Zhang X. Reinblatt M. Milner SM. Harmon JW. Hypoxia and hypoxia-inducible factor in the burn wound. Wound Repair Regen. 2011;19:205–213. doi: 10.1111/j.1524-475X.2010.00656.x. [DOI] [PMC free article] [PubMed] [Google Scholar]
- 21.Dayem MA. Moreilhon C. Turchi L. Magnone V. Christen R. Ponzio G. Barbry P. Early gene expression in wounded human keratinocytes revealed by DNA microarray analysis. Comp Funct Genomics. 2003;4:47. doi: 10.1002/cfg.239. [DOI] [PMC free article] [PubMed] [Google Scholar]
- 22.Greco JA., 3rd Pollins AC. Boone BE. Levy SE. Nanney LB. A microarray analysis of temporal gene expression profiles in thermally injured human skin. Burns. 2010;36:192. doi: 10.1016/j.burns.2009.06.211. [DOI] [PMC free article] [PubMed] [Google Scholar]
- 23.Chen W. Fu X. Ge S. Sun T. Zhou G. Han B. Li H. Sheng Z. Profiling of genes differentially expressed in a rat of early and later gestational ages with high-density oligonucleotide DNA array. Wound Repair Regen. 2007;15:147. doi: 10.1111/j.1524-475X.2006.00195.x. [DOI] [PubMed] [Google Scholar]
- 24.Colwell AS. Longaker MT. Peter Lorenz H. Identification of differentially regulated genes in fetal wounds during regenerative repair. Wound Repair Regen. 2008;16:450. doi: 10.1111/j.1524-475X.2008.00383.x. [DOI] [PubMed] [Google Scholar]
- 25.Klingenberg JM. McFarland KL. Friedman AJ. Boyce ST. Aronow BJ. Supp DM. Engineered human skin substitutes undergo large-scale genomic reprogramming and normal skin-like maturation after transplantation to athymic mice. J Invest Dermatol. 2010;130:587. doi: 10.1038/jid.2009.295. [DOI] [PubMed] [Google Scholar]
- 26.Lammers G. Gilissen C. Nillesen ST. Uijtdewilligen PJ. Wismans RG. Veltman JA. Daamen WF. van Kuppevelt TH. High density gene expression microarrays and gene ontology analysis for identifying processes in implanted tissue engineering constructs. Biomaterials. 2010;31:8299. doi: 10.1016/j.biomaterials.2010.07.055. [DOI] [PubMed] [Google Scholar]
- 27.Gupta PB. Fillmore CM. Jiang G. Shapira SD. Tao K. Kuperwasser C. Lander ES. Stochastic state transitions give rise to phenotypic equilibrium in populations of cancer cells. Cell. 2011;146:633. doi: 10.1016/j.cell.2011.07.026. [DOI] [PubMed] [Google Scholar]
- 28.Wong VW. Rustad KC. Akaishi S. Sorkin M. Glotzbach JP. Januszyk M. Nelson ER. Levi K. Paterno J. Vial IN. Kuang AA. Longaker MT. Gurtner GC. Focal adhesion kinase links mechanical force to skin fibrosis via inflammatory signaling. Nat Med. 2012;18:148. doi: 10.1038/nm.2574. [DOI] [PMC free article] [PubMed] [Google Scholar]
- 29.Chang HH. Hemberg M. Barahona M. Ingber DE. Huang S. Transcriptome-wide noise controls lineage choice in mammalian progenitor cells. Nature. 2008;453:544. doi: 10.1038/nature06965. [DOI] [PMC free article] [PubMed] [Google Scholar]
- 30.MacArthur BD. Please CP. Oreffo RO. Stochasticity and the molecular mechanisms of induced pluripotency. PLoS One. 2008;3:e3086. doi: 10.1371/journal.pone.0003086. [DOI] [PMC free article] [PubMed] [Google Scholar]
- 31.Esumi S. Wu SX. Yanagawa Y. Obata K. Sugimoto Y. Tamamaki N. Method for single-cell microarray analysis and application to gene-expression profiling of GABAergic neuron progenitors. Neurosci Res. 2008;60:439. doi: 10.1016/j.neures.2007.12.011. [DOI] [PubMed] [Google Scholar]
- 32.Yamamura S. Kishi H. Tokimitsu Y. Kondo S. Honda R. Rao SR. Omori M. Tamiya E. Muraguchi A. Single-cell microarray for analyzing cellular response. Anal Chem. 2005;77:8050. doi: 10.1021/ac0515632. [DOI] [PubMed] [Google Scholar]
- 33.Subkhankulova T. Gilchrist MJ. Livesey FJ. Modelling and measuring single cell RNA expression levels find considerable transcriptional differences among phenotypically identical cells. BMC Genomics. 2008;9:268. doi: 10.1186/1471-2164-9-268. [DOI] [PMC free article] [PubMed] [Google Scholar]
- 34.Cai L. Friedman N. Xie XS. Stochastic protein expression in individual cells at the single molecule level. Nature. 2006;440:358–362. doi: 10.1038/nature04599. [DOI] [PubMed] [Google Scholar]
- 35.Golding I. Paulsson J. Zawilski SM. Cox EC. Real-time kinetics of gene activity in individual bacteria. Cell. 2005;123:1025. doi: 10.1016/j.cell.2005.09.031. [DOI] [PubMed] [Google Scholar]
- 36.Zhong JF. Chen Y. Marcus JS. Scherer A. Quake SR. Taylor CR. Weiner LP. A microfluidic processor for gene expression profiling of single human embryonic stem cells. Lab Chip. 2008;8:68. doi: 10.1039/b712116d. [DOI] [PMC free article] [PubMed] [Google Scholar]
- 37.Thorsen T. Maerkl SJ. Quake SR. Microfluidic large-scale integration. Science. 2002;298:580. doi: 10.1126/science.1076996. [DOI] [PubMed] [Google Scholar]
- 38.Melin J. Quake SR. Microfluidic large-scale integration: the evolution of design rules for biological automation. Annu Rev Biophys Biomol Struct. 2007;36:213. doi: 10.1146/annurev.biophys.36.040306.132646. [DOI] [PubMed] [Google Scholar]
- 39.Marcus JS. Anderson WF. Quake SR. Microfluidic single-cell mRNA isolation and analysis. Anal Chem. 2006;78:3084. doi: 10.1021/ac0519460. [DOI] [PubMed] [Google Scholar]
- 40.Glotzbach JP. Januszyk M. Vial IN. Wong VW. Gelbard A. Kalisky T. Thangarajah H. Longaker MT. Quake SR. Chu G. Gurtner GC. An information theoretic, microfluidic-based single cell analysis permits identification of subpopulations among putatively homogeneous stem cells. PLoS One. 2011;6:e21211. doi: 10.1371/journal.pone.0021211. [DOI] [PMC free article] [PubMed] [Google Scholar]
- 41.Zhang J. Byrne CD. Differential priming of RNA templates during cDNA synthesis markedly affects both accuracy and reproducibility of quantitative competitive reverse-transcriptase PCR. Biochem J. 1999;337(Pt 2):231. [PMC free article] [PubMed] [Google Scholar]
- 42.Ramos CA. Bowman TA. Boles NC. Merchant AA. Zheng Y. Parra I. Fuqua SA. Shaw CA. Goodell MA. Evidence for diversity in transcriptional profiles of single hematopoietic stem cells. PLoS Genet. 2006;2:e159. doi: 10.1371/journal.pgen.0020159. [DOI] [PMC free article] [PubMed] [Google Scholar]
- 43.Hartmann CH. Klein CA. Gene expression profiling of single cells on large-scale oligonucleotide arrays. Nucleic Acids Res. 2006;34:e143. doi: 10.1093/nar/gkl740. [DOI] [PMC free article] [PubMed] [Google Scholar]
- 44.Chiang MK. Melton DA. Single-cell transcript analysis of pancreas development. Dev Cell. 2003;4:383. doi: 10.1016/s1534-5807(03)00035-2. [DOI] [PubMed] [Google Scholar]
- 45.Caretti E. Devarajan K. Coudry R. Ross E. Clapper ML. Cooper HS. Bellacosa A. Comparison of RNA amplification methods and chip platforms for microarray analysis of samples processed by laser capture microdissection. J Cell Biochem. 2008;103:556. doi: 10.1002/jcb.21426. [DOI] [PubMed] [Google Scholar]
- 46.Bozdogan H. Sclove SL. Multisample cluster analysis using Akaike's Information Criterion. Ann Inst Statist Math. 1984;36:163. [Google Scholar]
- 47.Elowitz MB. Levine AJ. Siggia ED. Swain PS. Stochastic gene expression in a single cell. Science. 2002;297:1183. doi: 10.1126/science.1070919. [DOI] [PubMed] [Google Scholar]
- 48.Levsky JM. Shenoy SM. Pezo RC. Singer RH. Single-cell gene expression profiling. Science. 2002;297:836. doi: 10.1126/science.1072241. [DOI] [PubMed] [Google Scholar]
- 49.Levsky JM. Singer RH. Gene expression and the myth of the average cell. Trends Cell Biol. 2003;13:4. doi: 10.1016/s0962-8924(02)00002-8. [DOI] [PubMed] [Google Scholar]
- 50.Raaijmakers MH. Scadden DT. Divided within: heterogeneity within adult stem cell pools. Cell. 2008;135:1006. doi: 10.1016/j.cell.2008.11.034. [DOI] [PubMed] [Google Scholar]
- 51.Donnenberg VS. Donnenberg AD. Multiple drug resistance in cancer revisited: the cancer stem cell hypothesis. J Clin Pharmacol. 2005;45:872. doi: 10.1177/0091270005276905. [DOI] [PubMed] [Google Scholar]
- 52.Dalerba P. Kalisky T. Sahoo D. Rajendran PS. Rothenberg ME. Leyrat AA. Sim S. Okamoto J. Johnston DM. Qian D. Zabala M. Bueno J. Neff NF. Wang J. Shelton AA. Visser B. Hisamori S. Shimono Y. van de Wetering M. Clevers H. Clarke MF. Quake SR. Single-cell dissection of transcriptional heterogeneity in human colon tumors. Nat Biotechnol. 2011;29:1120. doi: 10.1038/nbt.2038. [DOI] [PMC free article] [PubMed] [Google Scholar]
- 53.Gu M. Nguyen PK. Lee AS. Xu D. Hu S. Plews JR. Han L. Huber BC. Lee WH. Gong Y. de Almeida PE. Lyons J. Ikeno F. Pacharinsak C. Connolly AJ. Gambhir SS. Robbins RC. Longaker MT. Wu JC. Microfluidic single-cell analysis shows that porcine induced pluripotent stem cell-derived endothelial cells improve myocardial function by paracrine activation. Circulation Res. 2012;111:882. doi: 10.1161/CIRCRESAHA.112.269001. [DOI] [PMC free article] [PubMed] [Google Scholar]
- 54.Stahlberg A. Andersson D. Aurelius J. Faiz M. Pekna M. Kubista M. Pekny M. Defining cell populations with single-cell gene expression profiling: correlations and identification of astrocyte subpopulations. Nucleic Acids Res. 2011;39:e24. doi: 10.1093/nar/gkq1182. [DOI] [PMC free article] [PubMed] [Google Scholar]
- 55.Zola H. Swart B. Nicholson I. Aasted B. Bensussan A. Boumsell L. Buckley C. Clark G. Drbal K. Engel P. Hart D. Horejsi V. Isacke C. Macardle P. Malavasi F. Mason D. Olive D. Saalmueller A. Schlossman SF. Schwartz-Albiez R. Simmons P. Tedder TF. Uguccioni M. Warren H. CD molecules 2005: human cell differentiation molecules. Blood. 2005;106:3123. doi: 10.1182/blood-2005-03-1338. [DOI] [PubMed] [Google Scholar]
- 56.Levi B. Wan DC. Glotzbach JP. Hyun J. Januszyk M. Montoro D. Sorkin M. James AW. Nelson ER. Li S. Quarto N. Lee M. Gurtner GC. Longaker MT. CD105 protein depletion enhances human adipose-derived stromal cell osteogenesis through reduction of transforming growth factor beta1 (TGF-beta1) signaling. J Biol Chem. 2011;286:39497. doi: 10.1074/jbc.M111.256529. [DOI] [PMC free article] [PubMed] [Google Scholar]
- 57.Burnham Kp. Anderson DR. Model Selection and Multimodal Inference: A Practical Information-Theoretic Approach. New York: Springer Science; 1998. [Google Scholar]