

Abstract
Objective:
The aims of this study were to examine executive dysfunction using an antisaccade (AS) task in normal elderly (NE) and patients with mild cognitive impairment (MCI) and Alzheimer disease (AD) as well as to evaluate the relationship between AS performance and cortical thinning within AD-associated regions.
Methods:
We recorded eye movements in 182 subjects (NE: 118; MCI: 36; AD: 28) during an AS task. We also performed neuropsychological measures of executive function for comparison. Brain MRI scans were collected on most subjects, and cortical thickness was determined in 9 regions known to exhibit atrophy in AD dementia (“AD signature”). We investigated the relationships between AS and neuropsychological performance, as well as possible correlations between AS performance and cortical thickness.
Results:
AS performance in MCI resembled that in NE; subjects with AD were impaired relative to both MCI and NE. In all subjects, AS performance correlated with neuropsychological measures of executive function, even after controlling for disease severity. In the subjects with MCI but not in NE, cortical thickness in frontoparietal AD signature regions correlated with AS performance.
Conclusions:
The AS task is a useful measure of executive function across the AD spectrum. In MCI, AS performance may reflect disease burden within cortical brain regions involved in oculomotor control; however, AS impairments in NE may have etiologies other than incipient AD.
Normal aging results in cognitive changes that frequently fall within the realm of executive function (EF)1 and may indicate an increased risk of neurodegenerative disease. Precise measurements that illuminate mechanisms of EF changes find use as new tools for assessing cognitive decline.
One candidate measurement is the antisaccade (AS) task, a test of inhibitory control. Performance on this task is strongly correlated with neuropsychological tests of EF in multiple diseases, including schizophrenia2–4 and dementias such as Alzheimer disease (AD) and frontotemporal degeneration.5,6 AS performance is controlled by a well-described frontoparietal cortical network7–9; normal elderly (NE) with impaired AS performance have impaired EF and subtle structural alterations in this network.10 Because the AS task is sensitive to presymptomatic neurodegeneration in other diseases,11 we hypothesized NE with impaired AS performance might have presymptomatic AD or a related disorder.
Individuals with mild cognitive impairment (MCI) have clear cognitive deficits but are able to maintain their function in activities of daily living.12 A diagnosis of MCI indicates decline in one or more cognitive domains, usually memory, but sometimes including executive dysfunction.13 The development of executive dysfunction in amnestic MCI is associated with conversion to AD dementia, suggesting that processes reflected by EF may help compensate for other cognitive deficits in the setting of neurodegeneration.14 We hypothesized that AS performance in MCI would reflect the severity of EF impairment and underlying AD pathology and would be associated with reduced cortical gray matter thickness in brain “AD signature” regions.15
METHODS
Subjects.
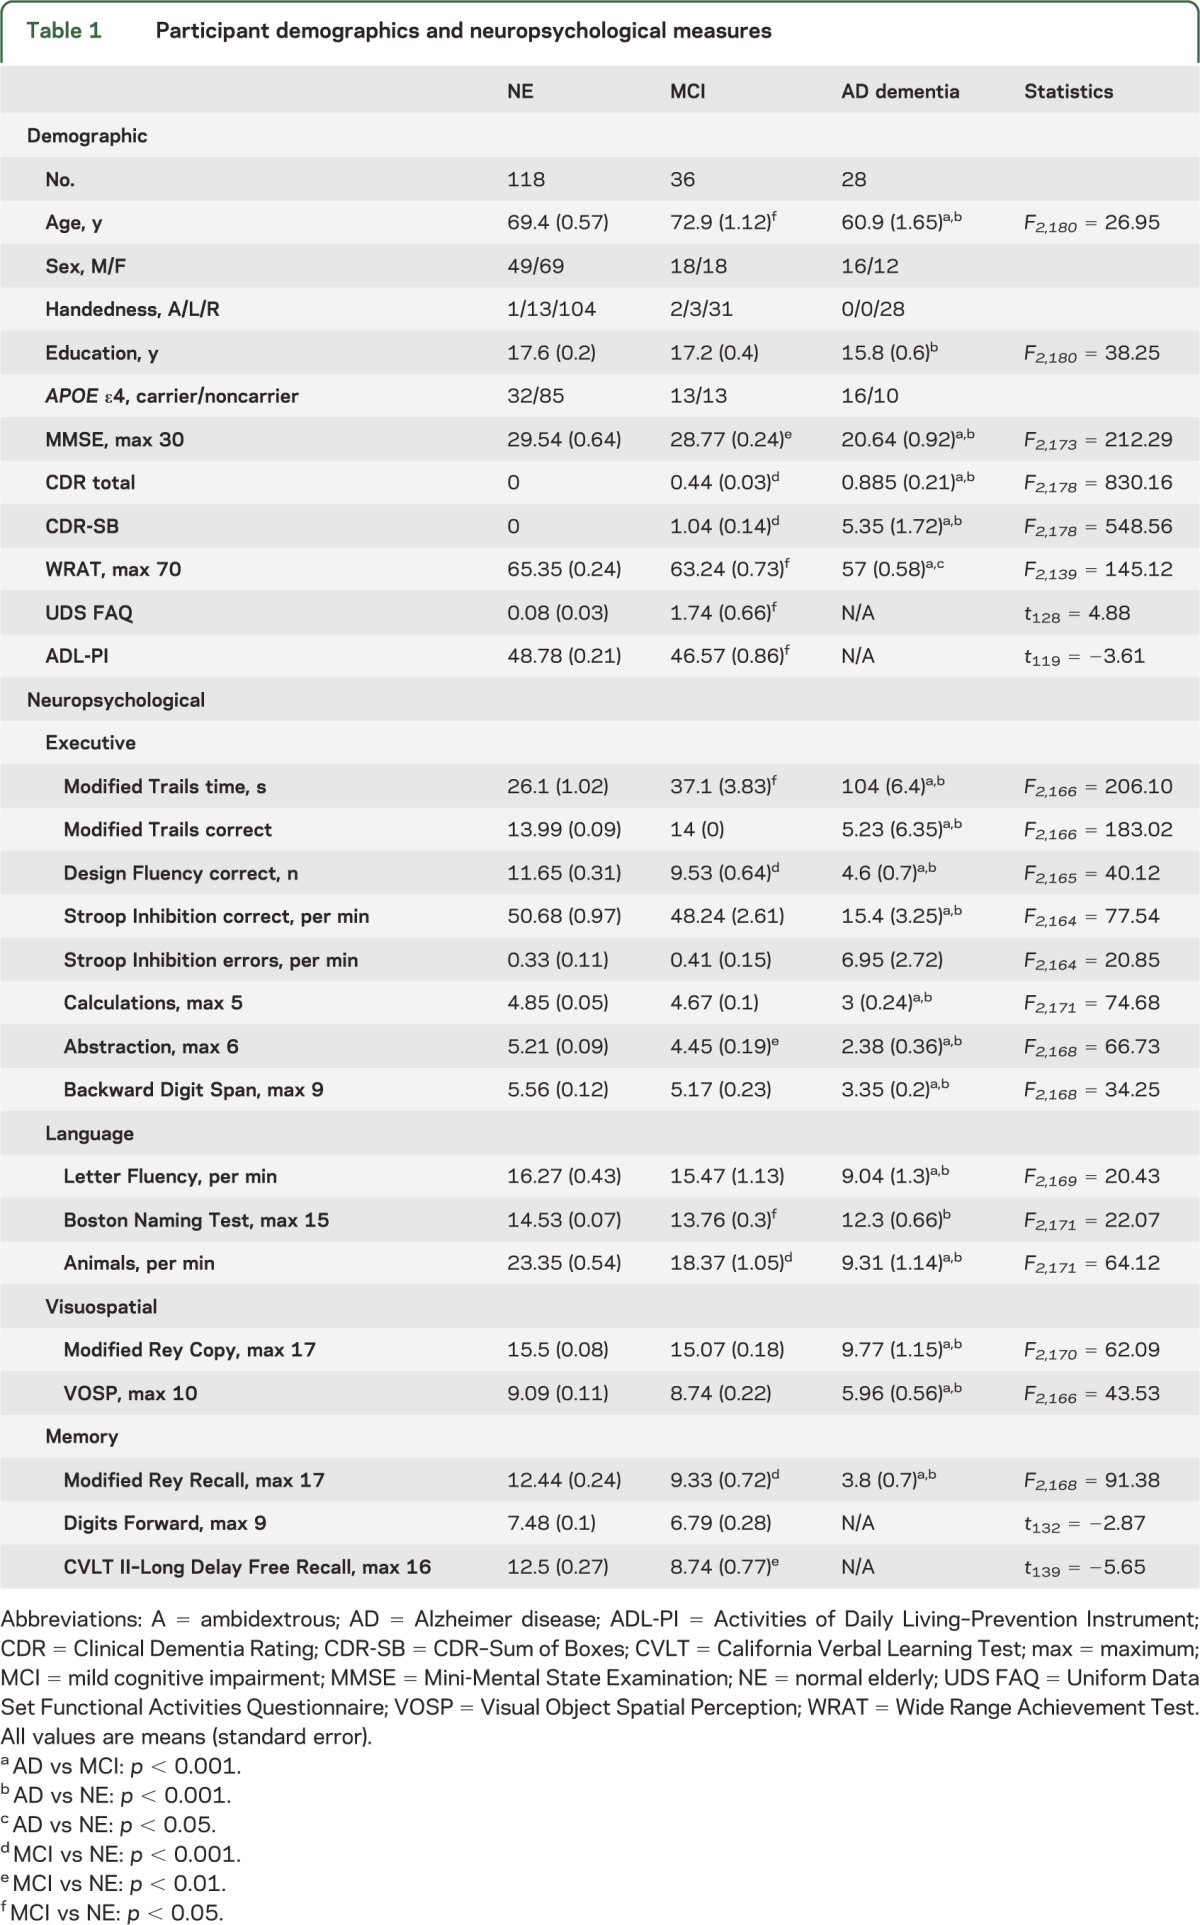
One hundred eighty-two voluntary subjects (aged 48–86 years; 83 male, 99 female) were evaluated at the University of California, San Francisco (UCSF) Memory and Aging Center. All subjects underwent neurologic examinations, neuropsychological testing, and eye movement measurements. Additionally, most subjects had MRI scans of their brains. Subjects were divided into 3 diagnostic groups based on their neurologic status: cognitively NE (n = 118), patients with MCI (n = 36), and patients with AD dementia (n = 28). APOE ε4 genotypes were determined as previously described.16 Demographic information is shown in table 1.
Table 1.
Participant demographics and neuropsychological measures
Standard protocol approvals, registrations, and patient consents.
All procedures were approved by the UCSF IRB, and written informed consent was obtained from all participants or using an IRB-approved surrogate consenting procedure (patients with AD).
Diagnoses.
NE were required to have no cognitive complaints, a Mini-Mental State Examination (MMSE)17 score ≥27, a Clinical Dementia Rating–Sum of Boxes (CDR-SB)18 score of zero, and a normal neurologic examination.
Subjects in the MCI group met at least 2 of the following criteria: a subjective cognitive complaint, a CDR-SB score of ≥0.5, and at least one neuropsychological test score >1.5 SDs below the age-adjusted norm. Overall CDR scores were 0 or 0.5. All subjects with MCI had received their diagnosis before enrollment.
Subjects with AD dementia met the National Institute of Neurological and Communicative Diseases and Stroke–Alzheimer’s Disease and Related Disorders Association probable criteria for AD.19 All subjects with AD had MMSE scores ≥12 (range 12–30; median 21) and CDR scores of 0.5 or 1. CDR-SB scores ranged from 2.0 to 9.0.
Eye movement recording and analysis.
Subjects were seated with their heads stabilized on a chinrest and shown visual targets (0.1°–0.3°) in a dim room. The movements of the right eye were recorded on a Dual Purkinje Image Eye Tracker (Fourward Technologies, Gallatin, MO) at 1,000 samples/s and low-pass filtered at 330 Hz.
All experiments used custom presentation software (Maestro, UCSF). As shown in figure 1A, the experiment began with a set of visually guided prosaccade trials. Each trial began with a central fixation point for a variable duration (1,000–2,500 milliseconds); eye position was measured for the last 1,000 milliseconds. After a 200-millisecond blank screen (gap), the target then appeared in an eccentric location (5° or 10° horizontally or vertically) and remained visible for 1,000 milliseconds. Subjects were instructed to look at the fixation point until it disappeared, then look at the eccentric target. Data were included for each condition if at least 8 responses were recorded.
Figure 1. Oculomotor experiments.
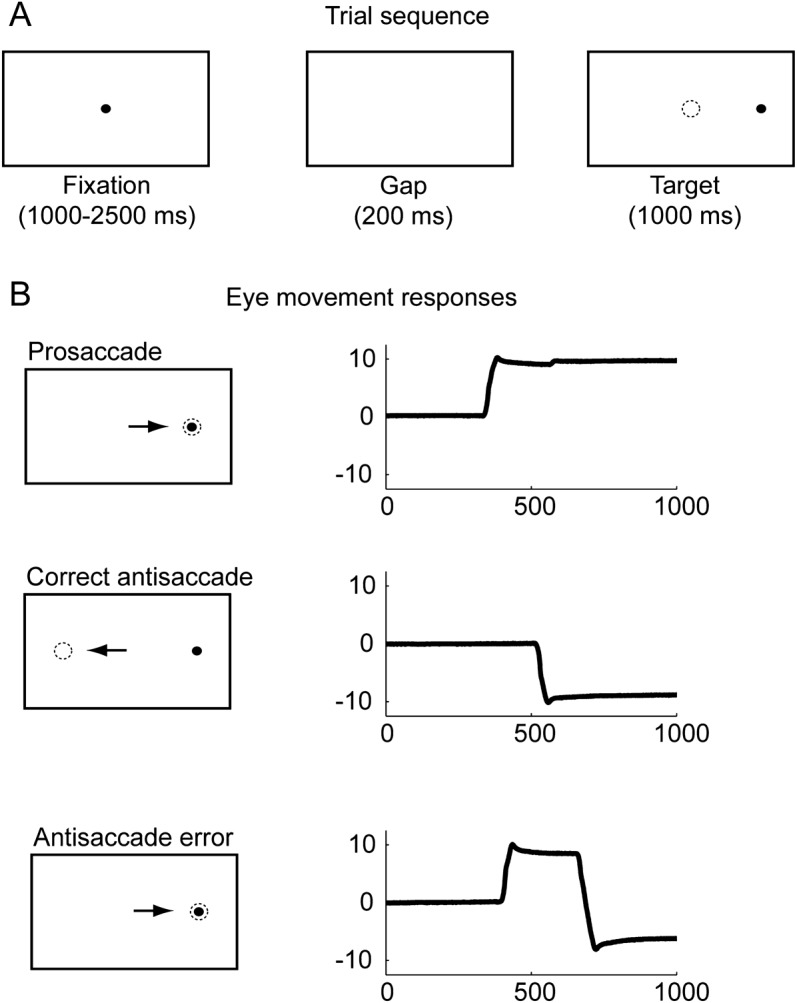
(A) Trial timing schematic. (B) Example responses. Bottom panel shows the eye movement response in a self-corrected error antisaccade trial; uncorrected error responses appear similar to prosaccades.
Next, a block of AS trials was presented. Each AS trial began with central fixation for 1,000 to 2,500 milliseconds, with eye position recorded for the final 1,000 milliseconds. After a 200-millisecond gap, a target appeared 10° left or right and remained lit for 1,000 milliseconds. Subjects were instructed to look at the target in the center then look in the opposite direction of the visual target, and to correct mistakes if they found themselves looking at the eccentric target. A minimum of 12 responses was required. Subjects verbally confirmed the instructions to demonstrate their understanding of the AS task.
Eye movement data were analyzed interactively offline using custom MATLAB code (MathWorks, Natick, MA). Saccade latencies were computed as the onset of the first eye movement after the eccentric target appeared. AS responses were considered correct if the first eye movement after eccentric target onset had an amplitude greater than 3° in the direction opposite the target, and self-corrected AS errors were defined as AS that occurred within 500 milliseconds of the initial response (figure 1B).
Neuropsychological and functional evaluation.
All subjects were administered a standardized comprehensive neuropsychological battery. Tests of general cognition and functional abilities included the MMSE and CDR. Neuropsychological tests of EF included a modified trail-making test of set-shifting,20 trial 1 of the Design Fluency subtest from the Delis-Kaplan Executive Function System,21 the Stroop Interference condition to test inhibition,20 the ability to perform 5 arithmetic calculations, and interpretation of 3 similarities and 3 proverbs (abstraction). Language skills were evaluated with the 15-item Boston Naming Test,22 phonemic fluency (number of D or H words in 1 minute), and category fluency (number of animals or vegetables in 1 minute). Visuospatial abilities were tested using the Number Location condition from the Visual Object Spatial Perception battery23 and a copy of a simplified version of the Rey-Osterrieth figure. Memory was assessed by a 10-minute recall of the simplified Rey-Osterrieth figure and the longest correct Forward Digit Span. The Functional Activities Questionnaire24 and Activities of Daily Living–Prevention Instrument25 were used to assess capacity for daily functioning. For group comparisons, subjects with missing data were excluded from the relevant analysis.
MRI scans.
MRI scans were obtained for 121 subjects on 1 of 3 scanners: a 1.5-tesla Magnetom VISION system (Siemens, Inc., Iselin, NJ) at the San Francisco VA Magnetic Resonance Unit (n = 8), a 3-tesla TIM Trio scanner (Siemens, Inc.) at the UCSF Neuroscience Imaging Center (n = 104), or a 4-tesla MedSpec system (Bruker AXS, Inc., Madison, WI) also at the San Francisco VA. To control for potential influences of scanner type, we performed our correlation analyses with and without scanner type as a covariate. No differences were seen; results reported here are without the covariate.
Using Freesurfer (version 5.1, http://surfer.nmr.mgh.harvard.edu/), we calculated cortical thickness in 9 regions of interest (ROIs) previously identified as showing cortical thinning in AD15; together, these ROIs form an AD signature. Hippocampal and amygdala structural volumes were also derived from Freesurfer and were normalized by total intracranial volume to control for potential correlation with head size.
Statistical analyses.
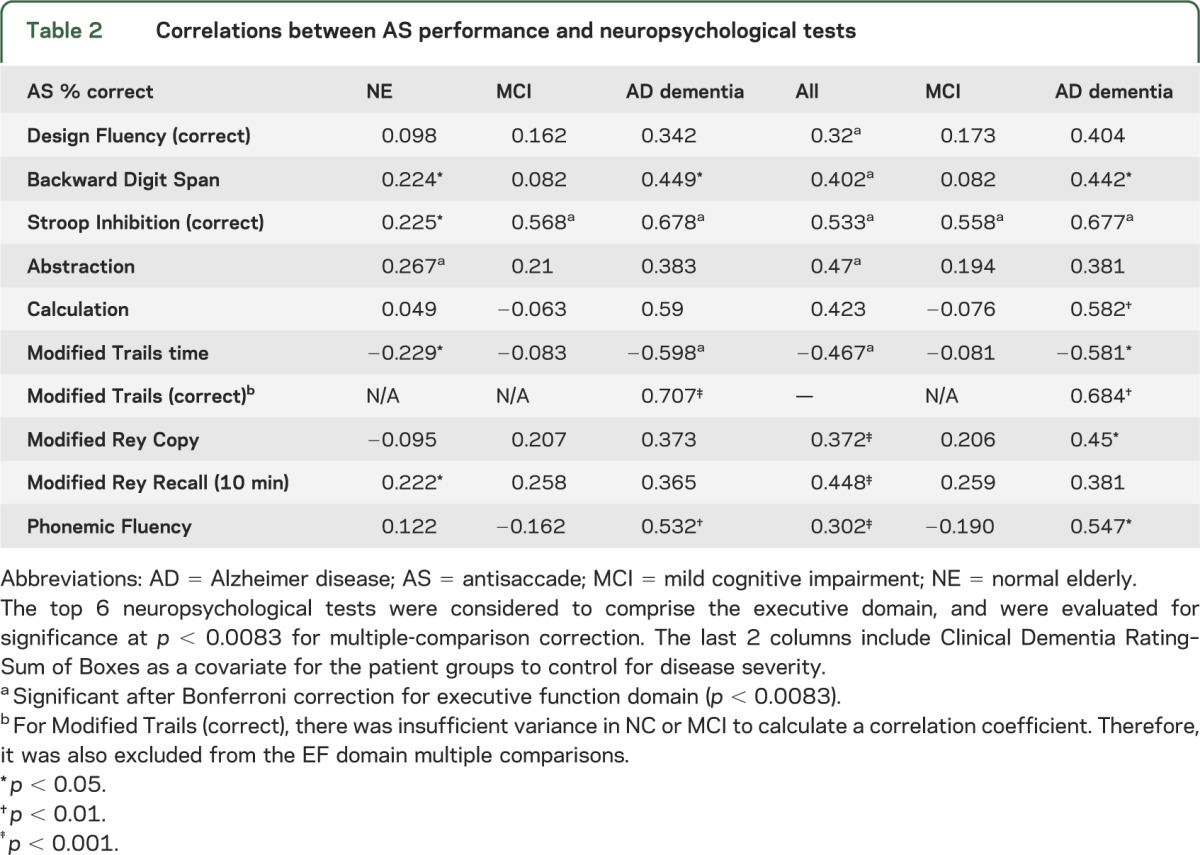
All analyses were performed using SPSS software (version 19.0; SPSS Inc., Chicago, IL). We compared group performance on neuropsychological tests and oculomotor measures using 1-way analyses of variance with Games-Howell corrections for multiple comparisons with unequal variance or Tukey B for equal variance. Where data were insufficient for one group (subjects with AD), independent t tests were used to compare MCI and NE. For all between-group comparisons, a p value of <0.05 after post hoc correction for multiple comparisons was considered significant. Bivariate correlations of AS performance with neuropsychological measures were performed within each group to assess the relationship of AS performance to more standard measures of cognitive function. To control for disease severity, in some analyses, correlations were also performed with the CDR-SB as a covariate for the MCI and AD cohorts. For tests of EF, we corrected for multiple comparisons with a Bonferroni correction; 6 neuropsychological tests (table 2) were considered to fall in the EF domain, so significance was evaluated at p = 0.05/6 = 0.0083. For correlations between AS performance and anatomical structure, we used a hierarchical approach. First, we hypothesized that AS performance was correlated with cortical atrophy within the AD signature regions, and tested this with bivariate correlations for each subject cohort and the study population as a whole. We then investigated which ROIs within the AD signature showed the strongest relationship with AS performance.
Table 2.
Correlations between AS performance and neuropsychological tests
RESULTS
Demographic characteristics of the subjects are shown in table 1. NE were slightly younger than MCI subjects (p = 0.019). Subjects with AD were younger (p < 0.001) than both NE and subjects with MCI, and less educated (p = 0.003) than NE. The subjects with MCI had similar MMSE scores to NE (p = 0.062), but were modestly impaired on functional assessments (Functional Activities Questionnaire and Activities of Daily Living–Prevention Instrument; p < 0.001). Individual MCI subjects showed impairments across multiple domains, but most (32/36; 88%) were classified as amnestic. Subjects with MCI were impaired relative to NE on neuropsychological tests of memory (California Verbal Learning Test II–Long Delay Free Recall, p < 0.001; Modified Rey-Osterreith Recall, p < 0.001) and EF (Modified Trails Time, p = 0.004; Design Fluency, p = 0.007; and Abstraction, p = 0.003). Patients with AD performed worse on all functional and neuropsychological measures than subjects with MCI and the NE.
Oculomotor responses.
Patients with AD were slower to initiate eye movements than either patients with MCI or the NE (p < 0.001 for both; figure 2A). Subjects with AD were also slower to respond during the AS task for both correct (p < 0.001; figure 2B left) and error (p < 0.001 vs NE; p = 0.078 vs MCI; figure 2B, right panel) responses.
Figure 2. Oculomotor group performance.

(A) Latency for horizontal prosaccades and (B) correct antisaccade responses, and incorrect (error) antisaccade responses for all subject groups. Brackets indicate significant between-group differences: *p < 0.01; **p < 0.001. (C) Antisaccade performance by group. Left panel is percentage correct, right is ASTotal (percentage of total trials performed correctly or self-corrected). Brackets indicate between-group differences: *p < 0.02; **p < 0.001. Individual data points have been distributed horizontally for visual clarity. Thick horizontal lines indicate median values; upper and lower boxes show the 25th and 75th percentiles. AD = Alzheimer disease; MCI = mild cognitive impairment; NE = normal elderly.
Both NE and MCI groups showed a wide range of performance on the AS task, from poor to excellent; surprisingly, the mean percentage of correct responses for the 2 groups was very similar (figure 2C, left panel). The patients with AD had a lower percentage of correct responses than both the NE and MCI groups (p < 0.001). All 3 groups spontaneously corrected error trials during the task, indicating that they understood the instructions. The metric “ASTotal” indicates the total percentage of trials either correctly performed or successfully self-corrected (figure 2C, right panel). Subjects with AD corrected a lower percentage of errors than either the subjects with MCI or the NE (p < 0.001).
AS performance and cognitive function.
In all subjects combined, the percentage of correct AS responses correlated with a variety of neuropsychological measures, most strongly tests of EF (table 2). Many of the correlations in MCI and AD groups were likely related to disease severity because controlling for CDR-SB diminished the effects. Overall, the strongest correlation was with the Stroop Inhibition test, even after controlling for CDR-SB and correcting for multiple comparisons. In NE, other measures of EF, including Backward Digit Span, time to complete the modified trails, and abstraction, were also correlated with AS performance. Subjects with MCI showed weak or no correlations with these measures, even controlling for disease severity. The same pattern of results was seen when education was included as a covariate (table e-1 on the Neurology® Web site at www.neurology.org) and when age was included. There were no relationships between AS performance and demographic factors such as education, handedness, or APOE ε4 carrier status. In MCI, there was a modest correlation between AS performance and age (r = 0.359, p = 0.037); however, over all subjects, there was no relationship with age.
Structural correlates of AS performance.
In a subset of subjects (90 NE, 19 MCI, and 12 AD) with available structural MRI data, we compared ROI measures, adjusted when necessary for total intracranial volume. As expected, hippocampal volumes were lower in both MCI and AD compared with NE (p < 0.001; figure e-1A), but did not differ between the 2 patient groups. Within an average of cortical AD signature ROIs,15 the 3 groups differed from each other (AD vs NE or MCI: p < 0.001; NE vs MCI: p = 0.012; figure e-1B), with MCI subjects exhibiting an intermediate level of cortical thickness between NE and AD. Looking within the individual ROIs comprising the cortical AD signature, subjects with AD had reduced cortical thickness compared with NE (table e-2). In most AD signature ROIs, subjects with MCI had higher cortical thickness than those with AD. In 2 ROIs, the inferior temporal gyrus and the supramarginal gyrus, cortical thickness was reduced in MCI compared with NE (p < 0.05).
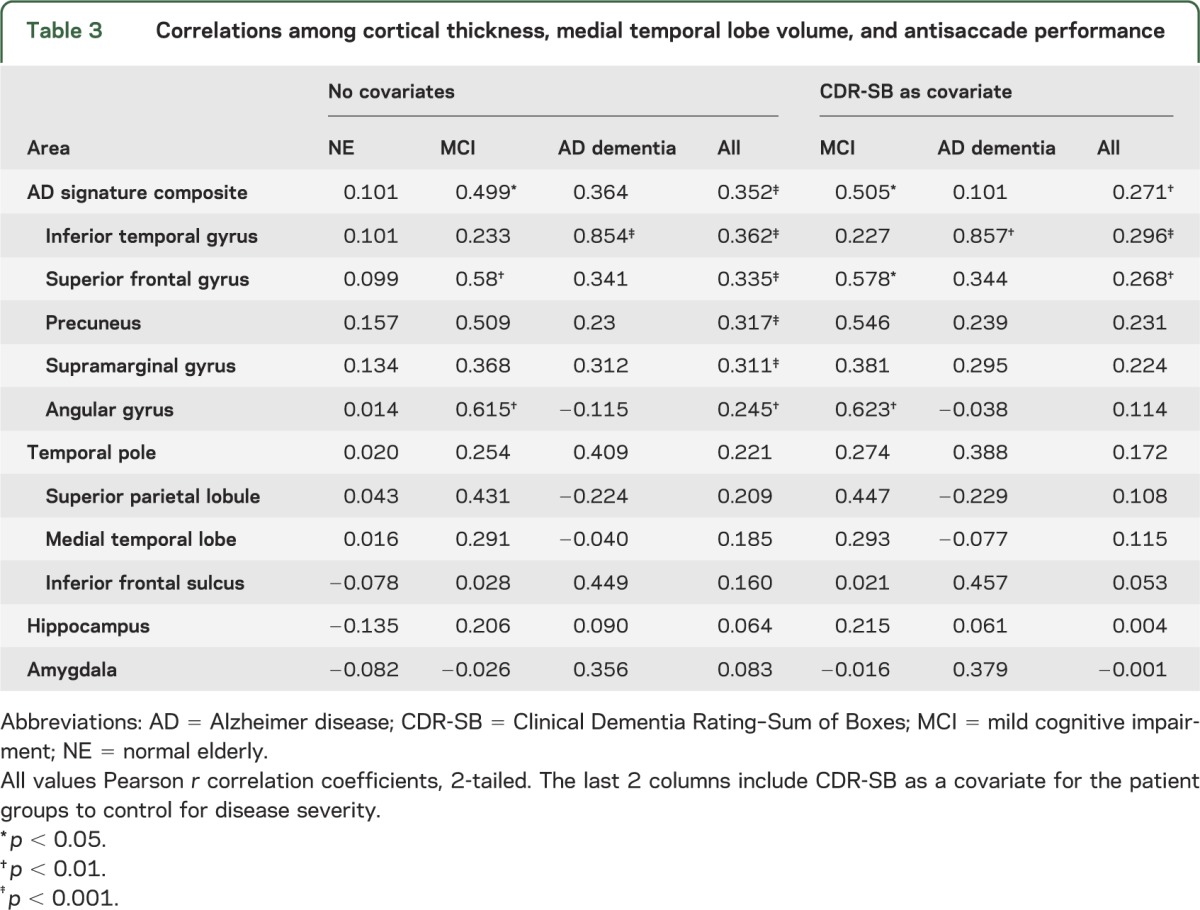
We hypothesized that the observed differences in cortical thickness could explain some of the variance in AS task performance. We first examined AD signature across all subjects and found that cortical thickness was correlated with the percentage of correct AS responses (r = 0.352, p < 0.001; table 3). When we split by diagnostic group, only the subjects with MCI showed a correlation between AD signature and AS percentage correct (r = 0.499, p < 0.05), although there were trends in both AD and NE. We next examined individual regions within the AD signature composite to investigate whether the effect was driven by differences in regional atrophy. Subjects with MCI showed strong associations between AS performance and cortical thickness in the superior frontal gyrus, the precuneus, and the angular gyrus (table 3). The same pattern of results held when controlling for disease severity using CDR-SB in the patient cohorts and when we added age and education as covariates. Subjects with AD only showed a strong correlation between AS performance and cortical thickness in the inferior temporal gyrus. There were no correlations between brain atrophy and AS performance in the NE group.
Table 3.
Correlations among cortical thickness, medial temporal lobe volume, and antisaccade performance
DISCUSSION
Surprisingly, performance on the AS task was similar for NE and subjects with MCI. Both groups exhibited a wide range of performance and on average performed better than subjects in the AD cohort. Across subjects, performance on the AS task maintained the expected relationship with other neuropsychological tests of EF, confirming the validity of the AS task as a measure of EF. In all subjects, even after controlling for disease severity, AS performance was strongly correlated with thinning in cortical AD signature regions but not the hippocampus or amygdala. The correlation between AD signature cortical thinning and AS performance was strongest in the subjects with MCI, suggesting that AS performance in this population may reflect the degree of AD pathology within the frontoparietal oculomotor network or in regions influencing network integrity. In the AD dementia group, there was a trend toward a correlation; however, the small sample size and greater cognitive impairment in this group may have limited our ability to evaluate this relationship because of floor effects. Thus, in patients with MCI, the AS task may be useful as a clinical measure of cortical AD burden; in patients with AD dementia, the overall level of impairment may limit the utility of the AS task as a measure.
Our results are consistent with previous studies of AS performance in NE and AD that demonstrated impaired performance in AS that correlated with disease severity and measures of EF.5,6,26 Our results are also similar to a previous study that used a bedside AS to demonstrate that subjects with MCI displayed intermediate levels of impairment between NE and AD.2 Although we found no difference in the percentage of correct AS trials between NE and MCI in this study, the mean score was numerically lower in MCI. Because the current study included a much larger sample of subjects with MCI with characteristic neuropsychological, functional, and medial temporal lobe atrophy findings (table 1, figure e-1, table e-1), we believe that the subtle differences in results may have arisen from differences in disease severity between the very small MCI group in the previous study and the larger group studied here, or from differences between the bedside AS task and the laboratory AS task used here. Because the bedside AS is performed in a lighted room with more visual distractors than the laboratory AS task, it may be more difficult for individuals with early AD pathology who have impaired attention or inhibitory control.
Our findings also confirm the relationship between cortical thinning in AD signature regions and EF in MCI seen in a previous study.27 In this patient group, we found that cortical thickness in the superior frontal gyrus ROI was strongly associated with EF as measured by the AS task. This ROI encompasses some of the oculomotor network nodes where AS performance has been correlated with gray matter volume in NE and in patients with AD dementia and frontotemporal degeneration,5,10 further supporting the hypothesis that alterations in AS performance reflect damage to the frontoparietal network underlying voluntary saccade control and EF.
In the patients with AD, there was a strong correlation between AS performance and cortical thinning in the inferior temporal gyrus but not in other AD signature ROIs. Because the inferior temporal gyrus is not believed to contain oculomotor network nodes, we speculate that this relationship could reflect the AS task's strong correlation with overall disease severity in AD dementia.5,6
Although a number of NE displayed poor AS performance, it did not correlate with AD signature cortical thinning. Because AD signature cortical thinning is correlated with CSF biomarkers of AD pathology in other studies of NE,28 these findings suggest that impaired AS performance in NE may have different etiologies than in incipient AD, such as alterations in white matter or age-related changes in dynamic network plasticity, that are also influenced by individuals' genotypes for a variety of synaptic genes expressed within the EF network.29 Alternatively, cortical thinning in AD signature regions may not be sensitive to the proximal causes of AS dysfunction in healthy elders because of some oculomotor network nodes falling outside of AD signature ROIs.10
Studies in patients with schizophrenia and their first-degree relatives suggest that AS performance is strongly influenced by genetic factors that predispose to schizophrenia.30,31 We hypothesize that such genetic factors might have a stronger influence on AS performance in NE than AD pathology as measured by cortical thinning. This implies that the AS task might be used to assess other biological factors that interact with incipient AD pathology to determine cognitive function particularly in healthy elderly individuals.
Supplementary Material
GLOSSARY
- AD
Alzheimer disease
- AS
antisaccade
- CDR-SB
Clinical Dementia Rating–Sum of Boxes
- EF
executive function
- MCI
mild cognitive impairment
- MMSE
Mini-Mental State Examination
- NE
normal elderly
- ROI
region of interest
- UCSF
University of California, San Francisco
Footnotes
Supplemental data at www.neurology.org
AUTHOR CONTRIBUTIONS
Dr. Heuer: design and conceptualization, experimental implementation, analysis and interpretation of the data, drafting and revision of the manuscript. Mr. Mirsky: design and conceptualization, preliminary analysis of the data, revision of the manuscript. Mr. Kong: data collection and analysis, drafting and revision of the manuscript. Dr. Dickerson: design of the study, analysis and interpretation of the data, revising the manuscript. Dr. Miller: design and conceptualization of the study, revising the manuscript. Dr. Kramer: analysis and interpretation of the data, revision of the manuscript. Dr. Boxer: design and conceptualization of the study, analysis and interpretation of the data, drafting and revising the manuscript.
STUDY FUNDING
Supported in part by NIH grants R01AG031278 and R01AG038791 to Dr. Boxer, as well as the Hellman Family Foundation, the John Douglas French Foundation, the Silicon Valley Foundation, and the Tau Research Consortium. Dr. Kramer was supported by NIH grant R01AG032289 and the Larry L. Hillblom Foundation. Dr. Dickerson's contribution was supported in part by AGP50-AG005134 and the Alzheimer's Association. The project described was supported by grant numbers P01AG019724 and P50AG023501 from NIH National Institute on Aging. The contents are solely the responsibility of the authors and do not necessarily represent the official views of the National Institute on Aging or the NIH.
DISCLOSURE
H. Heuer, J. Mirsky, and E. Kong report no disclosures. B. Dickerson is a consultant for Pfizer and En Vivo, Inc., and is funded by NIH grants P50-AG005134, R01-AG030311, R21-NS077059, and R21-MH097094 and the Alzheimer's Association. B. Miller serves as board member on The John Douglas French Alzheimer's Foundation, the Tau Consortium, Sagol School of Neuroscience, and the Larry L. Hillblom Foundation and serves as a consultant for TauRx, Ltd., Allon Therapeutics, and the Consortium for Frontotemporal Research. He has received institutional support from Novartis, and is funded by NIH grants P50AG023501, P01AG019724, and P50 AG1657303, and the state of California. J. Kramer is funded by NIH grant R01AG032289 and the Larry L. Hillblom Foundation. A. Boxer has been a consultant for Bristol-Myers Squibb, Genentech, Plexxikon, Phloronol, Registrat-Mapi, Accera, Archer, Envivo, Acetylon, Iperion, TauRx, Grifols, Neurophage, and Novartis. He has received research support from Allon Therapeutics, Bristol-Myers Squibb, Janssen, Forest, Pfizer, Medivation, and Genentech, and is funded by NIH grants R01AG038791 and R01AG031278, the John Douglas French Foundation, Alzheimer's Drug Discovery Foundation, the Association for Frontotemporal Degeneration, the Silicon Valley Foundation, the Agouron Institute, the Tau Research Consortium, and the Hellman Family Foundation. Go to Neurology.org for full disclosures.
REFERENCES
- 1.Grady CL. The cognitive neuroscience of aging. Nat Rev Neurosci 2012;13:491–505 [DOI] [PMC free article] [PubMed] [Google Scholar]
- 2.Hellmuth J, Mirsky J, Heuer HW, et al. Multi-center validation of a bedside anti-saccade task as a measure of executive function. Neurology 2012;78:1824–1831 [DOI] [PMC free article] [PubMed] [Google Scholar]
- 3.Reuter B, Rakusan L, Kathmanna N. Poor antisaccade performance in schizophrenia: an inhibition deficit? Psychiatry Res 2005;135:1–10 [DOI] [PubMed] [Google Scholar]
- 4.Hutton SB, Huddy V, Barnes TR, et al. The relationship between antisaccades, smooth pursuit, and executive dysfunction in first-episode schizophrenia. Biol Psychiatry 2004;56:553–559 [DOI] [PubMed] [Google Scholar]
- 5.Boxer AL, Garbutt S, Rankin KP, et al. Medial versus lateral frontal lobe contributions to voluntary saccade control as revealed by the study of patients with frontal lobe degeneration. J Neurosci 2006;26:6354–6363 [DOI] [PMC free article] [PubMed] [Google Scholar]
- 6.Garbutt S, Matlin A, Hellmuth J, et al. Oculomotor function in frontotemporal lobar degeneration, related disorders and Alzheimer's disease. Brain 2008;131(pt 5):1268–1281 [DOI] [PMC free article] [PubMed] [Google Scholar]
- 7.Munoz DP, Everling S. Look away: the anti-saccade task and the voluntary control of eye movement. Nat Rev Neurosci 2004;5:218–228 [DOI] [PubMed] [Google Scholar]
- 8.O'Driscoll GA, Alpert NM, Matthysse SW, Levy DL, Rauch SL, Holzman PS. Functional neuroanatomy of antisaccade eye movements investigated with positron emission tomography. Proc Natl Acad Sci USA 1995;92:925–929 [DOI] [PMC free article] [PubMed] [Google Scholar]
- 9.Ettinger U, Kumari V, Zachariah E, et al. Effects of procyclidine on eye movements in schizophrenia. Neuropsychopharmacology 2003;28:2199–2208 [DOI] [PubMed] [Google Scholar]
- 10.Mirsky J, Heuer HW, Jafari A, et al. Anti-saccade performance predicts executive function and brain structure in normal elders. Cogn Behav Neurol 2011;24:50–58 [DOI] [PMC free article] [PubMed] [Google Scholar]
- 11.Blekher T, Johnson SA, Marshall J, et al. Saccades in presymptomatic and early stages of Huntington disease. Neurology 2006;67:394–399 [DOI] [PubMed] [Google Scholar]
- 12.Petersen RC, Smith GE, Waring SC, Ivnik RJ, Tangalos EG, Kokmen E. Mild cognitive impairment: clinical characterization and outcome. Arch Neurol 1999;56:303–308 [DOI] [PubMed] [Google Scholar]
- 13.Kao AW, Eisenhut RJ, Martens LH, et al. A neurodegenerative disease mutation that accelerates the clearance of apoptotic cells. Proc Natl Acad Sci USA 2011;108:4441–4446 [DOI] [PMC free article] [PubMed] [Google Scholar]
- 14.Blacker D, Lee H, Muzikansky A, et al. Neuropsychological measures in normal individuals that predict subsequent cognitive decline. Arch Neurol 2007;64:862–871 [DOI] [PubMed] [Google Scholar]
- 15.Dickerson BC, Bakkour A, Salat DH, et al. The cortical signature of Alzheimer's disease: regionally specific cortical thinning relates to symptom severity in very mild to mild AD dementia and is detectable in asymptomatic amyloid-positive individuals. Cereb Cortex 2009;19:497–510 [DOI] [PMC free article] [PubMed] [Google Scholar]
- 16.Agosta F, Vossel KA, Miller BL, et al. Apolipoprotein E epsilon4 is associated with disease-specific effects on brain atrophy in Alzheimer's disease and frontotemporal dementia. Proc Natl Acad Sci USA 2009;106:2018–2022 [DOI] [PMC free article] [PubMed] [Google Scholar]
- 17.Folstein MF, Folstein SE, McHugh PR. “Mini-Mental State”: a practical method for grading the cognitive state of patients for the clinician. J Psychiatr Res 1975;12:189–198 [DOI] [PubMed] [Google Scholar]
- 18.Morris JC. The Clinical Dementia Rating (CDR): current version and scoring rules. Neurology 1993;43:2412–2414 [DOI] [PubMed] [Google Scholar]
- 19.McKhann G, Drachman D, Folstein M, Katzman R, Price D, Stadlan E. Clinical diagnosis of Alzheimer disease: report of the NINCDS-ARDA Work Group under the auspices of Department of Health and Human Services Task Force on Alzheimer's Disease. Neurology 1984;34:939–944 [DOI] [PubMed] [Google Scholar]
- 20.Kramer JH, Jurik J, Sha SJ, et al. Distinctive neuropsychological patterns in frontotemporal dementia, semantic dementia, and Alzheimer disease. Cogn Behav Neurol 2003;16:211–218 [DOI] [PubMed] [Google Scholar]
- 21.Delis DC, Kaplan EB, Kramer JH. The Delis-Kaplan Executive Function System. San Antonio: The Psychological Corporation; 2001 [Google Scholar]
- 22.Kaplan E, Goodglass H, Wintraub S. The Boston Naming Test. Philadelphia: Lea & Febiger; 1983 [Google Scholar]
- 23.Warrington EK, James M. The Visual Object and Space Perception Battery. Bury St Edmunds: Thames Valley Test Company; 1991 [Google Scholar]
- 24.Pfeffer RI, Kurosaki TT, Harrah CH, Jr, Chance JM, Filos S. Measurement of functional activities in older adults in the community. J Gerontol 1982;37:323–329 [DOI] [PubMed] [Google Scholar]
- 25.Galasko D, Bennett DA, Sano M, Marson D, Kaye J, Edland SD. ADCS Prevention Instrument Project: assessment of instrumental activities of daily living for community-dwelling elderly individuals in dementia prevention clinical trials. Alzheimer Dis Assoc Disord 2006;20(suppl 3):S152–S169 [DOI] [PubMed] [Google Scholar]
- 26.Shafiq-Antonacci R, Maruff P, Masters C, Currie J. Spectrum of saccade system function in Alzheimer disease. Arch Neurol 2003;60:1272–1278 [DOI] [PubMed] [Google Scholar]
- 27.Dickerson BC, Wolk DA. Dysexecutive versus amnesic phenotypes of very mild Alzheimer's disease are associated with distinct clinical, genetic and cortical thinning characteristics. J Neurol Neurosurg Psychiatry 2011;82:45–51 [DOI] [PMC free article] [PubMed] [Google Scholar]
- 28.Dickerson BC, Wolk DA. MRI cortical thickness biomarker predicts AD-like CSF and cognitive decline in normal adults. Neurology 2012;78:84–90 [DOI] [PMC free article] [PubMed] [Google Scholar]
- 29.Arnsten AF, Wang MJ, Paspalas CD. Neuromodulation of thought: flexibilities and vulnerabilities in prefrontal cortical network synapses. Neuron 2012;76:223–239 [DOI] [PMC free article] [PubMed] [Google Scholar]
- 30.Greenwood TA, Light GA, Swerdlow NR, Radant AD, Braff DL. Association analysis of 94 candidate genes and schizophrenia-related endophenotypes. PLoS One 2012;7:e29630. [DOI] [PMC free article] [PubMed] [Google Scholar]
- 31.Roffman JL, Nitenson AZ, Agam Y, et al. A hypomethylating variant of MTHFR, 677C>T, blunts the neural response to errors in patients with schizophrenia and healthy individuals. PLoS One 2011;6:e25253. [DOI] [PMC free article] [PubMed] [Google Scholar]
Associated Data
This section collects any data citations, data availability statements, or supplementary materials included in this article.