Abstract
Identifying the optimal treatment strategy for cancer is an important challenge, particularly for complex diseases like epithelial ovarian cancer (EOC) that are prone to recurrence. In this study we developed a quantitative, multivariate model to predict the extent of ovarian cancer cell death following treatment with an ErbB inhibitor (canertinib, CI-1033). A partial least squares regression model related the levels of ErbB receptors and ligands at the time of treatment to sensitivity to CI-1033. In this way, the model mimics the clinical problem by incorporating only information that would be available at the time of drug treatment. The full model was able to fit the training set data and was predictive. Model analysis demonstrated the importance of including both ligand and receptor levels in this approach, consistent with reports of the role of ErbB autocrine loops in EOC. A reduced multi-protein model was able to predict CI-1033 sensitivity of six distinct EOC cell lines derived from the three subtypes of EOC, suggesting that quantitatively characterizing the ErbB network could be used to broadly predict EOC response to CI-1033. Ultimately, this systems biology approach examining multiple proteins has the potential to uncover multivariate functions to identify subsets of tumors that are most likely to respond to a targeted therapy.
Keywords: ErbB network, epithelial ovarian cancer, partial least squares regression, systems biology
Introduction
In recent years, systems biology studies have revealed new information about how the cellular signaling network functions in cancer in vitro (Heiser et al. 2009; Kreeger et al. 2009; Schoeberl et al. 2009) and in vivo (Lau et al. 2011). Many of these studies rely on a ‘cue-signal-response’ paradigm where cells or animals are treated with a cue (e.g., drug) and the effect on signals (e.g., phosphorylation of downstream kinases) is monitored over time and related to cell responses through mathematical modeling (Janes et al. 2004). While these methods have been utilized successfully to predict cellular response to drugs (Kumar et al. 2008; Mirzoeva et al. 2009), the general approach of monitoring the cellular network over time is not amenable to clinical samples. Instead, clinical samples are more typically analyzed for an individual protein marker (Viale et al. 2010) or by transcriptomic analysis (Paik et al. 2004; Verhaak et al. 2010) at the beginning of treatment to identify the optimum treatment strategy. Recent systems-level studies have demonstrated that multi-protein signatures can be used to identify subsets of tumors that will most likely respond to a drug (Hirsch et al. 2009; Schoeberl et al. 2010). While all of these strategies have the potential to revolutionize cancer treatment, they are limited to categorization (i.e., responder/non-responder) rather than predicting the extent of response. We hypothesize that quantitative relationships similar to ‘cue-signal-response’ models can be developed to link drug sensitivity to protein-level traits such as receptor and ligand levels measured only at the beginning of treatment. In this study, we sought to develop a quantitative, multivariate relationship predicting the response of epithelial ovarian cancer (EOC) cells to treatment with a pan-ErbB inhibitor, CI-1033.
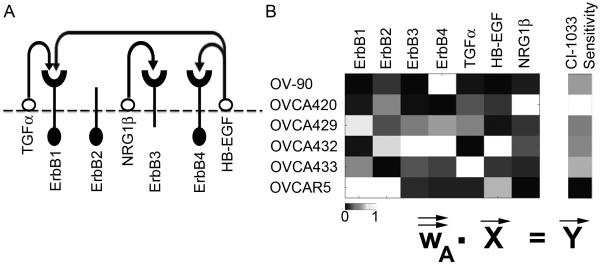
EOC is the deadliest form of reproductive malignancy with a five-year survival rate of 46% (Jemal et al. 2010). Although 70% of EOC cases initially respond to the standard treatment of surgical debulking and platinum-based chemotherapy, the disease recurs in chemoresistant form in the majority of patients (Bast et al. 2009). While several cell signaling pathways are thought to be critical in EOC progression, no single pathway has emerged as an effective target for therapy, indicating the complexity of the disease biology (Reviewed in Itamochi 2010; Yap et al. 2009). The ErbB signaling network (Figure 1A), consisting of four tyrosine kinase trans-membrane receptors (Yarden and Sliwkowski 2001) is frequently altered in EOC and has been suggested as a possible therapeutic target (Lafky et al. 2008). Upon ligand binding, the ErbB1-4 receptors form homo- and/or hetero-dimers and illicit cellular signals that play critical roles in cell proliferation, survival, differentiation, and migration (Zeineldin et al. 2010). ErbB1 over-expression had been shown to result in a more invasive phenotype in ovarian cancer cell lines (Alper et al. 2001). More recently, an autocrine loop consisting of the ErbB3 receptor and NRG1-β was shown to promote proliferation in a subset of EOC both in vitro and in vivo (Sheng et al. 2010). Furthermore, co-expression of multiple ErbB receptors is often seen in malignant and advanced ovarian cancer (Bast et al. 1998; Simpson et al. 1995) and expression of ErbB ligands, including EGF, TGF-α, amphiregulin, and NRG1 has been observed in EOC (Gilmour et al. 2002; Niikura et al. 1997).
Figure 1.
(A) Overview of the ErbB network. Arrows indicate the potential autocrine interactions between ligands and receptors. ErbB2 has no known ligand while ErbB3 has minimal kinase activity. (B) Overview of PLSR modeling, where the X matrix composed of receptor and ligand levels is regressed against the Y matrix of CI-1033 sensitivity.
Various agents in the form of monoclonal antibodies or small molecule tyrosine kinase inhibitors (TKI) have been developed to counteract ErbB activity in cancer. Although well tolerated, drugs against the ErbB signaling network have performed poorly in EOC clinical trials. A phase II clinical trial of erlotinib, a TKI against ErbB1, in patients with advanced ovarian cancer resulted in a response rate of only 6% (Gordon et al. 2005). Similarly disappointing results were obtained from clinical trials of canertinib (CI-1033, a pan-ErbB TKI), gefitinib (an ErbB1 TKI), and pertuzumab (a monoclonal antibody against ErbB2) (Campos et al. 2005; Gordon et al. 2006; Posadas et al. 2007). In the majority of these trials, patients were not pre-selected based on ErbB status and analysis of individual receptor expression levels did not correlate to response. Instead, identifying treatment strategies for EOC will likely require a systems biology approach that includes multi-protein signatures as predictive and prognostic biomarkers.
We hypothesized that responsiveness toward ErbB interventions is a complex function of the ErbB network components expressed in EOC and that uncovering this function has the potential to identify subsets of tumors that will respond well to currently available anti-ErbB drugs. In this study, we quantitatively characterized ErbB receptor and ligand expression levels in a panel of six serous EOC cell lines and observed substantial variation in both the type and level of ErbB receptors and ligands expressed. Treatment with the pan-ErbB TKI CI-1033 also showed a wide range of responses within this panel. Analysis of this data by partial least squares regression (PLSR) uncovered a strong multivariate relationship between ErbB cellular signatures and sensitivity toward CI-1033 in the panel of cell lines. Model analysis identified a reduced multi-protein model that successfully predicted CI-1033 sensitivity of six distinct EOC cell lines derived from general adenocarcinoma, mucinous, or endometrioid subtypes suggesting that characterizing the ErbB network at the onset of treatment could be used to broadly predict EOC response to CI-1033.
Materials and Methods
A. Cell lines and culture methods
We focused our initial study on serous EOC cell lines, as serous EOC is the most common histological subtype (Soslow 2008). In addition, it has been shown that the serous subtype is predominant in advanced stage EOC (Kobel et al. 2008). OVCA420, OVCA429, OVCA432, OVCA433, and OVCAR5 were obtained from Dr. R. Bast (MD Anderson Cancer Center, Houston, TX). OV-90 was purchased from American Type Culture Collection (ATCC; Rockville, MD). For the prediction set, A2780 was purchased from Sigma and OVCAR3, TOV112D, Ca-OV3, SKOV3, and TOV21G were purchased from ATCC. OVCA420, OVCA429, OVCA432, OVCAR5, TOV112D, Ca-OV3, and SKOV3 were maintained at 37°C in a humidified 5% CO2 atmosphere in a complete culture medium containing 1:1 (v/v) ratio of MCDB 105 and Medium 199 plus 10% fetal bovine serum supplemented with 1% penicillin/streptomycin. OV-90 and TOV21G were maintained in the same complete medium with 15% fetal bovine serum. OVCAR3 was maintained in the same complete medium with 20% fetal bovine serum. A2780 was maintained in the same complete medium supplemented with 10 μg/mL insulin.
B. ErbB network characterization
ErbB receptor characterization
The level of ErbB1-4 was characterized by quantitative Western blot using biological triplicates and sample duplicates. Cells were grown to 70% confluency and lysed with whole cell lysis buffer composed of 63.3% glycerol, 2% SDS, 50 mM Tris-HCl (pH 6.8), 10 μg/mL aprotinin, 10 μg/mL leupeptin, 1 μg/mL pepstatin, 1 mM PMSF, 50 U/mL Benzonase nuclease (Sigma Aldrich; St. Louis, MO, E1014), with freshly added Phosphatase Inhibitor II (5× total concentration; Boston BioProducts) and Phosphatase Inhibitor I (1× total concentration; Sigma Aldrich). Total protein was measured by bicinchoninic assay (BCA) (Thermo Scientific; Rockford, IL). Equal amounts of protein were separated by SDS-PAGE and blotted onto nitrocellulose membranes. Membranes were incubated overnight at 4°C in primary antibody and for one hour at room temperature in secondary antibody. Membranes were washed and fluorescence signals were detected and quantified using the Odyssey Infrared Imaging System (LI-COR Biotechnology; Lincoln, NE). Within each gel, bands were normalized to GAPDH levels and between gels to a concurrently run master lysate that was composed of SKOV3, OVCA432, and OVCAR5 and therefore expressed all four ErbB receptors. Anti-ErbB1 (1:1000; #4405), anti-ErbB3 (1:500; #4754), anti-ErbB4 (1:200; #4795) and anti-GAPDH (1:10000; #2118) were purchased from Cell Signaling Technology (Devers, MA). Anti-ErbB2 (1:1000; #06-562) was purchased from Upstate Biotechnology (Lake Placid, NY). Secondary antibodies were purchased from LI-COR Biotechnology and used at 1:15000 dilution. Each antibody was validated for specificity and linearity for the target protein (data not shown).
Screen for basal level receptor phosphorylation
Cells were grown to 70% confluency in complete medium and then serum-starved for 24 hours prior to lysing. Cells were lysed on ice using ice-cold lysis buffer containing 50 mM β-glycerophosphate, 10 mM NaPP, 30 mM NaF, 50 mM Tris (pH 7.5), 2% Triton X-100, 1 mM benzamidine, 2 mM EGTA, 100 μM sodium orthovanadate, 1 mM DTT, 10 μg/mL aprotinin, 10 μg/mL leupeptin, 1 μg/mL pepstatin, 1 μg/mL Microcystin-LR, 1 mM PMSF, and 50 U/mL Benzonase nuclease. Lysates were incubated on ice for 30 minutes and clarified by centrifugation (10 minutes at 18,800g). Total protein was measured by BCA assay. Western blots were done as previously described to probe for phosphorylated ErbB1 (Tyr1068; 1:1000; #2236) and for phosphorylated ErbB3 (Tyr1289; 1:1000; #4791), both from Cell Signaling Technology.
ErbB ligand characterization
To prepare samples for ELISAs, cells were grown to 70% confluency in complete medium and then serum-starved for 24 hours prior to lysing using buffer composed of 20 mM Tris (pH 7.5), 1 mM EGTA, 2 mM EDTA, 1% Triton X-100, 150 mM NaCl, 10 μg/mL aprotinin, 10 μg/mL leupeptin, 1 μg/mL pepstatin, 1 mM PMSF, 50 U/mL Benzonase nuclease with freshly added Phosphatase Inhibitor II (5× total concentration) and Phosphatase Inhibitor I (1× total concentration). Lysates were clarified by centrifugation (10 minutes at 18,800 g). Total protein was measured by BCA Assay and equal amounts of protein was loaded to each ELISA well and analyzed for TGF-α, HB-EGF, and NRG1-β (R&D Systems; Minneapolis, MN). Cells were assayed using biological triplicates and sample duplicates.
C. Cytotoxicity experiments
Cells were seeded at 5 - 10 × 103 cells/well in 96 well white-walled plates, allowed to adhere overnight, and then serum-starved for 24 hours prior to treatment with various doses (ranging from 0 to 100 μM) of CI-1033 (LC Laboratories; Woburn, MA). Cytotoxicity was determined after 24 hours of drug treatment as the percentage of dead cells using Cytotox-Glo Assay (Promega; Madison, WI, n=3 per dose). The assay first measures the dead-cell protease activity in the culture medium. This is followed by the addition of lysis reagent into the culture, at which point a second dead-cell protease activity measurement is taken to measure the total cell number. In the case of total death in the culture due to treatment condition, addition of lysis reagent into the culture will not increase dead-cell protease activity, but may instead dilute the luminescent signal resulting in a cell death reading of greater than 100%.
A four-parameters logistic curve fit was used to determine minimum and maximum cytotoxicity for all cell line-CI-1033 combinations. The difference between the maximum and minimum cytotoxicity was used as the quantitative measurement of sensitivity to each drug and subsequently fed into the modeling exercises.
D. PLSR modeling
ErbB network levels and ErbB inhibitor sensitivity data were analyzed by PLSR in SimcaP+ v.12.0.1 (Umetrics; San Jose, CA) (Kreeger et al. 2010). The independent variable matrix consisting of ErbB receptor and ligand expression levels for the six serous cell lines was regressed against a dependent variable matrix consisting of sensitivity to CI-1033 as described above (Figure 1B). Three primary metrics were used to determine the relative strength of each model: R2Y, Q2Y, and average DModY. R2Y is the regression coefficient for the model (with a maximum value of 1) and indicates how well the model fits the data in the Y matrix. Q2Y is the cross-validated regression coefficient describing the fraction of variation in the Y matrix that is captured by the model and is determined from a leave-one-out cross-validation (Eastment and Krzanowski 1982). By maximizing R2Y and Q2Y (to at most 1), the selected model form has the best fit for the data in the training set. Additionally, we determined DModY (the distance of the observation to the Y model plane) for each predicted cell line. We predicted either 5 or 6 cell lines and therefore present the average DModY rather than total DModY to compare models. By minimizing average DModY, we are selecting the model that has the least error when predicting conditions included in the test set.
Results and Discussion
EOC cell lines demonstrate diverse expression patterns of ErbB receptors
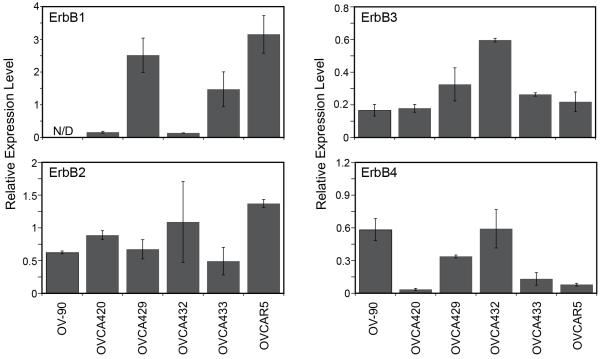
The level of ErbB1, ErbB2, ErbB3, and ErbB4 was characterized in a panel of six serous EOC cell lines by quantitative Western blot analysis (Figure 2, Supplemental Figure 1). Substantial variation was observed in both the type of receptor and level of expression across the panel. ErbB1 expression ranged from a non-detectable level in OV-90 to highest in OVCAR5. All cell lines expressed low to moderate levels of ErbB2, ErbB3 and ErbB4. These results are consistent with previous reports that all six lines express ErbB1-ErbB4 (summarized in Lafky et al. 2008). While it is difficult to directly compare results due to differences in antibodies and methods reported in each paper, the overall trends are consistent with previous reports for these cell lines (Takai et al. 2005; Xu et al. 1999). Significantly elevated levels of ErbB receptors were not observed in the panel of serous EOC cell lines.
Figure 2.
Levels of ErbB1-4 in the serous EOC cell lines panel, relative to concurrently run master lysate. N/D indicates non-detectable level.
Ovarian cancer cell lines show different patterns of receptor phosphorylation and varying levels of ErbB autocrine ligands
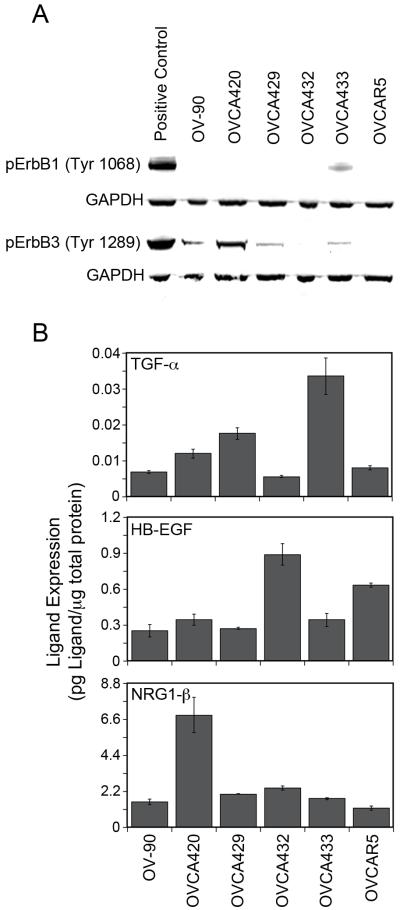
Autocrine and paracrine growth factor stimulation of the ErbB receptors has been shown to play an important role in EOC (Bast et al. 2009). To determine if ErbB autocrine loops were active in these cells, we screened for basal level phosphorylation of ErbB1 and ErbB3 receptors by Western blot (Figure 3A). Since lysates were collected under serum-starved culture conditions, either activating mutations or autocrine ligand stimulation could be responsible for receptor activity. To our knowledge, no activating mutations of ErbB1-4 have been reported in these cell lines. OVCA433 demonstrated the strongest activation of ErbB1 under serum-starved conditions. A strong ErbB3 phosphorylation under serum-starved conditions was seen in OVCA420 with lower levels in OV-90, OVCA429, and OVCA433. Interestingly, OVCAR5 expressed the highest levels of ErbB1 but did not show the strongest basal level phosphorylation of ErbB1. Similarly, OVCA432 expressed the most ErbB3 receptor but did not have a detectable level of ErbB3 phosphorylation under unstimulated conditions. These results indicate that the elevated levels of phosporylated ErbB are not simply a result of increased receptor levels.
Figure 3.
ErbB autocrine loop characterization. (A) Screen of ErbB1 and ErbB3 phosphorylation under serum-starved conditions. pErbB1 positive control is OVCA433 treated with 100 ng/mL of EGF for 10 minutes prior to lysing. pErbB3 positive control is OVCA432 treated with 100 ng/mL of NRG1-β for 10 minutes prior to lysing. (B) Levels of autocrine ErbB ligands in EOC cell lysates.
From the screen of basal level phosphorylation of ErbB1 and ErbB3 receptors, we hypothesized that autocrine loops involving ErbB1 or ErbB3 were present in the panel of EOC cell lines. TGF-α has been shown to be the dominant autocrine growth factor for the ErbB1 receptor in EOC (Simpson et al. 1998; Stromberg et al. 1992). More recently, a NRG1-β/ErbB3 autocrine loop was shown to be active in a subset of EOC tumors and ovarian cancer cell lines (Gilmour et al. 2002; Sheng et al. 2010). Limited studies have been done on ErbB4 ligands in EOC; however, it has been shown that lysophosphatidic acid-induced ectodomain shedding of HB-EGF is important in tumor formation (Miyamoto et al. 2004) and that levels of HB-EGF are elevated in patients with EOC (Yagi et al. 2005). Guided by these previous studies, we examined TGF-α, HB-EGF, and NRG1-β levels in our cell panel. Characterization of TGF-α, HB-EGF, and NRG1-β was done on cell lysates using ELISA (Figure 3B). Overall, levels of ErbB ligands correlated well with patterns of serum-starved receptor activity. OVCA433 had the highest level of TGF-α expression and correspondingly showed the strongest basal level activation of the ErbB1 receptor. Similarly, OVCA420 had the highest level of NRG1-β expression and the strongest basal level activation of ErbB3 receptor. Together, these results indicate that autocrine ErbB1 and/or ErbB3 loops are present in our EOC panel.
Ovarian cancer cell lines show different sensitivities to CI-1033
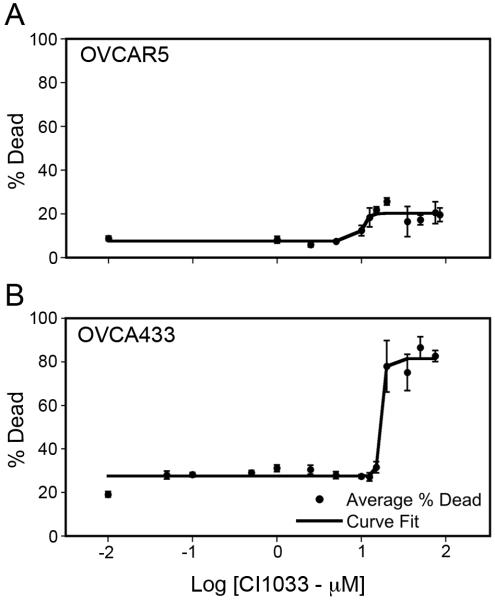
To determine responsiveness toward CI-1033 a dose-response cytotoxicity curve was built for each cell line in the panel and fit by a four-parameters logistic curve. To our knowledge, the sensitivity of these cell lines to CI-1033 has not been reported. Sensitivity was measured as the difference between maximum and minimum values from the curve fit. This value was used as the measure of sensitivity instead of the EC50 since it better captured the diversity of responses within the cell line panel. In addition, using this measure of sensitivity toward CI-1033, we were able to take into account the unique baseline level of cell death due to serum starvation of each cell line. Figure 4 shows two representative dose-response curves for an insensitive cell line (OVCAR5) and a sensitive cell line (OVCA433), while all fitted parameters values are presented in Table I. Within the cell panel a wide-range of sensitivities toward CI-1033 was observed with OVCAR5 being the least sensitive and OVCA420 being the most sensitive.
Figure 4.
Representative CI-1033 cytotoxicity dose-response curves. (A) OVCAR5, (B) OVCA433.
Table I.
Values from four-parameters logistic curve fit of cytotoxicity dose-response curves in the training (serous lines) and prediction set (mucinous, endometrioid, and general adenocarcinoma lines).
| Histologic Subtype |
Cell Line | Minimum Cytotoxicity (%) |
Maximum Cytotoxicity (%) |
Sensitivity (%) | EC50 (μM) |
|---|---|---|---|---|---|
| Serous (Training Set) |
OV-90 | 16.8 | 70.0 | 53.2 | 13.8 |
| OVCA420 | 26.7 | 117.8 | 91.1 | 16.0 | |
| OVCA429 | 31.9 | 78.8 | 46.9 | 3.4 | |
| OVCA432 | 12.8 | 61.3 | 48.5 | 19.2 | |
| OVCA433 | 27.6 | 81.5 | 53.9 | 17.3 | |
| OVCAR5 | 7.6 | 20.2 | 12.6 | 10.5 | |
| Mucinous | OVCAR3 | 49.1 | 80.5 | 31.4 | 5.3 |
| Endometrioid | TOV112D | 21.8 | 102.3 | 80.5 | 8.9 |
| General Adenocarcinoma |
A2780 | 23.5 | 106.2 | 82.7 | 9.3 |
| Ca-OV3 | 22.6 | 73.3 | 50.7 | 11.6 | |
| SKOV3 | 13.9 | 51.2 | 37.3 | 11.8 | |
| TOV21G | 7.3 | 73.6 | 66.3 | 10.2 |
PLSR model suggests a strong correlation between the ErbB network signature and CI-1033 sensitivity
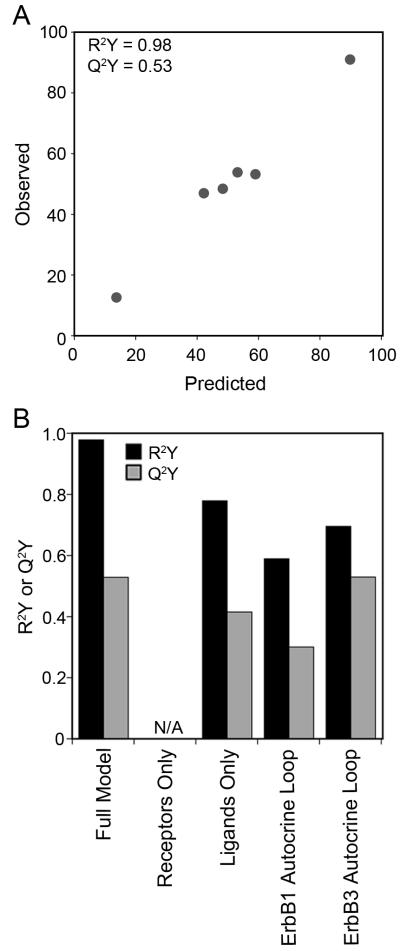
To analyze this multi-protein data set, we used PLSR (Geladi and Kowalski 1986). PLSR analysis of multi-pathway signaling data sets have been previously shown to be able to predict phenotypic response following MEK and PI3K inhibition in ErbB2 over-expressing breast cell lines (Kumar et al. 2008) and combinations of RAS mutations in colon cancers (Kreeger et al. 2010). In PLSR, the X matrix of independent observations (i.e., ErbB receptor and ligand levels) is linearly regressed against the Y matrix of dependent observations (i.e., sensitivity to CI-1033, Figure 1B). PLSR projects variables in the X and Y matrices onto new dimensions called principal components by using weighted linear combinations of variables in their corresponding matrices. The first principal component captures the strongest variation in the original data matrix, and each succeeding principal component captures remaining variation. The number of principal components that results in the minimum error is used to build the PLSR model. Essentially, the PLSR algorithm will try to find an ErbB network multi-protein function in the X-matrix that quantitatively predicts CI-1033 sensitivity observed in the Y-matrix. Figure 5A summarizes the results of our PLSR model built using experimentally collected data of ErbB receptor expression, ErbB ligand expression, and CI-1033 sensitivity in the serous EOC cell line panel. This model, built using the full data set, showed a strong correlation (R2Y = 0.98) between ErbB network levels and responsiveness toward CI-1033. Additionally, from cross-validation, we determined that the model accurately predicted the training set (Q2Y = 0.53).
Figure 5.
A multi-protein model is needed to predict cell line cytotoxicity to CI-1033. (A) Full PLSR model of CI-1033 cytotoxicity, and (B) reduced CI-1033 cytotoxicity models built using subsets of proteins. N/A indicates inability to build a model using that protein subset.
We next analyzed the model in greater detail as it is perhaps surprising that a model built without data from intermediate times and downstream signals was able to predict cellular response so well. The general trend in ‘cue-signal-response’ models has been that the inclusion of more time points leads to a more predictive model (Kreeger et al. 2009) and that models built on time zero data alone are not predictive (Gaudet et al. 2005). However, a key difference is that most of these previous modeling efforts include only one cell type and are constructed from data quantifying the activation of kinases in response to various treatments. In contrast, our model includes the total levels of multiple receptors and ligands across a panel of cells. Therefore, our X matrix is capturing variation across the panel and using this information to determine drug sensitivity. To understand how the model interprets the level of each receptor and ligand in the context of sensitivity toward CI-1033, we examined the loadings for the first two principal components (Supplementary Table sI). In PLSR models, loadings describe the direction and magnitude with which each protein projects along an individual principal component. All four receptors projected negatively along the first principal component. This suggests that higher ErbB receptor expression correlated with lower sensitivity toward CI-1033 in our panel of cell lines. Analysis of the contribution of ErbB ligands demonstrated that NRG1-β and TGF-α projected positively along the first principal component. We interpret this as dependence on TGF-α and NRG1-β autocrine signaling rendering these cells to be more sensitive toward CI-1033. In a similar manner, a recent study of an anti-ErbB3 antibody suggested that ErbB2 amplification conferred resistance while tumors with ligand-dependent ErbB3 phosphorylation were the most sensitive (Schoeberl et al. 2010).
However, given the complexity of the ErbB network with multiple dimerization combinations and downstream effectors, it is perhaps still surprising that a model built from only total receptor and ligand levels would be able to quantitatively predict cell outcome. In previous PLSR models of cell behavior, most of the highly weighted signals in the model have been measures of downstream kinase activation rather than total protein levels (Janes et al. 2005). To assess the importance of the individual ErbB network components in the PLSR model, we evaluated several reduced models built upon various subsets of the ErbB network measurements (Figure 5B, Supplemental Figure 2). No PLSR models could be built using X matrices composed of individual ErbB receptors or ligands. This is consistent with previous reports demonstrating the need for multiple inputs to quantitatively predict cell phenotypic behavior (Kreeger et al. 2009). In addition, the expression level of all four ErbB receptors, without taking into account ErbB ligand expression, was insufficient to build a model. A model could be built using the three ErbB ligands, although it did not have as strong a fit and was not as predictive as the full model. This finding may also help to explain the lack of success correlating ErbB inhibitor sensitivity to receptor levels in EOC as these studies did not also examine ligand levels (Campos et al. 2005; Gordon et al. 2005; Gordon et al. 2006; Posadas et al. 2007). This result also suggested the potential importance of ErbB autocrine loops in determining CI-1033 sensitivity. Therefore, we built reduced models for the ErbB1 (levels of ErbB1 and TGF-α) and ErbB3 (levels of ErbB3 and NRG1-β) autocrine loops. Although the fits of both models were again less than the full model, the ErbB3 autocrine loop model was as predictive as the full model (Q2Y = 0.53), in agreement with recent reports of the driving role of ErbB3 in EOC (Sheng et al. 2010). Additionally, this result may help to explain the success of the full model – by incorporating data on both the available ErbB receptors and ligands, which influence the possible dimerization combinations, we have provided surrogate information about possible signaling within the cell. In this way, the model is indirectly instructed about events that CI-1033 can affect to regulate cell behavior.
Multi-protein model can predict sensitivity to CI-1033 in additional EOC cell lines
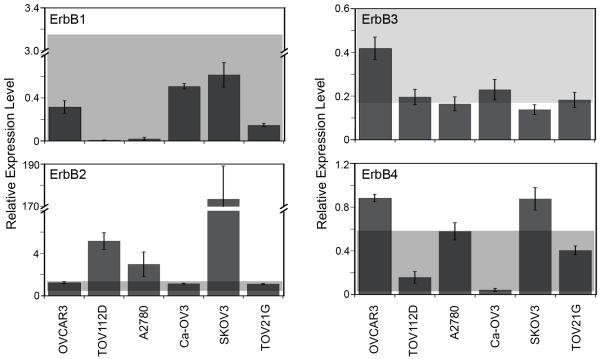
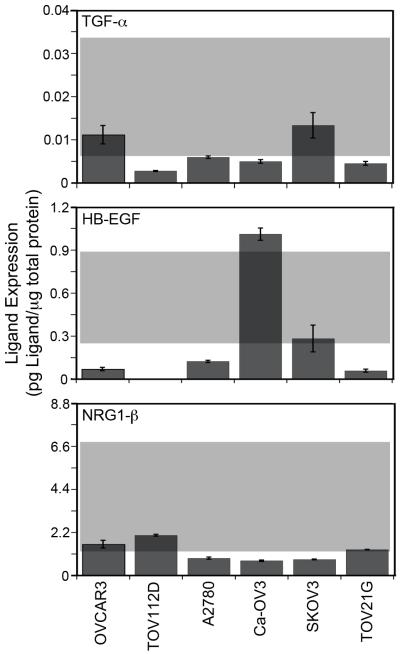
We next evaluated the model’s ability to predict sensitivity to CI-1033 for cell lines that were not included as a part of the training set to determine if the model was broadly applicable. ErbB receptor and ligand expression characterization and CI-1033 sensitivity analysis for these cell lines were performed as described for the panel of serous EOC cell lines (Figure 6 and 7, Table I). We chose the additional six cell lines as they are widely used and represent the mucinous and endometrioid histological subtypes of EOC as well as general epithelial ovarian adenocarcinoma.
Figure 6.
Expression of ErbB1-4 in EOC cell lines in the prediction set. The grey box represents the data range included in the original full PLSR model of CI-1033 cytotoxicity.
Figure 7.
ErbB autocrine ligands in the EOC cell lines in the prediction set. The grey box represents the data range included in the original full PLSR model of CI-1033 cytotoxicity.
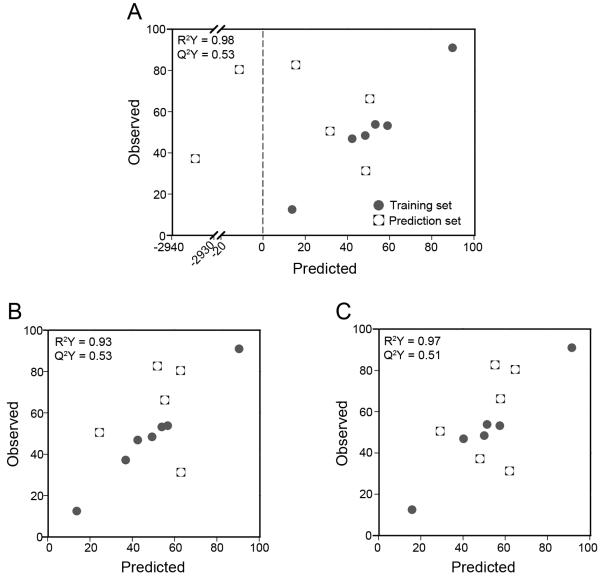
The full model was able to predict three out of the six new cell lines (Figure 8A); however, the model severely under-predicted the remaining three cell lines, resulting in an average DModY of 119.2. To understand why our model broke when used to predict these three cell lines, we went back and evaluated their ErbB network expression (Figures 6 and 7). While the expression level of most ErbB components in the prediction set lied close to or within the range that the model was trained against, ErbB2 expression did not. In particular, the ErbB2 levels of the three cell lines in which the model under-predicted sensitivity (A2780, SKOV3, and TOV112D) were significantly higher than the cell lines included in the training set.
Figure 8.
Model predictions of additional EOC cell lines. (A) Original full PLSR model, (B) full PLSR model with expanded ErbB2 range, (C) reduced PLSR model excluding ErbB2. Note that due to the inclusion of SKOV-3 in the training set of (B), that model has only 5 members in the prediction set.
Therefore, we suspected that our model failed to predict CI-1033 sensitivity of cells expressing higher levels of ErbB2 due to the very narrow range of ErbB2 expression that the model was trained against. Indeed, it has been previously shown that prediction of novel conditions with PLSR models can be sensitive to data that is outside of the training data set (Miller-Jensen et al. 2007). To test this, we re-trained the full model with the addition of SKOV3, greatly expanding the range of ErbB2 expression included in the model. The re-trained model had a comparable fit and was as predictive as the full model (Figure 8B, R2Y = 0.93, Q2Y = 0.53). Additionally, the loadings of the first principal component of this expanded model were consistent with the full model (Supplemental Table sII). Importantly, the expanded model was better able to predict the five remaining cell lines, with an average DModY of 4.6. Models built with a partially expanded ErbB2 range (incorporating TOV112D and A2780 into the training set, but not SKOV3) were not able to predict as well as the fully expanded range (average DModY = 13.4, data not shown). Combined, these results demonstrate the importance of including conditions in the model training set that capture the full range of variation that would be expected in future prediction sets.
For EOC, high levels of ErbB2 would not have been expected a priori and several studies have suggested the lack of predictive value of ErbB2 in EOC. Similar to our full panel of cell lines, a screen of 232 primary EOC tumors using immunohistochemistry showed that ErbB2 was only seen at low levels and at low frequency (de Graeff et al. 2008). In a multi-center randomized phase III trial of platinum-based combinatorial chemotherapy, ErbB2 amplification was only seen in small percentage of participants and was not associated with response (Farley et al. 2009). Additionally, several studies have shown that ErbB2 status is not associated with any clinicopathological parameter such as progression free survival, stable disease, or overall survival in EOC (de Graeff et al. 2008; Hoopmann et al. 2010). These studies suggest that ErbB2’s role in EOC may not be as important as our model interpreted it to be. Therefore, we rebuilt our full model with the original panel of six serous EOC cell lines, this time excluding the ErbB2 data from the X matrix (Figure 8C, Supplemental Table sIII). We were able to build a reduced model that fit almost as well as the original full model (R2Y = 0.97 compared to R2Y = 0.98). In addition, the reduced model retained the full model’s prediction ability within the training set (Q2Y = 0.51 compared to Q2Y = 0.53). We also found that exclusion of ErbB2 receptor from the model dramatically improved the ability of the model to predict cell lines outside the training set, resulting in an average DModY of 3.6. This result demonstrates that building models using prior biological knowledge of the tumor (i.e., the limited role of ErbB2 in EOC) can be a useful approach to developing multi-protein functions for predicting drug response.
Identifying the minimal model that is predictive of cell sensitivity
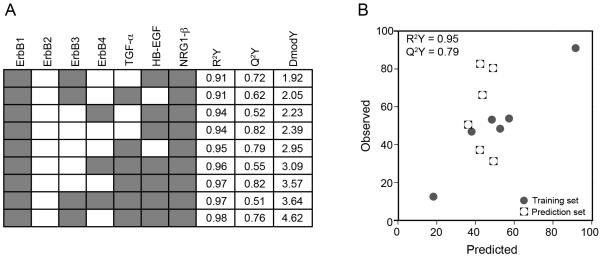
Since our previous analysis showed that it is possible to build a reduced model with comparable fit and predictive ability as the full model (Figure 8C), we conducted further analysis to identify the fewest number of proteins required to build a well-fitted and predictive model. We built models from all 127 possible combinations of the seven ErbB components included in the X matrix (Supplemental Table sIV). We classified our top models as having R2Y greater than 0.90, Q2Y greater than 0.50, and average DModY of the prediction set less than 5.00. Nine out of 127 models fit these criteria and are presented in Figure 9A. The smallest number of ErbB components required to build a well-fitted and predictive model was three, with two models composed of ErbB1 and two of the three autocrine ligands (Figure 9B). In fact, all of the top nine reduced models require the inclusion of ErbB1 receptor, NRG1-β, and at least one other ErbB ligand in the X matrix, which further indicates the importance of possible autocrine loops in our system. Additionally, none of the top nine reduced models include ErbB2 in the X matrix, providing further evidence for ErbB2’s lack of predictive value in our system. Identifying a reduced model through this analysis is clinically advantageous as it reduces the number of experimental variables that need to be quantified.
Figure 9.
Top nine reduced models. (A) Subsets of proteins used in the top nine models, shaded box indicates the protein was included in the X matrix. (B) Representative predictions of a reduced CI-1033 cytotoxicity model (X matrix composed of ErbB1, NRG1-β, and TGFα).
Conclusions
In this study we examined the complex relationship between expression of ErbB network components in EOC cell lines and their sensitivity toward a pan-ErbB TKI, CI-1033. Using PLSR, we developed a multivariate model relating the levels of ErbB network components at the time of treatment to a quantitative measure of cell sensitivity following treatment. Model analysis revealed that elevated levels of ErbB receptors and lower levels of ErbB autocrine ligands contributed to resistance to CI-1033. In addition to examining the model for these biological insights, we tested the ability of the model to predict six additional ovarian cancer cell lines to address our hypothesis that characterizing the initial state of the ErbB network could be used to quantitatively predict cellular response. Although our original full model failed to accurately predict half of these cell lines, we were able to improve our predictions by two strategies: 1) expanding the range of ErbB2 expression in the training set to include cases of ErbB2 overexpression and 2) excluding ErbB2 from the independent variable matrix based on reports of its limited role in directing EOC, with the second approach resulting in a better prediction. We then examined all reduced models and identified common themes in the best models – all models included ErbB1, NRG1-β, and another ErbB ligand, while no model included ErbB2. The improved fit and predictiveness of models built incorporating ligand data versus only receptor data may indicate that determining the levels of autocrine ligands in EOC has more prognostic value than measuring the associated receptor. Our results suggest that tumor response to a drug can be determined by measuring the levels of key proteins at the onset of treatment, including proteins that are not necessarily over-expressed or mutated. Uncovering these complex multi-protein functions has the potential to identify subsets of tumors that are most likely to respond to targeted inhibitors, improving patient prognosis.
Supplementary Material
Supplemental Figure 1. Quantitative Western blots of EOC cell lines, (A) ErbB1, (B) ErbB2, (C)ErbB3, (D) ErbB4. Note: IOSE385, an immortalized ovarian surface epithelium, was not included in our analysis
Supplemental Figure 2. Reduced CI-1033 cytotoxicity models built using subsets of proteins. (A) Model built using TGF-α, HB-EGF, and NRG1-β, (B) model built using ErbB1 and TGF-α, (C) model built using ErbB3 and NRG1-β.
Acknowledgements
We wish to acknowledge Tyler Vovos and Kathryn Pollock for their assistance collecting samples, and Dr. Ben Cosgrove and Dr. Kristyn Masters for helpful discussions. This work was supported by NSF CBET-0951613 and a NLM 5T15LM007359 short-term traineeship (K.Z.V.).
References
- Alper O, Bergmann-Leitner ES, Bennett TA, Hacker NF, Stromberg K, Stetler-Stevenson WG. Epidermal growth factor receptor signaling and the invasive phenotype of ovarian carcinoma cells. J Natl Cancer Inst. 2001;93(18):1375–84. doi: 10.1093/jnci/93.18.1375. [DOI] [PubMed] [Google Scholar]
- Bast RC, Jr., Hennessy B, Mills GB. The biology of ovarian cancer: new opportunities for translation. Nat Rev Cancer. 2009;9(6):415–28. doi: 10.1038/nrc2644. [DOI] [PMC free article] [PubMed] [Google Scholar]
- Bast RC, Jr., Pusztai L, Kerns BJ, MacDonald JA, Jordan P, Daly L, Boyer CM, Mendelsohn J, Berchuck A. Coexpression of the HER-2 gene product, p185HER-2, and epidermal growth factor receptor, p170EGF-R, on epithelial ovarian cancers and normal tissues. Hybridoma. 1998;17(4):313–21. doi: 10.1089/hyb.1998.17.313. [DOI] [PubMed] [Google Scholar]
- Campos S, Hamid O, Seiden MV, Oza A, Plante M, Potkul RK, Lenehan PF, Kaldjian EP, Varterasian ML, Jordan C. Multicenter, randomized phase II trial of oral CI-1033 for previously treated advanced ovarian cancer. J Clin Oncol. 2005;23(24):5597–604. doi: 10.1200/JCO.2005.08.091. others. [DOI] [PubMed] [Google Scholar]
- de Graeff P, Crijns AP, Ten Hoor KA, Klip HG, Hollema H, Oien K, Bartlett JM, Wisman GB, de Bock GH, de Vries EG. The ErbB signalling pathway: protein expression and prognostic value in epithelial ovarian cancer. Br J Cancer. 2008;99(2):341–9. doi: 10.1038/sj.bjc.6604471. others. [DOI] [PMC free article] [PubMed] [Google Scholar]
- Eastment HT, Krzanowski WJ. Cross-validatory choice of the number of components from a principal component analysis. Technometrics. 1982;24(1):73–77. [Google Scholar]
- Farley J, Fuchiuji S, Darcy KM, Tian C, Hoskins WJ, McGuire WP, Hanjani P, Warshal D, Greer BE, Belinson J. Associations between ERBB2 amplification and progression-free survival and overall survival in advanced stage, suboptimally-resected epithelial ovarian cancers: a Gynecologic Oncology Group Study. Gynecol Oncol. 2009;113(3):341–7. doi: 10.1016/j.ygyno.2009.02.009. others. [DOI] [PMC free article] [PubMed] [Google Scholar]
- Gaudet S, Janes KA, Albeck JG, Pace EA, Lauffenburger DA, Sorger PK. A compendium of signals and responses triggered by prodeath and prosurvival cytokines. Mol Cell Proteomics. 2005;4(10):1569–90. doi: 10.1074/mcp.M500158-MCP200. [DOI] [PubMed] [Google Scholar]
- Geladi P, Kowalski BR. Partial least-squares regression: a tutorial. Anal Chim Acta. 1986;185:1–17. [Google Scholar]
- Gilmour LM, Macleod KG, McCaig A, Sewell JM, Gullick WJ, Smyth JF, Langdon SP. Neuregulin expression, function, and signaling in human ovarian cancer cells. Clin Cancer Res. 2002;8(12):3933–42. [PubMed] [Google Scholar]
- Gordon AN, Finkler N, Edwards RP, Garcia AA, Crozier M, Irwin DH, Barrett E. Efficacy and safety of erlotinib HCl, an epidermal growth factor receptor (HER1/EGFR) tyrosine kinase inhibitor, in patients with advanced ovarian carcinoma: results from a phase II multicenter study. Int J Gynecol Cancer. 2005;15(5):785–92. doi: 10.1111/j.1525-1438.2005.00137.x. [DOI] [PubMed] [Google Scholar]
- Gordon MS, Matei D, Aghajanian C, Matulonis UA, Brewer M, Fleming GF, Hainsworth JD, Garcia AA, Pegram MD, Schilder RJ. Clinical activity of pertuzumab (rhuMAb 2C4), a HER dimerization inhibitor, in advanced ovarian cancer: potential predictive relationship with tumor HER2 activation status. J Clin Oncol. 2006;24(26):4324–32. doi: 10.1200/JCO.2005.05.4221. others. [DOI] [PubMed] [Google Scholar]
- Heiser LM, Wang NJ, Talcott CL, Laderoute KR, Knapp M, Guan Y, Hu Z, Ziyad S, Weber BL, Laquerre S. Integrated analysis of breast cancer cell lines reveals unique signaling pathways. Genome Biol. 2009;10(3):R31. doi: 10.1186/gb-2009-10-3-r31. others. [DOI] [PMC free article] [PubMed] [Google Scholar]
- Hirsch FR, Varella-Garcia M, Cappuzzo F. Predictive value of EGFR and HER2 overexpression in advanced non-small-cell lung cancer. Oncogene. 2009;28(Suppl 1):S32–7. doi: 10.1038/onc.2009.199. [DOI] [PubMed] [Google Scholar]
- Hoopmann M, Sachse K, Valter MM, Becker M, Neumann R, Ortmann M, Gohring UJ, Thomas A, Mallmann P, Schondorf T. Serological and immunohistochemical HER-2/neu statuses do not correlate and lack prognostic value for ovarian cancer patients. Eur J Cancer Care (Engl) 2010;19(6):809–15. doi: 10.1111/j.1365-2354.2009.01112.x. [DOI] [PubMed] [Google Scholar]
- Itamochi H. Targeted therapies in epithelial ovarian cancer: Molecular mechanisms of action. World J Biol Chem. 2010;1(7):209–20. doi: 10.4331/wjbc.v1.i7.209. [DOI] [PMC free article] [PubMed] [Google Scholar]
- Janes KA, Albeck JG, Gaudet S, Sorger PK, Lauffenburger DA, Yaffe MB. A systems model of signaling identifies a molecular basis set for cytokine-induced apoptosis. Science. 2005;310(5754):1646–53. doi: 10.1126/science.1116598. [DOI] [PubMed] [Google Scholar]
- Janes KA, Kelly JR, Gaudet S, Albeck JG, Sorger PK, Lauffenburger DA. Cue-signal-response analysis of TNF-induced apoptosis by partial least squares regression of dynamic multivariate data. J Comput Biol. 2004;11(4):544–61. doi: 10.1089/cmb.2004.11.544. [DOI] [PubMed] [Google Scholar]
- Jemal A, Siegel R, Xu J, Ward E. Cancer statistics, 2010. CA Cancer J Clin. 2010;60(5):277–300. doi: 10.3322/caac.20073. [DOI] [PubMed] [Google Scholar]
- Kobel M, Kalloger SE, Boyd N, McKinney S, Mehl E, Palmer C, Leung S, Bowen NJ, Ionescu DN, Rajput A. Ovarian carcinoma subtypes are different diseases: implications for biomarker studies. PLoS Med. 2008;5(12):e232. doi: 10.1371/journal.pmed.0050232. others. [DOI] [PMC free article] [PubMed] [Google Scholar]
- Kreeger PK, Mandhana R, Alford SK, Haigis KM, Lauffenburger DA. RAS mutations affect tumor necrosis factor-induced apoptosis in colon carcinoma cells via ERK-modulatory negative and positive feedback circuits along with non-ERK pathway effects. Cancer Res. 2009;69(20):8191–9. doi: 10.1158/0008-5472.CAN-09-1921. [DOI] [PMC free article] [PubMed] [Google Scholar]
- Kreeger PK, Wang Y, Haigis KM, Lauffenburger DA. Integration of multiple signaling pathway activities resolves K-RAS/N-RAS mutation paradox in colon epithelial cell response to inflammatory cytokine stimulation. Integr Biol (Camb) 2010;2(4):202–8. doi: 10.1039/b925935j. [DOI] [PMC free article] [PubMed] [Google Scholar]
- Kumar N, Afeyan R, Kim HD, Lauffenburger DA. Multipathway model enables prediction of kinase inhibitor cross-talk effects on migration of Her2-overexpressing mammary epithelial cells. Mol Pharmacol. 2008;73(6):1668–78. doi: 10.1124/mol.107.043794. [DOI] [PMC free article] [PubMed] [Google Scholar]
- Lafky JM, Wilken JA, Baron AT, Maihle NJ. Clinical implications of the ErbB/epidermal growth factor (EGF) receptor family and its ligands in ovarian cancer. Biochim Biophys Acta. 2008;1785(2):232–65. doi: 10.1016/j.bbcan.2008.01.001. [DOI] [PubMed] [Google Scholar]
- Lau KS, Juchheim AM, Cavaliere KR, Philips SR, Lauffenburger DA, Haigis KM. In vivo systems analysis identifies spatial and temporal aspects of the modulation of TNF-alpha-induced apoptosis and proliferation by MAPKs. Sci Signal. 2011;4(165):ra16. doi: 10.1126/scisignal.2001338. [DOI] [PMC free article] [PubMed] [Google Scholar]
- Miller-Jensen K, Janes KA, Brugge JS, Lauffenburger DA. Common effector processing mediates cell-specific responses to stimuli. Nature. 2007;448(7153):604–8. doi: 10.1038/nature06001. [DOI] [PubMed] [Google Scholar]
- Mirzoeva OK, Das D, Heiser LM, Bhattacharya S, Siwak D, Gendelman R, Bayani N, Wang NJ, Neve RM, Guan Y. Basal subtype and MAPK/ERK kinase (MEK)-phosphoinositide 3-kinase feedback signaling determine susceptibility of breast cancer cells to MEK inhibition. Cancer Res. 2009;69(2):565–72. doi: 10.1158/0008-5472.CAN-08-3389. others. [DOI] [PMC free article] [PubMed] [Google Scholar]
- Miyamoto S, Hirata M, Yamazaki A, Kageyama T, Hasuwa H, Mizushima H, Tanaka Y, Yagi H, Sonoda K, Kai M. Heparin-binding EGF-like growth factor is a promising target for ovarian cancer therapy. Cancer Res. 2004;64(16):5720–7. doi: 10.1158/0008-5472.CAN-04-0811. others. [DOI] [PubMed] [Google Scholar]
- Niikura H, Sasano H, Sato S, Yajima A. Expression of epidermal growth factor-related proteins and epidermal growth factor receptor in common epithelial ovarian tumors. Int J Gynecol Pathol. 1997;16(1):60–8. doi: 10.1097/00004347-199701000-00010. [DOI] [PubMed] [Google Scholar]
- Paik S, Shak S, Tang G, Kim C, Baker J, Cronin M, Baehner FL, Walker MG, Watson D, Park T. A multigene assay to predict recurrence of tamoxifen-treated, node-negative breast cancer. N Engl J Med. 2004;351(27):2817–26. doi: 10.1056/NEJMoa041588. others. [DOI] [PubMed] [Google Scholar]
- Posadas EM, Liel MS, Kwitkowski V, Minasian L, Godwin AK, Hussain MM, Espina V, Wood BJ, Steinberg SM, Kohn EC. A phase II and pharmacodynamic study of gefitinib in patients with refractory or recurrent epithelial ovarian cancer. Cancer. 2007;109(7):1323–30. doi: 10.1002/cncr.22545. [DOI] [PMC free article] [PubMed] [Google Scholar]
- Schoeberl B, Faber AC, Li D, Liang MC, Crosby K, Onsum M, Burenkova O, Pace E, Walton Z, Nie L. An ErbB3 antibody, MM-121, is active in cancers with ligand-dependent activation. Cancer Res. 2010;70(6):2485–94. doi: 10.1158/0008-5472.CAN-09-3145. others. [DOI] [PMC free article] [PubMed] [Google Scholar]
- Schoeberl B, Pace EA, Fitzgerald JB, Harms BD, Xu L, Nie L, Linggi B, Kalra A, Paragas V, Bukhalid R. Therapeutically targeting ErbB3: a key node in ligand-induced activation of the ErbB receptor-PI3K axis. Sci Signal. 2009;2(77):ra31. doi: 10.1126/scisignal.2000352. others. [DOI] [PubMed] [Google Scholar]
- Sheng Q, Liu X, Fleming E, Yuan K, Piao H, Chen J, Moustafa Z, Thomas RK, Greulich H, Schinzel A. An activated ErbB3/NRG1 autocrine loop supports in vivo proliferation in ovarian cancer cells. Cancer Cell. 2010;17(3):298–310. doi: 10.1016/j.ccr.2009.12.047. others. [DOI] [PMC free article] [PubMed] [Google Scholar]
- Simpson BJ, Langdon SP, Rabiasz GJ, Macleod KG, Hirst GL, Bartlett JM, Crew AJ, Hawkins RA, Macineira-Perez PP, Smyth JF. Estrogen regulation of transforming growth factor-alpha in ovarian cancer. J Steroid Biochem Mol Biol. 1998;64(3-4):137–45. doi: 10.1016/s0960-0760(97)00159-3. others. [DOI] [PubMed] [Google Scholar]
- Simpson BJ, Phillips HA, Lessells AM, Langdon SP, Miller WR. c-erbB growth-factor-receptor proteins in ovarian tumours. Int J Cancer. 1995;64(3):202–6. doi: 10.1002/ijc.2910640310. [DOI] [PubMed] [Google Scholar]
- Soslow RA. Histologic subtypes of ovarian carcinoma: an overview. Int J Gynecol Pathol. 2008;27(2):161–74. doi: 10.1097/PGP.0b013e31815ea812. [DOI] [PubMed] [Google Scholar]
- Stromberg K, Collins TJt, Gordon AW, Jackson CL, Johnson GR. Transforming growth factor-alpha acts as an autocrine growth factor in ovarian carcinoma cell lines. Cancer Res. 1992;52(2):341–7. [PubMed] [Google Scholar]
- Takai N, Jain A, Kawamata N, Popoviciu LM, Said JW, Whittaker S, Miyakawa I, Agus DB, Koeffler HP. 2C4, a monoclonal antibody against HER2, disrupts the HER kinase signaling pathway and inhibits ovarian carcinoma cell growth. Cancer. 2005;104(12):2701–8. doi: 10.1002/cncr.21533. [DOI] [PubMed] [Google Scholar]
- Verhaak RG, Hoadley KA, Purdom E, Wang V, Qi Y, Wilkerson MD, Miller CR, Ding L, Golub T, Mesirov JP. Integrated genomic analysis identifies clinically relevant subtypes of glioblastoma characterized by abnormalities in PDGFRA, IDH1, EGFR, and NF1. Cancer Cell. 2010;17(1):98–110. doi: 10.1016/j.ccr.2009.12.020. others. [DOI] [PMC free article] [PubMed] [Google Scholar]
- Viale G, Ghioni M, Mastropasqua MG. Traditional molecular markers and response to adjuvant endocrine or trastuzumab-based therapies. Curr Opin Oncol. 2010;22(6):541–6. doi: 10.1097/CCO.0b013e32833f4882. [DOI] [PubMed] [Google Scholar]
- Xu F, Yu Y, Le XF, Boyer C, Mills GB, Bast RC., Jr. The outcome of heregulin-induced activation of ovarian cancer cells depends on the relative levels of HER-2 and HER-3 expression. Clin Cancer Res. 1999;5(11):3653–60. [PubMed] [Google Scholar]
- Yagi H, Miyamoto S, Tanaka Y, Sonoda K, Kobayashi H, Kishikawa T, Iwamoto R, Mekada E, Nakano H. Clinical significance of heparin-binding epidermal growth factor-like growth factor in peritoneal fluid of ovarian cancer. Br J Cancer. 2005;92(9):1737–45. doi: 10.1038/sj.bjc.6602536. [DOI] [PMC free article] [PubMed] [Google Scholar]
- Yap TA, Carden CP, Kaye SB. Beyond chemotherapy: targeted therapies in ovarian cancer. Nat Rev Cancer. 2009;9(3):167–81. doi: 10.1038/nrc2583. [DOI] [PubMed] [Google Scholar]
- Yarden Y, Sliwkowski MX. Untangling the ErbB signalling network. Nat Rev Mol Cell Biol. 2001;2(2):127–37. doi: 10.1038/35052073. [DOI] [PubMed] [Google Scholar]
- Zeineldin R, Muller CY, Stack MS, Hudson LG. Targeting the EGF receptor for ovarian cancer therapy. J Oncol. 2010:414676. doi: 10.1155/2010/414676. 2010. [DOI] [PMC free article] [PubMed] [Google Scholar]
Associated Data
This section collects any data citations, data availability statements, or supplementary materials included in this article.
Supplementary Materials
Supplemental Figure 1. Quantitative Western blots of EOC cell lines, (A) ErbB1, (B) ErbB2, (C)ErbB3, (D) ErbB4. Note: IOSE385, an immortalized ovarian surface epithelium, was not included in our analysis
Supplemental Figure 2. Reduced CI-1033 cytotoxicity models built using subsets of proteins. (A) Model built using TGF-α, HB-EGF, and NRG1-β, (B) model built using ErbB1 and TGF-α, (C) model built using ErbB3 and NRG1-β.


