

Abstract
OBJECTIVE
Diabetes has become the leading cause of end-stage renal disease (ESRD). Renal risk stratification could assist in earlier identification and targeted prevention. This study aimed to derive risk models to predict ESRD events in type 2 diabetes in primary care.
RESEARCH DESIGN AND METHODS
The nationwide derivation cohort included adults with type 2 diabetes from the New Zealand Diabetes Cohort Study initially assessed during 2000–2006 and followed until December 2010, excluding those with pre-existing ESRD. The outcome was fatal or nonfatal ESRD event (peritoneal dialysis or hemodialysis for ESRD, renal transplantation, or death from ESRD). Risk models were developed using Cox proportional hazards models, and their performance was assessed in a separate validation cohort.
RESULTS
The derivation cohort included 25,736 individuals followed for up to 11 years (180,497 person-years; 86% followed for ≥5 years). At baseline, mean age was 62 years, median diabetes duration 5 years, and median HbA1c 7.2% (55 mmol/mol); 37% had albuminuria; and median estimated glomerular filtration rate (eGFR) was 77 mL/min/1.73 m2. There were 637 ESRD events (2.5%) during follow-up. Models that included sex, ethnicity, age, diabetes duration, albuminuria, serum creatinine, systolic blood pressure, HbA1c, smoking status, and previous cardiovascular disease status performed well with good discrimination and calibration in the derivation cohort and the validation cohort (n = 5,877) (C-statistics 0.89–0.92), improving predictive performance compared with previous models.
CONCLUSIONS
These 5-year renal risk models performed very well in two large primary care populations with type 2 diabetes. More accurate risk stratification could facilitate earlier intervention than using eGFR and/or albuminuria alone.
Compared with people without diabetes and even after adjusting for other risk factors, those with type 2 diabetes have three to five times the risk of developing end-stage renal disease (ESRD) resulting in dialysis, renal transplantation, or early mortality (1). Diabetes has become the leading cause of ESRD in many countries (2), with certain ethnic groups having much higher rates than others (3,4). Apart from the large human cost of renal failure, there are significant national and individual economic costs for dialysis both for high- and low-income countries (5,6), with some estimating that 30% of the world’s $1.1 trillion in medical costs of dialysis over this decade will result from diabetic kidney disease (2,7).
Early identification of those most likely to progress to ESRD among the diabetic population could prompt earlier optimization of preventive therapies in primary care or earlier referral to specialist care. There is evidence that tight control of glycemia (8,9) and blood pressure (BP) as well as use of ACE inhibitors and angiotensin II receptor blockers (ARBs) can reduce the rate of progression of diabetic kidney disease (10,11). While estimated glomerular filtration rate (eGFR) and the presence of albuminuria are used to assess renal deterioration, other clinical factors such as glycemia are also associated with risk of progression to ESRD (9,12,13). Renal risk stratification models already exist for those with advanced chronic kidney disease (CKD; stages 3–5) (14) or established diabetic nephropathy (15). However, these models may be more appropriate for use in secondary care than in primary care settings. While the QKidney models have been derived from a primary care population, these include diabetes only as a dichotomous variable and do not include glycemia, serum creatinine (sCr), eGFR, or albuminuria (1). Another renal risk equation has recently been published for those with type 2 diabetes without advanced disease from the ADVANCE clinical trial (16).
We therefore aimed to derive and validate a model to predict 5-year risk of end-stage renal events, including dialysis, renal transplantation, or death from renal failure, among people with type 2 diabetes without advanced kidney disease within a primary care context and to compare the model’s performance with other risk assessments.
RESEARCH DESIGN AND METHODS
Study populations
Derivation cohort.
The New Zealand (NZ) Diabetes Cohort Study (DCS) population includes adults with type 2 diabetes assessed in a national diabetes annual review program between 2000 and 2006 from 24 of 26 invited primary health care organizations and diabetes trusts nationally. These organizations collected annual review data from almost all primary care practices in NZ. Details of the data collection methods are described elsewhere (17). Only those with the required demographic and clinical baseline measures were included in the renal model derivation. Those with pre-existing renal replacement therapy, renal transplantation, or CKD stages 4 and 5 (eGFR <30 mL/min using CKD-Epidemiology Collaboration [CKD-EPI] or Modification of Diet in Renal Disease equation [18,19]) at baseline were excluded.
Validation cohort.
The validation cohort included patients with type 2 diabetes involved in a systematic clinical audit of primary care practices in South and West Auckland (North Island, NZ) by the Diabetes Care Support Services between 1994 and 2003 (20). Data on patients with at least 5 years of follow-up with all required clinical measures recorded during baseline assessment were included. The same exclusion criteria were used as in the derivation cohort.
Outcomes
The primary composite outcome was fatal or nonfatal ESRD event (peritoneal dialysis or hemodialysis for ESRD, renal transplantation, or death with chronic renal failure [CRF] or ESRD coded as a contributing cause). Prospective as well as past events were identified from national hospital and mortality records between 1988 and December 2010 using ICD-9 and ICD-10 codes (Supplementary Table 1). Dialysis and renal transplantation events were confirmed against the information recorded in the Australia and NZ registry of renal replacement therapy (ANZDATA). Any inconsistencies in events or event dates between the two sources of outcome data were investigated further using hospital coded records to adjudicate. A summary of the outcome categories used from the ANZDATA registry can be found in Supplementary Table 2. All patients in the study were identified by an encrypted national health index number that maintained their anonymity but allowed linkage of their records to national hospital, mortality, and ANZDATA databases (21).
Measures
Risk variables involved in building the renal models included age, sex, ethnicity, smoking status, duration of diabetes, BMI, BP, sCr, serum lipids (HDL/total cholesterol ratio), urine albumin/creatinine ratio (UACR), HbA1c, previous cardiovascular disease, and medication use (ACE inhibitors, ARBs, and other BP-lowering medications). Most of these variables were required data fields in the annual reviews from each primary care practice. However, sCr and medication fields were only required by some primary care organizations. Ethnic groups included European, East Asian, South Asian (Indian subcontinent), Maori, Pacific Island, and other. Socioeconomic status was derived from a deprivation score based on national small-area geographic classifications (22).
Analyses
Descriptive statistics including means, medians, and proportions were used to describe the characteristics of the derivation and validation cohorts. Clinically relevant categories were used for UACR because a high proportion of the skewed data were truncated to zero, making transformation difficult, and the predictive performance of the models was better using these categories than when using log-transformation. Categories included no albuminuria, microalbuminuria (≥2.5 mg/mmol in men or ≥3.5 mg/mmol in women and <30 mg/mmol in both), macroalbuminuria (≥30 and <100 mg/mmol), and advanced albuminuria (≥100 mg/mmol). The CKD-EPI equation was used to calculate eGFR for analyses (19).
A succession of predictive renal models was developed including variables routinely collected in primary care and hypothesized to be predictive of first end-stage renal events. Groups of variables were added sequentially using the approach previously used by Tangri et al. (14). Performance of the models to inform the inclusion of variables was assessed using C-statistics, Akaike, and Bayesian information criterion statistics. Cox proportional hazards models were used to estimate the hazard ratios and to calculate the coefficients for risk factors in the equations (23). In all of these models, the assumptions of proportional hazards were checked using log-log plots of survival and examining Schoenfield residuals, in particular using a test of the nonzero slope of the regression (23). Several methods were used to evaluate the performance of the predictive equations in the validation dataset. Calibration and discrimination were assessed using receiver operating curves, C-statistics, Hosmer-Lemeshow χ2 tests, and observed versus predicted event rates in the validation cohort. Net reclassification improvement was assessed to quantify improvement in several models offered by adding different variables (24). Sensitivity, specificity, positive predictive values, and the number identified as high risk per subsequent renal event in 5 years, were calculated using different risk cutoff scores. The performance of the new risk stratification models was compared with using eGFR, UACR, the ADVANCE kidney outcomes model (16), and the renal risk models of Tangri et al. (14) in both of our cohorts.
Ethics approval
The DCS has ongoing approval from the NZ Multiregional Ethics committee (WGT/04/09/077).
RESULTS
Description of the cohorts
Derivation cohort.
Data were collected on 79,979 patients in the DCS, of whom 72,537 had type 2 diabetes (91%), which comprised an estimated 60–70% of those with type 2 diabetes in the country (17,25). Of these, 26,924 (37%) had the complete data of interest to the current study at baseline (Supplementary Fig. 1). sCr was the most common missing variable, as this was not at the time routinely collected by several organizations contributing data. In most respects, those with complete data were clinically very similar to those without, despite statistically significant differences recorded due to the large sample sizes (Table 1). For example, there was a similar mean age (62 years), proportion of women (51 vs. 48%), ethnicity (43 vs. 46% non-European), systolic BP (137 mmHg), and median HbA1c (7.2 vs. 7.0% or 55 vs. 53 mmol/mol). Patients with complete data had a slightly longer duration of diabetes (median 5 vs. 4 years) and included a higher proportion of current or past smokers (46 vs. 39%). Renal function, where recorded, was similar in the two groups. Median sCr was 83 and 84 μmol/L, median eGFR was 75 and 76, and proportions with albuminuria at baseline were 37 and 33%, respectively.
Table 1.
Characteristics of the participants with type 2 diabetes in the DCS cohort comparing those with complete and incomplete data and characteristics of the final derivation and validation cohorts after all exclusions
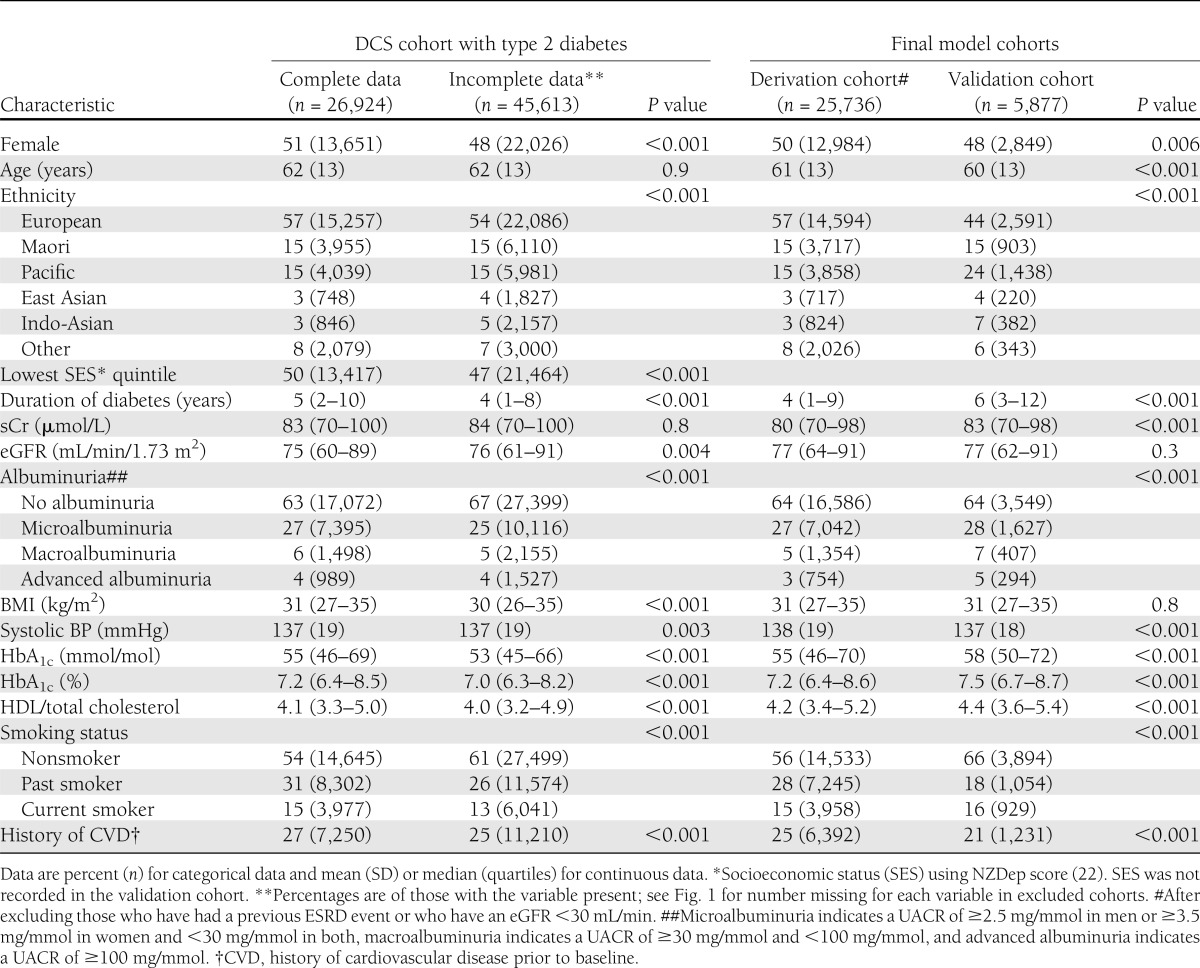
After excluding those with a previous end-stage renal event (dialysis, renal transplant [n = 104], or eGFR <30 mL/min [n = 1,084]), the final study cohort included 25,736 patients. Patients were followed for a median of 7.3 years (interquartile range 5.9–8.6 years), equivalent to 180,497 person-years, with 86% followed for at least 5 years. There were 637 (2.5%) first end-stage renal events during follow-up. The characteristics of those included in the derivation cohort are also presented in Table 1 and compared with the validation cohort.
Validation cohort.
There were 15,131 people with type 2 diabetes in the Diabetes Care Support Services audit database with at least 5 years of follow-up, of whom 8,900 had complete baseline data. In this cohort, compared with those with missing data, those with complete data had a slightly higher median HbA1c (7.6 vs. 7.2%: 58 vs. 55 mmol/mol), higher median eGFR (76 vs. 70 mL/min), and lower rates of albuminuria (42 vs. 49%) (Supplementary Table 3). After excluding those patients with a previous renal event or stage 4 to 5 CKD (n = 347) and those patients who were also in the DCS derivation cohort (n = 2,396), there were 5,877 patients available for the validation cohort (Supplementary Fig. 2). There were 121 (2.2%) renal events in the validation cohort during a 5-year follow-up. Characteristics of the validation cohort were generally similar to the derivation cohort, although the proportion of non-Europeans was higher (56 vs. 43%), duration of diabetes longer (6 vs. 4 years), and HbA1c slightly higher (7.5 vs. 7.2%: 58 vs. 55 mmol/mol) (Table 1).
Model derivation
Table 2 presents the hazard ratios of five risk models with different combinations of predictive variables, using the 25,736 patients with complete data and no exclusion criteria. Models 2, 3, and 4 performed the best with the highest C-statistic (0.89) and lowest Akaike statistics in the full derivation sample. After the addition of systolic BP and HbA1c, models 3 and 4 were only marginally better than model 2 (Table 2). Adding medication status to model 4 did not improve the performance in the derivation cohort and, furthermore, reduced the sample size to 15,856 (62%) due to missing information on its use (Supplementary Table 4). Models stratified by sex were tested but these did not improve predictive performance. BMI and serum lipid concentrations were not statistically significant and thus were not included.
Table 2.
Adjusted hazard ratios for risk of first end-stage renal event using different models
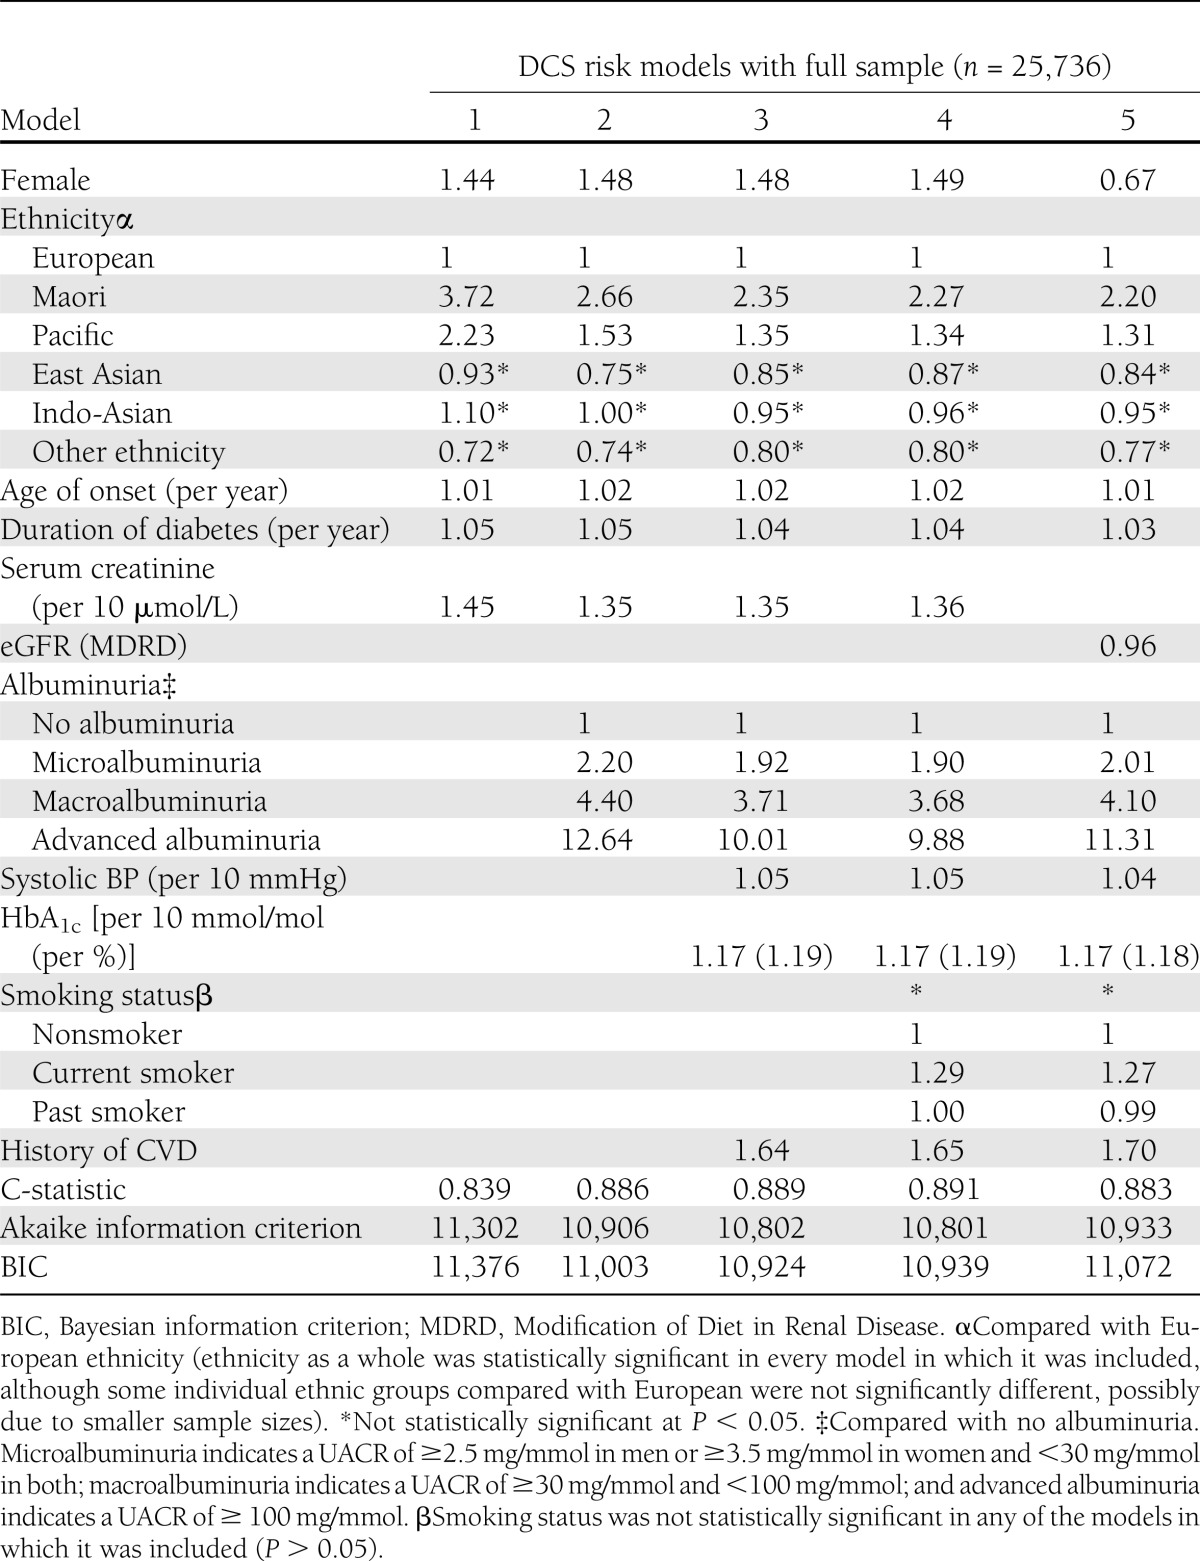
Albuminuria, sCr, ethnicity, and previous cardiovascular disease were all important predictors after controlling for other risk factors. While glycemic and BP control was also statistically significantly related to future renal events, model 2 without HbA1c and systolic BP performed almost as well as models 3 and 4. Women were at higher risk at any given level of sCr; however, women are known to have a lower sCr as normal. This sex risk association reversed when eGFR, rather than sCr, was included in the model due to sex adjustments in the eGFR formula. Ethnicity remained a significant predictor in all models. Full details of risk models 1, 2, 3, and 4 are included in Supplementary Table 5. Models 2, 3, and 4 were chosen as potential clinical risk score equations, and their validity was compared.
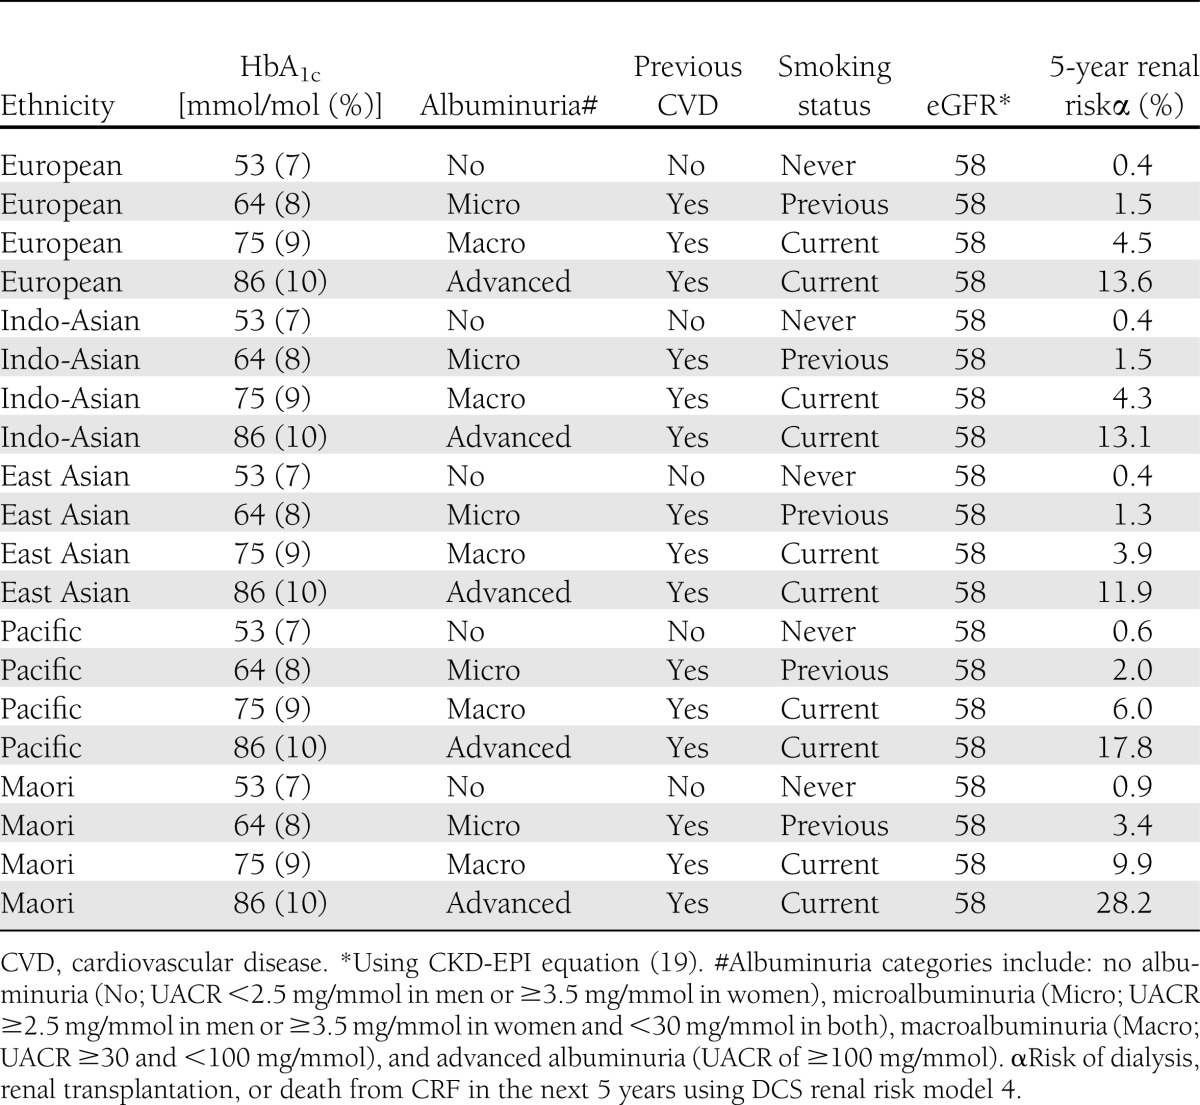
Table 3 demonstrates how the risk of developing an ESRD event varies considerably in a 55-year-old man with an eGFR of 58 mL/min depending on other demographic and clinical factors, which are incorporated in the renal risk model.
Table 3.
DCS 5-year risk estimation of end-stage renal event compared with eGFR* in a 55-year-old man with a systolic BP of 140 mmHg, sCr of 120 µmol/L, and diabetes duration of 5 years of different ethnic origins, glycemic control, albuminuria level, cardiovascular history, and smoking status
Model validation
Models 2, 3, and 4 also performed very well on calibration and discrimination in the validation cohort. When the validation cohort was divided into deciles of risk, predicted versus observed rates of renal events were very similar for models 2, 3, and 4 (Fig. 1). Models 2, 3, and 4 had substantial net reclassification improvements compared with model 1 (13.6, 12.5, and 14.1%, respectively) (Supplementary Table 6). There were small net reclassification improvements when using model 3 compared with model 2 (1.1%) or using model 4 compared with model 2 (0.5%). Sensitivity and specificity at different cutoff risks are presented in Supplementary Table 7. Using a cutoff of 2.5% 5-year renal risk, models 2, 3, and 4 had good sensitivity (76 to 77%) and specificity (88 to 89%). Using this cutoff, seven or eight individuals would be identified as high risk for every renal event occurring in the subsequent 5 years.
Figure 1.
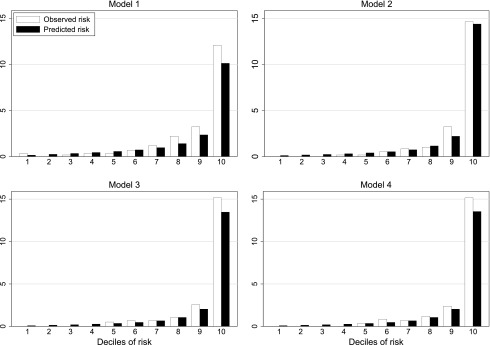
Observed versus predicted renal events by risk deciles in the validation cohort for DCS 5-year renal risk models 1, 2, 3, and 4 (see Table 2 for included variables).
The DCS 5-year risk models 2, 3, and 4 discriminated future risk of ESRD accurately in this primary care–based validation cohort with C-statistics of 0.92, 0.92, and 0.91, respectively (Supplementary Fig. 3 and Supplementary Table 6). In comparison, C-statistics for eGFR (CKD-EPI equation) and UACR for predicting first ESRD event over 5 years were 0.77 and 0.80, respectively, in the DCS derivation cohort and 0.81 and 0.89, respectively, in the validation cohort. C-statistics using the 3-year models 2, 3, 4, and 5 of Tangri et al. (14) were 0.81, 0.86, 0.86, and 0.81, respectively, when applied to the DCS derivation cohort and 0.78, 0.84, 0.84, and 0.88, respectively, when applied to our validation cohort. The 5-year kidney outcomes model of Jardine et al. (16) from the ADVANCE trial also performed well in both our derivation and validation cohorts (C statistics 0.86 and 0.89, respectively).
CONCLUSIONS
Main findings
The global burden of renal disease in diabetes is growing, with huge associated costs in dialysis and early mortality. Few interventions are known to reduce progression of renal disease in diabetes apart from tight BP control, use of ACE inhibitors and ARBs, and good glycemic control (9,10). Early detection and treatment are recommended based on the rationale that this could slow progression of disease and that maximal benefit requires some years of treatment (26). Improved risk stratification at baseline may thus help to identify earlier those at increased risk of ESRD as well as aid future research into new interventions to reduce progression. Renal risk models 2, 3, and 4 demonstrated excellent discrimination and calibration in the validation cohort. These models were able to discriminate risk of ESRD events more accurately than using eGFR or albuminuria alone. The choice of model used clinically would depend on the variables available, although where all are available, DCS model 4 is recommended. The models also performed rather better than internationally available renal risk models. This may have been due to the inclusion of ethnic groups relevant to NZ, as ethnicity contributed significantly to the models.
Strengths and limitations
We used data from a large national cohort of unselected primary care patients under routine care of their type 2 diabetes, with long follow-up (median over 7 years). However, only one-third of those originally assessed had full data available for the analysis, primarily due to several primary care organizations not requiring the reporting of sCr during data collection. There were, however, few clinically significant differences between those with complete data and those with missing data. We also did not have access to data on dietary and physical activity levels, which probably contribute to risk.
Only baseline data were used to predict risk. Changes in treatment and progression of disease were not taken into account. This lack of account of improvements in treatment over time may have caused underestimation of risk. Despite these limitations, the risk models performed very well in both the derivation and validation cohorts and allow accurate risk delineation across a wide range of risks based on initial data alone. Importantly, it thus appears that clinical renal risk can be determined quite early in the course of the disease.
The ESRD diagnosis is based on data from national and international databases that are used clinically. Hospital coding using ICD-9 and ICD-10 codes for death from CRF was used as the outcome and represented the most common renal event. While it was not possible to independently adjudicate the death certificate coding of each cause of death, all dialysis and renal transplantation for CRF events were cross-checked between the national hospital coding database and the independent Australasian renal registry (ANZDATA), and so are likely to be reliable. Therefore, independent validity testing has not been carried out on these diagnoses.
Many of those with high renal risk died of other causes, particularly from cardiovascular disease, prior to an ESRD event. Such competition of diseases makes accurate prediction of renal events problematic. However, the models still performed very well. Cardiovascular and renal risk assessment could be undertaken together, as the risk factors are similar (27). Even so, there are some differences between risk profiles and the documentation of renal as well as cardiovascular risk is likely to be particularly clinically useful.
Compared with existing models
Although the recent renal risk models of Tangri et al. (14) have performed very well in secondary care populations with more advanced disease, some require variables that are not routinely measured in primary care (e.g., serum albumin, calcium, phosphate, and bicarbonate), while our models use variables routinely available in primary care. However, models 3, 4, and 5 of Tangri et al. (14), which included variables similar to our own, but without measures of glycemia, duration of diabetes, or history of CVD, performed well in our primary care cohorts (C-statistics 0.81–0.88). Even so, our DCS models 2, 3, and 4 demonstrated even better discrimination in the separate validation cohort (C-statistics 0.91–0.92).
Jardine et al. (16) recently published an equation predicting risk of major kidney events, including doubling of sCr to ≥2.26 mg/dL (≥200 µmol/L), renal replacement therapy, or renal death among people with type 2 diabetes from the ADVANCE trial. Their equation performed very well in both our derivation and validation cohorts (C-statistics 0.86–0.89). It is likely that the improvement in performance of our models 2–4 in our validation cohort was due to the inclusion of regionally relevant ethnic groups. Whether ethnicity is acting as a surrogate for other yet unmeasured clinical risk factors or whether there are genetic predispositions is not understood, but its inclusion in the model currently helps to identify those at high risk. Other countries might benefit by amending and validating the models to incorporate locally relevant high-risk ethnic or other groups. The difference may also reflect our slightly different definition of the composite outcome and the fact that we did not have retinopathy or educational variables so assumed no retinopathy at baseline and attendance at education until at least 16 years of age.
Other studies have found that serum hemoglobin (15), renal artery stenosis (28), and inflammatory biomarkers (29) are also predictive of ESRD. Decreasing serum hemoglobin is usually a relatively late sign of renal impairment, while the other two variables are often not available in primary care populations. Furthermore, risk prediction was very good without their inclusion. We could not compare the performance of the QKidney risk model with the DCS models, as we did not collect several of their risk variables (1). Even so, the performance of our models was better in our independent validation cohort than QKidney was in their general population validation cohort (1).
While this study found a significant increase in hazard ratio with increasing glycemia and systolic BP, their influence was small, producing only a marginal improvement in prediction. Other studies have similar findings, with only extremes of glycemia associated with increased risk of mortality in ESRD (30). This may be influenced by the fact that many of these studies, including ours, only took baseline data into account. Other studies have shown the importance of high HbA1c, particularly sustained elevations, in the rate of progression of renal disease, independent of tight BP control (9). Interestingly, BMI was not associated with ESRD events, and smoking status as a whole did not reach statistical significance. A previous meta-analysis of cohort studies examining the associations between risk factors and renal death also found that neither excess weight nor smoking was related to renal death (31).
Implications for clinical practice and future research
This study enables the incorporation of multiple commonly measured parameters to derive risk and thus better define those who require intensification of standard therapy, closer monitoring of both adherence and therapeutic efficacy, or early referral for secondary renal and diabetes services. The paper presents the science behind a very clinical application. In practical use, we would expect the equations to be hidden behind clinical software or clinical decision support, which is now used quite extensively in primary care cardiovascular risk assessment and prompting of management decision making (e.g., http://www.nzssd.org.nz/cvd/ [27]).
Ability to prioritize and assess risk accurately can be improved over our current clinical approach. The use of model 4 was much more discriminating than using eGFR, or UACR, to assess the likelihood of progressing to ESRD event and urgency of need for intervention. Furthermore, it is not realistic or appropriate to refer all patients with diabetes with deteriorating eGFR to nephrologists, so more accurate clinical prioritization is helpful. Being able to enumerate the risk will also be important in treatment pathways, and the use of (externally validated) risk models will be able to be incorporated to ensure that escalation of care (e.g., chronic care programs, secondary care) can be based on risk rather than clinician factors, (in)equities, or less precise clinical descriptions.
DCS models 2, 3, and 4 could also be run across whole primary care populations to identify those at high risk or those not already on optimized preventative therapy or to find those not reaching recommended targets. A 5-year renal risk cutoff of 2.5% appears to give good sensitivity and specificity; it is, however, outside the scope of this study to specify therapy approaches, as the effect of altering therapy on outcomes as a response to a level of risk has not been studied.
Renal risk assessment may additionally help raise awareness of CKD or act as a motivational or educational tool to achieve better patient self-management, improved BP control (particularly with ACE inhibitors and ARB medications), tight glycemic control, avoidance of renotoxic medications such as nonsteroidal anti-inflammatory agents, and possibly proactive lifestyle changes including weight loss, physical activity, and smoking cessation (32,33).
Acknowledgments
This work was supported by the NZ Health Research Council and the Auckland Medical Research Foundation.
No potential conflicts of interest relevant to this article were reported.
C.R.E. oversaw the study design, data collection, analysis, and manuscript writing. T.R., S.A.M., and E.R. contributed to the design and manuscript writing and undertook the data management and analyses. T.K., J.C., and P.L.D. contributed to the design, advised on clinical issues, and contributed to the manuscript writing. B.O.-W. was responsible for Diabetes Care Support Services validation cohort data access from the Diabetes Projects Trust, advised on interpretation, and contributed to writing of the manuscript. C.R.E. is the guarantor of this work and, as such, had full access to all the data in the study and takes responsibility for the integrity of the data and the accuracy of the data analysis.
Parts of this study were presented in abstract form at the 73rd Scientific Sessions of the American Diabetes Association, Chicago, Illinois, 21–25 June 2013.
The authors thank the patients, primary care practitioners, primary care organizations, diabetes trusts, the DCS team, Diabetes Projects Trust, NZ Ministry of Health, and the ANZDATA registry of renal replacement, who contributed data to the study. The authors also thank Prof. Navdeep Tangri from the University of Manitoba for providing the renal risk models from his study.
Footnotes
This article contains Supplementary Data online at http://care.diabetesjournals.org/lookup/suppl/doi:10.2337/dc13-0190/-/DC1.
References
- 1.Hippisley-Cox J, Coupland C. Predicting the risk of chronic Kidney Disease in men and women in England and Wales: prospective derivation and external validation of the QKidney Scores. BMC Fam Pract 2010;11:49. [DOI] [PMC free article] [PubMed] [Google Scholar]
- 2.Atkins RC, Zimmet P. Diabetic kidney disease: act now or pay later. Acta Diabetol 2010;47:1–4 [DOI] [PubMed] [Google Scholar]
- 3.Burrows NR, Li Y, Williams DE. Racial and ethnic differences in trends of end-stage renal disease: United States, 1995 to 2005. Adv Chronic Kidney Dis 2008;15:147–152 [DOI] [PubMed] [Google Scholar]
- 4.McClellan WM, Warnock DG, Judd S, et al. Albuminuria and racial disparities in the risk for ESRD. J Am Soc Nephrol 2011;22:1721–1728 [DOI] [PMC free article] [PubMed] [Google Scholar]
- 5.Ranasinghe P, Perera YS, Makarim MFM, Wijesinghe A, Wanigasuriya K. The costs in provision of haemodialysis in a developing country: a multi-centered study. BMC Nephrol 2011;12:42. [DOI] [PMC free article] [PubMed] [Google Scholar]
- 6.Sharif A, Baboolal K. Update on dialysis economics in the UK. Perit Dial Int 2011;31(Suppl. 2):S58–S62 [DOI] [PubMed] [Google Scholar]
- 7.Lysaght MJ. Maintenance dialysis population dynamics: current trends and long-term implications. J Am Soc Nephrol 2002;13(Suppl. 1):S37–S40 [PubMed] [Google Scholar]
- 8.Hemmingsen B, Lund SS, Gluud C, et al. Targeting intensive glycaemic control versus targeting conventional glycaemic control for type 2 diabetes mellitus. Cochrane Database Syst Rev 2011;6:CD008143. [DOI] [PubMed] [Google Scholar]
- 9.Nosadini R, Velussi M, Brocco E, et al. Course of renal function in type 2 diabetic patients with abnormalities of albumin excretion rate. Diabetes 2000;49:476–484 [DOI] [PubMed] [Google Scholar]
- 10.Strippoli FMG, Bonifati C, Craig ME, Navaneethan SD, Craig JC. Angiotensin converting enzyme inhibitors and angiotensin II receptor antagonists for preventing the progression of diabetic kidney disease. Cochrane Database Syst Rev 2006;4:CD006257. [DOI] [PMC free article] [PubMed] [Google Scholar]
- 11.Strippoli GFM, Craig ME, Craig JC. Antihypertensive agents for preventing diabetic kidney disease. Cochrane Database Syst Rev 2005;4:CD004136. [DOI] [PubMed] [Google Scholar]
- 12.Gansevoort RT, Matsushita K, van der Velde M, et al. Chronic Kidney Disease Prognosis Consortium Lower estimated GFR and higher albuminuria are associated with adverse kidney outcomes. A collaborative meta-analysis of general and high-risk population cohorts. Kidney Int 2011;80:93–104 [DOI] [PMC free article] [PubMed] [Google Scholar]
- 13.Chien KL, Lin HJ, Lee BC, Hsu HC, Lee YT, Chen MF. A prediction model for the risk of incident chronic kidney disease. Am J Med 2010;123:836–846e2 [DOI] [PubMed] [Google Scholar]
- 14.Tangri N, Stevens LA, Griffith J, et al. A predictive model for progression of chronic kidney disease to kidney failure. JAMA 2011;305:1553–1559 [DOI] [PubMed] [Google Scholar]
- 15.Keane WF, Zhang Z, Lyle PA, et al. RENAAL Study Investigators Risk scores for predicting outcomes in patients with type 2 diabetes and nephropathy: the RENAAL study. Clin J Am Soc Nephrol 2006;1:761–767 [DOI] [PubMed] [Google Scholar]
- 16.Jardine MJ, Hata J, Woodward M, et al. ADVANCE Collaborative Group Prediction of kidney-related outcomes in patients with type 2 diabetes. Am J Kidney Dis 2012;60:770–778 [DOI] [PubMed] [Google Scholar]
- 17.Elley CR, Kenealy T, Robinson E, Drury PL. Glycated haemoglobin and cardiovascular outcomes in people with Type 2 diabetes: a large prospective cohort study. Diabet Med 2008;25:1295–1301 [DOI] [PubMed] [Google Scholar]
- 18.Levey AS, Bosch JP, Lewis JB, Greene T, Rogers N, Roth D, Modification of Diet in Renal Disease Study Group A more accurate method to estimate glomerular filtration rate from serum creatinine: a new prediction equation. Ann Intern Med 1999;130:461–470 [DOI] [PubMed] [Google Scholar]
- 19.Levey AS, Stevens LA, Schmid CH, et al. CKD-EPI (Chronic Kidney Disease Epidemiology Collaboration) A new equation to estimate glomerular filtration rate. Ann Intern Med 2009;150:604–612 [DOI] [PMC free article] [PubMed] [Google Scholar]
- 20.Diabetes Projects Trust Website [Internet], 2012. Available from http://www.dpt.org.nz/ Accessed 7 January 2013
- 21.Australia and New Zealand Dialysis and Transplant Registry. ANZDATA 34th Annual Report [Internet], 2011. McDonald S, Hurst K, Eds. Available from http://www.anzdata.org.au/anzdata/anzdatareport/34threport/2011c00_front%20pages_v1.6.pdf Accessed 7 January 2013
- 22.Salmond C, Crampton P, Sutton F. NZDep91: A New Zealand index of deprivation. Aust N Z J Public Health 1998;22:835–837 [DOI] [PubMed] [Google Scholar]
- 23.Therneau T, Grambsch P. Modeling Survival Data: Extending the Cox Model. New York, Springer, 2000 [Google Scholar]
- 24.Pencina MJ, D’Agostino RB, Sr, Steyerberg EW. Extensions of net reclassification improvement calculations to measure usefulness of new biomarkers. Stat Med 2011;30:11–21 [DOI] [PMC free article] [PubMed] [Google Scholar]
- 25.Diabetes in New Zealand. Models and Forecasts 1996–2011 [article online], 2002. Available from http://www.health.govt.nz/publication/diabetes-new-zealand-models-and-forecasts-1996-2011 Accessed 7 January 2013
- 26.Stevens LA, Greene T, Levey AS. Surrogate end points for clinical trials of kidney disease progression. Clin J Am Soc Nephrol 2006;1:874–884 [DOI] [PubMed] [Google Scholar]
- 27.Elley CR, Robinson E, Kenealy T, Bramley D, Drury PL. Derivation and validation of a new cardiovascular risk score for people with type 2 diabetes: the New Zealand diabetes cohort study. Diabetes Care 2010;33:1347–1352 [DOI] [PMC free article] [PubMed] [Google Scholar]
- 28.Chiu Y-W, Adler S, Budoff M, Takasu J, Ashai J, Mehrotra R. Prevalence and prognostic significance of renal artery calcification in patients with diabetes and proteinuria. Clin J Am Soc Nephrol 2010;5:2093–2100 [DOI] [PMC free article] [PubMed] [Google Scholar]
- 29.Cao C, Wan X, Chen Y, Wu W. Metabolic factors and microinflammatory state promote kidney injury in type 2 diabetes mellitus patients. Ren Fail 2009;31:470–474 [DOI] [PubMed] [Google Scholar]
- 30.Williams ME, Lacson E, Jr, Wang W, Lazarus JM, Hakim R. Glycemic control and extended hemodialysis survival in patients with diabetes mellitus: comparative results of traditional and time-dependent Cox model analyses. Clin J Am Soc Nephrol 2010;5:1595–1601 [DOI] [PMC free article] [PubMed] [Google Scholar]
- 31.O’Seaghdha CM, Perkovic V, Lam TH, et al. Asia Pacific Cohort Studies Collaboration Blood pressure is a major risk factor for renal death: an analysis of 560 352 participants from the Asia-Pacific region. Hypertension 2009;54:509–515 [DOI] [PubMed] [Google Scholar]
- 32.Codreanu I, Perico N, Remuzzi G. Dual blockade of the renin-angiotensin system: the ultimate treatment for renal protection? J Am Soc Nephrol 2005;16(Suppl. 1):S34–S38 [DOI] [PubMed] [Google Scholar]
- 33.Fioretto P, Solini A. Antihypertensive treatment and multifactorial approach for renal protection in diabetes. J Am Soc Nephrol 2005;16(Suppl. 1):S18–S21 [DOI] [PubMed] [Google Scholar]