

Abstract
In the mouse model of permanent, middle cerebral artery occlusion, infarct volume varies widely across inbred strains but generally is inversely correlated with collateral vessel number. However, we also observed certain mouse strains that share similar collateral vessel anatomy but exhibit significantly different infarct volume. To identify genetic factors determining infarct volume in a collateral vessel-independent manner, we performed quantitative trait locus analysis on a F2 cross between C57BL/6J and C3H/HeJ strains. We mapped four novel loci (Civq4 through Civq7) that modulate infarct volume. Civq4, on chromosome 8, is the strongest locus (logarithm of the odds 9.8) that contributes 21% of the phenotypic variance of infarct volume in the cross. The Civq4 and Civq6 loci represent transgressive B6 alleles that render animals susceptible to larger infarcts. Based on genomic sequence and microarray analyses, we propose candidate genes for the Civq4 locus. By selecting inbred strains with similar collateral vessel anatomy but that vary significantly in infarct volume, we have mapped four loci determining infarct volume in a mouse model of ischemic stroke. Two of the loci appear to modulate infarct volume through a collateral vessel-independent mechanism. Based on strain-specific sequence variants and differences in transcript levels, Msr1 and Mtmr7 appear to be strong candidate genes for Civq4. Identifying the underlying genetic factors of these loci will elucidate the genetic architecture response to cerebral ischemia, shed new light on disease mechanisms of ischemic stroke, and identify potential therapeutic targets for clinical applications.
Keywords: ischemic stroke, collateral circulation, quantitative trait locus, transgressive segregation, stroke genetics
despite advances in treatment, cerebrovascular disease (stroke) remains a significant public health issue with ∼795,000 new cases in the United States each year (35). The majority (87%) of stroke is ischemic in origin, caused by an interruption of blood flow in the cerebral arteries, leading to cerebral infarction (neuronal death). Currently, several genome-wide association studies have discovered genetic risk variants for ischemic stroke, but these studies explain only a small portion of the total genetic risk (6, 29). Moreover, these variants are generally associated with the risk to develop ischemic disease and do not relate to the various stroke outcomes. Stroke outcomes will be particularly difficult to uncover in human populations given the wide variability in the location and extent of the occluded vessel, as well as variation in period of time between the onset of ischemia and medical intervention. Thus, we have proposed to use animal models of ischemic stroke as an alternative to identify genetic factors modifying the ischemic stroke outcome of infarct volume (24).
Harnessing the wide variation in infarct volume in inbred mouse strains after permanent middle cerebral artery occlusion (MCAO), we previously mapped three quantitative trait loci (QTLs) that modulate infarct volume (24). The most robust of these loci, Civq1 (cerebral infarct volume QTL 1) on mouse chromosome 7, contributes >50% of the variation in infarct volume in multiple pairwise crosses of inbred strains of mice (24). As the ischemia is surgically induced, these genetic factors modulate the stroke outcome of infarct volume but not the initial risk to develop the ischemic insult.
Two major mechanisms, neuroprotection and native pial collateral circulation, have been proposed to explain the variation of infarct volume between individuals or in animal models (11, 19, 20, 43). Collateral vessels are arteriole-to-arteriole anastomoses that can create a compensatory circulatory pathway when the flow in one arteriole is interrupted. In the mouse, the pial collateral number reaches its maximal levels by 21 days postnatally (p21), and this number is maintained into adulthood, although some attrition is seen in very old animals (8, 12). Recently, a locus modulating variation in collateral number and diameter (Canq1, collateral artery number QTL 1) has also been mapped on chromosome 7, which contributes 37% of the phenotypic variance in collateral number (41). This locus overlaps Civq1 (24). Thus, these overlapping QTLs for the two traits further support the hypothesis that the native collateral number plays a significant role in determining infarct volume.
Although the correlation of infarct volume with collateral anatomy holds for most inbred mouse strains, certain strain pairs exhibit similar collateral number but significantly different infarct volumes (24, 43). This suggests that mechanisms other than collateral vessel traits can contribute to infarct volume, but these can be identified only by judicious choice of inbred strains for the QTL mapping. This approach has enabled us to identify novel genetic factors without interference from collateral vessel phenotypes. The aim of this study is to identify novel genetic factors determining infarct volume independently of native collateral anatomy, to eventually provide novel targets for therapy for ischemic stroke. And unlike the use of genetically engineered mouse strains (gene ablation or transgenic overexpression) as the engine of discovery, these gene targets would be identified via their naturally occurring alleles, strongly modulating infarction while remaining fully compatible with normal physiology.
MATERIALS AND METHODS
Mice.
Both inbred strains of mice were obtained from the Jackson Laboratory (Bar Harbor, ME) and then bred locally at Duke University. All mice were fed a regular chow diet (PicoLab Mouse Diet 20, LabDiet). All mice were age-matched for collateral vessel traits measurement (p21 and 12 ± 1 wk) and for measurement of infarct volume after MCAO (12 ± 1 wk). Although we have shown that these phenotypes do not vary greatly according to sex, both sexes of mouse were used. Two independent cohorts of the F1 and F2 progeny of C57BL/6J (B6) and C3H/HeJ (C3H) were generated by a reciprocal breeding scheme. The first cohort was used for the measurement of infarct volume, whereas the second independent cohort was used to measure collateral vessel anatomy. To generate the F1 and F2 progeny, we used both males and females of each parental strain to intentionally examine the potential effect of sex chromosomes (or mitochondrial genomes) on phenotypes. Animal studies were performed under protocols approved by Animal Care and Use Committee of Duke University.
Middle cerebral artery and pial collateral circulation measurements.
We used a previously described dye-enhanced technique (43) with modification to stain the cerebral circulation, followed by collateral number and diameter measurements. As the collateral vessel traits are determined by 3 wk of age and remain constant for many months (8), we measured collateral phenotypes at age p21. Briefly, animals were first anesthetized with ketamine (100 mg/kg) and xylene (5 mg/kg). The left ventricle was cannulated retrograde, and the animal was well perfused with freshly made buffer composed of adenosine (1 mg/ml), papaverine (40 μg/ml), and heparin (25 mg/ml) in phosphate-buffered saline to wash out blood. The dorsal calvarium was removed to expose the brain before dye infusion. The left cardiac ventricle was cannulated retrograde through the previous cannulation site and polyurethane (PU4ii, VasQtec) with adequate viscosity to avoid capillary filling (1:1 resin/2-butanone) was slowly infused, and the cerebral circulation was visualized under stereomicroscope during infusion. Then, the brain surface was topically rinsed with 10% formalin and 20 min was allowed for the dye to solidify before overnight storage in 10% formalin. Each sample was imaged 24 h later for further analysis. The number and diameter of collateral vessels connecting the anterior cerebral artery and middle cerebral artery (MCA) on both hemispheres were counted and measured as previously described (41) with modifications. Briefly, collateral number was directly measured under stereomicroscope, whereas collateral diameter was measured from images using the image-processing package, Fiji (http://fiji.sc). The vasculature of each brain was imaged with a Nikon SMZ-2T stereomicroscope (Melville, NY) equipped with a Leica DFC425 camera (Buffalo Grove, IL). For diameter analysis, the central area of each brain was imaged, and three to six spots of the midzone of the collateral vessel were measured after optimal calibration. Collateral conductance was calculated as the product of the number multiplied the diameter of the collateral vessels (collateral number × diameter) (41). The number of primary MCA branches was determined from images covering the whole brain surface.
Surgical procedure of MCAO.
Focal cerebral ischemia was induced by distal MCA cauterization as described previously (24). Briefly, mice were first anesthetized with ketamine (100 mg/kg) and xylene (5 mg/kg). Then, the right MCA was exposed by a 0.5 cm vertical skin incision midway between the right eye and ear. After the temporalis muscle was split, a 2-mm burr hole was drilled at the junction of zygomatic arch and the squamous bone. The right MCA was visualized under a stereomicroscope and electrocauterized with a microcauterizer (F.S.T., Foster City, CA). The cauterized MCA was further transected distally with a lancet to verify the permanent MCA occlusion was complete. The surgical site was closed layer by layer with 6-0 sterile nylon sutures, and 0.25% bupivacaine was topically applied for local pain control. Animals were maintained at 37°C during and after surgery until fully recovered from anesthesia, when they were returned to their cages with free access to water and food. All mice were housed in an air-ventilated room with ambient humidity with room temperature maintained at 24 ± 0.5°C.
Four animals died during the procedure and were excluded from further analysis, giving a postsurgical survival rate of 98.3%. An additional 16 animals were excluded from analysis on the basis of predetermined exclusion criteria. Five were excluded because of postmortem evidence of incomplete surgical occlusion of the MCA, and 11 animals were excluded because of inadvertent cauterization of a branching vessel from the MCA, and not the MCA proper.
Measurement of infarct volume of mouse brain after MCAO.
Infarct volume was measured at 24 h after MCAO, as previously described (24). In brief, the brain was removed after proper euthanasia. Body and brain weights of each mouse were measured. Each brain was inspected under a stereomicroscope and imaged to identify the MCA branching pattern and location of cauterization and to verify the success of permanent occlusion. Since animals harboring aberrant branches from the MCA might alter the infarct volume, these animals were excluded for future analysis. Subsequently, the brain was sliced into nine 1-mm coronal sections using a brain matrix. Slices were stained with 2% triphenyltetrazolium chloride as previously described (24). We determined infarct volume by measuring infarct area on separate slices, multiplying area by slice thickness, and then summing all slices (24). The edematous change of brain slices, if present, was corrected accordingly (16, 24).
Genomic DNA isolation and genotyping.
Genomic DNA was purified from tails treated by overnight proteinase K digestion at 55°C, followed by isopropanol precipitation. Genomic DNA samples were genotyped using the GoldenGate genotyping assay (Illumina, San Diego, CA), consisting of 377 genome-wide mouse single nucleotide polymorphisms (SNP). For fine mapping of the linkage peaks, additional markers were genotyped for Civq4 through Civq7. The additional markers for Civq4 (chromosome 8) were rs30481888, rs33198371, rs33154273, and rs32709547; for Civq5 (chromosome 18), D18mit156, D18mit22, D18mit135, and D18mit178; for Civq6 (chromosome 5), D5mit355, D5mit398, D5mit18, D5mit91, D5mit431, and D5mit138; and for Civq7 (chromosome 10), rs3696307. Genetic map positions are reported based on the SNP database (build 37.1) of the National Center for Biotechnology Information (NCBI) website (http://www.ncbi.nlm.nih.gov/projects/SNP/).
Linkage analysis.
Genome-wide linkage analysis was performed using the J/qtl mapping program, version 1.3.3 (http://churchill.jax.org/software/jqtl.shtml). Suggestive (P = 0.63) and significant (P = 0.05) thresholds for each phenotype were determined by 1,000 permutation tests using all informative markers (24, 26). The 95% confidence interval (CI) of each peak was determined using the CI function in J/qtl. The percentage of total trait variance attributable (effect size) to each locus was determined using the Fit QTL function provided within the J/qtl program. Effect size is defined as the percentage of phenotypic variation explained by a given locus. A genome-wide analysis of interaction (epistatic or additive) between loci was performed. QTLs reaching a significant threshold value were named in accordance with the International Committee on Standard Genetic Nomenclature for Mice, and our previous work (24).
Candidate gene identification using sequence variation and gene expression.
We utilized two criteria to assess candidate genes located in the 95% CI region of Civq4 (38–51.1 Mb). The causative gene(s) might either alter the amino acid sequence of the encoded protein or change the mRNA level of the gene. First, we used the Mouse Phenome Database (http://phenome.jax.org), dbSNP (http://www.ncbi.nlm.nih.gov/SNP/) and Mouse Genomes Project database (http://www.sanger.ac.uk/cgi-bin/modelorgs/mousegenomes/snps.pl) to identify nonsynonymous coding SNPs (NS cSNP), stop codon gain/losses, splicing site gain/losses, indel, and structural variants between B6 and C3H strains. These data were cross-checked using the Ensembl Genome Browser (http://useast.ensembl.org) and, when required, Sanger sequencing in our laboratory. Candidate genes were also filtered by the requirement to be expressed in brain tissue (but not exclusively) using the BioGPS (http://biogps.org) and the EMBL-EBI (http://www.ebi.ac.uk) databases. To determine the potential functional impact of these NS cSNPs, we utilized PolyPhen-2 (http://genetics.bwh.harvard.edu/pph2/) (1). The gene expression analysis was performed on mouse cerebral cortex of B6 and C3H mice, collected at two ages: p1 and 11 wk. Total RNA of cerebral cortex of both strains was purified using RNeasy Kit followed by DNase treatment (Qiagen, Valencia, CA). Samples from each time point and strain were collected in triplicate. Microarray analysis was performed on an Affymetrix Mouse 430 2.0 Array (Affymetrix, Santa Clara, CA). Microarray data analysis was performed using the Partek Genomics Suite (Partek, St. Louis, MO). Significant expression differences between strains were verified by a quantitative real-time PCR (qRT-PCR) assay from tissue isolated from both parental strains and, when possible (i.e., when a strain-specific SNP was present in the transcript), by allelic-specific gene expression analysis using the SNaPshot Multiplex Kit (Life Technologies, Grand Island, NY) using tissue isolated from F1 (B6/C3H) animals (Table 1).
Table 1.
Primers for qRT-PCR and allelic-specific gene expression (SNaPshot) assay
| qRT-PCR primers | |
| ENSMUST00000048898 | forward: 5′-AGCAGCTGGAGGAAGAACTG-3′ |
| reverse: 5′-GCTGGGCTCACTTTGCTTAC-3′ | |
| ENSMUST00000174205 | forward: 5′-GAAGGAGAGGCGAGAACTCA-3′ |
| reverse: 5′-TTGGCCTCTGAATGTTAAGTCA-3′ | |
| Allelic-specific gene expression assay primers | |
| ENSMUST00000048898: rs49516108 | forward: 5′-CCCCGACCTCTCAGTGAATA-3′ |
| reverse: 5′-CGAATTGCACTTTCCCCTTA-3′ | |
| SNaPshot reverse: 5′-GTGAGAAACACAGCTTCGTC-3′ | |
| ENSMUST00000174205: rs33061917 | forward: 5′-TCATTTCTGACAGCACAGCA-3′ |
| reverse: 5′-CTGTCATGCTGGGGGTATCT-3′ | |
| SNaPshot forward: 5′-TGGCCCAGGCACTGTTCTAC-3′ | |
Statistical analysis.
All the data are presented as means ± SD. Statistical analyses of collateral vessel traits, number of primary branch from MCA, and infarct volume were performed by one-way ANOVA. χ2 analysis was to statistically analyze the genotype distribution for each phenotype.
RESULTS
Collateral diameter but not number differs between B6 and C3H.
Collateral number has been proposed as a major factor determining infarct volume in the mouse model of ischemic stroke (43). However, we have observed a few inbred mouse strains (B6, C3H, and LP/J) that exhibit similar collateral number but that differ significantly in infarct volume. We surmised that crosses between these strains might enable us to identify collateral vessel-independent genetic determinants of infarct volume. And since the Civq1 (infarct volume) and the Canq1 (collateral number) loci appear to be one and the same, most crosses between a “small infarct/high collateral number” inbred strain with a “large infarct/low collateral number” inbred strain will invariably reidentify the same large effect Civq1/Canq1 locus, as we have previously shown (24). With the phenotypic effects from this robust locus eliminated, we hoped to uncover additional loci that are otherwise masked by the overwhelming phenotypic effects of Civq1/Canq1.
We first reinvestigated the collateral vessel phenotypes between inbred strains B6 and C3H at p21 and 12 ± 1 wk old, the latter being the age that we routinely perform MCAO in our stroke model (Fig. 1, A–D). We observed no statistically significant difference between B6 and C3H in collateral number at either the p21 or 12 ± 1 wk age (Fig. 1E). Thus, the collateral number phenotype is similar between these two strains, while the C3H strain exhibits a fourfold larger infarct volume after MCAO than that seen with B6 (19.3 vs. 4.8 mm3, P < 0.01) (Fig. 2). This suggests that the difference in infarct volume between B6 and C3H might be determined by mechanisms other than collateral number. In each parental strain, the infarct volume does not vary according to sex (data not shown).
Fig. 1.

Collateral vessel anatomy on the pial surface of the cerebral cortex of C57BL/6J (B6) and C3H/HeJ (C3H) inbred strains. Representative photographs for postnatal day 21 (p21) B6 (A) and p21 C3H (B). The red arrowheads indicate collateral vessels. C: 12 ± 1 wk old B6. D: 12 ± 1 wk old C3H. E: collateral number/hemisphere is similar between at age p21 and 12 ± 1 wk. F: At p21, B6 and F1 progeny of B6 and C3H (F1B3H) exhibit significantly larger collateral diameter/hemisphere than that in C3H. G: the collateral conductance/hemisphere is different between B6 and C3H at p21. MCA, middle cerebral artery; ACA, anterior cerebral artery; NS, nonsignificant; AU, artificial unit. **P < 0.01 vs. B6.
Fig. 2.

Infarct volumes after middle cerebral artery occlusion (MCAO) for B6 and C3H mice. A: serial brain sections from a representative animal of each strain 24 h after MCAO. The infarct appears as white tissue after triphenyltetrazolium chloride staining. B: C3H exhibits significantly larger infarcts than B6. F1B3H, F1 progeny of B6 and C3H. **P < 0.01 vs. B6.
In addition to collateral number, collateral diameter has also been proposed as a factor modulating infarct volume, although diameter alone (in the absence of a difference in collateral number) is not a robust predictor of infarct volume, especially for strain C3H (41, 43). Collateral diameter differs between B6 and C3H, with the average collateral diameter at p21 of 22.2 μm in B6 and 16.9 μm in C3H (P < 0.01) (Fig. 1F). Collateral conductance, calculated from collateral number and diameter, is also lower in C3H compared with B6 (Fig. 1G).
In addition to collateral vessel traits, the infarct volume will be most obviously influenced by the size of the area supplied by the culprit artery, in this case the MCA, but the MCA territory is nearly identical between B6 and C3H (43). We also investigated whether the number of primary branches of MCA might contribute to the observed differences in infarct volume between strains. However, B6, C3H, and their F1 progeny do not differ in this trait (data not shown).
Four novel loci modulate infarct volume differences between B6 and C3H.
We generated an initial cohort of 230 F2 animals, and MCAO was performed on the entire cohort at age 12 ± 1 wk. After applying predetermined inclusion criteria (see materials and methods), we found that 210 F2 animals remained for QTL mapping. The distribution of infarct volume in this 210 F2 cohort was quite broad, ranging from 0.36 to 35.4 mm3 (Fig. 3A), providing more than sufficient phenotypic variation for the linkage analysis. The number of males and females were distributed nearly equally, and infarct volume in the F2 animals did not vary according to sex (Fig. 3B).
Fig. 3.

The distribution of the infarct volume phenotype in the F2 progeny of B6 and C3H (F2B3H) used in the quantitative trait locus (QTL) analysis. A: a scatter plot of the infarct volume distribution of B6, C3H, and F2B3H. B: there is no significant difference in infarct volume between males and females.
Each animal of the F2 cohort was genotyped with a genome-wide mapping panel of which 264 SNP markers were informative. We then performed whole genome linkage analysis for the phenotype of infarct volume (Fig. 4). As we had predicted, the robust Civq1 locus mapping to chromosome 7 was not identified in this cross, and in fact, the linkage profile for chromosome 7 is nearly flat. Thus, the predominant locus (Civq1/Canp1) affecting infarct volume in other pairwise crosses (24, 41) was rendered inert by our judicious choice of parental strains that exhibit large variation in infarct volume with minimal to no differences in collateral vascular anatomy.
Fig. 4.

Four novel QTLs for infarct volume were mapped with 210 F2 progeny (B6 and C3H). The graph represents the genome-wide linkage scan for infarct volume measured 24 h after MCAO. Statistically significant (P < 0.05) and suggestive (P < 0.63) levels were determined by a data permutation test. The locus on chromosome 8 reaches a logarithm of the odds (LOD) score of 9.8. The LOD scores of other statistically significant loci are chromosome 18, 4.2, chromosome 5, 3.7, and chromosome 10, 3.5.
In the absence of the usually overwhelming effects of Civq1 on infarct volume, four new linkage peaks reached genome-wide significance. These were designated as Civq4 through Civq7 based on the magnitude of the LOD (logarithm of the odds) score and our previous work that identified three distinct loci for this trait (24). The new significant loci are Civq4 (chromosome 8, LOD 9.8), Civq5 (chromosome 18, LOD 4.2), Civq6 (chromosome 5, LOD 3.7), and Civq7 (chromosome 10, LOD 3.5). We also examined the genotype distributions of the F2 mice to identify any deviations from Mendelian segregation, and the genotypes at all four loci followed the expected 1:2:1 distribution of B6/B6:B6/C3H:C3H/C3H alleles.
Among the four loci, Civq4 is the strongest, contributing 21% of the phenotypic variance of infarct volume. To better define the linkage interval, we genotyped mice for four additional markers mapping within the linkage peak. The resulting 95% CI for Civq4 is from 38.0 to 51.1 Mb (Fig. 5). In contrast to the C3H parental strain that exhibits a larger infarct volume than B6, the C3H allele at Civq4 renders animals more resistant to infarction, whereas the B6 allele renders them more sensitive to infarction. These alleles that operate in the opposite direction of the parental strain phenotypes are termed transgressive alleles.
Fig. 5.

The Civq4 locus mapping to chromosome 8 harbors transgressive alleles for these strains. A: the LOD score at the peak is 9.8, and the 95% confidence interval (CI; vertical lines) is from 38 to 51.1 Mb. Civq4 contributes 21% of the variance of infarct volume. The significance threshold for linkage was calculated using genotypes of markers on chromosome 8. B: genotype-phenotype correlation of the F2 cohort at rs13479735. The alleles are transgressive with the B6 allele conferring increased susceptibility to infarction and the C3H allele conferring protection. *P < 0.05, **P < 0.01 vs. B6/B6.
Civq5, mapping to chromosome 18, contributes 10% of the observed phenotypic variance in the cross. After fine mapping, the resulting 95% CI for Civq5 lies between 9.6 and 46.6 Mb (Fig. 6). Civq6, mapping to chromosome 5, contributes 8% of the observed variance of infarct volume (Fig. 7). The resulting 95% CI after genotyping with six additional markers in the vicinity of the linkage peak is from 67.0 to 119.8 Mb. After fine mapping, the observation of two peaks in Civq6 is persistent, strongly suggesting that Civq6 is in reality the result of at least two genes mapping on the same chromosome but spaced at least a considerable distance apart. Civq7, mapping to chromosome 10, contributes 6% of the infarct volume variance in the cross; the 95% CI for this locus is between 28.2 and 68.4 Mb after fine mapping (Fig. 8). At both Civq5 and Civq7 loci, the B6 allele exhibits a protective effect on infarct volume that is consistent with the phenotype of the parental B6 strain. Similar to Civq4, the C3H alleles at both peaks of Civq6 also represent protective alleles for infarction, with the B6 alleles as susceptibility alleles. None of the Civq loci yields epistatic interactions with other regions of the genome. The characteristics of all four loci are summarized in Table 2.
Fig. 6.

The Civq5 locus mapping to chromosome 18 harbors a B6 protective allele. A: the LOD score at the peak is 4.2, and the 95% CI (vertical lines) is from 9.6 to 46.6 Mb. Civq5 contributes 10% of the variance of infarct volume. The significance threshold for linkage was calculated using genotypes of markers on chromosome 18. B: genotype-phenotype correlation of the F2 cohort at the D8mit22. The B6 allele at Civq5 is protective for infarction. **P < 0.01 vs. B6/B6.
Fig. 7.

Civq6 mapping to chromosome 5 harbors transgressive alleles for these inbred strains. A: The LOD score for Civq6 is 3.7, and the 95% CI (vertical lines) is 67–119.8 Mb. Civq6 contributes 8% of the variance of infarct volume. The significance threshold for linkage was calculated using genotypes of markers on chromosome 5. B: genotype-phenotype correlation of the F2 cohort at the D5mit18. The alleles show a transgressive effect with the B6 allele of Civq6 conferring increased susceptibility to infarction and the C3H allele conferring protection. The C3H allele is dominant to the B6 allele. **P < 0.01 vs. B6/B6.
Fig. 8.

Civq7 mapping to chromosome 10 harbors a B6 protective allele. A: the LOD score of Civq7 is 3.5, and the 95% CI (vertical lines) is from 28.2 to 68.4 Mb. Civq7 contributes 6% of the variance of infarct volume. The significance threshold for linkage was calculated using genotypes of markers on chromosome 10. B: genotype-phenotype correlation of the F2 cohort at rs3683193. The B6 allele at Civq7 is protective for infarction. **P < 0.01 vs. B6/B6.
Table 2.
Characteristics of four novel QTLs for ischemic stroke identified in the F2 (B6 × C3H) progeny
| QTL | Location | LOD Score | Effect Size, %* | Protective Allele | Marker at Peak |
|---|---|---|---|---|---|
| Civq4 | Chr 8 | 9.8 | 21 | C3H | rs13479735 |
| Civq5 | Chr 18 | 4.2 | 10 | B6 | D18mit22 |
| Civq6 | Chr 5 | 3.7 | 8 | C3H | D5Mit18 |
| Civq7 | Chr 10 | 3.5 | 6 | B6 | rs3683193 |
QTL, quantitative trait locus; LOD, logarithm of the odds, Chr, chromosome;
The percentage of the total trait variance attributable to this locus.
Since traits associated with sexual dimorphism, such as body or brain size, might affect infarct volume, we performed QTL mapping in the same 210 animal cohort using brain weight, body weight, and ratio of brain weight/body weight as quantitative traits. However, none of the Civq loci identified as infarct volume loci were identified in this analysis after adjustment for sex effects (data not shown). Additionally, in this F2 cohort, the strain origin of the X and Y chromosomes as well as the mitochondrial genome exhibit no effect on infarct volume.
Collateral vessel-dependent and -independent loci identified in the cross.
To further investigate whether the new loci we have mapped modulate infarct volume in a collateral vessel-independent manner, we employed QTL analysis using collateral number, diameter, and conductance as quantitative traits in a second, independent F2 (B6 × C3H) cohort consisting of 105 animals. We reasoned that if the new loci that we mapped for infarct volume are determined by collateral phenotypes, then we should map these same loci for the collateral traits as well. The distribution of collateral number per hemisphere in the F2 cohort ranged from 6 to 14.5 with the vessel diameter ranging from 12.0 to 24.7 μm (Fig. 9, A and B). The calculated collateral conductance per hemisphere (41) ranged from 90.1 to 311.1 (Fig. 9C). This cohort was genotyped for 264 informative makers across the genome for QTL mapping.
Fig. 9.

The scatter plots represent the distribution of collateral vessel traits of B6, C3H and F2 progeny (F2B3H). A: collateral number. B: collateral diameter. C: collateral conductance.
We first noticed that only modest linkage “peaks” resulted in this analysis for any of the collateral vessel traits, with none of these potential loci reaching genome-wide statistical significance (Fig. 10). This outcome was not unexpected. Since collateral number does not differ between the B6 and C3H strains, we did not expect this cross to yield genetic loci for this trait. Although collateral diameter does differ between the two strains, the difference is much smaller than is seen between other strain pairs (43), again suggesting that robust loci for this trait might not be operating in this cross. Indeed, this pairwise cross would have been a rather poor choice to map collateral vessel traits, unless one wished to formally rule out any effects of collateral phenotypes on infarct volume, which was our stated objective. But the question still remains as to whether any of these rather modest linkage peaks for collateral traits are nonetheless related to any of the four new infarct volume loci.
Fig. 10.

QTL mapping for 105 F2 mice (B6 and C3H) for collateral vessel traits. A: the genome-wide linkage scan for collateral number. B: the genome-wide linkage scan for collateral diameter. C: the genome-wide linkage scan for collateral conductance (collateral number × diameter). The x-and y-axes represent chromosome and LOD score, respectively. The significant (P < 0.05) and suggestive (P < 0.63) levels were determined by data permutation tests.
Civq4, a very strong locus (21% effect size, LOD score of 9.8) for infarct volume mapping to chromosome 8, did not appear for any of the collateral vessel phenotypes. No portion of chromosome 8 even reached the modest “suggestive” alpha threshold of 0.63 (LOD score of 2.1). Thus, Civq4 modulates infarct volume in a collateral-independent manner. To date, this is the first infarct volume locus identified that clearly operates in a collateral-independent manner.
The mechanism underlying Civq5 mapping to chromosome 18, the next strongest of our novel infarct loci, is less clear. A rather modest peak at the same region on this chromosome is found for the traits of collateral number and conductance (mathematically derived from vessel number). Thus, this nascent collateral trait locus, although not reaching statistical significance, may suggest that the gene underlying Civq5 modulates infarct volume via effects on collateral vessel anatomy. The same region on chromosome 5 harboring the infarct locus Civq6 also shows a modest peak for the all three collateral vessel phenotypes. Although this nascent collateral vessel locus does not reach statistical significance, the possibility also remains that Civq6 exerts its effects on infarct volume via modulation of collateral vessel anatomy.
Finally, Civq7 mapping to chromosome 10, appears to operate in a collateral vessel-independent manner. No portion of chromosome 10 even reached the modest “suggestive” alpha threshold of 0.63 (LOD score of 2.1). Indeed the linkage profile of this chromosome for all collateral phenotypes is the lowest or among the lowest of all other chromosomes. Thus, Civq7, like Civq4, modulates infarct volume in a collateral-independent manner. Our rationale that the B6 × C3H intercross would not only preclude the overwhelming effects of the Civq1/Canq1 locus but also by this enable the mapping of novel, collateral independent loci, was validated.
Civq4 is a novel locus modulating infarct volume in a collateral-independent manner.
As stated above, Civq4 mapping to chromosome 8 harbors transgressive alleles for both B6 and C3H. These alleles modulate the infarct volume phenotype in the opposite direction to that observed in the parental strains. Previous QTL mapping studies of infarct volume and collateral phenotypes using the B6 × BALB/c inbred strains identified what appears to be nonoverlapping loci on chromosome 8 (24, 41). These two loci, Civq3 for infarct volume and Canq4 for collateral artery number, also harbor transgressive alleles, in these cases for the B6 and BALB/c alleles. The current evidence suggests that Civq4 mapped in this study is distinct from either of these two loci. First, and most importantly, the Canq4 was identified as collateral number-determining locus, whereas Civq4 does not share this phenotypic effect. Secondly, the peaks of the Civq3 and Civq4 loci are 26 Mb apart. However, since both Civq3 and Canq4 were identified in the presence of the overwhelming phenotypic effects of Civq1/Canq1, their contribution to their respective phenotypes was quite low, leading to comparatively low effect sizes and broad linkage peaks that cover large portions of chromosome 8. The linkage profile for Civq4 by contrast, intentionally mapped in the absence of effects from Civq1/Canq1, is much more amenable to eventual gene identification (13) because of the effect size of Civq4 is >20%, and the 95% CI covers a comparatively smaller region of the chromosome.
Candidate genes for Civq4.
Toward the goal of gene identification for the most robust of our mapped loci, Civq4, we investigated candidate genes mapping within the 95% CI region of Civq4 (38–51.1 Mb, chromosome 8). Of a total of 70 genes falling within the nearly 13 Mb genomic interval 15 genes harbor NS cSNPs, with some genes harboring multiple cSNPs (Table 3). We employed the PolyPhen-2 algorithm (http://genetics.bwh.harvard.edu/pph2/) to determine the potential functional impact these NS cSNPs would have on the encoded proteins. Five genes contain NS cSNPs that were predicted to be either “possibly or probably damaging” their respective proteins: Mtus1 (Mitochondrial tumor suppressor), Dlc1 (Deleted in liver cancer 1), AI429214 (Expressed sequence AI429214), Msr1 (Macrophage scavenger receptor 1), and Adam39. According to the BioGPS (http://biogps.org/) and EMBL-EBI (http://www.ebi.ac.uk) databases, Mtus1 is mainly expressed in lung, cerebellum, liver, skeletal muscle, and placenta; Dlc1 is expressed in lung, adipose brown fat, adrenal gland; Msr1 is predominantly expressed in macrophages and microglia (22, 23); and AI429214 and Adam39 are almost exclusively expressed in testis.
Table 3.
Candidate genes within the 95% CI of Civq4 harboring nonsynonymous coding SNPs between the two strains
| Gene | Description | SNP (amino acid substitution, prediction score) |
|---|---|---|
| Dlc1 | Deleted in liver cancer 1 | rs30479169 (G303S, 0.003), rs30479172 (R292G, 0), rs49225660 (G192E, 0.001), rs13479705 (N188S, 0.001), rs30480037 (L61P, 0.998)† |
| AI429214 | Expressed sequence AI429214 | rs30495837 (L148S, 0), rs30495843 (W182C, 0.004), rs30496799 (D241E, 0.623)*, rs33224061 (L279Q, 0) |
| Sgcz | Sarcoglycan zeta | rs30569935 (S268P, 0.003) |
| Msr1 | Macrophage scavenger receptor 1 | rs30713937 (N202H, 0.951)†, rs4227124 (S168L, 0.112), rs4227121 (E143G, 0.021), rs4227120 (E130Q, 0.002), rs4227119 (E120A, 0.796)*, rs4227118 (K110N, 0.619)*, rs4227116 (L93R, 0.912)†, |
| rs33475961 (L47V, 0.02), rs30721104 (Q16R, 0.171) | ||
| Fgf20 | Fibroblast growth factor 20 | rs33026537 (S18G, 0) |
| Zdhhc2 | Zinc finger, DHHC domain containing 2 | rs39259851 (S345I, 0.324), rs37279872 (P348A, 0.007) |
| Adam24 | A disintegrin and metallopeptidase domain 24 | rs32913711 (I162L, 0.15), rs33077682 (A182E, 0.425), rs13479720 (R454H, 0.256), rs33441119 (A603T, 0.474)*, rs32957045 (A622D, 0), rs46272175 (E735G, 0.737)*, rs33489704 (R737T, 0.053) |
| Adam25 | A disintegrin and metallopeptidase domain 25 | rs33291762 (Q174H, 0), rs32901897 (R374T, 0.027) |
| 4930529f22rik | RIKEN cDNA 4930529F22 gene | rs33194992 (I357M, 0.006), rs32899240 (E480Q, 0.003), |
| Adam39 | A disintegrin and metallopeptidase domain 39 | rs32956778 (Y184H, 0.004), rs33346689 (Y184F, 0), rs33224622 (H235R, 0), rs32970807 (R449P, 0), rs33217945 (K466E, 0), rs32711454 (R480K, 0), rs47587546 (E629K, 0.014), |
| rs52514673 (L730V, 0.659)* | ||
| Slc7a2 | Solute carrier family 7 (cationic amino acid transporter, y+ system), member 2, isoform 1 | rs51702388 (S335G, 0), rs50403696 (S342A, 0), rs50658496 (D441E, 0), rs33400568 (V538A, 0), rs51206634 (D623E, 0), rs51699995 (A627V, 0.001), rs50815674 (A634V, 0.009) |
| Pdgfrl | Platelet-derived growth factor receptor-like | rs48169412 (G20A, 0) |
| Mtus1 | Mitochondrial tumor suppressor 1 | rs46398643 (T919A, 0.025), rs3655962 (T600A, 0.146), rs3657084 (S556G, 0.005), rs3657166 (H541Q, 0001), rs3657719 (S525N, 0.001), rs3657750 (I519V, 0.001), rs48274647 (R455S, 0), rs51797563 (E426K, 0.001), rs49611729 (P401S, 0.001), rs51944137 (I283V, 0.807)* rs48828775 (G263R, 1)†, rs51455351 (Y213C, 0), rs47442701 (C202S, 0.001), |
| rs47279651 (D176A, 0), rs51794027 (Y169C, 0), rs51126891 (C147S, 0.949)*, rs48575407 (R140G, 0.122), rs46969728 (F131S, 0.187), rs47548380 (S86T, 0.949)*, rs32726714 (L33P, 0.001) | ||
| Fgl1 | Fibrinogen-like protein 1 | rs33386428 (K80R, 0), rs13461783 (N27S, 0.09) |
| Pcm1 | Pericentriolar material 1 | rs3165615 (I1819V, 0) |
CI, confidence interval; SNP, single nucleotide polymorphism. Amino acid changes predicted by PolyPhen-2 to be “possibly damaging” (*) and “probably damaging” (†). PolyPhen-2, http://genetics.bwh.harvard.edu/pph2/; dbSNP, http://www.ncbi.nlm.nih.gov/SNP/.
One gene, Mtmr7 (Myotubularin related protein 7), was particularly interesting as a SNP is reported to cause a premature truncation codon (Mouse Genomes Project, http://www.sanger.ac.uk/cgi-bin/modelorgs/mousegenomes/snps.pl) and Ensembl Genome Browser (NCBIM37, http://useast.ensembl.org/Mus_musculus/Info/Index). Mtmr7 is expressed primarily in brain tissues (31) with two major Mtmr7 transcripts in the mouse, ENSMUST00000048898 and ENSMUST00000174205, which encode proteins of 660 and 498 amino acid residues, respectively. The C3H allele at SNP rs33076137 is listed to cause a stop codon in ENSMUST00000048898 that would result in a truncated transcript distinct from that of ENSMUST00000174205. By Sanger sequencing genomic DNA and cDNA generated from both B6 and C3H cortex, we validated the presence of this SNP in genomic DNA but found that it was not located in any known splice isoform of the Mtmr7 transcript (data not shown). Deeper inspection of the databases indicates that this SNP is indeed located within an intron of ENSMUST00000048898, although it is unclear then how this SNP became annotated as a stop-gain variant.
In addition to protein coding differences, sequence variation can cause differences in gene regulation, defined broadly as any variant that alters mRNA levels, regardless of the mechanism. Thus, we employed mRNA microarray analysis on cerebral cortex tissue from p1 and 11 wk old mice to identify differences in transcript levels between the inbred strains B6 and C3H. A twofold or greater expression difference between B6 and C3H was used as a cut-off point to filter candidate genes from the microarray results. Genes expressed at least twofold greater in B6 than in C3H are categorized as B6>C3H, whereas genes expressed twofold or greater in C3H are categorized as C3H>B6. In the B6>C3H category at age p1, there were 194 genes expressed at least twofold higher in B6 than in C3H. Among these 194 genes, eight are located within the 95% CIs of Civq4 to Civq7 (Table 4). At age 11 wk 169 genes are expressed at least twofold higher in B6 compared with C3H, with only seven located within the 95% CIs of the four new Civq loci (Table 4). The Mtmr7 gene located in the 95% CI of Civq4, shows 8- to 12-fold higher expression in B6 than in C3H at both ages, respectively. The expression difference of MTMR7 was further validated by both qRT-PCR and SNaPshot. The qRT-PCR and SNaPshot data both show that that although splice variant ENSMUST00000048898 is equally expressed between B6 and C3H (data not shown), isoform ENSMUST00000174205 is expressed more highly in B6 cerebral cortex (Fig. 11).
Table 4.
The genes having twofold or greater difference in expression between B6 and C3H
| p1 Cortex | 11 wk Cortex | |
|---|---|---|
| B6/C3H expression ratio ≥2 | ||
| Civq4 (Chr 8) | Mtmr7 (8.4, 5.34 × 10⁻⁸) | Mtmr7 (12.5, 1.35 × 10⁻⁸) |
| Civq5 (Chr 18) | Zfp191 (2.4, 1.09 × 10⁻⁵) | Arhgap26 (2.8, 1.38 × 10⁻⁶) |
| Ankrd29 (2.1, 2.54 × 10⁻⁴) | Zfp191 (2.3, 1.35 × 10⁻⁵) | |
| Civq6 (Chr 5) | Gm10047 (4.6, 5.54 × 10⁻⁶) | Spp1 (3.1, 1.05 × 10⁻⁶) |
| 9430027B09Rik (3.7, 1.28 × 10⁻⁶) | 9430027B09Rik (2.6, 1.26 × 10⁻⁵) | |
| Ep400 (3.3, 1.27 × 10⁻⁵) | Dmp1 (2.1, 7.68 × 10⁻⁴) | |
| Civq7 (Chr 10) | 6330407J23Rik (5.6, 2.06 × 10⁻⁹) | 6330407J23Rik (3.7, 1.93 × 10⁻⁸) |
| 9330159F19Rik (2.3, 5.90 × 10⁻⁵) | ||
| C3H/B6 expression ratio ≥2 | ||
| Civq4 | Cnot7 (2.0, 5.63 × 10⁻⁷) | Cnot7 (2.7, 4.16 × 10⁻⁸) |
| Vps37a (2.1, 5.43 × 10⁻⁵) | ||
| Civq5 | Zfp191 (2.9, 1.09 × 10⁻⁵) | Hbegf (3.5, 7.14 × 10⁻⁸) |
| Hbegf (2.5, 7.94 × 10⁻⁷) | Zfp191 (2.4, 5.07 × 10⁻⁵) | |
| Civq6 | 1500011B03Rik (3.2, 2.23 × 10⁻⁶) | Gabra2 (3.4, 1.31 × 10⁻⁸) |
| Gabra2 (2.2, 2.25 × 10⁻⁵) | 1500011B03Rik (2.7, 8.16 × 10⁻⁶) | |
| 2610524H06Rik (2.2, 8.41 × 10⁻⁸) | Ociad1 (2.3, 1.61 × 10⁻⁴) | |
| Civq7 | Amd1 (2.5, 5.91 × 10⁻⁹) | Amd1 (2.0, 3.87 × 10⁻⁸) |
The relative expression fold difference between B6 and C3H and P values are indicated in the parenthesis. p1, Postnatal day 1.
Fig. 11.
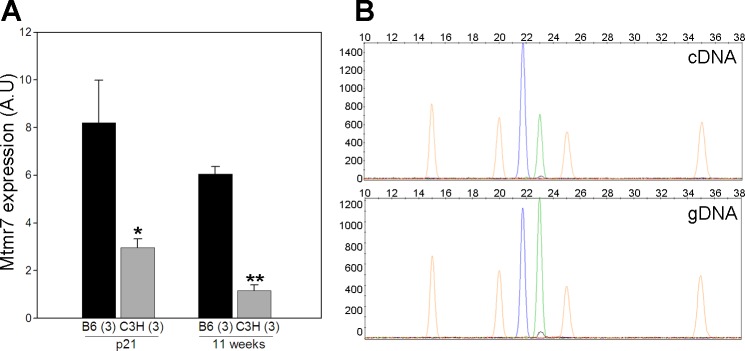
Mtmr7 exhibits different transcript levels in cerebral cortex between strains B6 and C3H at both age p21 and 11 wk. A: the expression difference was detected using a qRT-PCR expression assay. B: allele-specific gene expression (SNaPshot) detects different transcript levels in cDNA but not in gDNA (genomic) from p21 cerebral cortex of F1 (B6/C3H) mice. The blue peak represents the B6 allele, and the green peak represents the C3H allele. The orange peaks are molecular weight markers. The data from tissue isolated at 11 wk is similar. *P < 0.05, **P < 0.01 vs. B6.
In the C3H>B6 category at age p1, there are 76 genes showing a strain-specific expression difference, whereas at 11 wk there are 82 genes differentially expressed. Seven genes map within the 95% CIs of Civq4 to Civq7 for p1 cortex and eight genes for the adult tissue (Table 4). However, none of these transcript level differences are as great as those found in the B6>C3H category. The microarray data was submitted to Gene Expression Omnibus at NCBI (accession number GSE46443).
DISCUSSION
To circumvent the challenges to identify genetic risk factors for ischemic stroke outcomes, we have employed QTL mapping in an ischemic stroke mouse model. The MCAO induces total occlusion of distal MCA in the mouse that mimics the permanent MCA ischemic stroke in human. Using this model, we discovered that infarct volume varies widely among inbred mouse strains (24). In this controlled, experimental setting, the heritability of stroke volume is 88% (24), showing that genetic factors play the major determinative role in the size of the infarct.
Exploiting this genetically tractable system, we have identified three loci that modulate infarct volume in crosses among inbred strains (24). One locus in particular, Civq1, contributes >50% of the phenotypic variance in F2 crosses generated between combinations of large and small infarct strains (24). Recent genetic studies on collateral vessel traits have similarly identified a very strong locus in the same region of Civq1, termed Canq1, that is a major determinant of the collateral number (41), and it appears that at least one or more genes in this region of mouse chromosome 7 modulates infarct volume via its modulation of collateral vessel anatomy (24, 41). However, the larger infarct volume observed in C3H is not explained by a number of vascular traits including the area supplied by MCA, the collateral number, length, diameter, tortuosity, or even the hematocrit level between strains (43). The remodeling of collateral vessels after ischemia is also cannot be a major determinant since only minimal remodeling would occur within the first 24 h post ischemia (41).
An effect of the collateral circulation on infarct volume is observed clinically. Ischemic stroke patients with a higher extent of collateral circulation exhibit slower infarction growth rates, better response to thrombolytic therapy, and lower mortality (4, 27, 30). However, from a therapeutic perspective, attempts to alter the collateral circulation do not represent straightforward strategies for stroke therapy. In mice, the innate collateral vessel circulatory system (collaterogenesis) is determined during the embryonic stages and is fully developed by the third week of life (9). Another therapeutic approach would be to attempt to augment the blood flow through the collateral circulation (2, 39, 42). However, the effects of such intervention have not yet been validated. Since modification of the embryonic collateralization and/or augmentation of collateral blood flow appear to be suboptimal therapeutic strategies, it is crucial to identify alternative therapeutic targets for stroke therapy, especially those that are collateral vessel independent.
Because of the overwhelming effects of Civq1/Canq1 locus on infarct volume and collateral circulation, the judicious use of B6 and C3H, strains exhibiting similar collateral number but differing significantly in infarct volume, has enabled us to break the strong link between infarct volume and collateral vessel anatomy and provided means to identify collateral vessel-independent modulators of infarction. In an F2 intercross between B6 and C3H, we identified four new loci modulating infarct volume. Importantly, this cross did not exhibit the Civq1/Canq1 locus (chromosome 7) determining both collateral number and the resulting infarct volume. By eliminating the otherwise robust phenotypic effect of this locus, we were able to uncover hidden QTLs previously masked by its overwhelming phenotypic effects.
Mapping collateral phenotypes in a cross between the same two inbred strains enabled us to determine which of these new infarct loci were collateral independent. We did not reidentify Civq4 on chromosome 8 or Civq7 on chromosome 10, suggesting that these loci modulate infarct volume in a collateral vessel-independent manner. Previously, we identified a region on chromosome 1 determining infarct volume in an F2 B6 and BALB/c cross (24). Subsequently, a locus determining collateral number and diameter was also independently mapped in the same general region (41). Interestingly, our collateral vessel trait mapping in this F2 B6 and C3H cross also reveals a suggestive locus on chromosome 1. However, given the poor resolution of both respective loci, it is impossible to state with confidence whether our suggestive locus for collateral vessel traits overlaps with the locus mapped previously. We also identified two additional infarct volume loci, Civq5 (chromosome 18) and Civq6 (chromosome 5). Based on modest but potential linkage peaks in the collateral traits mapping, these additional infarct loci appear to operate through a collateral vessel-dependent mechanism.
The mechanism underlying the collateral-independent Civq4 and Civq7 infarct volume loci remain to be determined. In ischemic stroke, a cerebral infarction occurs as a result of disturbance of the neurovascular unit composed of neurons, astrocytes, vascular structures, and their interactions (28). According to this paradigm, ischemic stroke should not be considered solely as a neurological or vascular disease, but multifactoral at the cellular level. After occlusion of the culprit artery, the ischemic area undergoes a drastic change in energy metabolism and cell morphology (terminal anoxic depolarization) (21). The dominant pathophysiology is thought to be primarily mediated by anoxic-ischemic cell damage in the infarct core, followed by expansion into the penumbra (21). During ischemic insult, neuronal cells exhibit variable biochemical responses and undergo both apoptosis and necrosis pathways. In this model, the relative balance between cell death and opposing cell survival pathways determines cell fate (40). This relative balance may vary between individuals (40). We propose that the cellular responses to ischemia might vary for the alleles at the two collateral independent infarct loci. As these loci represent naturally occurring alleles that nonetheless have robust effects on infarction, the identity of the underlying genes are of great interest.
We were somewhat surprised to find that the strongest of the new loci, Civq4, harbors transgressive alleles. By eliminating the robust, almost overwhelming effects of Civq1/Canq1 locus on the infarct volume and collateral vessel phenotypes, we uncovered an infarct susceptibility allele previously hidden in our other crosses involving B6 (24). Transgressive segregation is not uncommon (18, 32, 34, 36) and is most frequently observed in intraspecific crosses involving inbred populations (34). In a QTL mapping study for hyperoxic acute lung injury, a transgressive allele was similarly uncovered as the second strongest locus for the trait (33). This class of genetic variation might be also viewed as cryptic genetic variation (CGV). CGV is defined as a genetic variation that does not contribute to the “reference range” of a phenotype observed in a population but is able to modify phenotypes that arise after environmental change or the introduction of novel alleles (14). CGV does not necessarily exhibit additive gene effects (15), but because of its unusual characteristics, has been postulated to contribute to disease (14).
The presence of strain-specific nonsynonymous coding variants predicted to be damaging elevates Msr1 as a candidate gene for Civq4. Significantly, Msr1 is exclusively expressed in neonatal microglia (22), and increased microglial expression of MSR1 is associated with neuropathology in Alzheimer's disease (22, 23). Due to the combined criteria of a predicted damaging amino acid substitution, a neural tissue expression pattern, and a role in neuropathology, Msr1 becomes compelling candidate gene for Civq4. This hypothesis needs to be tested first by functional studies of the coding variants of the protein and, ultimately, in vivo validation by cross-substitution of these variants in mice.
Likewise, due to strain-specific expression differences, Mtmr7 also appears to be a strong candidate gene for Civq4. Human MTMR7 belongs to the myotubularin (MTM) gene family that includes MTM1 and MTMR1 to MTMR13 (17). Mtmr7 is primarily expressed in the brain and is located in endosomes where it dephosphorylates phosphatidylinositol 3-phosphate [PtdIns(3)P] and inositol 1,3-bisphosphate [Ins(1,3)P2] (31). Sequence variation in several of the human MTM genes either causes or is associated with neuromuscular diseases, such as X-linked centronuclear myopathy (MTM1) (10), Charcot-Marie-Tooth neuropathy (MTMR2 and MTMR13/SBF2) (3, 7, 38), epilepsy (MTMR7 and MTMR9) (5), and Creutzfeldt-Jakob disease (MTMR7) (37). These combined data further support a possible role for Mtmr7 in ischemia-associated brain injury in a collateral vessel-independent manner.
Mtmr7 exhibits multiple transcript isoforms. Although B6 and C3H express equal amounts of the longer transcript isoform (ENSMUST00000048898), a shorter transcript (ENSMUST00000174205) is more highly expressed in B6. This shorter isoform lacks the coding potential for a coiled-coil domain of Mtmr7 that is thought to participate in Mtmr7-Mtmr9 complex formation (31). This Mtmr7-Mtmr9 complex formation is important for dephosphorylation of PtdIns(3)P and Ins(1,3)P2 in neuronal cells, and Mtmr7-Mtmr9 complex has higher enzymatic (phosphatase) activity than Mtmr7 itself alone (31). Deletion or point mutation of the orthologous coiled-coil domain of either MTMR2 or MTMR5 also abolishes the interaction between MTMR2 and MTMR5, which is vital for MTMR2 enzymatic (phosphatase) activity and subcellular localization (25). Therefore, we hypothesize that the strain-specific expression difference of the shorter Mtmr7 transcript isoform might play a role in the neuropathology of ischemia-associated infarction. This hypothesis needs to be tested in vivo in genetically engineered mouse strains.
In conclusion, by selecting mouse strain pairs that share similar collateral vessel anatomy but display robust differences in MCAO-induced infarct volume, we have discovered novel loci that determine ischemic infarct volume, two of which act in a collateral vessel phenotype-independent manner. The strongest locus, Civq4, contributes 21% of the phenotypic variance in infarct volume. In addition, as the gene(s) underlying this locus are natural variants completely compatible with normal development and physiology, this gene or genes might provide an attractive novel target for stroke therapy. Although there are several candidate genes for Civq4, Msr1 and Mtmr7 are particularly attractive based on its anatomic expression in the brain, their strain-specific sequence variation or expression differences, and their roles in other neurological diseases (5, 37). This line of investigation may hold promise to uncover novel genes and pathways causing neuronal damage in ischemic stroke and to identify potentially modifiable genetic factors that can be translated into the clinic.
GRANTS
This work was supported by National Heart, Lung, and Blood Institute Grant 1R01 HL-097281 to D. A. Marchuk and American Heart Association Predoctoral Fellowship 0815132E to S. Keum.
DISCLOSURES
No conflicts of interest, financial or otherwise, are declared by the author(s).
AUTHOR CONTRIBUTIONS
Author contributions: P.-L.C., S.K., and D.A.M. conception and design of research; P.-L.C. and S.K. performed experiments; P.-L.C. analyzed data; P.-L.C., S.K., and D.A.M. interpreted results of experiments; P.-L.C. prepared figures; P.-L.C. drafted manuscript; P.-L.C., S.K., and D.A.M. edited and revised manuscript; P.-L.C., S.K., and D.A.M. approved final version of manuscript.
ACKNOWLEDGMENTS
We thank Christopher Clayton for animal husbandry and handling. We also thank Dr. Jen-Tsan Ashley Chi and Ming-Shan Chien for assistance with the microarray data analysis and the Duke Microarray Core Facility (a Duke National Cancer Institute and a Duke Institute for Genome Sciences and Policy shared resource facility) for technical support, microarray data management, and feedback on the generation of the microarray data reported in this manuscript.
REFERENCES
- 1.Adzhubei IA, Schmidt S, Peshkin L, Ramensky VE, Gerasimova A, Bork P, Kondrashov AS, Sunyaev SR. A method and server for predicting damaging missense mutations. Nat Meth 7: 248–249, 2010 [DOI] [PMC free article] [PubMed] [Google Scholar]
- 2.Aichner FT, Fazekas F, Brainin M, Polz W, Mamoli B, Zeiler K. Hypervolemic hemodilution in acute ischemic stroke: the Multicenter Austrian Hemodilution Stroke Trial (MAHST). Stroke 29: 743–749, 1998 [DOI] [PubMed] [Google Scholar]
- 3.Azzedine H, Bolino A, Taieb T, Birouk N, Di Duca M, Bouhouche A, Benamou S, Mrabet A, Hammadouche T, Chkili T, Gouider R, Ravazzolo R, Brice A, Laporte J, LeGuern E. Mutations in MTMR13, a new pseudophosphatase homologue of MTMR2 and Sbf1, in two families with an autosomal recessive demyelinating form of Charcot-Marie-Tooth disease associated with early-onset glaucoma. Am J Hum Genet 72: 1141–1153, 2003 [DOI] [PMC free article] [PubMed] [Google Scholar]
- 4.Bang OY, Saver JL, Buck BH, Alger JR, Starkman S, Ovbiagele B, Kim D, Jahan R, Duckwiler GR, Yoon SR, Viñuela F, Liebeskind DS, UCLA Collateral Investigators Impact of collateral flow on tissue fate in acute ischaemic stroke. J Neurol Neurosurg Psychiatry 79: 625–629, 2008 [DOI] [PMC free article] [PubMed] [Google Scholar]
- 5.Baulac S, Gourfinkel-An I, Couarch P, Depienne C, Kaminska A, Dulac O, Baulac M, LeGuern E, Nabbout R. A novel locus for generalized epilepsy with febrile seizures plus in French families. Arch Neurol 65: 943–951, 2008 [DOI] [PubMed] [Google Scholar]
- 6.Bellenguez C, Bevan S, Gschwendtner A, Spencer CC, Burgess AI, Pirinen M, Jackson CA, Traylor M, Strange A, Su Z, Band G, Syme PD, Malik R, Pera J, Norrving B, Lemmens R, Freeman C, Schanz R, James T, Poole D, Murphy L, Segal H, Cortellini L, Cheng YC, Woo D, Nalls MA, Muller-Myhsok B, Meisinger C, Seedorf U, Ross-Adams H, Boonen S, Wloch-Kopec D, Valant V, Slark J, Furie K, Delavaran H, Langford C, Deloukas P, Edkins S, Hunt S, Gray E, Dronov S, Peltonen L, Gretarsdottir S, Thorleifsson G, Thorsteinsdottir U, Stefansson K, Boncoraglio GB, Parati EA, Attia J, Holliday E, Levi C, Franzosi MG, Goel A, Helgadottir A, Blackwell JM, Bramon E, Brown MA, Casas JP, Corvin A, Duncanson A, Jankowski J, Mathew CG, Palmer CN, Plomin R, Rautanen A, Sawcer SJ, Trembath RC, Viswanathan AC, Wood NW, Worrall BB, Kittner SJ, Mitchell BD, Kissela B, Meschia JF, Thijs V, Lindgren A, Macleod MJ, Slowik A, Walters M, Rosand J, Sharma P, Farrall M, Sudlow CL, Rothwell PM, Dichgans M, Donnelly P, Markus HS. Genome-wide association study identifies a variant in HDAC9 associated with large vessel ischemic stroke. Nat Genet 44: 328–333, 2012 [DOI] [PMC free article] [PubMed] [Google Scholar]
- 7.Bolino A, Muglia M, Conforti FL, LeGuern E, Salih MA, Georgiou DM, Christodoulou K, Hausmanowa-Petrusewicz I, Mandich P, Schenone A, Gambardella A, Bono F, Quattrone A, Devoto M, Monaco AP. Charcot-Marie-Tooth type 4B is caused by mutations in the gene encoding myotubularin-related protein-2. Nat Genet 25: 17–19, 2000 [DOI] [PubMed] [Google Scholar]
- 8.Chalothorn D, Clayton JA, Zhang H, Pomp D, Faber JE. Collateral density, remodeling, and VEGF-A expression differ widely between mouse strains. Physiol Genomics 30: 179–191, 2007 [DOI] [PubMed] [Google Scholar]
- 9.Chalothorn D, Faber JE. Formation and maturation of the native cerebral collateral circulation. J Mol Cell Cardiol 49: 251–259, 2010 [DOI] [PMC free article] [PubMed] [Google Scholar]
- 10.Dang H, Li Z, Skolnik EY, Fares H. Disease-related myotubularins function in endocytic traffic in Caenorhabditis elegans. Mol Biol Cell 15: 189–196, 2004 [DOI] [PMC free article] [PubMed] [Google Scholar]
- 11.Dirnagl U, Simon RP, Hallenbeck JM. Ischemic tolerance and endogenous neuroprotection. Trends Neurosci 26: 248–254, 2003 [DOI] [PubMed] [Google Scholar]
- 12.Faber JE, Zhang H, Lassance-Soares RM, Prabhakar P, Najafi AH, Burnett MS, Epstein SE. Aging causes collateral rarefaction and increased severity of ischemic injury in multiple tissues. Arterioscler Thromb Vasc Biol 31: 1748–1756, 2011 [DOI] [PMC free article] [PubMed] [Google Scholar]
- 13.Flint J. Mapping quantitative traits and strategies to find quantitative trait genes. Methods 53: 163–174, 2011 [DOI] [PMC free article] [PubMed] [Google Scholar]
- 14.Gibson G, Dworkin I. Uncovering cryptic genetic variation. Nat Rev Genet 5: 681–690, 2004 [DOI] [PubMed] [Google Scholar]
- 15.Gibson G, Reed LK. Cryptic genetic variation. Curr Biol 18: R989–R990, 2008 [DOI] [PMC free article] [PubMed] [Google Scholar]
- 16.Goldlust EJ, Paczynski RP, He YY, Hsu CY, Goldberg MP. Automated measurement of infarct size with scanned images of triphenyltetrazolium chloride-stained rat brains. Stroke 27: 1657–1662, 1996 [DOI] [PubMed] [Google Scholar]
- 17.Hnia K, Vaccari I, Bolino A, Laporte J. Myotubularin phosphoinositide phosphatases: cellular functions and disease pathophysiology. Trends Mol Med 18: 317–327, 2012 [DOI] [PubMed] [Google Scholar]
- 18.Hogarth MB, Slingsby JH, Allen PJ, Thompson EM, Chandler P, Davies KA, Simpson E, Morley BJ, Walport MJ. Multiple lupus susceptibility loci map to chromosome 1 in BXSB mice. J Immunol 161: 2753–2761, 1998 [PubMed] [Google Scholar]
- 19.Hossmann KA. Genetically modified animals in molecular stroke research. Acta Neurochir Suppl (Wien) 89: 37–45, 2004 [DOI] [PubMed] [Google Scholar]
- 20.Hossmann KA. Pathophysiology and therapy of experimental stroke. Cell Mol Neurobiol 26: 1057–1083, 2006 [DOI] [PMC free article] [PubMed] [Google Scholar]
- 21.Hossmann KA. The two pathophysiologies of focal brain ischemia: implications for translational stroke research. J Cereb Blood Flow Metab 32: 1310–1316, 2012 [DOI] [PMC free article] [PubMed] [Google Scholar]
- 22.Husemann J, Loike JD, Anankov R, Febbraio M, Silverstein SC. Scavenger receptors in neurobiology and neuropathology: their role on microglia and other cells of the nervous system. Glia 40: 195–205, 2002 [DOI] [PubMed] [Google Scholar]
- 23.Husemann J, Silverstein SC. Expression of scavenger receptor class B, type I, by astrocytes and vascular smooth muscle cells in normal adult mouse and human brain and in Alzheimer's disease brain. Am J Pathol 158: 825–832, 2001 [DOI] [PMC free article] [PubMed] [Google Scholar]
- 24.Keum S, Marchuk DA. A locus mapping to mouse chromosome 7 determines infarct volume in a mouse model of ischemic stroke. Circ Cardiovasc Genet 2: 591–598, 2009 [DOI] [PMC free article] [PubMed] [Google Scholar]
- 25.Kim SA, Vacratsis PO, Firestein R, Cleary ML, Dixon JE. Regulation of myotubularin-related (MTMR)2 phosphatidylinositol phosphatase by MTMR5, a catalytically inactive phosphatase. Proc Natl Acad Sci USA 100: 4492–4497, 2003 [DOI] [PMC free article] [PubMed] [Google Scholar]
- 26.Lander E, Kruglyak L. Genetic dissection of complex traits: guidelines for interpreting and reporting linkage results. Nat Genet 11: 241–247, 1995 [DOI] [PubMed] [Google Scholar]
- 27.Lima FO, Furie KL, Silva GS, Lev MH, Camargo EC, Singhal AB, Harris GJ, Halpern EF, Koroshetz WJ, Smith WS, Yoo AJ, Nogueira RG. The pattern of leptomeningeal collaterals on CT angiography is a strong predictor of long-term functional outcome in stroke patients with large vessel intracranial occlusion. Stroke 41: 2316–2322, 2010 [DOI] [PMC free article] [PubMed] [Google Scholar]
- 28.Lo EH, Dalkara T, Moskowitz MA. Mechanisms, challenges and opportunities in stroke. Nat Rev Neurosci 4: 399–415, 2003 [DOI] [PubMed] [Google Scholar]
- 29.Matarin M, Brown WM, Scholz S, Simon-Sanchez J, Fung HC, Hernandez D, Gibbs JR, De Vrieze FW, Crews C, Britton A, Langefeld CD, Brott TG, Brown RD, Jr, Worrall BB, Frankel M, Silliman S, Case LD, Singleton A, Hardy JA, Rich SS, Meschia JF. A genome-wide genotyping study in patients with ischaemic stroke: initial analysis and data release. Lancet Neurol 6: 414–420, 2007 [DOI] [PMC free article] [PubMed] [Google Scholar]
- 30.Miteff F, Levi CR, Bateman GA, Spratt N, McElduff P, Parsons MW. The independent predictive utility of computed tomography angiographic collateral status in acute ischaemic stroke. Brain 132: 2231–2238, 2009 [DOI] [PubMed] [Google Scholar]
- 31.Mochizuki Y, Majerus PW. Characterization of myotubularin-related protein 7 and its binding partner, myotubularin-related protein 9. Proc Natl Acad Sci USA 100: 9768–9773, 2003 [DOI] [PMC free article] [PubMed] [Google Scholar]
- 32.Palijan A, Dutil J, Deng AY. Quantitative trait loci with opposing blood pressure effects demonstrating epistasis on Dahl rat chromosome 3. Physiol Genomics 15: 1–8, 2003 [DOI] [PubMed] [Google Scholar]
- 33.Prows DR, Hafertepen AP, Gibbons WJ, Jr, Winterberg AV, Nick TG. A genetic mouse model to investigate hyperoxic acute lung injury survival. Physiol Genomics 30: 262–270, 2007 [DOI] [PubMed] [Google Scholar]
- 34.Rieseberg LH, Archer MA, Wayne RK. Transgressive segregation, adaptation and speciation. Heredity 83: 363–372, 1999 [DOI] [PubMed] [Google Scholar]
- 35.Roger VL, Go AS, Lloyd-Jones DM, Adams RJ, Berry JD, Brown TM, Carnethon MR, Dai S, de Simone G, Ford ES, Fox CS, Fullerton HJ, Gillespie C, Greenlund KJ, Hailpern SM, Heit JA, Ho PM, Howard VJ, Kissela BM, Kittner SJ, Lackland DT, Lichtman JH, Lisabeth LD, Makuc DM, Marcus GM, Marelli A, Matchar DB, McDermott MM, Meigs JB, Moy CS, Mozaffarian D, Mussolino ME, Nichol G, Paynter NP, Rosamond WD, Sorlie PD, Stafford RS, Turan TN, Turner MB, Wong ND, Wylie-Rosett J, American Heart Association Statistics Committee, Stroke Statistics Subcommittee Heart disease and stroke statistics–2011 update: a report from the American Heart Association. Circulation 123: e18–e209, 2011 [DOI] [PMC free article] [PubMed] [Google Scholar]
- 36.Roper RJ, McAllister RD, Biggins JE, Michael SD, Min SH, Tung KS, Call SB, Gao J, Teuscher C. Aod1 controlling day 3 thymectomy-induced autoimmune ovarian dysgenesis in mice encompasses two linked quantitative trait loci with opposing allelic effects on disease susceptibility. J Immunol 170: 5886–5891, 2003 [DOI] [PubMed] [Google Scholar]
- 37.Sanchez-Juan P, Bishop MT, Aulchenko YS, Brandel JP, Rivadeneira F, Struchalin M, Lambert JC, Amouyel P, Combarros O, Sainz J, Carracedo A, Uitterlinden AG, Hofman A, Zerr I, Kretzschmar HA, Laplanche JL, Knight RS, Will RG, van Duijn CM. Genome-wide study links MTMR7 gene to variant Creutzfeldt-Jakob risk. Neurobiol Aging 33: 1487 e1421–1488, 2012 [DOI] [PubMed] [Google Scholar]
- 38.Senderek J, Bergmann C, Weber S, Ketelsen UP, Schorle H, Rudnik-Schoneborn S, Buttner R, Buchheim E, Zerres K. Mutation of the SBF2 gene, encoding a novel member of the myotubularin family, in Charcot-Marie-Tooth neuropathy type 4B2/11p15. Hum Mol Genet 12: 349–356, 2003 [DOI] [PubMed] [Google Scholar]
- 39.Shuaib A, Butcher K, Mohammad AA, Saqqur M, Liebeskind DS. Collateral blood vessels in acute ischaemic stroke: a potential therapeutic target. Lancet Neurol 10: 909–921, 2011 [DOI] [PubMed] [Google Scholar]
- 40.Unal-Cevik I, Kilinc M, Can A, Gursoy-Ozdemir Y, Dalkara T. Apoptotic and necrotic death mechanisms are concomitantly activated in the same cell after cerebral ischemia. Stroke 35: 2189–2194, 2004 [DOI] [PubMed] [Google Scholar]
- 41.Wang S, Zhang H, Dai X, Sealock R, Faber JE. Genetic architecture underlying variation in extent and remodeling of the collateral circulation. Circ Res 107: 558–568, 2010 [DOI] [PMC free article] [PubMed] [Google Scholar]
- 42.Wityk RJ, Restrepo L. Hypoperfusion and its augmentation in patients with brain ischemia. Curr Treat Opt Cardiovasc Med 5: 193–199, 2003 [DOI] [PubMed] [Google Scholar]
- 43.Zhang H, Prabhakar P, Sealock R, Faber JE. Wide genetic variation in the native pial collateral circulation is a major determinant of variation in severity of stroke. J Cereb Blood Flow Metab 30: 923–934, 2010 [DOI] [PMC free article] [PubMed] [Google Scholar]