

Abstract
Background
It is well known that loss of muscle mass (quantitative change) is a major change that occurs with aging. Qualitative changes in skeletal muscle, such as increased intramuscular fat, also occur as one ages. Enhanced echo intensity (EI) on ultrasonography images of skeletal muscle is believed to reflect muscle quality. Recent studies evaluating the quality of skeletal muscle using computer-aided gray scale analysis showed that EI is associated with muscle strength independently of age or muscle size in middle-aged and elderly women. The aim of the present study was to investigate whether muscle quality based on EI is associated with muscle strength independently of muscle size for elderly men.
Methods
A total of 184 elderly men (65–91 years) living independently in Kyoto, Japan, participated in this study. The EI, muscle thickness (MT), and subcutaneous fat thickness (FT) of the anterior compartment of the right thigh were determined by assessing ultrasonography images. The maximum isometric torque of knee extension at a knee angle of 90° was measured.
Results
The EI showed a significant negative correlation with muscle strength (r = −0.333, P < 0.001). Multivariate regression analysis revealed that the MT and EI of the knee extensor muscle were independently associated with maximum isometric knee extension strength. Even when partial correlation analysis was performed with age, height, weight, and FT as control variables, EI was still significantly correlated with muscle strength.
Conclusion
The results of this study indicate that aging-related changes in muscle quality contribute to diminishing muscle strength. Ultrasonography is a low-cost, easily accessible, and safe method suitable for the assessment of EI as an index of muscle quality.
Keywords: echogenicity, sarcopenia, ultrasound imaging
Introduction
Sarcopenia, defined as the aging-related loss of muscle mass and/or strength,1–3 has been shown to be a primary factor in the development of frailty, accounting for falls and loss of independence.4 Recent studies have also reported that sarcopenia is associated with lifestyle-related diseases,5–7 osteopenia,8 and mortality risk.9 Loss of skeletal muscle mass (a quantitative change) is a major well-known change associated with aging. Other studies have reported qualitative changes in skeletal muscle with aging (ie, preferential atrophy of Type II muscle fibers,10,11 increased intramuscular fat,12–14 increased extracellular water relative to muscle volume15). In elderly individuals, skeletal muscle mass measured by imaging methods – magnetic resonance imaging (MRI) and/or computed tomography (CT) – may not reflect the true loss of muscle cells because of the qualitative changes in muscle.16 Accurate evaluation of skeletal muscle quality is needed to address sarcopenia.
Previous studies have assessed the quality of skeletal muscle using CT and/or MRI.17,18 Goodpaster et al, evaluating muscle quality using CT, showed a reduced attenuation coefficient caused by augmented fat infiltration.18 They reported that low CT attenuation values for muscle were associated with lower muscle strength in elderly adults (>65 years old) and that the association between CT attenuation value and muscle strength was independent of muscle size.18 Because the equipment needed to make these measurements is located primarily in research facilities and/or hospitals, it is difficult to determine muscle quality using these techniques in frail, elderly individuals who find it difficult to “get around”.
The quality of skeletal muscle, however, can also be evaluated using noninvasive, easily accessible, and safe ultrasonography (US) imaging. With US, enhanced echo intensity (EI) represents changes caused by increased intramuscular fibrous and adipose tissue.19–21 Recently, some research groups have used computer-aided gray scale analysis to evaluate the quality of skeletal muscle.20–29 Fukumoto et al reported that muscle thickness (MT) of the knee extensor and muscle quality assessed from EI measured using this method independently contribute to isometric knee extension strength in middle-aged and elderly women (51–87 years of age).29 Although the detailed relations among EI, muscle size, and muscle strength remain unclear in elderly men, it was reported that EI has significant negative correlations with isometric strength, isokinetic strength, and cardiovascular performance (workload at the ventilatory threshold).28
The aim of the present study was to investigate whether muscle quality based on EI is associated with muscle strength independently of muscle size in elderly men. We hypothesized that, in addition to considering muscle size (quantity), EI as an index of muscle quality is associated with muscle strength, and that the relation is independent of muscle size.
Methods
Participants
A total of 184 elderly men (65–91 years) who lived independently in Kyoto, Japan, participated in this study. Inclusion criteria were: (1) the ability to walk without an assistive device; (2) no history of lower limb trauma or surgery; (3) no neuromuscular disorder; (4) no acute or chronic disease that impaired their strength and power; and (5) no severe dementia (which might influence informed consent). All participants were fully informed about the experimental procedures and the purpose of the study. Each gave written informed consent before participation. The ethics committee of Kyoto Prefectural University of Medicine approved the study protocol.
Measurement of muscle thickness and echo intensity
The tissue thickness of the anterior compartment of the right thigh was measured by B-mode US imaging. Transverse images were obtained with a B-mode US imaging device (SonoSite 180 Plus; SonoSite Japan, Tokyo, Japan) and a multi-frequency linear transducer (5–10 MHz). The gain was kept constant during all measurements and not changed between participants. The measurements were made with the participants standing and completely relaxed. The measurement position was the midpoint between the lateral epicondyle of the femur and the anterior superior iliac spine. The transducer was positioned perpendicular to the longitudinal axis of the quadriceps femoris. The scanning head was pretreated with water-soluble transmission gel that provided acoustical contact without compressing the skin surface. An electric caliper on frozen transverse US images was used to measure MT and subcutaneous fat thickness (FT). The MT of the anterior compartment of the thigh was defined as the sum of the thicknesses for the rectus femoris muscle and the vastus intermedius muscle. The FT of the anterior compartment of the thigh was defined as the distance between the fascia of the rectus femoris muscle and the dermis. A single investigator, who was a research expert trained in the technical aspects of using the ultrasound machine, performed the measurements twice, and the mean of the two values was used for analysis.
EI was defined as the mean pixel intensity in the muscle. The value of EI was determined by gray scale analysis using the standard histogram function in Adobe Photoshop Elements (Adobe Systems, San Jose, CA, USA). A region of interest (ROI) included as much of the rectus femoris muscle as possible without any bone-surrounding fascia. The EI value in the ROI was expressed in values between 0 and 255. To assess test-retest reliability, the intraclass correlation coefficient (ICC) and the mean coefficient of variance (CV) were evaluated using two images taken on two separate days in 12 participants with a mean age of 74.2 ± 4.7 years. The ICC and CV for the repeated measurements of the EI were 0.9635 and 4.2%, respectively.
Measurement of muscle strength
The maximum isometric torque of knee extension at an angle of 90° was measured in a sitting position on a custom-made dynamometer chair, as described elsewhere.15,30 The ankle was attached to a strain-gauge system (TKK5710e; Takei Scientific Instruments Co, Ltd, Niigata, Japan). After the participants were familiarized with the test procedure, two trials at maximum effort were made with a 1-minute recovery period. The greater value obtained was used for analysis. The length between the lateral epicondyle of the humerus and the ankle attachment was measured. Knee extension torque was calculated as the strength multiplied by the length.
Statistical analyses
Statistical analyses were performed using SPSS (version 11.0; SPSS Japan, Tokyo, Japan). All values are shown as the mean ± standard deviation. Correlations between MT, EI, physical characteristics, and muscle strength were calculated using Pearson’s correlation coefficients. Multiple linear regression analysis was performed to evaluate the independent associations of MT and EI with maximum isometric strength. Thus, only these two variables were used as explanatory variables. Partial correlation analysis was performed to determine the effects of MT and EI on muscle strength, controlling for age, height, weight, and FT. Statistical significance was defined as P < 0.05.
Results
Table 1 shows the physical characteristics, US measurements, and muscle strength of the participants. Figure 1 shows typical examples of high and low EIs of the rectus femoris muscle. The EI of the rectus femoris muscle was significantly associated with isometric knee extension strength (r = −0.333, P < 0.001; Figure 2).
Table 1.
Physical characteristics, ultrasonography measurements, and muscle strength of the participants (n = 184)
| Variables | Mean ± standard deviation | Range |
|---|---|---|
| Physical characteristics | ||
| Age (years) | 74.4 ± 5.9 | 65.0–91.0 |
| Height (cm) | 163.2 ± 6.0 | 144.5–178.2 |
| Weight (kg) | 62.3 ± 9.5 | 33.4–89.6 |
| Ultrasound measurements | ||
| FT (mm) | 8.3 ± 2.4 | 2.8–15.4 |
| MT (mm) | 44.4 ± 6.9 | 26.9–59.1 |
| EI | 21.2 ± 4.9 | 12.1–34.0 |
| Muscle strength (N • m) | 118.9 ± 46.3 | 25.9–248.7 |
Abbreviations: EI, echo intensity; FT, subcutaneous fat thickness; MT, muscle thickness.
Figure 1.
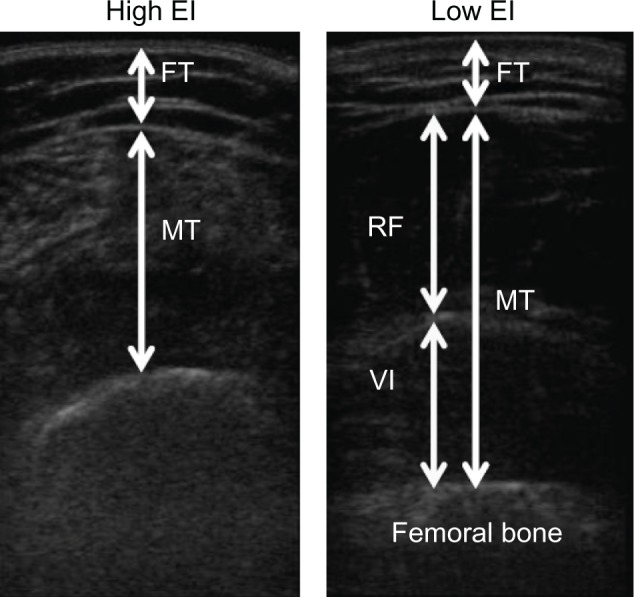
Typical examples of the high (left) and low (right) echo intensity of the rectus femoris muscle.
Note: The value of EI, defined as the mean pixel intensity in the muscle, was determined by gray scale analysis.
Abbreviations: EI, echo intensity; FT, subcutaneous fat thickness; MT, muscle thickness; RF, rectus femoris muscle; VI, vastus intermedius muscle.
Figure 2.
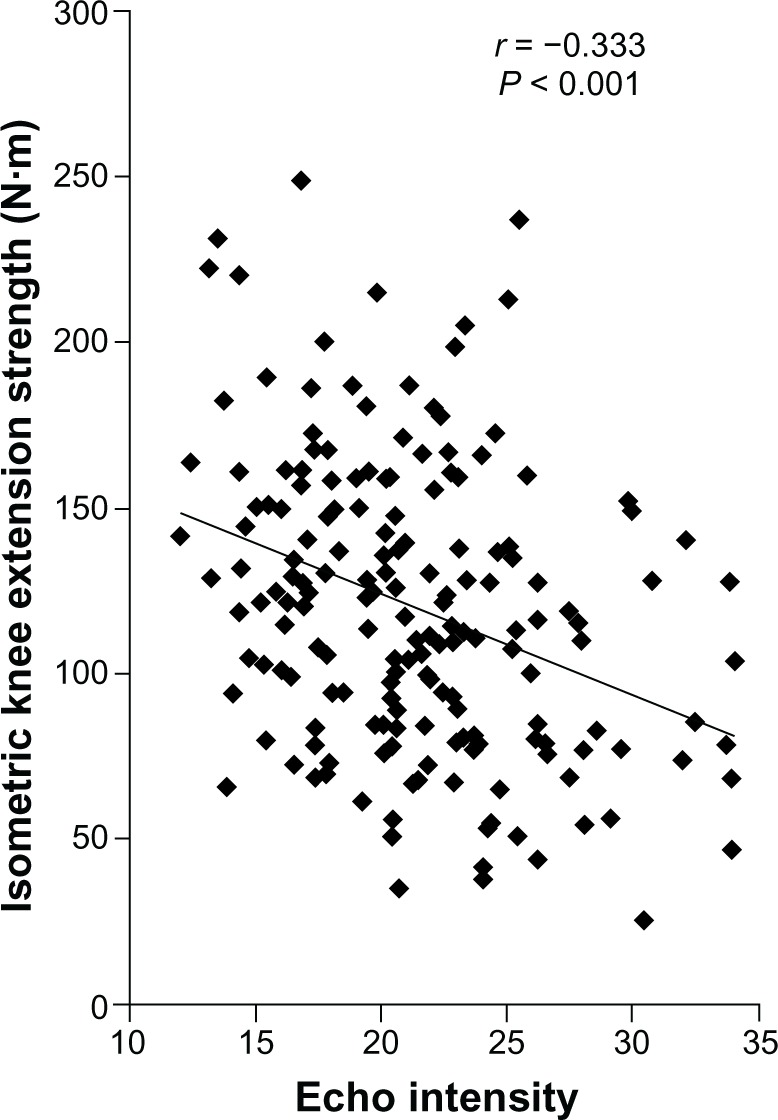
Association between the EI value and isometric knee extension strength in all participants (n = 184).
Abbreviation: EI, echo intensity.
Table 2 shows the correlation coefficients between MT, EI, and the physical characteristics and muscle strength of the participants. MT showed a significant negative correlation with age (r = −0.326, P < 0.001) and a significant positive correlation with height (r = 0.224, P = 0.002), weight (r = 0.493, P < 0.001), and muscle strength (r = 0.411, P < 0.001). MT was not significantly associated with FT (r = 0.071, P = 0.336). EI showed significant positive correlations with age (r = 0.280, P < 0.001) and FT (r = 0.240, P = 0.001). The EI was not significantly associated with height or weight. Muscle strength was significantly correlated with all variables except FT.
Table 2.
Correlation coefficients between MT, EI, physical characteristics, and muscle strength of the participants (n = 184)
| MT | EI | Age | Height | Weight | FT | MS | |
|---|---|---|---|---|---|---|---|
| MT | − | −0.102 | −0.326** | 0.224** | 0.493** | 0.071 | 0.411** |
| EI | − | 0.280** | −0.063 | −0.016 | 0.240** | −0.333** | |
| Age | − | −0.327** | −0.308** | 0.124 | −0.451** | ||
| Height | − | 0.541** | 0.100 | 0.420** | |||
| Mass | − | 0.395** | 0.434** | ||||
| FT | − | 0.051 | |||||
| MS | − |
Note:
P < 0.01.
Abbreviations: EI, echo intensity; FT, subcutaneous fat thickness; MS, muscle strength; MT, muscle thickness.
Multivariate regression analysis revealed that MT and the EI of the knee extensor muscle were independently associated with maximum isometric knee extension strength (Table 3). Table 4 shows the partial correlation coefficients between EI, MT, and muscle strength. Even with age, height, weight, and FT as control variables, MT showed a significant positive correlation with muscle strength (P = 0.004), and EI showed a significant negative correlation with it (P < 0.001).
Table 3.
Association of EI and MT with muscle strength using multiple regression analysis (n = 184)
| β | P-value | |
|---|---|---|
| EI | −0.294 | <0.001 |
| MT | 0.381 | <0.001 |
Note: MT and EI were used as explanatory variables for muscle strength.
Abbreviations: EI, echo intensity; MT, muscle thickness.
Table 4.
Partial correlation coefficients between MT, EI, and muscle strength, with age, height, weight, and FT as control variables (n = 184)
Note:
P < 0.01.
Abbreviations: EI, echo intensity; FT, subcutaneous fat thickness; MS, muscle strength; MT, muscle thickness.
Discussion
This study evaluated the quality of skeletal muscle using computer-aided gray scale analysis in elderly men (65–91 years). This study resulted in three important findings: (1) The EI of the rectus femoris muscle was negatively correlated with knee extension strength and positively correlated with age and FT; (2) the MT and EI of the anterior compartment of the thigh were independently associated with knee extension strength in elderly men; and (3) even when partial correlation analysis was performed with age, height, weight, and FT as control variables, EI was still significantly correlated with muscle strength.
The quality of skeletal muscle has already been assessed using CT and/or MRI.17,18 Goodpaster et al evaluated muscle quality using CT and concluded that loss of muscle quality due to augmented fat infiltration was associated with lower muscle strength in elderly adults (>65 years) independently of muscle size.18 More recently, it has been thought that EI measured from US images using computer-aided gray scale analysis can reflect the quality of skeletal muscle.26–29 Fukumoto et al reported that the MT of the knee extensor and EI measured using this method independently contribute to isometric knee extension strength in middle-aged and elderly women (51–87 years).29 Another research group demonstrated a significant negative correlation between isometric strength and EI in a small sample of elderly men using the same method.28 The results of the present study support those of previous studies regarding the association between EI and muscle strength.
It is generally thought that a high-homogeneity tissue such as skeletal muscle was visualized as a low-intensity area on US, and a low-homogeneity tissue such as subcutaneous adipose was visualized as a high-intensity area. Thus, it is possible that enhanced EI of aging skeletal muscle reflects aging-related degradation of the muscle. Some studies have reported qualitative changes in skeletal muscle with aging such as increased intramuscular fat12–14 and increased extracellular water relative to muscle volume.15 Among these qualitative changes with aging, some changes are thought to be related to enhanced EI of skeletal muscle. First, accumulation of adipose tissue in muscle increases the EI. Research groups that have evaluated muscle quality using computer-aided gray scale analysis have explained that the EI is related to the increase in intramuscular adipose tissue and fibrous tissue.21,22,27 Second, structural changes in the extracellular matrix (ECM), such as an increase in the collagen concentration, may be associated with the EI of skeletal muscle. It is also possible that the structural and biochemical changes in skeletal muscle ECM contribute to aging-related loss of muscle function (eg, impaired in force generation and increased stiffness).31 A recent experimental study in animals observed increased accumulation of interstitial connective tissue and basal lamina thickness in the skeletal muscles of old animals compared with these muscles in young animals.32 Third, decreased homogeneity of skeletal muscle fiber direction in older individuals may also influence the EI of skeletal muscle. A recent study evaluated fractional anisotropy (FA) of skeletal muscle using diffusion tensor MRI and found that FA of the anterior tibialis muscle in older participants was significantly lower than that in younger participants.33 These structural changes in skeletal muscle with aging may increase the EI of skeletal muscle by inducing reflection of the US wave.
The results of the current study and previous studies indicated that muscle size (quantity) and muscle quality independently contribute to muscle strength. Hence, to prevent sarcopenia, more research is needed to establish an accurate, easily accessible method for evaluating the quality of skeletal muscle.
There were two limitations to this study. First, because the US wave attenuates as it moves deeper into body tissue, the value of EI was affected by the thickness of the tissue (MT and FT). Also, the FT range was 2.8–15.4 mm (Table 1), so the ROI for EI was not determined at a constant depth. Even when partial correlation analysis was performed with FT as a control variable, the EI showed a significant negative correlation with muscle strength. However, we cannot exclude the possibility that the EI values were affected by the depth. Second, because there is no clear criterion for the EI value, it is impossible to compare our EI values with those obtained by different devices. Therefore, it is necessary to establish a calibration method for clearly describing the EI of skeletal muscle.
Conclusion
The current study shows that muscle quality in elderly men, assessed based on the EI of skeletal muscle, was related to muscle strength independently of MT. Even with age, height, weight, and FT as control variables, EI showed a significant negative correlation with muscle strength. The results of this study indicate that aging-related changes in muscle quality contribute to diminishing muscle strength. We believe that US is a low-cost, easily accessible, safe method that is suitable for the assessment of EI as an index of muscle quality. However, it is still impossible to compare our EI values with those obtained by different devices.
Acknowledgments
This study was supported by a research grant to MK from the Japanese Ministry of Education, Culture, Sports, Science and Technology (MEXT KAKENHI 24240091), to YW (MEXT KAKENHI 25750360) and a research grant to YY from Research Fellowships of the Japan Society for the Promotion of Science for Young Scientists (23-333).
Footnotes
Disclosure
The authors report no conflicts of interest in this work.
References
- 1.Evans WJ. What is sarcopenia? J Gerontol A Biol Sci Med Sci. 1995;50(Spec No):5–8. doi: 10.1093/gerona/50a.special_issue.5. [DOI] [PubMed] [Google Scholar]
- 2.Rosenberg IH. Sarcopenia: origins and clinical relevance. J Nutr. 1997;127(Suppl 5):990S–991S. doi: 10.1093/jn/127.5.990S. [DOI] [PubMed] [Google Scholar]
- 3.Cruz-Jentoft AJ, Baeyens JP, Bauer JM, et al. Sarcopenia: European consensus on definition and diagnosis: Report of the European Working Group on Sarcopenia in Older People. Age Ageing. 2010;39(4):412–423. doi: 10.1093/ageing/afq034. [DOI] [PMC free article] [PubMed] [Google Scholar]
- 4.Wolfson L, Judge J, Whipple R, King M. Strength is a major factor in balance, gait, and the occurrence of falls. J Gerontol A Biol Sci Med Sci. 1995;50(Spec No):64–67. doi: 10.1093/gerona/50a.special_issue.64. [DOI] [PubMed] [Google Scholar]
- 5.Roubenoff R. Sarcopenic obesity: the confluence of two epidemics. Obes Res. 2004;12(6):887–888. doi: 10.1038/oby.2004.107. [DOI] [PubMed] [Google Scholar]
- 6.Karakelides H, Nair KS. Sarcopenia of aging and its metabolic impact. Curr Top Dev Biol. 2005;68:123–148. doi: 10.1016/S0070-2153(05)68005-2. [DOI] [PubMed] [Google Scholar]
- 7.Schrager MA, Metter EJ, Simonsick E, et al. Sarcopenic obesity and inflammation in the InCHIANTI study. J Appl Physiol. 2007;102(3):919–925. doi: 10.1152/japplphysiol.00627.2006. [DOI] [PMC free article] [PubMed] [Google Scholar]
- 8.Walsh MC, Hunter GR, Livingstone MB. Sarcopenia in premenopausal and postmenopausal women with osteopenia, osteoporosis and normal bone mineral density. Osteoporos Int. 2006;17(1):61–67. doi: 10.1007/s00198-005-1900-x. [DOI] [PubMed] [Google Scholar]
- 9.Volpato S, Romagnoni F, Soattin L, et al. Body mass index, body cell mass, and 4-year all-cause mortality risk in older nursing home residents. J Am Geriatr Soc. 2004;52(6):886–891. doi: 10.1111/j.1532-5415.2004.52254.x. [DOI] [PubMed] [Google Scholar]
- 10.Lexell J, Taylor CC, Sjostrom M. What is the cause of the ageing atrophy? Total number, size and proportion of different fiber types studied in whole vastus lateralis muscle from 15- to 83-year-old men. J Neurol Sci. 1988;84(2–3):275–294. doi: 10.1016/0022-510x(88)90132-3. [DOI] [PubMed] [Google Scholar]
- 11.Lexell J. Human aging, muscle mass, and fiber type composition. J Gerontol A Biol Sci Med Sci. 1995;50(Spec No):11–16. doi: 10.1093/gerona/50a.special_issue.11. [DOI] [PubMed] [Google Scholar]
- 12.Tsubahara A, Chino N, Akaboshi K, Okajima Y, Takahashi H. Age-related changes of water and fat content in muscles estimated by magnetic resonance (MR) imaging. Disabil Rehabil. 1995;17(6):298–304. doi: 10.3109/09638289509166650. [DOI] [PubMed] [Google Scholar]
- 13.Overend TJ, Cunningham DA, Paterson DH, Lefcoe MS. Thigh composition in young and elderly men determined by computed tomography. Clin Physiol. 1992;12(6):629–640. doi: 10.1111/j.1475-097x.1992.tb00366.x. [DOI] [PubMed] [Google Scholar]
- 14.Frantzell A, Ingelmark BE. Occurrence and distribution of fat in human muscles at various age levels; a morphologic and roentgenologic investigation. Acta Soc Med Ups. 1951;56(1–2):59–87. [PubMed] [Google Scholar]
- 15.Yamada Y, Schoeller DA, Nakamura E, Morimoto T, Kimura M, Oda S. Extracellular water may mask actual muscle atrophy during aging. J Gerontol A Biol Sci Med Sci. 2010;65(5):510–516. doi: 10.1093/gerona/glq001. [DOI] [PubMed] [Google Scholar]
- 16.Bartok C, Schoeller DA. Estimation of segmental muscle volume by bioelectrical impedance spectroscopy. J Appl Physiol. 2004;96(1):161–166. doi: 10.1152/japplphysiol.00686.2002. [DOI] [PubMed] [Google Scholar]
- 17.Kent-Braun JA, Ng AV, Young K. Skeletal muscle contractile and noncontractile components in young and older women and men. J Appl Physiol. 2000;88(2):662–668. doi: 10.1152/jappl.2000.88.2.662. [DOI] [PubMed] [Google Scholar]
- 18.Goodpaster BH, Carlson CL, Visser M, et al. Attenuation of skeletal muscle and strength in the elderly: The Health ABC Study. J Appl Physiol. 2001;90(6):2157–2165. doi: 10.1152/jappl.2001.90.6.2157. [DOI] [PubMed] [Google Scholar]
- 19.Heckmatt JZ, Leeman S, Dubowitz V. Ultrasound imaging in the diagnosis of muscle disease. J Pediatr. 1982;101(5):656–660. doi: 10.1016/s0022-3476(82)80286-2. [DOI] [PubMed] [Google Scholar]
- 20.Reimers K, Reimers CD, Wagner S, Paetzke I, Pongratz DE. Skeletal muscle sonography: a correlative study of echogenicity and morphology. J Ultrasound Med. 1993;12(2):73–77. doi: 10.7863/jum.1993.12.2.73. [DOI] [PubMed] [Google Scholar]
- 21.Pillen S, Tak RO, Zwarts MJ, et al. Skeletal muscle ultrasound: correlation between fibrous tissue and echo intensity. Ultrasound Med Biol. 2009;35(3):443–446. doi: 10.1016/j.ultrasmedbio.2008.09.016. [DOI] [PubMed] [Google Scholar]
- 22.Reimers CD, Schlotter B, Eicke BM, Witt TN. Calf enlargement in neuromuscular diseases: a quantitative ultrasound study in 350 patients and review of the literature. J Neurol Sci. 1996;143(1–2):46–56. doi: 10.1016/s0022-510x(96)00037-8. [DOI] [PubMed] [Google Scholar]
- 23.Bargfrede M, Schwennicke A, Tumani H, Reimers CD. Quantitative ultrasonography in focal neuropathies as compared to clinical and EMG findings. Eur J Ultrasound. 1999;10(1):21–29. doi: 10.1016/s0929-8266(99)00040-3. [DOI] [PubMed] [Google Scholar]
- 24.Maurits NM, Bollen AE, Windhausen A, De Jager AE, Van Der Hoeven JH. Muscle ultrasound analysis: normal values and differentiation between myopathies and neuropathies. Ultrasound Med Biol. 2003;29(2):215–225. doi: 10.1016/s0301-5629(02)00758-5. [DOI] [PubMed] [Google Scholar]
- 25.Maurits NM, Beenakker EA, van Schaik DE, Fock JM, van der Hoeven JH. Muscle ultrasound in children: normal values and application to neuromuscular disorders. Ultrasound Med Biol. 2004;30(8):1017–1027. doi: 10.1016/j.ultrasmedbio.2004.05.013. [DOI] [PubMed] [Google Scholar]
- 26.Pillen S, van Keimpema M, Nievelstein RA, Verrips A, van Kruijsbergen-Raijmann W, Zwarts MJ. Skeletal muscle ultrasonography: visual versus quantitative evaluation. Ultrasound Med Biol. 2006;32(9):1315–1321. doi: 10.1016/j.ultrasmedbio.2006.05.028. [DOI] [PubMed] [Google Scholar]
- 27.Arts IM, Pillen S, Schelhaas HJ, Overeem S, Zwarts MJ. Normal values for quantitative muscle ultrasonography in adults. Muscle Nerve. 2010;41(1):32–41. doi: 10.1002/mus.21458. [DOI] [PubMed] [Google Scholar]
- 28.Cadore EL, Izquierdo M, Conceicao M, et al. Echo intensity is associated with skeletal muscle power and cardiovascular performance in elderly men. Exp Gerontol. 2012;47(6):473–478. doi: 10.1016/j.exger.2012.04.002. [DOI] [PubMed] [Google Scholar]
- 29.Fukumoto Y, Ikezoe T, Yamada Y, et al. Skeletal muscle quality assessed from echo intensity is associated with muscle strength of middle-aged and elderly persons. Eur J Appl Physiol. 2012;112(4):1519–1525. doi: 10.1007/s00421-011-2099-5. [DOI] [PubMed] [Google Scholar]
- 30.Kimura M, Mizuta C, Yamada Y, Okayama Y, Nakamura E. Constructing an index of physical fitness age for Japanese elderly based on 7-year longitudinal data: sex differences in estimated physical fitness age. Age (Dordr) 2012;34(1):203–214. doi: 10.1007/s11357-011-9225-5. [DOI] [PMC free article] [PubMed] [Google Scholar]
- 31.Kragstrup TW, Kjaer M, Mackey AL. Structural, biochemical, cellular, and functional changes in skeletal muscle extracellular matrix with aging. Scand J Med Sci Sports. 2011;21(6):749–757. doi: 10.1111/j.1600-0838.2011.01377.x. [DOI] [PubMed] [Google Scholar]
- 32.Ramaswamy KS, Palmer ML, van der Meulen JH, et al. Lateral transmission of force is impaired in skeletal muscles of dystrophic mice and very old rats. J Physiol. 2011;589(Pt 5):1195–1208. doi: 10.1113/jphysiol.2010.201921. [DOI] [PMC free article] [PubMed] [Google Scholar]
- 33.Galban CJ, Maderwald S, Stock F, Ladd ME. Age-related changes in skeletal muscle as detected by diffusion tensor magnetic resonance imaging. J Gerontol A Biol Sci Med Sci. 2007;62(4):453–458. doi: 10.1093/gerona/62.4.453. [DOI] [PubMed] [Google Scholar]