

Abstract
The transcription factor FoxP3 partakes dominantly in the specification and function of FoxP3+CD4+ T regulatory cells (Tregs), but is neither strictly necessary nor sufficient to determine the characteristic Treg signature. Computational network inference and experimental testing assessed the contribution of other transcription factors (TF). Enforced expression of Helios or Xbp1 elicited specific signatures, but Eos, Irf4, Satb1, Lef1 and Gata1 elicited exactly the same outcome, synergizing with FoxP3 to activate most of the Treg signature, including key TFs, and enhancing FoxP3 occupancy at its genomic targets. Conversely, the Treg signature was robust to inactivation of any single cofactor. A redundant genetic switch thus locks-in the Treg phenotype, a model which accounts for several aspects of Treg physiology, differentiation and stability.
T regulatory cells (Treg) play a key role in immunological homeostasis, control autoimmune deviation, prevent runaway responses to microbes or allergens, and regulate certain non-immunological functions 1, 2. Most Tregs differentiate in the thymus as a rescue pathway for cells expressing a self-reactive T cell receptor (TCR) 3, but some also differentiate in peripheral organs in response to chronic challenges such as commensal bacteria 4.
Phenotypic stability is an important consideration for Treg cells, since the self-reactivity of their TCR makes it important for their suppressive phenotype to be stable, lest they convert into aggressive effectors. Support for Treg instability, and for the notion that Tregs turned into aggressive effectors by the loss of FoxP3 play a role in autoimmune diseases, stemmed from transfer experiments into alymphoid hosts 5-7 and from lineage tracing experiments that relied on continuously active Foxp3-driven cre transgenes 8. On the other hand, these results were largely refuted by the observation that Tregs transferred into normal hosts are stable for long periods of time, and by lineage-tracing experiments performed in pulse-chase mode with a Tamoxifen-controlled cre system 9. Thus, and with the exception of effector cells that transiently express FoxP3 upon activation 10, the phenotype of committed Tregs appear very stable over time 9.
Treg function is underwritten by a canonical ‘Treg signature’, a set of transcripts that are over- or under-expressed in Tregs relative to their conventional CD4+ counterparts (Tconv) 11, 12. This signature is established very early during Treg differentiation 11, and encodes proteins with a range of cellular locations and several molecular mediators of Treg action 13. The Forkhead family transcription factor (TF) FoxP3 is essential for the specification and maintenance of Tregs, as evidenced by the lethal lymphoproliferation and multi-organ autoimmunity that occur in its absence in scurfy mutant mice or in immune dysregulation – polyendocrinopathy – enteropathy – X-linked (IPEX) patients 14, and plays an important part in determining the Treg signature 11, 15, 16. FoxP3 was initially considered as the ‘master regulator’ of Tregs, but a more nuanced view has emerged. Cells with many Treg characteristics including a transcriptionally active Foxp3 locus (“Treg wannabes”) can differentiate in the absence of FoxP3, albeit in reduced numbers and stability 17, 18 and perhaps some IPEX patients 19. A segment of the Treg signature can also be induced in transforming growth factor-β (TGF-β) Tregs derived from CD4+ cells of scurfy mice 11. Conversely, the transduction of FoxP3, or its induction by TGF-β, are not sufficient to elicit the full Treg signature 11, 20.
A number of other transcription factors (TF) have been reported to interact with FoxP3 and to promote Treg function. These include factors from a variety of families, and physical or functional interactions have been demonstrated with Runx1, NFAT, Eos (Ikzf4), phospho-STAT3, Irf4, T-bet, GATA3, RORγt, RORα, Foxo1 and Foxo3, Satb1 and HIF-1α 21-31. Several of them are important for full Treg function. In addition, different Treg subphenotypes control various facets of effector T cells, and these are themselves dependent on distinct TFs such as T-bet, Irf4 or Stat3 24, 27, 30.
How the contributions of these various cofactors’ activities are orchestrated is unknown. A plausible hypothesis is that each cofactor might condition, alone or in combination with FoxP3, a segment of the Treg signature genes, and the full signature and functional activity would thus result from cumulative effects of these TFs. To test this hypothesis, we first used a computational approach to ‘reverse-engineer’ the transcriptional regulatory network of Treg cells, a successful strategy in simpler regulatory systems 32. The computational predictions were then tested in loss- and gain-of-function experiments. These led to a rather different perspective, wherein the Treg phenotype is controlled by a highly redundant ‘genetic switch’.
RESULTS
Bioinformatic prediction of Treg transcriptional control
Transcriptional regulation is governed by extensive and interconnected networks of genes. This complexity can be tackled by computational methods that start from a large number of gene expression datasets and reconstruct plausible regulatory models, and infer and rank potential connections between target genes and a set of putative regulators 33, 34. These algorithms, typically based on multiple regression or related approaches, analyze the pairwise variation between regulator(s) and target across a large number of related datasets, in response to a range of perturbations (differentiation, genetic or chemical perturbations). Here, we used 129 gene-expression profiles previously generated on the M430.v2 microarray platform from various CD4+ T cells: primary Treg and Tconv cells from various anatomical locations and of different surface phenotypes, TGF-β-induced FoxP3+ cells, cells from mutant mice (Rara, Foxp3 deficiencies), and Akt- or various TF-transfectants (Supplementary Table 1). We selected as potential regulators 2021 transcription-control factors from GeneOntology annotation (conventional TFs as well as chromatin modifiers), and 603 target genes that compose the canonical Treg signature (407 and 196 over- or under-expressed in Tregs, respectively; Fig. 1a) 11. The Context Likelihood of Relatedness (CLR) algorithm 35 was used, a relevance network reconstruction method that operates by combining the relative strength of coexpression between a regulator and potential targets. The results are listed in Supplementary Table 2, the top regulators shown in Table 1, and Fig. 1b. Reassuringly, top predicted regulators included FoxP3 and other factors previously associated with Treg function such as Eos (Ikzf4) and Helios (Ikzf2) 23, 36, but also some novel TFs not previously associated with Tregs such as Lef1 or Gata1. Some of the predicted regulators were themselves differentially expressed in Treg versus Tconv cells (Ikzf2, Ikzf4, Lef1), while others were only modestly so (Gata1).
Figure 1. Computational prediction of TFs in control of the Treg signature.
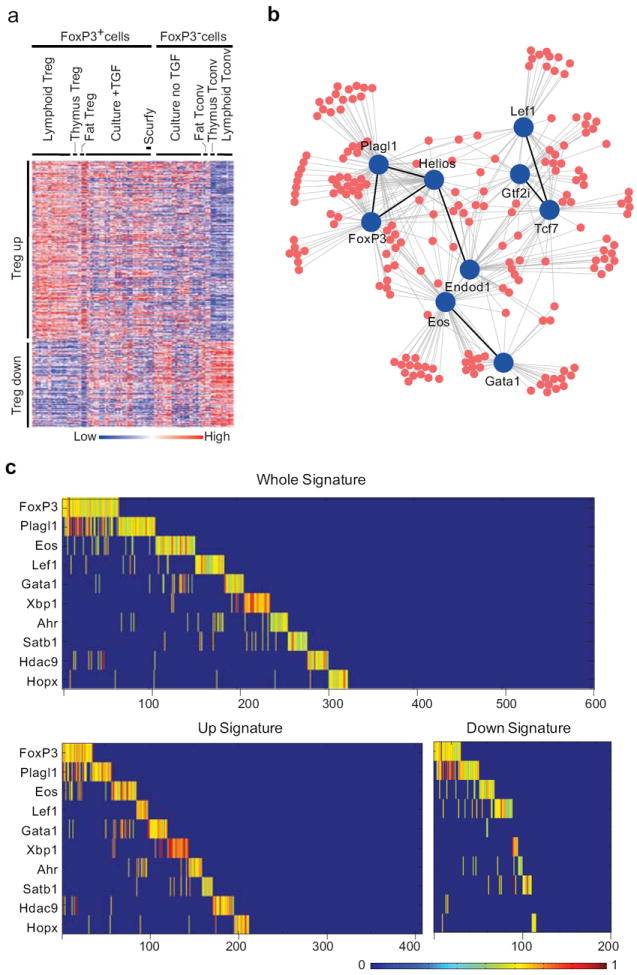
(a) Heatmap of the expression profiles used in the computational reconstruction, which included matched pairs of FoxP3+ and FoxP3- cells; scurfy: TGF-β-treated cultures of CD4+ T cells from Foxp3-null scurfy mice. Genes in rows, populations in columns (see Supplementary Table 1). (b) TFs (blue) most highly connected to Treg signature genes (red), as predicted by the CLR algorithm. (c) Result of a mathematical optimization, run in ILOG Cplex from the CLR scores of 1a, selecting combinations of TFs to maximize the portion of the Treg signature explained. In the optimal solution shown here, the 10 factors together account for 330 of the 603 Treg signature genes, FoxP3 explaining the most. Color scale represents the intensity of the influence of each factor; blue background, no effect; green-yellow-red: increasing impact.
Table 1. Top regulators and their strongest connections based on CLR inference.
Regulators with the highest number of connections and their top 5 strongest connections based on the CLR scores (numeric values in the table). Highlighted scores are edges between regulators and Treg signature genes kept in the network
| Treg signature target genes | Relative exp. in Tregs | Regulators | ||||||||
|---|---|---|---|---|---|---|---|---|---|---|
| FoxP3 | Gtf2i | Plagl1 | Tcf7 | Endod1 | Helios | Eos | Gata1 | Lef1 | ||
| Mfsd6 | Down | 6.88 | 3.28 | 4.14 | 2.48 | 2.39 | 3.49 | 5.61 | 3.17 | 0.47 |
| Lypd6b | Down | 3.96 | 6.90 | 3.20 | 5.85 | 4.03 | 2.79 | 3.59 | 1.87 | 3.30 |
| 2610019F03Rik | Down | 2.41 | 5.20 | 2.79 | 9.06 | 3.59 | 2.36 | 4.14 | 0.95 | 5.45 |
| Ahr | Up | 2.37 | 1.32 | 2.01 | 1.90 | 6.30 | 3.06 | 2.58 | 1.32 | 3.06 |
| Atp8b4 | Down | 5.29 | 2.79 | 7.89 | 1.54 | 1.28 | 2.68 | 3.70 | -0.09 | 1.12 |
| Casp7 | Up | 2.38 | 3.66 | 1.26 | 2.70 | 6.65 | 0.99 | 4.27 | 5.47 | 1.87 |
| Cd83 | Up | 4.42 | 0.29 | 6.87 | -0.54 | 2.57 | 4.97 | 2.17 | 0.39 | 1.56 |
| Cyfip1 | Up | 1.99 | 5.58 | 1.61 | 2.78 | 6.45 | 2.83 | 1.84 | 1.81 | 2.81 |
| Dennd2d | Down | 0.61 | 4.78 | 0.86 | 7.17 | 1.37 | 0.46 | 2.53 | 0.77 | 2.41 |
| Dst | Up | 3.10 | 6.44 | 3.46 | 2.40 | 3.40 | 1.59 | 4.10 | 2.17 | 2.02 |
| Themis | Down | 5.13 | 1.38 | 6.92 | 1.43 | 1.36 | 4.39 | 2.18 | 0.96 | 2.98 |
| Enc1 | Down | 4.60 | 0.43 | 2.42 | 2.13 | 4.23 | 6.18 | 3.78 | 2.27 | 3.71 |
| Entpd1 | Up | 1.92 | 2.67 | 2.11 | 6.51 | 5.05 | 3.34 | 2.98 | 0.71 | 3.56 |
| Gpr83 | Up | 5.51 | 2.41 | 4.03 | 2.82 | 1.52 | 3.97 | 6.46 | 3.80 | 0.65 |
| Il1rl2 | Down | 3.92 | 0.55 | 3.91 | 1.68 | 3.78 | 7.05 | 2.95 | -0.61 | 1.80 |
| Il2ra | Up | 1.82 | 3.48 | 1.03 | 3.36 | 2.80 | 1.42 | 5.20 | 4.72 | 0.39 |
| Nlk | Down | 0.28 | 5.90 | 1.54 | 3.29 | 1.31 | 0.52 | 1.57 | 0.87 | 3.38 |
| Pde3b | Down | 8.31 | 1.65 | 6.46 | 0.23 | 3.02 | 5.58 | 1.49 | 0.38 | 1.35 |
| Lycat | Up | 4.95 | 0.47 | 5.96 | 0.79 | 0.99 | 6.02 | 0.63 | -0.62 | 2.15 |
| Mctp2 | Down | 6.52 | 5.76 | 6.26 | 2.86 | 0.44 | 2.84 | 5.01 | 1.15 | 1.36 |
| Niban | Up | 4.01 | 2.95 | 3.60 | 2.74 | 4.99 | 6.24 | 1.70 | 1.75 | 2.62 |
| Nrp1 | Up | 5.81 | 2.00 | 5.15 | 1.34 | 3.78 | 4.45 | 2.59 | 1.07 | 1.80 |
| Rcn1 | Up | 0.17 | 1.36 | 0.20 | 1.16 | 1.19 | -0.09 | 2.29 | 8.22 | 0.91 |
| Slamf1 | Up | 3.72 | 2.32 | 7.31 | 0.72 | 0.82 | 2.49 | -0.01 | 0.18 | 1.96 |
| Socs2 | Up | 1.43 | 2.58 | 0.76 | 2.30 | 3.14 | 0.74 | 3.17 | 6.31 | 1.14 |
| Stx11 | Up | 0.92 | 1.81 | 3.05 | 3.16 | 4.90 | 4.29 | 1.15 | 0.63 | 6.13 |
Many target genes were predicted to be influenced by several TFs (Fig. 1b), making it difficult to infer the regulators of the Treg signature. In keeping with our hypothesis of additive transcriptional control by a panel of TFs, we started from these predicted regulators and formulated an optimization process on the ILOG Cplex package (IBM) to determine a set of TFs that would, in combination, account for the greatest fraction of the Treg signature. Under this model, 10 TFs could explain over half of the Treg signature (Fig. 1c). FoxP3 led the list, covering 10.8 % of the signature, lower but in the same range as estimates from transduction experiments 11. Most of the TFs were predicted to be both stimulatory or repressive, depending on the target, although some seemed to be only activating (Gata1, Hdac9).
Loss of function validation of computational predictions
A set of complementary gain- and loss- of function experiments was undertaken to validate whether the computational predictions had actual biological relevance. We chose a subset of TFs based on availability of knockout mice and/or enforced-expression vectors. First, FoxP3’s predicted targets were analyzed in a comparison of TGF-β-induced cultures of CD4+ cells from wildtype or FoxP3-deficient scurfy mice, which brings forth those transcripts strictly dependent on Foxp3 11. Predicted FoxP3 targets were skewed to the extremes of the distribution, more so than the Treg signature as a whole (Fig. 2a; p=6.9×10⁻⁶) suggesting the validity of computational prediction of FoxP3 targets.
Figure 2. Validity of the predicted FoxP3 targets.
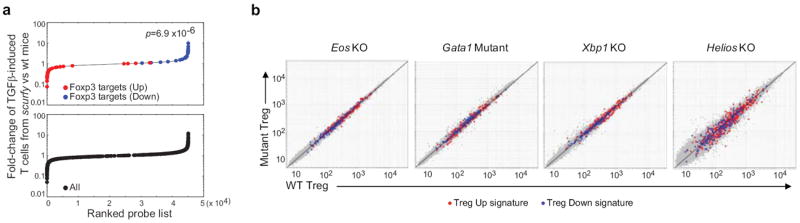
(a) The distribution of expression ratio in TGF-β-induced T cells from scurfy mice vs. those from wildtype mice 11 is plotted for CLR-predicted targets (top) or for the whole Treg signature (bottom); note the more extreme distribution of CLR-predicted FoxP3-target genes. Statistical significance was determined with Kolmogorov-Smirnov test. (b) Gene expression profiling in Treg cells deficient or mutant in CLR-predicted TFs as indicated, compared to their WT littermates. Values averaged from duplicates.
We then analyzed the transcriptomes of Treg cells in a set of knockout mice available for several of these predicted cofactors: i) a complete knockout of Eos; these mice are viable and fertile, with no noted autoimmune phenotype, and have normal Treg numbers and phenotypes (Supplementary Fig.1, and R.G. and D.R., unpublished), perhaps contrary to expectations 23; ii) a promoter deletion of Gata1 37, in which Treg and other T cells appear normal (Supplementary Fig. 1, and J.H., unpublished); other known Gata1 target genes were affected in those mice. iii) a conditional knockout of the Xbp1 gene (Xbp1fl/fl × Mx1-cre) 38; Treg populations in lymphoid organs are again normal in these mice (Supplementary Fig. 1, and S.A. and L.G., unpublished); iv) a knockout of Helios in which Tregs appear normal 39. Gene-expression profiles were generated from purified splenic CD4+CD25hi Tregs of these mice and their wildtype littermates (Fig. 2b). No bias was detected in any of the mutant Tregs, whether of the Treg signature as a whole (Fig. 2b) or of the computationally predicted targets of each TFs (Supplementary Fig.2) Thus, while each of these TFs may impact on the Treg signature when varying naturally within the diverse cell types used for the computational analysis, the Treg signature was robust to the complete elimination of any one of them.
Gain-of-function validation of computational predictions
We then performed gain-of-function experiments by retrovirally transducing cDNAs encoding a number of candidate TFs, alone or together with FOXP3, into CD4+ Tconv cells activated with anti-CD3+CD28 beads (human FOXP3, which has a very comparable transcriptional signature relative to that of mouse FoxP3 11 was used to allow distinction from the endogenous transcript). These manipulations resulted in expression levels of FoxP3 and other TFs in the same general range as found in normal ex vivo T cells (Supplementary Fig. 3). Cells expressing each TF, alone or together with FOXP3, were sorted 3 days after transduction for gene expression profiling (Fig. 3a). Consistent with previous findings 11, 20, FOXP3 alone could influence only a limited number of Treg signature genes (FOXP3, Fig. 3b). Enforced expression of cofactors alone had even less effect (EOS, Fig. 3b), but robust induction of Treg Up signature genes and repression of Treg Down signature genes were observed when FOXP3 and cofactors were both present (FOXP3+EOS, Fig. 3b). This was validated by RT-PCR for representative genes in independent samples (Fig. 3c). Such a synergistic outcome was seen with each of the 7 candidate TFs tested (Supplementary Fig. 4), but five of them (EOS, IRF4, GATA1, LEF1 and SATB1, hereafter “quintet”) had a striking effect, cooperating with FOXP3 to similarly shift most of the Treg signature (Fig. 3d and Supplementary Table 3). Indeed, each of this quintet of TFs, together with FOXP3, regulated the same set of genes, as shown by the direct comparison of Fig. 3e. This synergy was not an artifact of the dual transductions, as cells transduced with FOXP3 and a control TF (Pbx1) were similar to those expressing FOXP3 alone (Fig. 3b, 3f). Rates of cell division were also identical in singly- and doubly-transduced cells, as measured by CFSE dilution (Supplementary Fig. 5). This response was different from that prompted by Helios or XBP1, although the latter also synergized with FOXP3, as shown by the integrated Treg signature index (Fig. 3f).
Figure 3. Transcriptional induction of Treg signature by FoxP3 and other TFs.
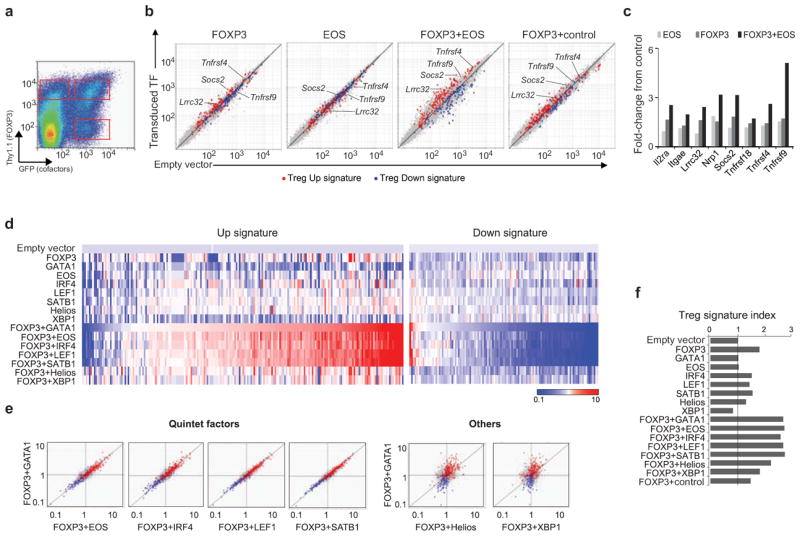
Purified mouse Tconv cells were activated and retrovirally transduced with expression vectors encoding FOXP3 (with a Thy1.1 reporter), and various cofactors (with a GFP reporter), and sorted after 3 days of culture. (a) Representative cytometry profile of double-transduced cells. (b) Expression profiles of Tconv cells transduced with FOXP3 and EOS, alone or together, as well as FOXP3 plus a control TF (Pbx1), were compared to that of cells transduced with empty vectors (the x-axis). Values were averaged from independent triplicates. Note that international nomenclature is followed, using mouse terminology in general (first letter uppercase), human when required (all uppercase), and genes italics. (c) RT-PCR quantitation of representative Treg signature genes in an independent set of samples. Shown are normalized fold-changes to control vector transduced cells. GITR (Tnfrsf18), Ox40 (Tnfrsf4), 4-1BB (Tnfrsf9). (d) Heatmap representation of Treg Up and Down signature genes after transduction of candidate TFs, alone or with FOXP3 (average triplicated). (e) Direct comparison of Treg signature changes in cells transduced with FOXP3 plus different cofactors (FoldChange relative to control). The y-axis in all panels represents changes elicited by FOXP3+GATA1. (f) Overall extent of the transition towards Treg phenotype, assessed by a cumulative Treg signature index.
We then asked whether the combination of two quintet TFs could induce the Treg signature, without FoxP3. Indeed, the combination of EOS+LEF1, or of GATA1+SATB1) had a partial effect, including a modest induction of Foxp3 (Supplementary Fig. 6).
Affymetrix 1.0 ST microarrays contain features that span the length of the transcripts, allowing us to parse signals from the transfected genes vs. their endogenous homolog (Fig. 4a and Supplementary Table 4). FOXP3 plus any of the quintet factors modified the expression of endogenous TF transcripts: induction of Foxp3, Eos, Irf4 and Xbp1 and repression of Lef1 and Satb1. Thus, the introduction of any of the quintet factors synergized with FOXP3 to induce a widespread reassortment of the cell’s regulatory TF balance, in an autoassembly of the Treg profile. This involved the induction of TFs that are normally over-expressed (Eos, Irf4) and the repression of those that are under-expressed (Lef1, Satb1) in Treg cells (Supplementary Fig. 7). Thus, these results indicate a synergistic effect between FoxP3 and cofactors that propagates to other TFs and locks-in the Treg signature. Accordingly, the genes affected here include the Treg signature genes found to be FoxP3-independent in previous studies 11.
Figure 4. Mechanistic impact of FoxP3 cofactors.
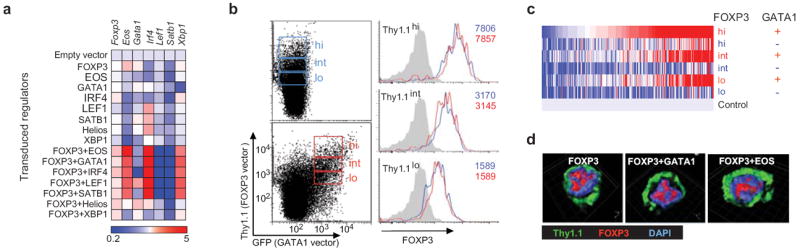
(a) Expression of endogenous transcripts of Foxp3 and cofactors in transduced cells. (b) CD4+ Tconv cells transduced with FOXP3 (blue) or FOXP3+GATA1 (red) were sorted into matching bins of Thy1.1 reporter intensities, and the levels of FOXP3 determined by intracellular staining. Numbers indicate the MFI of FOXP3 protein. (c) Heatmap representation of the expression of Treg Up signature genes in expression profiles of cells transduced and sorted into FOXP3 expression bins as in (b). (d) Confocal microscopy of CD4+ cells transduced with FOXP3 and other TFs, stained for FOXP3, Thy1.1, and DNA (DAPI).
How the cofactors operate
We then asked how the quintet cofactors might elicit this transition. It was not through stabilization of the FoxP3 protein, whose abundance, measured by intracellular staining, was identical whether or not the cells were co-transduced with a quintet factor, across a range of expression values of the co-transcribed IRES-Thy1.1 reporter (Fig. 4b). It was possible that quintet factors have a quantitative influence on FoxP3’s activity, simply displacing a threshold of activity below which FoxP3 would be ineffective. To test this hypothesis, we sorted and profiled matched bins of FOXP3-transduced cells bearing various levels of FOXP3, alone or co-transduced with GATA1, chosen as a representative of the quintet factors (Fig. 4c). As might be expected, increasing FOXP3 did have a more substantial transcriptional impact. But the highest levels of FOXP3, when alone, were unable to match the induction of Treg signature genes together with GATA1. The cooperating effect of GATA1 was apparent at all levels of FOXP3. Thus, the quintet factors were not merely providing a quantitative boost to FoxP3, but instead enhanced its transcriptional activity. The nuclear/cytoplasmic distribution of FOXP3 was unchanged, being almost exclusively nuclear whether transduced alone or together with a quintet factor (Fig. 4d).
These effects also suggested that FoxP3 interacts molecularly with the quintet factors within nuclear complexes. Such interactions have already been demonstrated for Irf4 and Eos 23, 24, so we tested the other three. Indeed, reciprocal co-immunoprecipitation in transduced cells showed an interaction between FoxP3 and GATA1, SATB1 and LEF1, but not with the control TF Pbx1 (Supplementary Fig.8).
The synergizing activity of the cofactors, most dramatically observed with quintet factors, and not explained by quantitative effects on FoxP3 or its global cellular localization, could have two interpretations: first, through cooperative binding, that the cofactors recruit FoxP3 to genomic locations close to Treg signature genes; second, that the cofactors enhance the activity of FoxP3 molecules already bound to DNA. To distinguish between these scenarios, we used chromatin immunoprecipitation followed by high-throughput sequencing (ChIP-seq) to assess how quintet factors affect the genome-wide localization of FoxP3. Chromatin was prepared from primary CD4+ Tconv cells transfected with FLAG-FoxP3 alone or together with GATA1 (the preparation of double-transduced cells in the numbers needed for ChIP-seq was technically very demanding, so we chose GATA1 as a representative), immunoprecipitated with anti-FLAG, and the bound DNA determined by Illumina deep sequencing (see Supplementary Table 5 for ChIP-seq statistics). Immunoprecipitation with anti-PolII, or whole cell extract, provided genome-wide controls for transcriptional start sites (TSS) or for sequencing non-homogeneity, respectively. Overall, summing the genome-wide signals relative to TSS locations showed that FoxP3 predominantly localized in the vicinity of known TSS, as expected (Fig. 5a; in other experiments, ChIP-seq with irrelevant control antibody showed a paucity of signal around the TSS 40, substantiating the significance of signals observed here). The data allowed statistically robust detection of more than 5,000 FoxP3-binding sites (MACS p<10-7; Supplementary Table 6). Many of these sites were corroborated by comparison with similar data from ex vivo Tregs, kindly provided by R. Samstein and A. Rudensky). To further validate these data we computed, across the range of genes showing significant peaks of FoxP3 binding, the distribution of genes whose expression affected by transduction of FoxP3 and cofactor. As might be expected, the genes with the highest FoxP3 binding were enriched for those activated by FoxP3 in the microarray data (Fig. 5b; of the 57 genes with FoxP3 binding peak height >75, 12.2% had a FoldChange after transduction >1.6, vs 4.7% in the whole dataset, p=0.008). This was not an absolute, however, and many sites of strong FoxP3 binding did not correspond to significant transcriptional change in expression, as often observed in ChIP-seq data. In addition, transcripts repressed by FoxP3 were not over-represented among those with highest FoxP3 binding.
Figure 5. Genome-wide analysis of FoxP3.
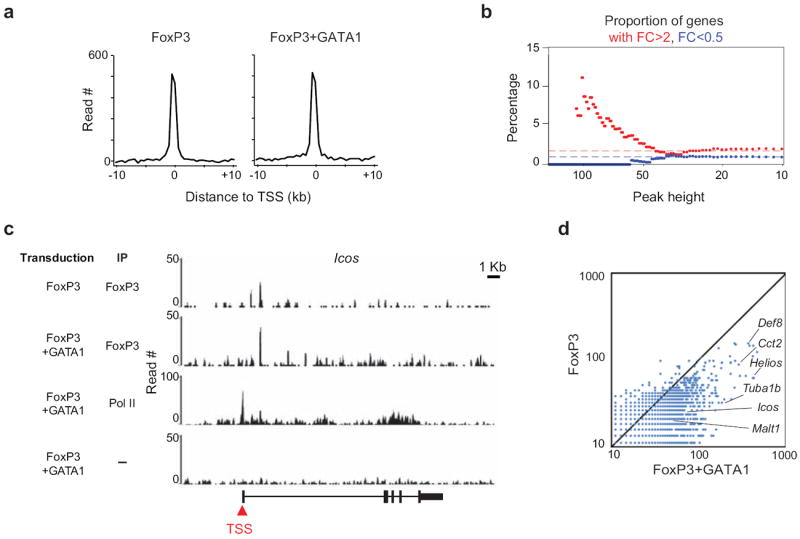
Mapping of FoxP3 by ChIP-seq, comparing genome-wide distribution in CD4+ Tconv cells transduced with Flag-FoxP3, with or without GATA1. (a) Cumulative distribution of FoxP3 protein (in 25 bp bins) in a 10 kb window relative to the TSS of the closest genes. (b) Relationship between FoxP3 binding (peak height = max sequence tag pileup within 10kb of a gene) versus regulation by FoxP3 (the proportion of genes with transduction FoldChange >2 or <0.5 in FoxP3+GATA1 versus empty vector control for all genes with peak height >=x). (c) Binding of FoxP3 over the Icos genomic locus. (d) Comparison read number for significant peaks (MACS p-value <10-7). Representative FoxP3-bound genes are highlighted.
In cells doubly-transduced with FoxP3+GATA1, we did not observe novel sites of significant FoxP3 binding. Rather, there was a quantitatively enhanced occupancy by FoxP3 at the same locations, as illustrated for the FoxP3-binding site in the first intron of Icos (Fig. 5c), or when genome-wide binding was quantitated in parallel (Fig. 5d). Thus, the quintet factors do not spread the recruitment of FoxP3 to different genomic locations, but seem to functionally stabilize, and enhance the activity of, FoxP3 independently bound to its target sites.
Signature lock by feedback loops: computational modeling
The results depicted in Fig. 3d were puzzling: how could five distinct TFs, of widely different structure, DNA sequence specificity, and functional activity, elicit the same transcriptional outcome? This was particularly paradoxical for Lef1 and Satb1, which are repressed in Treg cells 26 (Supplementary Fig. 7); Of note, however, is that the retroviral vectors used only contain the SATB1 or LEF1 coding regions, and lack the 3’- and 5’-UTR regions, which have been shown to be involved in the regulation of endogenous Satb1 expression 26; the transduced version lacks these controls, and likely leads to ‘constitutive’ expression of LEF1 and SATB1 during the culture period). A plausible interpretation was suggested by the effect on endogenous TF expression (Fig. 4a): the Treg signature, with the regulatory factors it includes, is organized with regulatory feedback loops, both positive and negative, such that it has the capacity to ‘auto-assemble’ and lock-in once the expression of FoxP3 and some cofactors is pushed beyond that of Tconv cells. Intuitively, such locking-in could be achieved by positive feedback, but also by double-negative inhibition of repressive factors.
To assess the plausibility of this intuition, we used computational simulation to ask whether such a self-reinforcing system that incorporated repressed regulators could actually function. A mathematical model was developed to simulate the dynamics of such a system (Fig. 6). The model consists of the main regulator F, with its active conformation F* (F to F* transition can mean either quantitative induction, post-translational modifications (e.g. acetylation) or complex formation, as suggested by co-IP assays, that potentiate or stabilize F), and a set of downstream regulatory factors of the Treg signature, either up- or down-regulated by F (Ui, Di; Fig. 6a) (see details in Supplementary Information). These signature genes themselves control smaller sub-networks, some of which are pure effectors (U4, D3), while others can regulate F* (e.g. U1-3, D1-2). Output of these subnetworks, which themselves can operate with AND or OR logic, then control a larger set of signature genes, but most importantly influence the F to F* conversion.
Figure 6. Mathematical modeling of a ‘self-locking’ network.
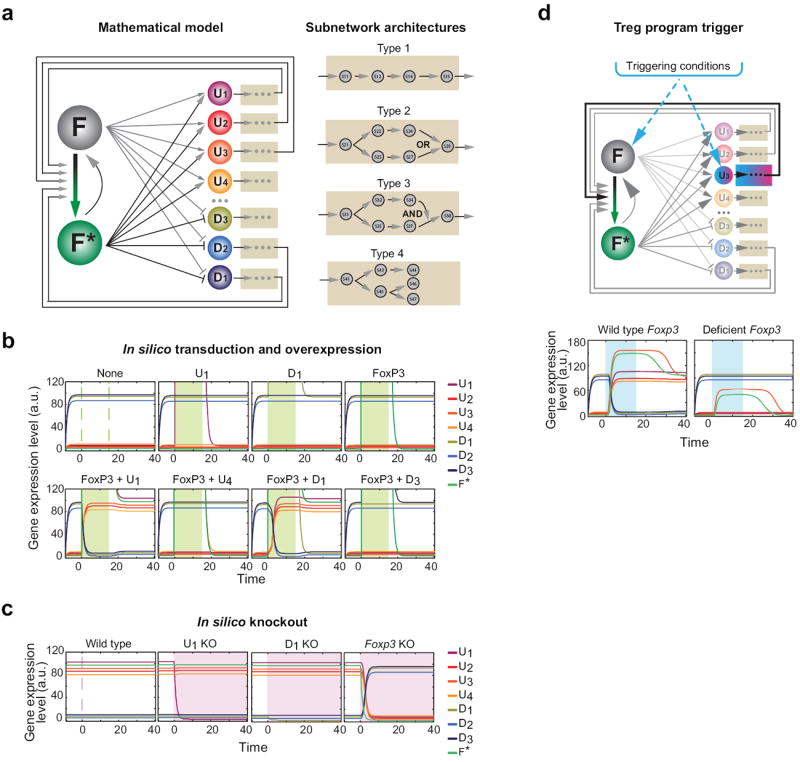
(a) Schematic of a mathematical model consisting of the main regulator FoxP3 (F), with its active conformation F* (where this transition can represent transcriptional or post-transcriptional activation) and a set of downstream regulatory factors of the Treg signature, either up- (Ui’s) and down-regulated (Di’s). Subsets of the signature genes (U1-3, D1-2) positively activate the F to F* transition, directly or through the subnetworks they control. (b) In silico simulation of transduction and overexpression experiments. Expression levels of the TFs (arbitrary units) shown as colored lines; green shading represent the time window of over-expression of the indicated factors. (c) Simulated knockout experiments. Pink-shading areas correspond to the time frames after elimination of the factors shown. (d) Activation of the Treg program. Blue shading represents the time window during which the inducing conditions are present.
To leave the model computationally manageable, subnetwork calculations were bypassed, and cross-regulatory influences between cofactors, which are likely to occur, were omitted. Differential equations paired up with Hill functions described the biochemical kinetics engaged in the model. After fixing a reasonable parameter set, this minimal model successfully reproduced the bistable features of the Treg program, and the outcome of the experimental perturbations (Figs. 2, 3). After in silico transduction (Fig. 6b), Treg signature genes remained off when FoxP3 or any of the cofactors were expressed singly, but all signature genes transitioned to the Treg state, and were locked in, when FoxP3 was overexpressed together with either of the cofactors, including those repressed in Tregs (e.g. D1). The model showed no effect of the single in silico knockout of any of the cofactors (Fig. 6c), consistent with experimental results, but the Treg signature shut off with extinction of FoxP3. The latter deviated somewhat from experimental results, as thymi of mice with an inactivated FoxP3 protein do contain cells with some Treg features, including partial activation of the Treg signature and a transcriptionally active Foxp3 locus 17, 18. The discrepancy could be resolved in the model by postulating that the differentiation of Treg cells triggers, directly or indirectly, the transient expression of FoxP3 and one of its cofactors (for instance, U3 in Fig. 6d, top). In the simulation, transient activation of F and U3 resulted in the activation of the whole network (Fig. 6d, bottom left), but only if the external inducing conditions were modeled to activate both F and U3. This activation was then stable upon removal of the inductive stimulus. With inactive FoxP3, however, cells showed only partial Treg features, which reverted to the Tconv state some time after withdrawal of differentiating stimulus (Fig. 6d, bottom right), a scenario consistent with the unstable “Treg wannabes” mentioned above.
Thus, the simulation arrived at a model of Treg cell differentiation compatible with most experimental outcomes and with several aspects of Treg physiology.
DISCUSSION
This work ended up in a different conceptual framework than where it originated. The intent was to use computational network inference to predict the panel of TFs that conspire with FoxP3 to determine the canonical Treg signature. We expected that experimental validation by loss- or gain-of-function experiments would define discrete gene modules affected by each of the cofactors, likely with some degree of synergy. Instead, we arrived at a very different perspective, one where the Treg signature involves a very high degree of positive and negative feedback, such that the signature ‘auto-assembles’ and reaches the same state in response to different triggers. Accordingly, the Treg signature proved impervious to removal of any one of the factors, with the exception of FoxP3.
Although with significantly more complex determinism, the control of the Treg signature behaves much like a classic genetic switch. A genetic switch describes stable and inheritable changes in the phenotypic state of a genetic system, which are conserved after termination of the initiating signal. First shown to explain the stable lysogenic state of bacteriophage lambda driven by the cI repressor 41, genetic switches based on reciprocal action of transcription factors have been demonstrated in diverse phenomena like long-term memory potentiation 42, cell transformation 43, or maintenance of pluripotency in ES cells 44. Positive feedback loops combined with suppression, either direct or indirect, are inherent to the operation of a switch, and to the bistable states achieved. Much as neural memory needs to persist over time, the self-reactivity of TCRs expressed by Treg cells makes it important for their suppressive phenotype to be stable over the course of an infection, and to avoid autoimmunity 9. For Treg cells, modifications of the methylation status at the Foxp3 locus also contribute to this stability 45. Genetic switches also ensure that a state outlives the conditions that set it: bacteriophage lambda lysogeny is self-perpetuating once established; for Treg cells, the TCR ligand and the cytokine milieu that led to their establishment need not be maintained. This remanence could be important for the thymic induction of Treg differentiation by self-antigens, which may not be encountered in the same processed form in the periphery, or for Treg cells induced by gut commensals, cells that should preferably persist even with fluctuating microbial flora.
Unlike the minimalist simplicity of the lambda switch, the Treg switch is a very complex one. First, several factors partake in a synergistic manner, and the quintet factors must activate several distinct pathways and loops. Second, two inputs are necessary for the establishment of the Treg state. Neither FoxP3 alone nor any of the cofactors are sufficient to lock in the Treg signature. There are distinct advantages to two-key control systems, which reduce the risk of long-term consequences resulting from erroneous activation, in this case from noisy gene expression such as the transient induction of FoxP3 upon activation of CD4+ effector cells. Signaling along TCR and IL-2R-Stat5 pathways that promote Treg commitment might achieve this duality (e.g. activating NF-κB and FoxP3, respectively). The scenario modeled by the computational simulation is consistent with the two-step process of Treg differentiation, which goes through a FoxP3−CD25hi intermediate that secondarily converts to FoxP3+ under the influence of IL-2 or other trophic cytokines 46, 47. In addition, the model probably accounts for the somewhat divergent results obtained by different groups upon FoxP3 transduction 11, 15, 16. While we only observed very limited effects, even after FoxP3 expression at levels comparable to ex vivo Tregs, others reported significantly more functional activity. Quite likely, the precise conditions of culture and of cell activation for retroviral transduction, for instance supplementation with IL-2, may have induced in some experimental settings one of the cofactors needed to synergize with FoxP3 and activate the switch.
Finally, there is multiple redundancy in the Treg switch, as exemplified by the actions of the quintet factors. This ability to flip the switch is not universal (Helios and Xbp1 do not have that potential), but five of the seven TFs tested here have it, and there is no reason to think that the list is closed. This redundancy ensures additional stability, as exemplified by the knockout data, but also allows several different physiological pathways to arrive at the same state. This may be relevant when considering the different thymic and extra-thymic contexts of Treg differentiation 4. Lymphopenic conditions, chronic antigen exposure, or molecules produced by gut microbes, may each induce one or the other of the cofactors able to lock-in the Treg transcriptional network.
Online Methods
Mice
C57BL/6 (B6) mice were purchased from the Jackson Laboratory. GATA1 promoter mutant mice on the Balb/c background 37 carrying a deletion within the double GATA-site 21 bp upstream of the first hematopoietic exon, were obtained from The Jackson Laboratory. Xbp1f/f × Mx1-Cre conditional knockout mice on the B6 background have been described 38; 5-6 weeks old mice were intraperitoneally injected 3 times with 250 μg of poly(I:C) (invivoGen) with 2 days intervals to induce Cre expression. Mice were used for experiments 6 weeks after the final poly(I:C) injection; Helios (Ikzf2) KO mice have been described 39; Eos (Ikzf4) knockout mice were generated by first inserting LoxP sites flanking exons 1 through 4, and then crossing with a germ-line Cre to generate constitutively deficient mice. Targeting of the genomic locus was validated by Southern blot analysis using 5’ and 3’ external probes, deletion of exon 1-4 was confirmed using quantitative RT-PCR. Homozygous Eos-deficient mice are viable and fertile with no apparent abnormality. All mice cared for in accordance with the ethical guidelines of the Center for Animal Resources and Comparative Medicine at Harvard Medical School under Institutional Animal Care and Use Committee (IACUC) approved procedures (protocol 02954).
CLR Network Regulatory Prediction
For this analysis we compiled 129 previously published gene expression datasets obtained from purified CD4+ T cell populations in several experimental contexts: ex vivo conventional T (Tconv) or regulatory T (Treg) cells from anatomical locations, cultured Treg cells, TGFβ-induced FoxP3+ cells, retinoic acid treated cultures 11, 12, 48. The Affymetrix M430v2 microarray raw data were preprocessed with the RMA algorithm in GenePattern 49, and averaged expression values were used for analysis.
For a robust definition of the transcriptional signature of mature Treg cells, results from several independent experiments had been brought together. The consensus peripheral Treg cell signature had been defined by calculating the Treg to Tconv fold change (FC) ratios and retaining only those genes that showed a consistent 1.5-fold overexpression or underexpression in Treg cells in all four datasets, using Affymetrix M430v2 arrays. This resulted in a total of 603 genes, 407 overexpressed and 196 underexpressed in Treg cells respectively 11.
For prediction of regulatory connections, we used the CLR (Context Likelihood of Relatedness) algorithm 35 that operates by combining the relative strength of coexpression between a regulator and potential targets. The CLR algorithm builds upon the relevance network strategies by applying a background correction step. First we reconstructed a relevance network between 2021 transcriptional regulators and 603 Treg signature genes 11. After computing mutual information (MI) values between all pairwise TF-Treg signature gene pairs, the algorithm compares the MI between a TF/gene pair to the background distribution of MI scores of all genes associated with the TF or all TFs associated with the gene of interest. After this background correction, the most probable interactions are those whose combined scores stand significantly above the background distribution of MI scores. The background corrected CLR scores were filtered at a false discovery rate (FDR) =0.005, which was computed with Bonferroni correction, to generate the Treg CLR network. CLR computations were performed in Matlab (MathWorks).
In the second phase, starting from the CLR scores we formulated an optimization problem whose objective was to identify the TFs that together influence the Treg signature the most and account for the most number of genes. This is a mixed integer optimization problem which we solved using the CPLEX9.0 optimization package (ILOG) for AMPL.
Retroviral transduction
For enforced expression of FOXP3 and other TFs, the retroviral expression vector MSCV-IRES-Thy1.1/GFP 11 was used throughout. The human FOXP3, GATA1, EOS, IRF4, LEF1, SATB1, XBP1 cDNAs were obtained from human ORFeome. Mouse Helios cDNA was kindly provided by Stephen Smale. Plat-E cells were plated one day before and transfected with these plasmids, together with a packaging construct pCL-Eco using Lipofectamine 2000 (Invitrogen), according to the manufacturer’s instructions.
For primary CD4+ T cell transduction, cell suspensions were prepared from spleens and lymph nodes of 6-8 week-old B6 mice by physical dissociation and red blood cells were lysed in 0.8% Ammonium Chloride lysis buffer. CD4+ T cells were negatively purified by magnetic selection (labeling with phycoerythrin-conjugated anti-CD11b (M1/70), -CD11c (N418), -CD19 (6D5), -CD8α (53-6.7), -CD25 (PC61), and -NK1.1 (PK136). After washing, anti-PE beads (Miltenyi Biotec, #130-048-801) were added to the cell suspension and subsequently, and CD4+ Tconv cells were purified using MACS LD columns (Miltenyi) to purity > 95%. Cells were then activated with anti-CD3/CD28 beads (Invitrogen) at a ratio of one bead per cell, with addition of 20 U/ml of recombinant human IL-2 (Proleukin; Chiron) in complete culture medium (RPMI 1640 supplemented with 10% fetal calf serum, 2 mM L-Glutamine, 100 U/ml penicillin/streptomycin and 50 μM 2-Mercaptoethanol). T cells were cultured for 24 hours and then were spin-infected (2000 rpm, 32°C, 2 hours) with retrovirus supernatants. Cells were then cultured for an additional 72 hours. Infected cells were sorted by flow cytometry, as CD4+ cells further gated on Thy1.1 and GFP that denote expression of FOXP3 and of the other cofactors, respectively. For the experiments shown in Fig. 4b,c, infected T cells were sorted into different fractions based on the intensities of Thy1.1 expression (high, intermediate and low, respectively) for microarray profiling and FOXP3 protein analysis.
To verify and quantitate FOXP3 expression in these transfectants, sorted cells were fixed and permeabilized for intracellular staining with anti-FoxP3 (eBioscience) according to manufacturer’s instructions, and were either analyzed by flow cytometry for quantitative FOXP3 protein expression, or by confocal microscopy for FOXP3 protein localization.
Gene expression profiling
For analysis of gene expression in knockout mice or after retroviral transduction, sorted cell populations were lysed in TRIzol reagent, and RNA was prepared according to the manufacturer‘s instructions (Invitrogen). RNA amplification was conducted for two rounds using the MessageAmp aRNA kit (Ambion), followed by biotin labeling using the BioArray high yield RNA transcription labeling kit (Enzo Life Sciences, Inc.), and purified using the RNeasy mini kit (QIAGEN). The resulting cRNAs were hybridized to Mouse Gene 1.0 ST arrays (Affymetrix). These steps followed the ImmGen pipeline and were performed at Expression Analysis, Inc (Durham, NC). Data were normalized with the RMA algorithm implemented in Affymetrix Power Tools after first pre-filtering to remove unannotated probes and visualized on GenePattern Multiplot module.
We developed a Treg signature index to estimate the global expression of Treg signature genes in the transfectants (Fig. 3f). First, we calculated the fraction of signature genes up-regulated under various conditions (F); then we calculated the median value of the fold-change relative to control transfectant for all Up signature genes (M), and the Treg Up signature index was established as be IUp=F*M*2. As expected, the IUp equals 1 in controls. Similar calculation was done for Treg Down signature genes, and a composite Treg signature index was calculated as I=[IUp+IDown]/2.
To distinguish the expression of transduced TFs from that of their endogenous counterparts, we used feature-level analysis of the 1.0 ST microarray data. The Affymetrix Mouse Gene 1.0 ST Array offers whole-transcript coverage, as each of the 28,853 genes is represented on the array by approximately 27 oligonucleotides (“features”) spread across the full length of the gene. This characteristic allowed us to distinguish the expression of mouse endogenous TFs from the transgene TFs, which mostly were human origin. First, nucleotide sequences of all the features (25-mer oligonucleotides) for one particular gene (e.g. Foxp3) were retrieved and the sequence similarities between mouse and human were analyzed using NCBI Blast tools. Features with strong dissimilarity (more than 5 mismatches among 25 nucleotides) between mouse and human were considered as mouse-specific probes, and their expression values averaged and normalized to arrive at the values shown in Fig. 4a and Supplementary Table 4.
Immunoprecipitation (IP) and Immunoblotting (IB)
293 cells double-transfected with vectors for Flag-FoxP3 plus any of the following TFs: SATB1, LEF1, GATA1 or Pbx1, lysed on ice with hypotonic solution (10 mm HEPES, 1.5 mM MgCl2, 10 mM KCl, and 0.05% NP-40 like/IgePal Ca-630) supplemented with EDTA-free complete protease inhibitors (Roche). Nuclear pellets were subsequently treated with nuclear lysis buffer (20 mM HEPES, 300 mM NaCl, 20 mM KCl, EDTA-free complete protease inhibitor cocktail) and MNase (Nuclease S7; Roche). Chromatin digestion was stopped by adding EDTA to 5 mM, and post-nuclear supernatants were incubated with Protein-G Sepharose beads coupled to antibodies for IP (Flag, M2, Sigma; FoxP3, FJK-16s, eBioscience; GATA1, Ab28839, Abcam; LEF1, Ab124271, Abcam; SATB1, 611182, BD; Control IgG) overnight at 4°C with constant rotation. Bound proteins were eluted by boiling, separated by SDS-PAGE, and electro-transferred to PVDF. After blocking (2 hr in 5% milk/1x PBS 0.02% Tween20), blots were probed 1 hour at room temperature with antibodies for IB.
Chromatin immunoprecipitation and sequencing
Mouse primary CD4+ T cells, transduced and sorted as above, were used in this assay. Chromatin immunoprecipitation (ChIP) was done as described 50. Briefly, ~107 cells were cross-linked with formaldehyde (11%). Cell lysates were sonicated (8 cycles of 30” at 60” intervals, on ice; Misonix), incubated with 10 μg antibodies (anti-Pol-II (total) (sc-899, Santa Cruz); anti-FLAG-FoxP3 (M2, Sigma); anti-GATA1 (ab28839, Abcam), which were pre-bound with protein G-conjugated Dynal beads (Invitrogen). Immunoprecipitated DNA was purified and used for library construction using ChIP-Seq DNA Sample Prep Kit for Illumina sequencing 50. Sequences were aligned to the genome using Bowtie software (ver. 0.12.7) to NCBI Build 36 (UCSC mm9) of the mouse genome. Peaks of binding were called with MACS software (1.4.0rc2). The number of reads in each tag pileup were first normalized relative to the total number of reads in the sample. To accurately compare the local tag densities in peak regions of the different samples (particularly for FoxP3 binding in the samples transduced with either FoxP3, or FoxP3+GATA1), values were rescaled by a constant, which was calculated from the integrated values of the noise in regions devoid of any FoxP3-binding peaks (7 regions ranging from 60 to 650 Kb). This correction stemmed from the assumption that the experimental noise should be constant even when true signal (and hence the total number of reads) might be expected to vary between parallel samples, and that a normalization factor calculated from the genome background level allows appropriate compensation for variability in amplification during the construction of sequencing libraries.
Mathematical Modeling
Based on the experimental findings, we developed a mathematical model to describe the kinetic and dynamic behaviors of the regulation networks governing Treg cells, and to test which modes of regulatory connectivity might account for the peculiar behavior of this network.
The Treg signatures defined in this manuscript consist of the expression profiles of 603 genes that are differentially expressed: Treg relative to Tconv. Among them, 407 genes are up-regulated and the rest 196 genes are down-regulated. Regardless of the diversity of underlying regulatory architectures, the essential features of the FoxP3-regulated T cell network can be mimicked by a simple model as illustrated in Figure 6a in the main text. This model consists of two master species F and F*, representing the native FoxP3 and its modified functional form#1 (See the text box for definition), and a set of downstream genes Ui’s and Di’s. These genes mimic correspondingly the up- and down-regulated signature genes#2 in Treg cell’s regulation program. They are further arranged in parallel based on our experimental evidence that Treg signature is robust to the full elimination of any one of signature factors. In this model, FoxP3 can transit from its native (F) to functional (F*) state with the mediation from its cofactors#3. Conversely, the functional form promotes the production of its native. Although both forms of FoxP3 regulate signature genes, the modified one has a much stronger regulation effect than the native form. In addition, among all of the signature genes, some subsets are straight downstream genes with no feedbacks (pure effectors#4, such as U4 and D3), while others are capable of regulating the transition of FoxP3 from its native form to modified form (cofactors#3, such as U1 and D1).
To simplify our model while still capturing the major picture, we omitted many intermediate details of the Treg program. In a real Treg cell, the regulation network is likely much more complicated than the diagram we drew here. For instance, the regulation of FoxP3 onto the signature genes can be indirect and implemented through intermediate subnetworks and other signature genes. Similarly, the cofactors likely regulate the transition of FoxP3 via intermediate species. Nevertheless, this simplified model remains the key features of the regulation program, enabling us to investigating its core function and kinetic and dynamic behaviors for a mechanistic understanding of the system.
1. Biochemical reactions in Treg’s regulatory program
Biomolecular events engaged in the regulation of Treg consist mainly of two classes of reactions: (1) Bindings and dissociations of Promoter-FoxP3-cofactor complex; (2) Productions and degradations of reactant molecules, including FoxP3 and signature genes. Molecular species participating in the program include FoxP3, signature genes (proteins), promoter, FoxP3-protein complex, promoter-FoxP3 complex, and promoter-FoxP3-protein complex, as listed in Supporting Table M1. Detailed biochemical reactions are listed in Supporting Table M2.
Supporting Table M1.
Molecular species engaged in Treg’s regulation program.
| Symbol | Explanation |
|---|---|
| F | FoxP3 |
| O | Promoter |
| Xi | Protein of the signature gene Xi |
| FXiθi | FoxP3-protein (Xi) complex |
| OFu | Promoter-FoxP3 complex |
| O(FXiθi)u | Promoter-FoxP3-protein (Xi) complex |
Supporting Table M2.
Biochemical reactions involved in Treg’s regulation
| Reaction | Disso. const. | Explanation |
|---|---|---|
| [F] + θ[Xi] ⇄ [FXiθi] | Wi | FoxP3 reversibly binds to signature species to form a complex |
| [O] + u[F] ⇄ [OFu] | M1 | Promoter and FoxP3 reversibly form a complex |
| [OFu] + uθi[Xi] ⇄ [O(FXiθi)u] | Wi | Promoter-FoxP3 complex and protein Xi reversibly form a complex |
| [O] + u[FXiθi] ⇄ [O(FXiθi)u] | Mi+1 | Promoter and FoxP3-protein complex reversibly form a complex |
| Reaction | Rate const. | Explanation |
| [O] → [O] + [F] | αfC0f | Naked promoter produces FoxP3 |
| [OFu] → [OFu] + [F] | αfC1f | Promoter bounded with FoxP3 produces FoxP3 |
| [O(FXiθi)u] → [O(FXiθi)u] + [F] | αfCif | Promoter bounded with FoxP3-protein Xi complex produces FoxP3. |
| 0̷ → [F] | αf0 | basal-level production of FoxP3 |
| [F] → 0̷ | γf | FoxP3 degradation |
| [O] → [O] + [Xj] | αxjC0j | Naked promoter produces [Xj] |
| [OFu] → [OFu] + [Xj] | αxjC1j | Promoter bounded with FoxP3 produces protein [Xj] |
| [O(FXiθi)u] → [O(FXiθi)u] + [Xj] | αxjCij | Promoter bounded with FoxP3-protein Xi complex produces protein [Xj] |
| 0̷ → [Xj] | αxj0 | basal-level production of protein [Xj] |
| [Xj] → 0̷ | γxj | Protein [Xj] degradation |
It is important to point that only cofactors, not pure effectors, are able to interact with FoxP3 to form functional forms (F*) and consequently promote the expression of downstream genes. Although we generalized the reactions for all signature genes in the Supporting Table M2 without distinguishing differences between cofactors and effectors, it can be simply addressed by choosing appropriate rate constants. For instance, if a signature gene (Xi) is a pure effector, we can assign an infinity (practically, a very large number) to the corresponding dissociation constant Wi to implement this situation where the formation of FoxP3-protein complex is prohibited.
2. Mathematical model
With the network diagram shown in Fig. 6a and the corresponding reactions listed above, we can derive our mathematical model, using the fast reaction arguments for the binding and dissociation of operators with corresponding transcription factors, as follows
| (1) |
where Uj and Dj are the concentrations of representative up- and down-regulated signature genes, and Ft is total concentration of the native FoxP3 (F) and its modified complex (F*). X is a vector referring to the total signature genes, i.e., X = (U1, U2, …, Un1, D1, D2, …, Dn2) where n1 and n2 are the numbers of up- and down-regulated genes respectively. αs0, αs and γs (s = uj, dj, f) are the rate constants for the basal production, regulated production, and degradation of the gene s. The function Hs (Ft, X) (s = uj, dj, f) is the hybrid production rate of the gene s that is co-regulated by Ft and X as
where n is the total number of signature genes (up- and down-regulated genes), i.e., n = n1 + n2.
For the simplest case where there is only one up-regulated and one down-regulated genes, the above model can be simplified as:
with the corresponding hybrid protein production function as
where C0,s, C1,s, C2,s, C3,s are the folds of change for the expression of species s (s=u, d, f) upon activation when promoters are bound by nothing, original FoxP3, FoxP3-U complex, and FoxP3-D complex respectively.
3. In silico overexpression and knockout experiments
Although the above mathematical model is capable of describing the complete signatures (603 genes) of the Treg program, we here, for simplicity, use a seven-species network as a representative of the whole network to explore the program’s network feature through in silico experiments. In this simplified circuit, four of the signature genes are up-regulated (U1, U2, U3, U4) and the other three are down-regulated (D1, D2, D3), as indicated in Fig. 6a. Among the seven species, five of them (U1, U2, U3, D1 and D2) are cofactors that facilitate the transition of FoxP3 from its native to functional forms while the other two (U4, D3) are pure effectors with no regulatory input.
To begin with, we chose a set of parameters from commonly used and biologically reasonable parameter space for this model (See Supporting Table M3 for details). The parameters include the rate constants of the basal production, activated production, and degradation for the four up-regulated genes (αu0,i, αu,i, γu,i, where i=1-4 corresponds to the gene U1, U2, U3, and U4), the three down-regulated genes (αd0,i, αd,i, γd,i, where i=1-3 corresponds to the gene D1, D2, D3), and total FoxP3 (αf0, αf, γf). The parameter set also contains C0-8,i, the folds of change for the expression of species i (i=1-8, corresponding to U1, U2, U3, U4, D1, D2, D3, Ft), when promoters are bound respectively by nothing, original FoxP3, FoxP3-U1, FoxP3-U2, FoxP3-U3, FoxP3-U4, FoxP3-D1, FoxP3-D2, and FoxP3-D3. Here C5,1-8 and C8,1-8 are set all zeros because the 5th and 8th genes (U4 and D3) are pure effectors and do not regulate the expression of any gene. Additionally, the model contains M1−8, the dissociation constants of FoxP3-protein complexes ([O-F, O-FU1, O-FU2, O-FU3, O-FU4, O-FD1, O-FD2, O-FD3]), and W1−7, the dissociation constants of FoxP3- signature proteins complex (F-U1, F-U2, F-U3, F-U4, F-D1, F-D2, F-D3). Here W4 and W7 are set as 1020 to match the facts that both U4 and D3 are pure effectors and do not regulate the transition of FoxP3.
Supporting Table M3.
Rate constants used in in silico experiments.
| Rate | Parameters |
|---|---|
| αu0,1–4 | [6, 4, 2, 7.5] |
| αu,1–4 | [0.10, 0.085, 0.092, 0.075] |
| γu,1–4 | [1.0, 1.0, 1.0, 1.0] |
| αd0,1–3 | [2.5, 0.0, 5] |
| αd,1–3 | [0.9, 0.85, 0.9] |
| γd,1–3 | [1.0, 1.0, 1.0] |
| αf0 | 0.0 |
| αf | 0.1 |
| γf | 1.0 |
| C0, 1–8 | [1e0, 1e0, 1e0, 1e0, 1e2, 1e2, 1e2, 1e0] |
| C1, 1–8 | [1e0, 1e0, 1e0, 1e0, 1e2, 1e2, 1e2, 1e0] |
| C2, 1–8 | [1e3, 1e3, 1e3, 1e3, 1e-3, 1e-3, 1e-3, 1e3] |
| C3, 1–8 | [1e3, 1e3, 1e3, 1e3, 1e-3, 1e-3, 1e-3, 1e3] |
| C4, 1–8 | [1e3, 1e3, 1e3, 1e3, 1e-3, 1e-3, 1e-3, 1e3] |
| C5, 1–8 | [0, 0, 0, 0, 0, 0, 0, 0] |
| C6, 1–8 | [1e3, 1e3, 1e3, 1e3, 1e-3, 1e-3, 1e-3, 1e3] |
| C7, 1–8 | [1e3, 1e3, 1e3, 1e3, 1e-3, 1e-3, 1e-3, 1e3] |
| C8, 1–8 | [0, 0, 0, 0, 0, 0, 0, 0] |
| M1–8 | [1e2, 1e2, 1e2, 1e2, 1e5, 1e5, 1e5, 1e5] |
| W1–7 | [1e3, 1e3, 1e3, 1e20, 1e5, 1e5, 1e20] |
| u | 2.0 |
| θ1–7 | [2.0, 2.0, 2.0, 2.0, 2.0, 2.0, 2.0] |
With the above parameter set, our model successfully mimics the bistability feature of T cell’s regulatory program: All up-regulated genes remain in their low expressions while those down-regulated remains high when the program starts with the conventional state (Tconv) (first panel, top row of Fig. 6b); However, when the program is in the regulatory state (Treg) (first panel, Fig. 6c), the whole expression profiles are opposite and remain opposite. Both two states are stable with the same parameter set and their final state is primarily determined by their initial conditions.
3.1 Overexpression experiments
To perform the numerical overexpression experiments, we first simulated the system for a certain amount of time to let it achieve a steady state. This was followed by an instantaneous increase of the protein level of the overexpressed factor up to 1000 relative to baseline, which was held for 15 time units before it was reset to relax (no enforced expression). All other variables were free to evolve throughout the whole simulation. All of the variables eventually achieved their steady states by the end of the simulation period (main text, Fig. 6b).
3.2 Knockout experiments
We then conducted in silico knockout experiments. We again started with the simulation of the wild type system for a certain time to allow it to achieve its steady state. We then instantly removed the knockout target gene by resetting its production rate to zero. All other variables remain unchanged and were free to evolve throughout the experiment. The system relaxed to a steady state eventually after a transient change (main text, Fig. 6c).
4. Activation of the Treg regulatory program
The above overexpression and knockout experiments successfully illustrated the robustness of Treg’s regulation network, and all of our computational results are consistent with the wet lab data from both this and previous studies except the last panel in Fig. 6c: In our numerical experiment, knocking out FoxP3 fully shut off the Treg program while previous studies showed that a small population of T cells still developed partial signatures of Treg cells in transgenic FoxP3 mutant mice that expressed an inactive FoxP3 protein 17,18. This intriguing discrepancy could be resolved by postulating an upstream “triggering factor” that promotes the expression of FoxP3 as well as other intermediate sub-networks of the Treg program (note that “triggering factor” may be a single factor or a combination of factors activated in concert).
We here numerically investigated the Treg differentiation process (left panel of Fig. 6d) by simulating the induction of FoxP3 together with a cofactor (here U3) by the external “triggering factor” (how the external “triggering factor” is actually induced, or whether it corresponds to a single factor or a coordinated combination thereof are not relevant here). We revised our mathematical model (Eq. 1) to incorporate the reactions as follows
where I1 and I2 are two intermediate species and X is the external upstream factor (X is different from the signature gene vector X). The last two equations in our original 7-species model are now revised to include the production induction from the intermediate species. To simulate the process, we chose the following common parameters for the Hill function: αI1 0 = 0.0, αI1 = 0.3, γI1 = 0.3, θx1 = 2, Wx1 = 10.0, αI20 = 0.0, αI2 = 0.25, γI2 = 0.25, θx2 = 2, Wx2 = 10.0, αxu3 = 60.0, θI1 = 2, WI1 = 10.0, αxf = 50.0, θI2 = 2, and WI2 = 100.0.
To mimic the induction process, we started by simulating FoxP3-negative wild type cells for a sufficient time so that it achieved a steady state. This was followed by a step-like increase of the external triggering factor(s), which lasts for 15 time units before removal. The result (the middle panel of Fig. 6d) shows that the transient induction from the upstream factor turned on the whole program (FoxP3 and seven signature genes) and the whole expression profiles remained stable even after the removal of external triggering factor(s).
We also conducted a numerical assay for the case where FoxP3 is expressed but is functionally inactive (as in the inactivating knock-in insertions from the Rudensky and Chatila laboratories). Depicted in the right panel of Fig. 6d, a subset of the signature genes (U3 and FoxP3) showed expression profiles similar to those of Treg cells in a transient time window after the induction. Although these genes eventually returned to the conventional state, the transient period showed partial features of a Treg cell.
5. Parameter exploration
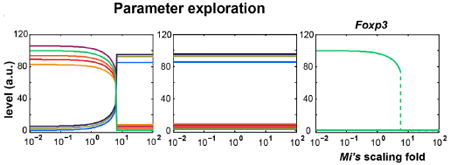
In addition to reproducing the experimental findings, we can further use our model to uncover the system’s behaviors that are not explored in our wet-lab experiments. One particularly interesting feature of this system is the bifurcation of the dynamics. A similar question is when the bistability of the program will disappear. To address that, we evaluated the system’s behavior by proportionally scaling all of the dissociation constants (M1, M2, …, M8) and simulating the system for each scaled constant set using two different initial conditions [102, 86, 91, 80, 5.8, 3.1, 8.3, 96] and [6, 4, 2, 7.5, 90, 85, 90, 5] (for the variables [U1, U2, U3, U4, D1, D2, D3, Ft]). These two initial conditions are chosen from the two distinct final steady states obtained in Fig. 6c and Fig. 6b. The figure below shows the final steady state of the system respecting to the scaling factor: The left panel corresponds to the first initial condition above, the middle panel is from the second initial condition, and the right panel is the overlap of FoxP3 in the left and middle panels. The results show that the system has two stable states, corresponding to the conventional and regulatory states, when varying the scaling factor from 10−2 to 100.65. In other words, the systems settle in different final states when starting with different initial conditions. However, the system always arrives at the same set of final solutions regardless of its initial condition when the scaling factor is greater than 100.65, indicating that the system becomes monostable (conventional state). It seems intriguing but makes biological sense: The dissociation constants indicate how easily FoxP3 and its modified forms escape from the promoters of signature genes, which anti-correlates with the production rates of downstream genes. Thereby, higher dissociation constants result in lower expression levels of signature genes including those serving as cofactors, which subsequently lowers the transition rate for FoxP3 from its native to functional forms and hence decreases the productions of all signature genes. Once the constants go below a threshold, the Treg state becomes unstable and the system is incapable of sustaining in it in regardless of its initial state and, as a consequence, the system always settles in the monostable conventional state.
Statistical analysis
Statistical significance was determined with Kolmogorov-Smirnov test.
Supplementary Material
Acknowledgments
We thank M. Calderwood and the Center for Cancer Systems Biology for expression cDNAs; P. Rahl for advice on ChIP-seq; J. Ericson, S. Davis, H. Paik and R. Cruse for genomic data analysis, H. Chen and Q. Cai for experimental support; J, LaVecchio and G. Buruzala for sorting. This work benefitted from public data generated by the ImmGen consortium. This work was supported by NIH grants AI051530 (to C.B. and D.M.), AI072073 (to C.B., D.M. and J.C.). W.F. was supported by a Takeda Pharmaceuticals Award from the American Diabetes Association (7-07-BETA-14); J.H. by a post-doctoral fellowship from the Canadian Institutes of Health Research.
Footnotes
AUTHOR CONTRIBUTIONS
WF, AE, TL, MF, JH, SA, JC, DM and CB designed experiments; WF, JH, SH, MF and RG performed experiments; AE and TL performed computation; LG, SC, PK and DR provided mice and advice. WF, AE, TL, JH, RG, MF, JC, DM and CB analyzed data and wrote manuscript.
COMPETING FINANCIAL INTERESTS
The authors declare no competing financial interests.
Terminology: modified functional form refers to functionally active form of FoxP3, FoxP3-cofactor complex;
signature genes are the genes the expressions of which are significantly different when a cell is at the Treg state compared with at the Tconv state;
cofactors are a subset of signature genes that involve in regulating the transition of FoxP3 from its native to functional form;
pure effectors are a subset of signature genes that serve solely as readouts and do not participate in the regulation of FoxP3’s transition from its native to function form.
References
- 1.Sakaguchi S, Yamaguchi T, Nomura T, Ono M. Regulatory T cells and immune tolerance. Cell. 2008;133:775–787. doi: 10.1016/j.cell.2008.05.009. [DOI] [PubMed] [Google Scholar]
- 2.Feuerer M, et al. Lean, but not obese, fat is enriched for a unique population of regulatory T cells that affect metabolic parameters. Nat Med. 2009;15:930–939. doi: 10.1038/nm.2002. [DOI] [PMC free article] [PubMed] [Google Scholar]
- 3.Josefowicz SZ, Lu LF, Rudensky AY. Regulatory T Cells: Mechanisms of Differentiation and Function. Annu Rev Immunol. 2012 doi: 10.1146/annurev.immunol.25.022106.141623. [DOI] [PMC free article] [PubMed] [Google Scholar]
- 4.Curotto de Lafaille MA, Lafaille JJ. Natural and adaptive foxp3+ regulatory T cells: more of the same or a division of labor? Immunity. 2009;30:626–635. doi: 10.1016/j.immuni.2009.05.002. [DOI] [PubMed] [Google Scholar]
- 5.Duarte JH, et al. Natural Treg cells spontaneously differentiate into pathogenic helper cells in lymphopenic conditions. Eur J Immunol. 2009;39:948–955. doi: 10.1002/eji.200839196. [DOI] [PubMed] [Google Scholar]
- 6.Tsuji M, et al. Preferential generation of follicular B helper T cells from Foxp3+ T cells in gut Peyer’s patches. Science. 2009;323:1488–1492. doi: 10.1126/science.1169152. [DOI] [PubMed] [Google Scholar]
- 7.Murai M, et al. Interleukin 10 acts on regulatory T cells to maintain expression of the transcription factor Foxp3 and suppressive function in mice with colitis. Nat Immunol. 2009;10:1178–1184. doi: 10.1038/ni.1791. [DOI] [PMC free article] [PubMed] [Google Scholar]
- 8.Zhou X, et al. Instability of the transcription factor Foxp3 leads to the generation of pathogenic memory T cells in vivo. Nat Immunol. 2009;10:1000–1007. doi: 10.1038/ni.1774. [DOI] [PMC free article] [PubMed] [Google Scholar]
- 9.Rubtsov YP, et al. Stability of the regulatory T cell lineage in vivo. Science. 2010;329:1667–1671. doi: 10.1126/science.1191996. [DOI] [PMC free article] [PubMed] [Google Scholar]
- 10.Komatsu N, et al. Heterogeneity of natural Foxp3+ T cells: a committed regulatory T-cell lineage and an uncommitted minor population retaining plasticity. Proc Natl Acad Sci U S A. 2009;106:1903–1908. doi: 10.1073/pnas.0811556106. [DOI] [PMC free article] [PubMed] [Google Scholar]
- 11.Hill JA, et al. Foxp3 transcription-factor-dependent and -independent regulation of the regulatory T cell transcriptional signature. Immunity. 2007;27:786–800. doi: 10.1016/j.immuni.2007.09.010. [DOI] [PubMed] [Google Scholar]
- 12.Feuerer M, Hill JA, Mathis D, Benoist C. Foxp3+ regulatory T cells: differentiation, specification, subphenotypes. Nat Immunol. 2009;10:689–695. doi: 10.1038/ni.1760. [DOI] [PubMed] [Google Scholar]
- 13.Vignali DA, Collison LW, Workman CJ. How regulatory T cells work. Nat Rev Immunol. 2008;8:523–532. doi: 10.1038/nri2343. [DOI] [PMC free article] [PubMed] [Google Scholar]
- 14.Ziegler SF. FOXP3: of mice and men. Annu Rev Immunol. 2006;24:209–226. doi: 10.1146/annurev.immunol.24.021605.090547. [DOI] [PubMed] [Google Scholar]
- 15.Hori S, Nomura T, Sakaguchi S. Control of regulatory T cell development by the transcription factor Foxp3. Science. 2003;299:1057–1061. doi: 10.1126/science.1079490. [DOI] [PubMed] [Google Scholar]
- 16.Fontenot JD, et al. Regulatory T cell lineage specification by the forkhead transcription factor foxp3. Immunity. 2005;22:329–341. doi: 10.1016/j.immuni.2005.01.016. [DOI] [PubMed] [Google Scholar]
- 17.Gavin MA, et al. Foxp3-dependent programme of regulatory T-cell differentiation. Nature. 2007;445:771–775. doi: 10.1038/nature05543. [DOI] [PubMed] [Google Scholar]
- 18.Lin W, et al. Regulatory T cell development in the absence of functional Foxp3. Nat Immunol. 2007;8:359–368. doi: 10.1038/ni1445. [DOI] [PubMed] [Google Scholar]
- 19.Otsubo K, et al. Identification of FOXP3-negative regulatory T-like (CD4(+)CD25(+)CD127(low)) cells in patients with immune dysregulation, polyendocrinopathy, enteropathy, X-linked syndrome. Clin Immunol. 2011;141:111–120. doi: 10.1016/j.clim.2011.06.006. [DOI] [PubMed] [Google Scholar]
- 20.Sugimoto N, et al. Foxp3-dependent and -independent molecules specific for CD25+CD4+ natural regulatory T cells revealed by DNA microarray analysis. Int Immunol. 2006;18:1197–1209. doi: 10.1093/intimm/dxl060. [DOI] [PubMed] [Google Scholar]
- 21.Ono M, et al. Foxp3 controls regulatory T-cell function by interacting with AML1/Runx1. Nature. 2007;446:685–689. doi: 10.1038/nature05673. [DOI] [PubMed] [Google Scholar]
- 22.Wu Y, et al. FOXP3 controls regulatory T cell function through cooperation with NFAT. Cell. 2006;126:375–387. doi: 10.1016/j.cell.2006.05.042. [DOI] [PubMed] [Google Scholar]
- 23.Pan F, et al. Eos mediates Foxp3-dependent gene silencing in CD4+ regulatory T cells. Science. 2009;325:1142–1146. doi: 10.1126/science.1176077. [DOI] [PMC free article] [PubMed] [Google Scholar]
- 24.Zheng Y, et al. Regulatory T-cell suppressor program co-opts transcription factor IRF4 to control T(H)2 responses. Nature. 2009;458:351–356. doi: 10.1038/nature07674. [DOI] [PMC free article] [PubMed] [Google Scholar]
- 25.Zhou L, et al. TGF-beta-induced Foxp3 inhibits T(H)17 cell differentiation by antagonizing RORgammat function. Nature. 2008;453:236–240. doi: 10.1038/nature06878. [DOI] [PMC free article] [PubMed] [Google Scholar]
- 26.Beyer M, et al. Repression of the genome organizer SATB1 in regulatory T cells is required for suppressive function and inhibition of effector differentiation. Nat Immunol. 2011;12:898–907. doi: 10.1038/ni.2084. [DOI] [PMC free article] [PubMed] [Google Scholar]
- 27.Chaudhry A, et al. CD4+ regulatory T cells control TH17 responses in a Stat3-dependent manner. Science. 2009;326:986–991. doi: 10.1126/science.1172702. [DOI] [PMC free article] [PubMed] [Google Scholar]
- 28.Shi LZ, et al. HIF1{alpha}-dependent glycolytic pathway orchestrates a metabolic checkpoint for the differentiation of TH17 and Treg cells. J Exp Med. 2011;208:1367–1376. doi: 10.1084/jem.20110278. [DOI] [PMC free article] [PubMed] [Google Scholar]
- 29.Dang EV, et al. Control of T(H)17/T(reg) balance by hypoxia-inducible factor 1. Cell. 2011;146:772–784. doi: 10.1016/j.cell.2011.07.033. [DOI] [PMC free article] [PubMed] [Google Scholar]
- 30.Koch MA, et al. The transcription factor T-bet controls regulatory T cell homeostasis and function during type 1 inflammation. Nat Immunol. 2009;10:595–602. doi: 10.1038/ni.1731. [DOI] [PMC free article] [PubMed] [Google Scholar]
- 31.Wang Y, Souabni A, Flavell RA, Wan YY. An intrinsic mechanism predisposes Foxp3-expressing regulatory T cells to Th2 conversion in vivo. J Immunol. 2010;185:5983–5992. doi: 10.4049/jimmunol.1001255. [DOI] [PMC free article] [PubMed] [Google Scholar]
- 32.Gardner TS, Faith JJ. Reverse-engineering transcription control networks. Phys Life Rev. 2010;2:65–88. doi: 10.1016/j.plrev.2005.01.001. [DOI] [PubMed] [Google Scholar]
- 33.Basso K, et al. Reverse engineering of regulatory networks in human B cells. Nat Genet. 2005;37:382–390. doi: 10.1038/ng1532. [DOI] [PubMed] [Google Scholar]
- 34.Battle A, Segal E, Koller D. Probabilistic discovery of overlapping cellular processes and their regulation. J Comput Biol. 2005;12:909–927. doi: 10.1089/cmb.2005.12.909. [DOI] [PubMed] [Google Scholar]
- 35.Faith JJ, et al. Large-scale mapping and validation of Escherichia coli transcriptional regulation from a compendium of expression profiles. PLoS Biol. 2007;5:e8. doi: 10.1371/journal.pbio.0050008. [DOI] [PMC free article] [PubMed] [Google Scholar]
- 36.Thornton AM, et al. Expression of Helios, an Ikaros transcription factor family member, differentiates thymic-derived from peripherally induced Foxp3+ T regulatory cells. J Immunol. 2010;184:3433–3441. doi: 10.4049/jimmunol.0904028. [DOI] [PMC free article] [PubMed] [Google Scholar]
- 37.Yu C, et al. Targeted deletion of a high-affinity GATA-binding site in the GATA-1 promoter leads to selective loss of the eosinophil lineage in vivo. J Exp Med. 2002;195:1387–1395. doi: 10.1084/jem.20020656. [DOI] [PMC free article] [PubMed] [Google Scholar]
- 38.Lee AH, Scapa EF, Cohen DE, Glimcher LH. Regulation of hepatic lipogenesis by the transcription factor XBP1. Science. 2008;320:1492–1496. doi: 10.1126/science.1158042. [DOI] [PMC free article] [PubMed] [Google Scholar]
- 39.Cai Q, et al. Helios deficiency has minimal impact on T cell development and function. J Immunol. 2009;183:2303–2311. doi: 10.4049/jimmunol.0901407. [DOI] [PubMed] [Google Scholar]
- 40.Giraud M, et al. Aire unleashes stalled RNA polymerase to induce ectopic gene expression in thymic epithelial cells. Proc Natl Acad Sci U S A. 2012;109:535–540. doi: 10.1073/pnas.1119351109. [DOI] [PMC free article] [PubMed] [Google Scholar]
- 41.Johnson AD, et al. lambda Repressor and cro--components of an efficient molecular switch. Nature. 1981;294:217–223. doi: 10.1038/294217a0. [DOI] [PubMed] [Google Scholar]
- 42.Pittenger C, Kandel E. A genetic switch for long-term memory. C R Acad Sci III. 1998;321:91–96. doi: 10.1016/s0764-4469(97)89807-1. [DOI] [PubMed] [Google Scholar]
- 43.Iliopoulos D, Hirsch HA, Struhl K. An epigenetic switch involving NF-kappaB, Lin28, Let-7 MicroRNA, and IL6 links inflammation to cell transformation. Cell. 2009;139:693–706. doi: 10.1016/j.cell.2009.10.014. [DOI] [PMC free article] [PubMed] [Google Scholar]
- 44.Young RA. Control of the embryonic stem cell state. Cell. 2011;144:940–954. doi: 10.1016/j.cell.2011.01.032. [DOI] [PMC free article] [PubMed] [Google Scholar]
- 45.Huehn J, Polansky JK, Hamann A. Epigenetic control of FOXP3 expression: the key to a stable regulatory T-cell lineage? Nat Rev Immunol. 2009;9:83–89. doi: 10.1038/nri2474. [DOI] [PubMed] [Google Scholar]
- 46.Lio CW, Hsieh CS. A two-step process for thymic regulatory T cell development. Immunity. 2008;28:100–111. doi: 10.1016/j.immuni.2007.11.021. [DOI] [PMC free article] [PubMed] [Google Scholar]
- 47.Burchill MA, et al. Linked T cell receptor and cytokine signaling govern the development of the regulatory T cell repertoire. Immunity. 2008;28:112–121. doi: 10.1016/j.immuni.2007.11.022. [DOI] [PMC free article] [PubMed] [Google Scholar]
- 48.Hill JA, et al. Retinoic acid enhances Foxp3 induction indirectly by relieving inhibition from CD4+CD44hi Cells. Immunity. 2008;29:758–770. doi: 10.1016/j.immuni.2008.09.018. [DOI] [PMC free article] [PubMed] [Google Scholar]
- 49.Reich M, et al. GenePattern 2.0. Nat Genet. 2006;38:500–501. doi: 10.1038/ng0506-500. [DOI] [PubMed] [Google Scholar]
- 50.Rahl PB, et al. c-Myc regulates transcriptional pause release. Cell. 2010;141:432–445. doi: 10.1016/j.cell.2010.03.030. [DOI] [PMC free article] [PubMed] [Google Scholar]
Associated Data
This section collects any data citations, data availability statements, or supplementary materials included in this article.