

The impact of the RNA-binding protein (RBP) FUS on the transcriptome of human and mouse neurons is investigated by HITS–CLIP, RNA-seq, and knockdown approaches, and reveals that one function of FUS is to regulate splicing of RBP genes by binding to their highly conserved introns.
Keywords: FUS, ALS, FTLD, splicing, CLIP, conserved intron
Abstract
Dominant mutations and mislocalization or aggregation of Fused in Sarcoma (FUS), an RNA-binding protein (RBP), cause neuronal degeneration in Amyotrophic Lateral Sclerosis (ALS) and Frontotemporal Lobar Degeneration (FTLD), two incurable neurological diseases. However, the function of FUS in neurons is not well understood. To uncover the impact of FUS in the neuronal transcriptome, we used high-throughput sequencing of immunoprecipitated and cross-linked RNA (HITS–CLIP) of FUS in human brains and mouse neurons differentiated from embryonic stem cells, coupled with RNA-seq and FUS knockdowns. We report conserved neuronal RNA targets and networks that are regulated by FUS. We find that FUS regulates splicing of genes coding for RBPs by binding to their highly conserved introns. Our findings have important implications for understanding the impact of FUS in neurodegenerative diseases and suggest that perturbations of FUS can impact the neuronal transcriptome via perturbations of RBP transcripts.
INTRODUCTION
Pre-mRNAs transcribed by RNA polymerase II are extensively modified in the nucleus, often cotranscriptionally, before they are exported to the cytoplasm, where they function as mRNAs to direct protein synthesis (Dreyfuss et al. 2002; Ibrahim et al. 2012). In the nucleus, the 5′-end of pre-mRNA is capped, introns are removed, and exons are ligated together by the spliceosome assisted by numerous auxiliary factors including RBPs, and the 3′-end is polyadenylated (Ibrahim et al. 2012). Alternative splicing (AS) and alternative polyadenylation (APA) are prevalent and very important processes that generate tremendous transcriptome diversity from a set number of genes (Wang et al. 2008a). AS is regulated by many trans factors, notably RBPs that belong to the heterogeneous Ribonucleoprotein Particle (hnRNP) and arginine and serine-rich (SR) family of proteins that bind to cis elements on pre-mRNAs and influence the composition of mRNAs by promoting inclusion or exclusion of exons (Ibrahim et al. 2012). APA is also widespread and is controlled by polyadenylation signals (PAS) and other cis elements and by many trans-binding factors (Di Giammartino et al. 2011; Proudfoot 2011; Berg et al. 2012), and may lead not only to mRNAs with altered 3′ UTRs but also to the formation of mRNAs coding for proteins with different C-termini (Tian et al. 2005; Wang et al. 2008a). After export of the mature mRNA to the cytoplasm, the pioneer round of translation functions as a quality control mechanism to distinguish mature, properly spliced mRNAs from misspliced mRNAs (Schoenberg and Maquat 2012). The translating ribosomes remove protein marks (known as the exon–junction complex, –EJC–) that were deposited by the spliceosome in the vicinity of exon–exon junctions of mRNAs, and subsequent rounds of translation ensue to generate proteins. In the case of misspliced mRNAs that contain retained introns, ribosomes typically terminate in premature termination codons (PTCs) found within the retained intron; the downstream EJC is not removed and recruits factors that will degrade the mRNA in a process known as nonsense-mediated decay (NMD) (Schoenberg and Maquat 2012).
FUS (also known as Translocated in Liposarcoma –TLS–, pigpen, and hnRNP P2) is a ubiquitously expressed RBP that contains QGSY-rich (“prion-like”), Gly-rich, RNA recognition motif (RRM), zinc-finger (ZnF), and arginine-glycine-rich (RGG) domains (Lagier-Tourenne et al. 2010). FUS is homologous to TAF15 (TBP-associated factor of RNA Polymerase II of 68-KD/15) and to EWS (Ewing sarcoma breakpoint region 1, –EWSR1) and together constitute the FET family of RBPs that are predominantly nuclear but also shuttle to the cytoplasm and have functions in transcription, pre-mRNA splicing and RNA processing and metabolism (Kovar 2011). In vitro splicing assays implicated FUS in the regulation of alternative splicing (Lerga et al. 2001) and FUS was identified in purified human spliceosomes assembled in vitro on minimal pre-mRNAs (Rappsilber et al. 2002; Zhou et al. 2002). FUS regulates transcription of RNA polymerase II genes (Wang et al. 2008b; Tan et al. 2012) and also inhibits RNA polymerase III transcription (Tan and Manley 2010).
ALS is a motor neuron degenerative disease and in ∼20% of cases is part of a more extensive neurodegenerative process that includes FTLD (Ibrahim et al. 2012). Dysregulation of RBPs has recently emerged as a prominent pathogenic mechanism underlying ALS following the discovery of cytoplasmic mislocalization and aggregation of the RBP known as TAR RNA/DNA-binding protein of 43 kDa (TDP-43, TARDBP) in afflicted neurons from most patients with sporadic ALS (Arai et al. 2006; Neumann et al. 2006; Lee et al. 2012). TDP-43 associates with the mRNA splicing and translational machinery (Freibaum et al. 2010). Dominant mutations of the TARDBP gene were later found in familial ALS cases (Kabashi et al. 2008; Sreedharan et al. 2008; Van Deerlin et al. 2008), and aggregation of TDP-43 is found in most cases of hippocampal sclerosis associated with aging (Nelson et al. 2011) and in many cases of FTLD (Sieben et al. 2012). The role of RBPs in ALS solidified with the discovery that dominant mutations of FUS also cause familial ALS (Kwiatkowski et al. 2009; Vance et al. 2009). Most FUS disease mutants cause disruption in the nucleocytoplasmic shuttling of FUS, leading to increased cytoplasmic levels of FUS (Dormann et al. 2010). Mutations in the genes coding for the other two FET proteins, TAF15 and EWS, are also found in familial and sporadic ALS cases (Couthouis et al. 2011, 2012; Ticozzi et al. 2011). Furthermore, prominent cytoplasmic accumulation and aggregation of FUS, TAF15, and EWS are found in a subset of FTLD cases, further supporting the central role of FUS and of other FET proteins in neurodegeneration (Mackenzie and Neumann 2011; Neumann et al. 2011).
FUS, along with other RBPs that cause or are associated with ALS and FTLD, have prion-like domains that under physiological conditions may oligomerize (Kato et al. 2012), but under pathological conditions promote aggregation and neurotoxicity (Cushman et al. 2010; King et al. 2012) as originally proposed for the pathogenesis of prion diseases (Aguzzi and Rajendran 2009; Prusiner 2012). An important unanswered question is whether neurodegeneration is caused by mislocalization and aggregation of RBPs that effectively reduce their availability to function in normal RNA metabolism (loss-of-function), or from a gain-of-function of the aggregated and mislocalized RBPs, leading, for example to inappropriate interactions with cytoplasmic RNAs, or most likely from a combination of both mechanisms (Lee et al. 2012).
Identifying the RNA targets that are bound by RBPs in vivo is an essential first step toward elucidation of their functions. TDP-43 RNA interaction maps in mouse and human brains have shown that TDP-43 affects RNA splicing and regulates, among others, RNAs with neuronal functions and long introns (Polymenidou et al. 2011; Tollervey et al. 2011). FUS RNA targets were recently reported for FLAG-tagged FUS whose expression was enforced in 293T cells (Hoell et al. 2011), revealing prominent binding of FUS to introns and highlighting its function in splicing. While our manuscript was under preparation and revision, RNA targets for endogenous FUS in mouse brains and human autopsy brains were reported, revealing that pre-mRNAs constituted the major class of RNA targets for FUS (Ishigaki et al. 2012; Lagier-Tourenne et al. 2012; Rogelj et al. 2012). These studies revealed a role for FUS in splicing regulation along nascent transcripts (Ishigaki et al. 2012; Lagier-Tourenne et al. 2012; Rogelj et al. 2012). Interestingly, no significant overlap between the binding sites or splicing changes was seen between FUS and TDP-43, although both proteins were found to bind and regulate genes with long introns and also genes important for neuronal development (Lagier-Tourenne et al. 2012; Rogelj et al. 2012). However, the degree of FUS target conservation and the magnitude of direct vs. indirect effects of FUS in the neuronal transcriptome are not known.
Here we report conserved neuronal RNA targets and networks that are regulated by FUS. Interestingly, we find that FUS regulates splicing of genes coding for RBPs by binding to their highly conserved introns. These results have important implications for understanding the impact of FUS in neurodegeneration and suggest that perturbations of FUS may have widespread effects in the neuronal transcriptome via perturbations of RBP transcripts.
RESULTS AND DISCUSSION
To identify the in vivo RNA-binding sites for FUS, we performed HITS–CLIP (Supplemental Fig. S1A) using temporal lobe cortices (surgical specimens) from three unrelated normal human brains. We first tested the specificity of the anti-FUS antibody, A300-302A; as shown in Figure 1, the antibody recognized a single protein migrating at ∼66 kDa on immunoblots of human brain and mouse neurons whose identity was confirmed to be FUS by immunoprecipitation and mass spectrometry (data not shown). Furthermore, A300-302A has been used successfully to identify pathological FUS in FTLD cases (Neumann et al. 2011). Following UV cross-linking, immunoprecipitation of FUS was performed under stringent conditions and after ligation of radiolabeled 3′ adaptor to RNA cross-linked to FUS, the reactions were separated by NuPAGE, blotted on nitrocellulose membranes, and visualized by autoradiography and immunoblotting, demonstrating robust and specific FUS–RNA complexes (Fig. 1A; Supplemental Fig. S1B). cDNA libraries were prepared from RNA (CLIP tags) extracted from the membranes and sequenced by Illumina GIIe analyzer, generating a total of 7,324,501 reads from the three FUS CLIPs that mapped to the human genome.
FIGURE 1.

FUS HITS–CLIP in human brains and mouse neurons. (A) FUS CLIP from one human brain (CLIPs from the other two brains shown in Supplemental Fig. S1B). Red line indicates FUS cross-linked to RNA ligated to radiolabled 3′ adaptor; RNA was isolated from FUS–RNA complexes and sequenced. (NRS) Nonimmune serum (negative control); (*) antibody bands. (B) Genomic distribution of FUS CLIP peaks from three human brains. (C) Schematic of generation of neurons from mouse Embryonic Stem (ES) cells. (D) FUS CLIPs from biological replicates of mouse neurons. Red line indicates FUS cross-linked to RNA ligated to a radiolabed 3′ adaptor that was used for sequencing. (E) Genomic distribution of mouse neuron CLIP peaks. (F) Overlap between consistently highly bound human and mouse FUS RNA targets.
To verify the reproducibility and significance of the results and to avoid possible confounds in the data sets introduced by Illumina sequencing artifacts, all bioinformatics analyses were performed independently for each CLIP sample and all conclusions were independently validated by all CLIP samples.
The correlation of gene targeting by FUS among all pairwise combinations of the three human brains (see Materials and Methods) was very high (R > 0.95), indicating that FUS HITS–CLIP was highly reproducible (Supplemental Fig. S1C,D). Approximately 60% of CLIP peak-tags (see Materials and Methods) mapped to introns, whereas 13% mapped to exons, 30% to transcripts arising from intergenic regions, and 3% to noncoding genes (Fig. 1B). The over-representation of intronic CLIP reads indicates that FUS binds pre-mRNAs and is consistent with the predominantly nuclear localization of FUS and its role in nuclear RNA processing events such as pre-mRNA splicing.
Prior SELEX (Systematic Evolution of Ligands by Exponential Enrichement) experiments using a recombinant, bacterially expressed, GST-FUS protein identified a GGUG motif in 39 of 72 sequences selected after three rounds of SELEX (Lerga et al. 2001). RNAs containing this motif bound to GST-FUS or to GST fusions of isolated RRM and RGG domains of FUS (Lerga et al. 2001). However, RNAs containing CU sequences also bound to the RRM of FUS, although with lower apparent affinity (Lerga et al. 2001). Subsequent NMR and binding studies of individual FUS domains showed that binding of GGUG was mediated by the ZnF domain of FUS, while the RRM domain of FUS failed to bind GGUG containing RNAs (Iko et al. 2004). PAR–CLIP (Photoactivatable-Ribonucleoside-Enhanced Crosslinking and Immunoprecipitation) of epitope-tagged FUS with enforced expression in 293T cells failed to reveal a linear motif, but revealed a degenerate structural motif found in a portion of FUS-binding sites (Hoell et al. 2011). A well-defined FUS-binding motif was also not found in the studies of Ishigaki et al. (2012). A twofold enrichment of a GGU-containing motif was found by Rogelj et al. (2012) at cross-linking sites, but, overall, FUS-binding sites showed little sequence specificity (Rogelj et al. 2012).
We decided to perform exhaustive searches for possible FUS-binding motifs in our human CLIP data (and mouse CLIP data, see below) by estimating the enrichment of every possible hexamer within the highest scored 5000 peaks of each sample (see Materials and Methods) that overlap UCSC annotated genes. The enrichment was calculated independently for each sample against a random background using Fischer’s exact test (Vourekas et al. 2012). The random background was created by selecting one random peak of equal size to each real peak. To create a background that closely resembled the real set, random peaks were restrained to avoid overlap with any real peaks and were selected from genes that contained at least one real peak. The ranked lists of all hexamers for all samples were combined independently per each CLIP library and were assigned P-values using the Rank Products method (Breitling et al. 2004). All hexamers that were significantly (P-value < 0.01) over-represented in all replicates and had a false-positive percent lower than 0.01 based on the rank product were identified (Supplemental Table 1) and were found to represent ∼20% of FUS-binding sites. However, the majority (∼80%) of RNA-binding sites for FUS do not contain defined motifs, consistent with the low-sequence specificity of FUS toward RNA binding (Ishigaki et al. 2012; Rogelj et al. 2012) and highlighting the need for experimental determination of FUS-binding sites.
We reasoned that conservation of FUS-binding sites is very likely indicative of transcripts that are functionally regulated by FUS. To identify conserved neuronal targets for FUS, we performed HITS–CLIP in mouse neurons differentiated from embryonic stem cells (Fig. 1C, Supplemental Fig. S2A,B). The purity of the neurons was ∼90% (Supplemental Fig. S2A) and two biological replicates of FUS HITS–CLIP (Fig. 1D) generated a total of 53,408,386 reads (using Illumina GIIx analyzer) that were mapped to the mouse genome. The correlation coefficient of gene targeting between the two mouse samples (see Materials and Methods) was 0.94, indicating that mouse FUS CLIP was highly reproducible (Supplemental Fig. S2C,D). The genomic distribution of mouse FUS CLIP peak-tags was similar to that of human CLIP peak-tags; ∼60% mapped to introns, ∼10% to exons, ∼30% to intergenic regions, and ∼1.5% to noncoding genes (Fig. 1E), as were the over-represented hexamers that were identified for mouse FUS binding (Supplemental Table 2), indicating similar functions of FUS between human and mouse neural tissues.
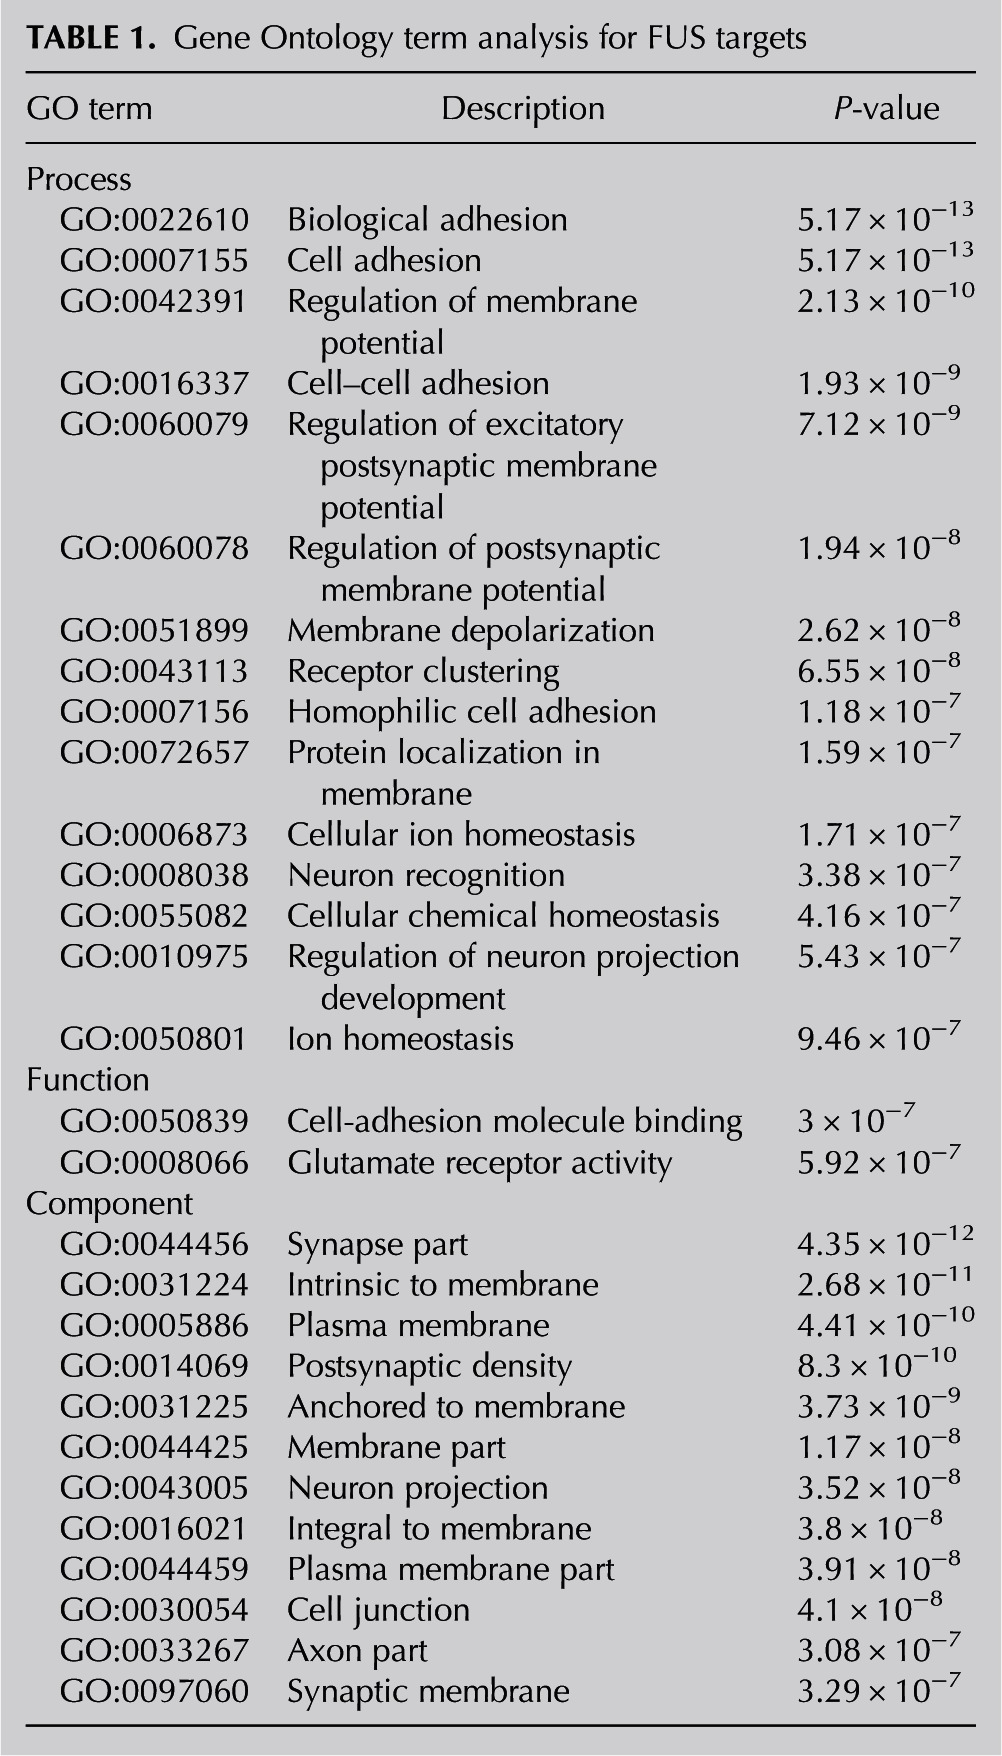
Next, we determined the most consistently targeted human and mouse RNAs by ranking the genes that contained FUS peak-tags in all CLIP experiments; we identified 863 human genes, 696 of which have a mouse homolog (Supplemental Table 3). We also identified 156 mouse genes, 131 of which have a human homolog (Supplemental Table 4). The higher number of targets identified from the human samples is not surprising given that the human brain is a very complex tissue with multiple cells types, including various types of neurons and glial cells, whereas the mouse samples represented highly pure neurons. Strikingly, >90% of the highly FUS-targeted mouse transcripts are the same in humans (Fig. 1F), indicating that there is a conserved group of neuronal RNAs that are targeted by FUS. Gene Ontology (GO) term analysis (see Table 1) revealed enrichment of genes controlling synaptic, cell adhesion, and neuronal projection and recognition processes, implicating FUS in the regulation of interrelated networks of genes that are vital for neuronal maintenance, development, and functioning.
TABLE 1.
Gene Ontology term analysis for FUS targets
To analyze the impact of FUS on its RNA targets, we examined the transcriptome of mouse neurons after knockdown of FUS. Biological triplicates of mouse ES cell-derived neurons were transfected with siRNAs against FUS or control siRNAs (Fig. 2A), and total RNA and protein were extracted. The efficiency of knockdown was determined by quantitative (q)RT-PCR and immunoblotting and revealed significant reductions in the level of FUS mRNA (Fig. 2B) and protein (Fig. 2C). We then performed directional RNA-seq (Vourekas et al. 2012), generating a total of 61,304,641 reads from the three FUS knockdowns and 59,339,986 from the three control knockdowns that mapped to the mouse genome (Supplemental Fig. S2E). It is important to note that by using total RNA instead of poly(A)-selected RNA for RNA-seq we were able to probe not only exons, but also introns of transcripts. The correlation coefficient (R) of normalized gene expression between the three FUS and three control RNA-seq experiments (see Materials and Methods) ranged from 0.73 to 0.97, indicating that the high reproducibility of the RNA-seq experiments under all experimental conditions (Supplemental Fig. S2F). The availability of both FUS CLIP and RNA-seq data from mouse neuron samples allowed us to examine the correlation between FUS binding and RNA expression levels. No correlation (R2 < 10−4) was observed, indicating that the abundance of FUS-binding sites is not affected by RNA expression levels (see Materials and Methods).
FIGURE 2.

Reduction in FUS protein levels leads to transcript and splicing alterations in mouse neurons. (A) Experimental scheme. (B) mRNA levels of FUS after knockdown assayed by qRT-PCR from three independent experiments; GAPDH was used for normalization. (C) Protein levels of FUS after knockdown quantified by Western blots from three independent experiments; GAPDH was used for normalization. (D,E) Scatter plots of differentially regulated genes (D) or exons (E) identified by RNA-seq analysis from three FUS knockdown experiments compared with controls. A total of 94 genes were up-regulated (blue) and 52 were down-regulated (red) upon FUS knockdown (D). Differentially expressed genes were identified by Student’s t-test (n = 3; P < 0.01) on the gene expression levels of CTRL and knockdowns (D). Exon inclusion was up-regulated for 631 exons (blue) and down-regulated for 437 exons (red) (E). The number of reads that mapped on the exon, per exon kilobase (kb), was normalized using the per sample gene expression level upper quartile normalization factor (see Materials and Methods). Differential inclusion of exons was determined by Student’s t-test (n = 3; P < 0.01).
By examining gene expression measured by RNA-Seq (see Materials and Methods), we identified 94 significantly (P-value < 0.01) up-regulated and 52 significantly (P-value < 0.01) down-regulated genes upon FUS knockdown (Fig. 2D; Supplemental Table 5). The small number of differentially expressed genes indicates that transcriptional regulation is probably not one of the principal functions of FUS in neurons and is consistent with the limited changes seen by microarrays (Rogelj et al. 2012).
As previously reported (Lagier-Tourenne et al. 2012), many FUS CLIP tags were found in genes containing long introns, such as Csmd1, Nrxn3, Nlgn1, Nkain2, Smyd3, and Kcnip4 (Supplemental Fig. S3). Comparison of our mouse FUS CLIP data with those reported in Lagier-Tourenne et al. (2012) showed that they are highly correlated (R = 0.77–0.81). However, by RNA-seq and qRT-PCR analyses we did not detect alterations in the expression levels of genes harboring long introns in mouse neuronal cells after FUS knockdown (Supplemental Fig. S3). We performed RNA-seq 2 d after siRNA knockdowns, as we could achieve maximum FUS (mRNA and protein) knockdown in mouse neurons at the shortest possible time in order to capture early events that may be related directly to FUS activities. In contrast, Lagier-Tourenne et al. (2012) used prolonged FUS knockdowns in mouse brains and human neurons and different approaches (antisense oligonucleotides for knockdowns in mouse brains and lentiviral shRNAs for knockdowns in human neurons derived from ES cells). The difference in the time course of the knockdowns and in the experimental systems used likely explains the differences between our results and those of Lagier-Tourenne et al. (2012).
Next we examined the effect of FUS knockdown in pre-mRNA splicing by assessing exon expression changes. We found that FUS knockdown increased the expression of 631 exons and decreased the expression of 437 exons in the mouse neuronal transcriptome (Fig. 2E; Supplemental Table 6), indicating a role of FUS in regulating splicing of many transcripts. Of the changed exons, 54.4% are constitutive exons and 45.6% are alternative exons, suggesting that FUS has a general role in splicing and that the effects seen may reflect sensitivity of these exons to reduced FUS levels and to secondary effects mediated by FUS regulating other RBPs, as detailed below. These splicing alterations are unlikely to reflect experimental variations because we performed FUS knockdowns in biological triplicates, and the splicing changes that we report are seen in all samples.
To determine whether the changes in splicing were directly related to FUS binding, we evaluated the presence of FUS-binding sites within a region including the exon and 2 kb upstream and downstream. We found that 34.5% of unaffected exons have FUS CLIP reads associated with this region and, in contrast, 42.4% of changed exons have reads associated with them. These findings indicate that intronic sequences around the exons whose expression levels change after FUS knockdown are significantly (Fisher exact test, P-value < 10−7) more targeted by FUS.
However, the impact of FUS in splicing is likely more widespread than the one uncovered by our RNA-Seq experiments because of the stringent criteria that we used to define changed exons and limitations of RNA-Seq (Ozsolak and Milos 2011). Furthermore, we did not identify FUS-binding sites for the remainder 57.6% of changed exons, suggesting that either CLIP failed to identify all FUS-binding sites or that the observed changes in splicing of these exons were an indirect consequence of FUS knockdown. We reasoned that such indirect effects might be mediated by other RBPs targeted by FUS. In fact, during the analysis of FUS CLIPs we noticed that RNA-binding sites for FUS were often found within highly conserved introns of genes coding for RBPs. One such example is the FUS gene itself; as shown in Supplemental Figure S4, FUS binds predominantly to the two conserved introns between exon 6 and exon 8 of human and mouse FUS. Another prominent FUS target is the conserved intron of the gene coding for the small nuclear ribonucleoprotein 70 kDa polypeptide (snRNP70, U1-70K) (Fig. 3A), which is an essential component of the U1 snRNP that is required for recognition of the 5′ splice site during spliceosome assembly (Kohtz et al. 1994; Cho et al. 2011).
FIGURE 3.

FUS binds conserved introns. (A) Genome browser screenshots showing prevalent and specific FUS binding in conserved intron of mouse and human SNRNP70. (B) GO term categories of human and mouse genes with conserved introns. (C) Average intron conservation for genes coding for RNA-binding proteins. The distribution of conservation scores for highly targeted introns by FUS (>200 reads/intron) is shown in red and the distribution of less targeted or nontargeted introns (<200 reads/intron) is shown in black. (D) Total and FUS-bound conserved introns in human and mouse RBP coding genes. (E) Average intron expression change upon FUS KD for genes coding for RNA-binding proteins. Expression change is plotted for groups of highly FUS-bound introns, grouped by increasing conservation score.
Most intronic sequences are evolutionary neutral and are not conserved (Castresana 2002). However, conserved intronic sequences with an average length of ∼100 nt often flank alternatively spliced exons, suggesting that conserved intronic cis elements regulate alternative splicing (Sorek and Ast 2003; Sugnet et al. 2006). Highly conserved genomic regions were previously reported as ultraconserved elements (Bejerano et al. 2004) and ∼90 elements were reported within introns of genes coding for RNA-binding proteins and, in particular, RBPs involved in splicing (Bejerano et al. 2004; Ni et al. 2007). An intriguing property of some of the conserved introns of genes coding for RBPs is that their inclusion generates mRNAs that contain PTCs that trigger NMD (Ni et al. 2007; Saltzman et al. 2008). Intron inclusion in these cases serves as an autoregulatory and cross-regulatory mechanism to control RBP levels (Ni et al. 2007). To date, examples of auto- and cross-regulation of splicing has been documented for a number of RBPs, including hnRNPs (Huelga et al. 2012) and TDP-43 (Polymenidou et al. 2011; Tollervey et al. 2011). Other splicing regulators, such as Fox-1 (Ataxin2-binding protein 1, A2BP1), autoregulate their alternative splicing to generate dominant negative isoforms (Damianov and Black 2010), and in other instances RBPs autoregulate alternative polyadenylation of their mRNAs (Al-Ahmadi et al. 2009).
We noticed that for many conserved introns, conservation was not limited close to splice sites, but extended throughout most of the intron. The extent of intron conservation across the entire human and mouse genome and their relationship to FUS has not been previously addressed. We used PhyloP vertebrate phylogenetic conservation to determine that the average conservation score distribution of human and mouse exons has a peak from score 500 to 2000. We excluded from this analysis regions within introns that give rise to noncoding RNAs (such as miRNAs or snoRNAs) and introns that were smaller than 200 nucleotides that might also give rise to as yet unknown small noncoding RNAs, such as mirtrons. Introns having an average conservation score of 500 or higher were considered highly conserved. GO term analysis revealed that genes containing at least one highly conserved intron were enriched for RBPs and for proteins related to splicing, mRNA metabolic processes, and nucleotide and small molecule binding (Fig. 3B). A subset of RBP introns that are highly targeted by FUS are also highly conserved (Fig. 3C). FUS-targeted RBP introns are also more commonly conserved compared with the rest of RBP introns: Of 6990 annotated human RBP introns, 303 are highly conserved and 184 are bound by FUS (Fig. 3D; Supplemental Table 7). Of 6256 annotated mouse RBP introns, 228 are highly conserved and 87 are bound by FUS (Fig. 3D; Supplemental Table 8). To determine whether FUS regulates levels of conserved introns we compared by RNA-seq the levels of all introns in mouse neurons after control or FUS knockdown and found that FUS depletion leads to up-regulation of conserved intron levels (Fig. 3E).
To further explore the effect of FUS in transcripts with conserved introns, we analyzed the effects of FUS knockdown and FUS overexpression in the splicing of snRNP70 in mouse neurons. The intron between exons 7 and 8 of mouse and human snRNP70 is conserved and highly targeted by FUS (Fig. 3A,B), and several transcripts that retain the conserved intron are found in EST databases (data not shown). We used specific primers to quantify by qRT-PCR transcript “a,” containing the properly spliced exons 7 and 8 of mouse snRNP70, and transcript “b,” which retains the conserved intron, from mouse neurons (Fig. 4A) after control or FUS knockdown. We found a statistically significant increase of transcript “b” containing the conserved intron (6.66 ± 0.15% of transcript “a” in control, while 12.1 ± 1.89% in FUS knockdown); and reciprocal decrease of transcript “a” that does not contain the conserved intron (67.6 ± 7.61% of control) when FUS protein levels were reduced (Fig. 4B). Next, we transduced mouse neurons with a lentivirus expressing wild-type human FUS protein containing an amino-terminal FLAG tag or with empty lentivirus (Fig. 4C) and assessed the levels of transcripts “a” and “b” by qRT-PCR. As shown in Figure 4D, there was decrease of transcript “b” (31.7% and 26.6% in control relative to the values of transcript “a” in sample #1 in control, while 18.9% and 17.7% in FUS overexpression) and reciprocal increase in transcript “a” (100% and 83.7% in control, while 121.3% and 128.9% in FUS overexpression). Collectively these experiments indicate that FUS regulates the levels of snRNP70 transcripts including the conserved intron. Retention of the conserved intron in snRNP70 mRNA along with downstream exons can lead to degradation of the transcript by NMD because of in-frame PTCs within the conserved intron. This type of regulation is consistent with a model of cross-regulation of snRNP70 by FUS, as described for other RBPs (Ni et al. 2007). Alternatively, the conserved intron can function as a 3′ UTR if its retention leads to a truncated snRNP70 mRNA because of alternative polyadenylation triggered by APA sites within the conserved intron. To address this possibility we performed 3′-RACE of poly(A) RNA from mouse neurons to identify truncated snRNP70 mRNAs that may contain the conserved intron as a 3′ UTR. We identified as rare such transcripts (Supplemental Fig. S5) that have the potential to code for a truncated snRNP70 protein containing the amino-terminal part of snRNP70, which include most of the RRM, but not the C-terminal serine- and arginine-rich region (Supplemental Fig. S5). However, we failed to detect truncated snRNP70 protein by immunoblots (data not shown) using three antibodies that recognized the amino-terminal portion of snRNP70, indicating that the truncated snRNP70 transcripts do not give rise to high levels of truncated snRNP70 protein or that the truncated snRNP70 protein is rapidly degraded. We attempted to detect truncated snRNP70 protein by immunoprecipitations using anti-snRNP70 antibodies, but found that they did not work for immunoprecipitations. We note, though, that all three antibodies that we tested were of low affinity. At this point, the paucity of high-affinity antibodies against the amino-terminal portion of snRNP70 precludes definitive conclusions about the levels of truncated snRNP70 protein. We also investigated by qRT-PCR the impact of FUS in other RBPs (Ewsr1, Sfpq, hnrnpl, Qk, and Tia1) whose conserved introns are bound by FUS, and we found that similar to snRNP70, FUS regulated the levels of transcripts containing conserved introns (Supplemental Fig. S6). Finally, to confirm the specificity of FUS in the regulation of alternative transcripts containing conserved introns, we examined by qRT-PCR the transcripts of two genes, Supt6h and U2af2, which were expressed in neurons, but whose conserved introns did not contain FUS-binding sites (FUS CLIP peak-tags). As shown in Supplemental Figure S7, qRT-PCR detected only transcripts that did not contain the conserved intron, and the expression levels of these transcripts were not altered upon FUS knockdown.
FIGURE 4.

FUS regulates splicing of the conserved intron of snRNP70. (A) Gene structure of mouse snRNP70 gene with conserved intron between exons 7 and 8 and transcripts originating from this region. (B) qRT-PCRs for the detection of indicated transcripts in control and FUS knockdown mouse neurons. Quantitation is from three experiments; error bars represent standard deviations, and changes are significant as determined by Student’s t-test. (C) Mouse neurons were transduced with either empty lentivirus (control) or with lentivirus expressing FLAG-tagged human FUS (NFLAG–hFUS), and the expression of endogenous mouse FUS and exogenous human FUS was detected by immunoblots. (D) qRT-PCRs for the detection of indicated transcripts in controls and in mouse neurons overexpressing NFLAG–hFUS. GAPDH served as a normalization control.
Collectively, our findings indicate that FUS participates in an extensive network of cross-regulation of other RBPs by targeting their conserved introns and suggests that perturbations of FUS in ALS and FTLD may lead to changes in the transcriptome, both as a result of primary effects on FUS-bound transcripts and secondary effects via the effect of FUS or other RBPs. It will be interesting to address in future studies how the conservation of particular introns within RBPs arose, whether the conserved introns act as a nexus for deposition of RBP complexes and mechanistic aspects of their functions. More generally, the discovery of conserved, human, and mouse neuronal RNA targets of FUS will facilitate investigations into the role of FUS in neurodegeneration.
MATERIALS AND METHODS
Neural differentiation of mouse ES cells
Mouse embryonic stem cells were maintained in ES medium (DMEM, 15% FBS, 1× penicillin/streptomycin, 1× Glutamax, 1× nonessential amino acid, 1× sodium pyruvate, 0.1 mM β-mercaptoethanol, 1000 µ/mL LIF, 25 μM PD98059) on a gelatinized plate without feeder cells. Differentiation into neurons was performed as described previously (Wichterle et al. 2009). Briefly, 1 × 10⁶ ES cells were cultured with ADFNK medium (45% Advanced DMEM/F12, 45% Neurobasal Medium, 10% knockout serum replacement, 1× penicillin/streptomycin, 1× L-glutamine, 0.1 mM β-mercaptoethanol) for 2 d, and then with 5 μM retinoic acid for 3 d to form embryonic bodies (EBs)-small floating aggregates of ES cells. EBs were utilized for preparation of neuronal cultures on day 6 of differentiation. EBs were dissociated into single cells and plated on Poly-L-lysine/laminin-coated 15-cm plates (4 × 10⁷ cells) with ADFNB + GDNF medium (49% Advanced DMEM/F12, 49% Neurobasal Medium, 2% B27 supplement, 1× penicillin/streptomycin, 1× L-glutamine, 5 ng/mL GDNF).
HITS–CLIP
Normal human brain tissue, obtained from temporal lobectomy surgical specimens from three unrelated individuals, were used for HITS–CLIP. Cortices were dissected from the temporal lobe blocks on ice and cells were dispersed in HBSS buffer using a Dounce homogenizer. Cells were irradiated with UV (400 mJ/cm2), centrifuged to collect cell pellets, and stored at −80°C until use. Mouse ES cell-derived neurons were washed with PBS and irradiated with UV, centrifuged to collect cell pellets, and stored at −80°C until use. CLIP was performed as previously described (Chi et al. 2009) with some modifications. Briefly, the UV-treated cells were lysed with 1× PXL and treated with DNase I (Promega) for 15 min and then treated with RNase T1 (Roche) for 10 min. The lysates were centrifuged (30,000g for 20 min) using a TLA100.3 rotor (Beckman). The supernatant was incubated with anti-FUS antibody or control nonimmune rabbit serum bound to Protein A Dynabeads (Invitrogen) for 2 h. Rabbit nonimmune serum used in this study was obtained from Genscript (NJ, USA). A total of 50 μL of proteinA dynabeads and 10 μg of anti-FUS antibody (Bethyl, A300-302A) were used for each CLIP experiment. The beads were washed and the RNA was ligated using T4 RNA ligase to radiolabeled 3′ adaptor (RL3) for 16 h at 16°C. After several washes, each CLIP sample was treated with T4 polynucleotide kinase (Promega) and 95% was used for autoradiography and 5% for immunoblotting. The samples were separated on 4%–12% NuPAGE gels (Invitrogen) and transferred onto nitrocellulose membranes. The autoradiography samples were exposed to X-ray film and the portion of the membrane corresponding to FUS–RNA complexes was used to extract the FUS-bound RNA using proteinase K (Roche) followed by Phenol extractions and ligation to the 5′ adaptor (RL5), and then followed by RT-PCR and Illumina sequencing. CLIP reads are shown in Supplemental Table 9. The difference in the number of reads between human and mouse samples is due to the use of different analyzers. Human brain samples were sequenced with an Illumina Genome Analyzer IIe, while mouse were sequenced with an Illumina Genome Analyzer IIx, which has higher output than the IIe.
siRNA knockdowns and Solid Support Directional RNA-seq (SSD-RNA-seq)
Mouse ES-derived neurons were seeded on a 6-well plate (7.5 × 10⁵/well) after dispersion of EBs (day 6). A total of 25 nM siRNA against FUS (On target plus SMART pool, Dharmacon) or control siRNA (MISSION siRNA Universal Negative Control #1, Sigma-Aldrich) were transfected using RNAiMAX (Invitrogen) on days 9 and 10. On day 12, cells were harvested and total RNA was extracted using Trizol reagent (Ambion). The total RNA was treated with DNase I (Promega) and stored at −80°C until use. The efficiency of knockdown was assayed by qRT-PCR and immunoblotting. SSD-RNA-seq was performed as recently described (Vourekas et al. 2012). Briefly, ribosomal RNA was depleted from the total RNA using RiboMinus (Invitrogen), and the rRNA-depleted sample was fragmented using RNA fragmentation buffer (Ambion) and treated with calf intestinal phosphatase. The RNA was extracted with phenol/chlorofom and then ligated with biotinylated 3′ adaptor (RL3). The ligated RNA was captured using M280 streptavidin Dynabeads (Invitrogen). After several washes, the 5′ adaptor (RL5) was ligated, and the RNA was subject to RT-PCR with the Titan One Tube RT-PCR System (Roche) followed by Re-PCR and Illumina sequencing.
Immunoblotting
Proteins were separated by 4%–12% NuPAGE gel (Invitrogen), transferred onto nitrocellulose membranes, blocked with 5% fat-free milk in PBST, and incubated with primary antibodies for 16 h at 4°C. After several washes with PBST, the membranes were incubated with secondary antibodies conjugated to HRP for 1 h at room temperature, and a signal was developed with ECL-plus reagents (GEhealthcare). The antibodies that we tested to identify the amino-terminal portion of snRNP70 were: Sigma AV40276 (raised against amino acids 21–70), Sigma SAB1100378 (raised against amino acids 86–100), and Novus NBP1-57487 (targeting the RRM of snRNP70 and raised against amino acids 91–137 of snRNP70).
Lentiviruses
Lentiviruses, empty, or expressing FLAG-tagged human FUS were prepared based on the pSLIK lentiviral system; preparation and transduction of lentiviruses was performed as described in Liu et al. (2012).
Bioinformatics
Sequenced reads preprocessing
All reads were trimmed from the 3′-end to remove bases that were identified with lower quality due to Illumina Analyzer biases that tend to identify bases with lower accuracy toward the 3′-end of the reads. The trimming was done as described in the BWA alignment software documentation (Li and Durbin 2009). The 3′-end-ligated adaptor (RL3) was removed from the sequences using the cutadapt (Martin 2011) software and using a 0.25 acceptable error rate for the alignment of the adaptor on the read. To eliminate cases where the adaptor might have been ligated more than once to the same CLIP read, adaptor removal was performed three times. For RNA-Seq experiments, an additional filtering step was used to remove artifacts introduced by the highly abundant pool of siRNAs used for knockdowns. Finally, all reads that were shorter than 15 nt were excluded from further analyses.
Alignment
Sequencing reads were aligned to the human (hg19) or mouse (mm9) genome, depending on the origin of the sample, using the BWA (Li and Durbin 2009) alignment program and setting the default program parameters, allowing for a 0.04 fraction of missing alignments given a 2% uniform base error rate. To refine the library and to avoid randomly aligned reads, all aligned reads shorter than 20 nt that align to multiple positions on the genome were excluded from further analyses. In addition, all reads mapping on repeat elements as defined by RepeatMasker have not been used in subsequent analyses.
Peak calling and peak-tag definition
Following the observation that aligned reads tended to stack in narrow regions along the genome, peaks were defined by merging overlapping reads into single merged regions and selecting the area with the highest number of aligned reads within each such region as the actual peak area. All reads that did not overlap with any merged region were discarded and the retained ones, named peak-tags, were used for quantitative analysis. Peak scores were defined as the total number of reads contained in each merged region. Numbers of reads and peaks for each CLIP sample are shown in Supplemental Table 9.
Correlation of HITS–CLIP samples
Gene targeting by FUS was estimated by measuring the total peak score within the area of a gene, including the intronic region. Only peaks in the sense direction of the gene were measured. Pearson’s correlation of gene targeting among all pairwise combinations of CLIP samples, excluding genes that were not targeted in either of the samples, was calculated (Supplemental Figs. S1C, S2D).
RNA-seq analysis
The estimation of expression levels for protein-coding genes was performed by counting the RNA-seq reads that mapped on the constitutive exons of genes. As constitutive exons, we defined exons that were found in all known expressed isoforms of the gene downloaded from the UCSC Genome Browser. If a gene has both protein-coding and nonprotein-coding annotated transcripts, only the protein-coding transcripts are used for the definition of constitutive exons. For each gene and sample the gene expression level was defined as the average number of reads mapped per kb of constitutive exon. All gene expression levels per sample were normalized using the upper quartile normalization method, effectively dividing each expression level by the upper quartile of all expression levels. To identify differentially expressed genes, Student’s t-test (n = 3) was performed on the generalized logarithm of the gene expression levels (Vourekas et al. 2012). Genes significantly different between conditions (control and knockdown samples) with a P-value of <0.01 were considered differentially expressed. For each exon, the number of reads per kb that mapped on the exon was normalized using the gene expression level quartile normalization factor. Intron expression was calculated as the number of reads per kb that mapped on each intron and was normalized using the gene expression level quartile normalization factor. Differentially expressed exons and introns were identified by the same method as differentially expressed genes.
Correlation of RNA-Seq samples
Pearson’s correlation of normalized gene expression among all pairwise combinations of RNA-seq samples, excluding genes which were not expressed in either of the samples, was calculated (Supplemental Fig. S2F).
Correlation of FUS CLIP targeting with gene expression
Pearson’s correlation of the average gene targeting by FUS along the CLIP samples against the average normalized gene expression along the RNA-seq samples was calculated.
Intron conservation
PhyloP vertebrate phylogenetic conservation per nucleotide was downloaded from the UCSC genome browser for the human (hg19) and mouse (mm9) genomes. Intron conservation score was calculated as the mean conservation score per nucleotide for each intron of each UCSC transcript. Introns longer than 200 nt were divided into five distinct groups with respect to increasing conservation scores (Fig. 3E). Introns with the same genomic locations were counted only once.
Gene Ontology analysis
For all Gene Ontology analyses, the online tool Gorilla (Eden et al. 2009) was used with default parameters to compare two lists of genes.
Quantitative RT-PCR
A total of 250 ng of total RNA was treated with DNase I, reversed transcribed using SuperScript III (Invitrogen), and then treated with 3 U of RNase H (Invitrogen) for 20 min at 37°C; 0.25 μL of 1st cDNA was used as template using Power SYBR Green PCR master mix (ABI) with specific primer sets, which are indicated in Supplemental Table 10 using StepOnePlus Real Time-PCR system (ABI). For quantifications, we applied the comparative deltaCt method, in which Ct values of samples subtracted from the Ct value of GAPDH were converted by 2(−Ct) to obtain values of relative expression ratio to GAPDH, and then the average value in control samples amplified by an exon–exon primer set was set to 1.0 to obtain the relative expression levels of alternative transcripts, including conserved introns.
DATA DEPOSITION
HITS–CLIP and RNA-Seq libraries were deposited in NCBI GEO under accession number GSE43308.
SUPPLEMENTAL MATERIAL
Supplemental material is available for this article.
Supplementary Material
ACKNOWLEDGMENTS
This work was supported by NIH grants NS072561 and NS056070 to Z.M.
Author contributions: T.N. and Z.M. conceived and directed experiments. T.N. performed all experiments with assistance from A.C. M.M. and P.A. performed all bioinformatical analyses. T.N., M.M., P.A., A.C., and Z.M. analyzed data and T.N. wrote the manuscript with substantial input and editing from M.M., P.A., and Z.M.
REFERENCES
- Aguzzi A, Rajendran L 2009. The transcellular spread of cytosolic amyloids, prions, and prionoids. Neuron 64: 783–790 [DOI] [PubMed] [Google Scholar]
- Al-Ahmadi W, Al-Ghamdi M, Al-Haj L, Al-Saif M, Khabar KS 2009. Alternative polyadenylation variants of the RNA binding protein, HuR: Abundance, role of AU-rich elements and auto-regulation. Nucleic Acids Res 37: 3612–3624 [DOI] [PMC free article] [PubMed] [Google Scholar]
- Arai T, Hasegawa M, Akiyama H, Ikeda K, Nonaka T, Mori H, Mann D, Tsuchiya K, Yoshida M, Hashizume Y, et al. 2006. TDP-43 is a component of ubiquitin-positive tau-negative inclusions in frontotemporal lobar degeneration and amyotrophic lateral sclerosis. Biochem Biophys Res Commun 351: 602–611 [DOI] [PubMed] [Google Scholar]
- Bejerano G, Pheasant M, Makunin I, Stephen S, Kent WJ, Mattick JS, Haussler D 2004. Ultraconserved elements in the human genome. Science 304: 1321–1325 [DOI] [PubMed] [Google Scholar]
- Berg MG, Singh LN, Younis I, Liu Q, Pinto AM, Kaida D, Zhang Z, Cho S, Sherrill-Mix S, Wan L, et al. 2012. U1 snRNP determines mRNA length and regulates isoform expression. Cell 150: 53–64 [DOI] [PMC free article] [PubMed] [Google Scholar]
- Breitling R, Armengaud P, Amtmann A, Herzyk P 2004. Rank products: A simple, yet powerful, new method to detect differentially regulated genes in replicated microarray experiments. FEBS Lett 573: 83–92 [DOI] [PubMed] [Google Scholar]
- Castresana J 2002. Estimation of genetic distances from human and mouse introns. Genome Biol 3: RESEARCH0028. [DOI] [PMC free article] [PubMed] [Google Scholar]
- Chi SW, Zang JB, Mele A, Darnell RB 2009. Argonaute HITS-CLIP decodes microRNA-mRNA interaction maps. Nature 460: 479–486 [DOI] [PMC free article] [PubMed] [Google Scholar]
- Cho S, Hoang A, Sinha R, Zhong XY, Fu XD, Krainer AR, Ghosh G 2011. Interaction between the RNA binding domains of Ser-Arg splicing factor 1 and U1-70K snRNP protein determines early spliceosome assembly. Proc Natl Acad Sci 108: 8233–8238 [DOI] [PMC free article] [PubMed] [Google Scholar]
- Couthouis J, Hart MP, Shorter J, DeJesus-Hernandez M, Erion R, Oristano R, Liu AX, Ramos D, Jethava N, Hosangadi D, et al. 2011. A yeast functional screen predicts new candidate ALS disease genes. Proc Natl Acad Sci 108: 20881–20890 [DOI] [PMC free article] [PubMed] [Google Scholar]
- Couthouis J, Hart MP, Erion R, King OD, Diaz Z, Nakaya T, Ibrahim F, Kim HJ, Mojsilovic-Petrovic J, Panossian S, et al. 2012. Evaluating the role of the FUS/TLS-related gene EWSR1 in amyotrophic lateral sclerosis. Hum Mol Genet 21: 2899–2911 [DOI] [PMC free article] [PubMed] [Google Scholar]
- Cushman M, Johnson BS, King OD, Gitler AD, Shorter J 2010. Prion-like disorders: Blurring the divide between transmissibility and infectivity. J Cell Sci 123: 1191–1201 [DOI] [PMC free article] [PubMed] [Google Scholar]
- Damianov A, Black DL 2010. Autoregulation of Fox protein expression to produce dominant negative splicing factors. RNA 16: 405–416 [DOI] [PMC free article] [PubMed] [Google Scholar]
- Di Giammartino DC, Nishida K, Manley JL 2011. Mechanisms and consequences of alternative polyadenylation. Mol Cell 43: 853–866 [DOI] [PMC free article] [PubMed] [Google Scholar]
- Dormann D, Rodde R, Edbauer D, Bentmann E, Fischer I, Hruscha A, Than ME, Mackenzie IR, Capell A, Schmid B, et al. 2010. ALS-associated fused in sarcoma (FUS) mutations disrupt Transportin-mediated nuclear import. EMBO J 29: 2841–2857 [DOI] [PMC free article] [PubMed] [Google Scholar]
- Dreyfuss G, Kim VN, Kataoka N 2002. Messenger-RNA-binding proteins and the messages they carry. Nat Rev Mol Cell Biol 3: 195–205 [DOI] [PubMed] [Google Scholar]
- Eden E, Navon R, Steinfeld I, Lipson D, Yakhini Z 2009. GOrilla: A tool for discovery and visualization of enriched GO terms in ranked gene lists. BMC Bioinformatics 10: 48. [DOI] [PMC free article] [PubMed] [Google Scholar]
- Freibaum BD, Chitta RK, High AA, Taylor JP 2010. Global analysis of TDP-43 interacting proteins reveals strong association with RNA splicing and translation machinery. J Proteome Res 9: 1104–1120 [DOI] [PMC free article] [PubMed] [Google Scholar]
- Hoell JI, Larsson E, Runge S, Nusbaum JD, Duggimpudi S, Farazi TA, Hafner M, Borkhardt A, Sander C, Tuschl T 2011. RNA targets of wild-type and mutant FET family proteins. Nat Struct Mol Biol 18: 1428–1431 [DOI] [PMC free article] [PubMed] [Google Scholar]
- Huelga SC, Vu AQ, Arnold JD, Liang TY, Liu PP, Yan BY, Donohue JP, Shiue L, Hoon S, Brenner S, et al. 2012. Integrative genome-wide analysis reveals cooperative regulation of alternative splicing by hnRNP proteins. Cell Rep 1: 167–178 [DOI] [PMC free article] [PubMed] [Google Scholar]
- Ibrahim F, Nakaya T, Mourelatos Z 2012. RNA dysregulation in diseases of motor neurons. Annu Rev Pathol 7: 323–352 [DOI] [PubMed] [Google Scholar]
- Iko Y, Kodama TS, Kasai N, Oyama T, Morita EH, Muto T, Okumura M, Fujii R, Takumi T, Tate S, et al. 2004. Domain architectures and characterization of an RNA-binding protein, TLS. J Biol Chem 279: 44834–44840 [DOI] [PubMed] [Google Scholar]
- Ishigaki S, Masuda A, Fujioka Y, Iguchi Y, Katsuno M, Shibata A, Urano F, Sobue G, Ohno K 2012. Position-dependent FUS-RNA interactions regulate alternative splicing events and transcriptions. Sci Rep 2: 529. [DOI] [PMC free article] [PubMed] [Google Scholar]
- Kabashi E, Valdmanis PN, Dion P, Spiegelman D, McConkey BJ, Vande Velde C, Bouchard JP, Lacomblez L, Pochigaeva K, Salachas F, et al. 2008. TARDBP mutations in individuals with sporadic and familial amyotrophic lateral sclerosis. Nat Genet 40: 572–574 [DOI] [PubMed] [Google Scholar]
- Kato M, Han TW, Xie S, Shi K, Du X, Wu LC, Mirzaei H, Goldsmith EJ, Longgood J, Pei J, et al. 2012. Cell-free formation of RNA granules: Low complexity sequence domains form dynamic fibers within hydrogels. Cell 149: 753–767 [DOI] [PMC free article] [PubMed] [Google Scholar]
- King OD, Gitler AD, Shorter J 2012. The tip of the iceberg: RNA-binding proteins with prion-like domains in neurodegenerative disease. Brain Res 1462: 61–80 [DOI] [PMC free article] [PubMed] [Google Scholar]
- Kohtz JD, Jamison SF, Will CL, Zuo P, Luhrmann R, Garcia-Blanco MA, Manley JL 1994. Protein-protein interactions and 5′-splice-site recognition in mammalian mRNA precursors. Nature 368: 119–124 [DOI] [PubMed] [Google Scholar]
- Kovar H 2011. Dr. Jekyll and Mr. Hyde: The two faces of the FUS/EWS/TAF15 protein family. Sarcoma 2011: 837474. [DOI] [PMC free article] [PubMed] [Google Scholar]
- Kwiatkowski TJ Jr, Bosco DA, Leclerc AL, Tamrazian E, Vanderburg CR, Russ C, Davis A, Gilchrist J, Kasarskis EJ, Munsat T, et al. 2009. Mutations in the FUS/TLS gene on chromosome 16 cause familial amyotrophic lateral sclerosis. Science 323: 1205–1208 [DOI] [PubMed] [Google Scholar]
- Lagier-Tourenne C, Polymenidou M, Cleveland DW 2010. TDP-43 and FUS/TLS: Emerging roles in RNA processing and neurodegeneration. Hum Mol Genet 19: R46–R64 [DOI] [PMC free article] [PubMed] [Google Scholar]
- Lagier-Tourenne C, Polymenidou M, Hutt KR, Vu AQ, Baughn M, Huelga SC, Clutario KM, Ling SC, Liang TY, Mazur C, et al. 2012. Divergent roles of ALS-linked proteins FUS/TLS and TDP-43 intersect in processing long pre-mRNAs. Nat Neurosci 15: 1488–1497 [DOI] [PMC free article] [PubMed] [Google Scholar]
- Lee EB, Lee VM, Trojanowski JQ 2012. Gains or losses: Molecular mechanisms of TDP43-mediated neurodegeneration. Nat Rev Neurosci 13: 38–50 [DOI] [PMC free article] [PubMed] [Google Scholar]
- Lerga A, Hallier M, Delva L, Orvain C, Gallais I, Marie J, Moreau-Gachelin F 2001. Identification of an RNA binding specificity for the potential splicing factor TLS. J Biol Chem 276: 6807–6816 [DOI] [PubMed] [Google Scholar]
- Li H, Durbin R 2009. Fast and accurate short read alignment with Burrows-Wheeler transform. Bioinformatics 25: 1754–1760 [DOI] [PMC free article] [PubMed] [Google Scholar]
- Liu X, Jin DY, McManus MT, Mourelatos Z 2012. Precursor microRNA-programmed silencing complex assembly pathways in mammals. Mol Cell 46: 507–517 [DOI] [PMC free article] [PubMed] [Google Scholar]
- Mackenzie IR, Neumann M 2011. FET proteins in frontotemporal dementia and amyotrophic lateral sclerosis. Brain Res 1462: 40–43 [DOI] [PubMed] [Google Scholar]
- Martin M 2011. Cutadapt removes adapter sequences from high-throughput sequencing reads. EMBnet.journal, North America 17: 10–12, available at http://journal.kembnet.org [Google Scholar]
- Nelson PT, Schmitt FA, Lin Y, Abner EL, Jicha GA, Patel E, Thomason PC, Neltner JH, Smith CD, Santacruz KS, et al. 2011. Hippocampal sclerosis in advanced age: Clinical and pathological features. Brain 134: 1506–1518 [DOI] [PMC free article] [PubMed] [Google Scholar]
- Neumann M, Sampathu DM, Kwong LK, Truax AC, Micsenyi MC, Chou TT, Bruce J, Schuck T, Grossman M, Clark CM, et al. 2006. Ubiquitinated TDP-43 in frontotemporal lobar degeneration and amyotrophic lateral sclerosis. Science 314: 130–133 [DOI] [PubMed] [Google Scholar]
- Neumann M, Bentmann E, Dormann D, Jawaid A, DeJesus-Hernandez M, Ansorge O, Roeber S, Kretzschmar HA, Munoz DG, Kusaka H, et al. 2011. FET proteins TAF15 and EWS are selective markers that distinguish FTLD with FUS pathology from amyotrophic lateral sclerosis with FUS mutations. Brain 134: 2595–2609 [DOI] [PMC free article] [PubMed] [Google Scholar]
- Ni JZ, Grate L, Donohue JP, Preston C, Nobida N, O’Brien G, Shiue L, Clark TA, Blume JE, Ares M Jr 2007. Ultraconserved elements are associated with homeostatic control of splicing regulators by alternative splicing and nonsense-mediated decay. Genes Dev 21: 708–718 [DOI] [PMC free article] [PubMed] [Google Scholar]
- Ozsolak F, Milos PM 2011. RNA sequencing: Advances, challenges and opportunities. Nat Rev Genet 12: 87–98 [DOI] [PMC free article] [PubMed] [Google Scholar]
- Polymenidou M, Lagier-Tourenne C, Hutt KR, Huelga SC, Moran J, Liang TY, Ling SC, Sun E, Wancewicz E, Mazur C, et al. 2011. Long pre-mRNA depletion and RNA missplicing contribute to neuronal vulnerability from loss of TDP-43. Nat Neurosci 14: 459–468 [DOI] [PMC free article] [PubMed] [Google Scholar]
- Proudfoot NJ 2011. Ending the message: Poly(A) signals then and now. Genes Dev 25: 1770–1782 [DOI] [PMC free article] [PubMed] [Google Scholar]
- Prusiner SB 2012. Cell biology. A unifying role for prions in neurodegenerative diseases. Science 336: 1511–1513 [DOI] [PMC free article] [PubMed] [Google Scholar]
- Rappsilber J, Ryder U, Lamond AI, Mann M 2002. Large-scale proteomic analysis of the human spliceosome. Genome Res 12: 1231–1245 [DOI] [PMC free article] [PubMed] [Google Scholar]
- Rogelj B, Easton LE, Bogu GK, Stanton LW, Rot G, Curk T, Zupan B, Sugimoto Y, Modic M, Haberman N, et al. 2012. Widespread binding of FUS along nascent RNA regulates alternative splicing in the brain. Sci Rep 2: 603. [DOI] [PMC free article] [PubMed] [Google Scholar]
- Saltzman AL, Kim YK, Pan Q, Fagnani MM, Maquat LE, Blencowe BJ 2008. Regulation of multiple core spliceosomal proteins by alternative splicing-coupled nonsense-mediated mRNA decay. Mol Cell Biol 28: 4320–4330 [DOI] [PMC free article] [PubMed] [Google Scholar]
- Schoenberg DR, Maquat LE 2012. Regulation of cytoplasmic mRNA decay. Nat Rev Genet 13: 246–259 [DOI] [PMC free article] [PubMed] [Google Scholar]
- Sieben A, Van Langenhove T, Engelborghs S, Martin JJ, Boon P, Cras P, De Deyn PP, Santens P, Van Broeckhoven C, Cruts M 2012. The genetics and neuropathology of frontotemporal lobar degeneration. Acta Neuropathol 124: 353–372 [DOI] [PMC free article] [PubMed] [Google Scholar]
- Sorek R, Ast G 2003. Intronic sequences flanking alternatively spliced exons are conserved between human and mouse. Genome Res 13: 1631–1637 [DOI] [PMC free article] [PubMed] [Google Scholar]
- Sreedharan J, Blair IP, Tripathi VB, Hu X, Vance C, Rogelj B, Ackerley S, Durnall JC, Williams KL, Buratti E, et al. 2008. TDP-43 mutations in familial and sporadic amyotrophic lateral sclerosis. Science 319: 1668–1672 [DOI] [PMC free article] [PubMed] [Google Scholar]
- Sugnet CW, Srinivasan K, Clark TA, O’Brien G, Cline MS, Wang H, Williams A, Kulp D, Blume JE, Haussler D, et al. 2006. Unusual intron conservation near tissue-regulated exons found by splicing microarrays. PLoS Comput Biol 2: e4. [DOI] [PMC free article] [PubMed] [Google Scholar]
- Tan AY, Manley JL 2010. TLS inhibits RNA polymerase III transcription. Mol Cell Biol 30: 186–196 [DOI] [PMC free article] [PubMed] [Google Scholar]
- Tan AY, Riley TR, Coady T, Bussemaker HJ, Manley JL 2012. TLS/FUS (translocated in liposarcoma/fused in sarcoma) regulates target gene transcription via single-stranded DNA response elements. Proc Natl Acad Sci 109: 6030–6035 [DOI] [PMC free article] [PubMed] [Google Scholar]
- Tian B, Hu J, Zhang H, Lutz CS 2005. A large-scale analysis of mRNA polyadenylation of human and mouse genes. Nucleic Acids Res 33: 201–212 [DOI] [PMC free article] [PubMed] [Google Scholar]
- Ticozzi N, Vance C, Leclerc AL, Keagle P, Glass JD, McKenna-Yasek D, Sapp PC, Silani V, Bosco DA, Shaw CE, et al. 2011. Mutational analysis reveals the FUS homolog TAF15 as a candidate gene for familial amyotrophic lateral sclerosis. Am J Med Genet B Neuropsychiatr Genet 156B: 285–290 [DOI] [PubMed] [Google Scholar]
- Tollervey JR, Curk T, Rogelj B, Briese M, Cereda M, Kayikci M, Konig J, Hortobagyi T, Nishimura AL, Zupunski V, et al. 2011. Characterizing the RNA targets and position-dependent splicing regulation by TDP-43. Nat Neurosci 14: 452–458 [DOI] [PMC free article] [PubMed] [Google Scholar]
- Van Deerlin VM, Leverenz JB, Bekris LM, Bird TD, Yuan W, Elman LB, Clay D, Wood EM, Chen-Plotkin AS, Martinez-Lage M, et al. 2008. TARDBP mutations in amyotrophic lateral sclerosis with TDP-43 neuropathology: A genetic and histopathological analysis. Lancet Neurol 7: 409–416 [DOI] [PMC free article] [PubMed] [Google Scholar]
- Vance C, Rogelj B, Hortobagyi T, De Vos KJ, Nishimura AL, Sreedharan J, Hu X, Smith B, Ruddy D, Wright P, et al. 2009. Mutations in FUS, an RNA processing protein, cause familial amyotrophic lateral sclerosis type 6. Science 323: 1208–1211 [DOI] [PMC free article] [PubMed] [Google Scholar]
- Vourekas A, Zheng Q, Alexiou P, Maragkakis M, Kirino Y, Gregory BD, Mourelatos Z 2012. Mili and Miwi target RNA repertoire reveals piRNA biogenesis and function of Miwi in spermiogenesis. Nat Struct Mol Biol 19: 773–781 [DOI] [PMC free article] [PubMed] [Google Scholar]
- Wang ET, Sandberg R, Luo S, Khrebtukova I, Zhang L, Mayr C, Kingsmore SF, Schroth GP, Burge CB 2008a. Alternative isoform regulation in human tissue transcriptomes. Nature 456: 470–476 [DOI] [PMC free article] [PubMed] [Google Scholar]
- Wang X, Arai S, Song X, Reichart D, Du K, Pascual G, Tempst P, Rosenfeld MG, Glass CK, Kurokawa R 2008b. Induced ncRNAs allosterically modify RNA-binding proteins in cis to inhibit transcription. Nature 454: 126–130 [DOI] [PMC free article] [PubMed] [Google Scholar]
- Wichterle H, Peljto M, Nedelec S 2009. Xenotransplantation of embryonic stem cell-derived motor neurons into the developing chick spinal cord. Methods Mol Biol 482: 171–183 [DOI] [PubMed] [Google Scholar]
- Zhou Z, Licklider LJ, Gygi SP, Reed R 2002. Comprehensive proteomic analysis of the human spliceosome. Nature 419: 182–185 [DOI] [PubMed] [Google Scholar]
Associated Data
This section collects any data citations, data availability statements, or supplementary materials included in this article.