

Abstract
Vascular endothelial growth factor (VEGF) is known to activate proliferation, migration, and survival pathways in endothelial cells through phosphorylation of VEGF receptor-2 (VEGFR-2). VEGF has been incorporated into biomaterials through encapsulation, electrostatic sequestration, and covalent attachment, but the effect of these immobilization strategies on VEGF signaling has not been thoroughly investigated. Further, although growth factor internalization along with the receptor generally occurs in a physiological setting, whether this internalization is needed for receptor phosphorylation is not entirely clear. Here we show that VEGF covalently bound through a modified heparin molecule elicits an extended response of pVEGFR-2 in human umbilical vein endothelial cells (HUVECs) and that the covalent linkage reduces internalization of the growth factor during receptor endocytosis. Optical tweezer measurements show that the rupture force required to disrupt the heparin-VEGF-VEGFR-2 interaction increases from 3–8 pN to 6–12 pN when a covalent bond is introduced between VEGF and heparin. Importantly, by covalently binding VEGF to a heparin substrate, the stability (half-life) of VEGF is extended over three-fold. Here, mathematical models support the biological conclusions, further suggesting that VEGF internalization is significantly reduced when covalently bound, and indicating that VEGF is available for repeated phosphorylation events.
Introduction
Vascular endothelial growth factor (VEGF) is one of the most widely studied and applied growth factors to promote angiogenesis. Since a major obstacle in tissue regeneration is the lack of stable blood vessel infiltration into engineered tissue implants, VEGF has been extensively utilized as a means to induce vascularization1. To prevent diffusion and control release, VEGF has been encapsulated2 and electrostatically3 or covalently immobilized4–7 to the tissue engineering scaffold. Although the end outcome of enhanced blood vessel formation in vivo is achieved6, 7, the characterization of the bioactivity of VEGF-incorporated matrices in vitro has been limited to cellular migration and proliferation studies 4,8, while extensive signaling studies have not been conducted. It is now known that growth factors, particularly VEGF, send different signals to endothelial cells when presented to their receptors with different degrees of matrix affinity8, 9. By changing the growth factor affinity for the matrix, cells will receive different signals and behave accordingly.
Naturally, splicing of VEGF transcripts regulates affinity for the extracellular matrix (ECM). Incorporation of the heparin-binding (i.e. ECM binding) domain in exon 7 increases matrix affinity10 and leads to induction of migration signaling over proliferative signaling9. When VEGF without an ECM binding domain is presented to endothelial cells, the resulting blood vessel morphology becomes large and leaky, with extensive lumens8. With the ECM binding domain included, VEGF leads to a vessel architecture that is smaller in diameter with more branching points. VEGF genetically engineered with a deletion of the MMP-cleaveable sequence, but with the ECM binding domain intact leads to a dense network of small capillaries8. From a signaling perspective, VEGF-matrix affinity affects the tyrosine phosphorylation profile and kinetics of VEGFR-2, along with downstream marker activation. In the soluble case, tyrosine residue Y1175 is preferentially phosphorylated, which leads to phospho-AKT activation9. This pathway is involved in permeability and survival11, 12. When VEGF is matrix bound, β1 integrin clusters with VEGFR-2 and phosphorylation of VEGFR2 at Y1214 is extended, as is phosphorylation of p389. These pathways are involved in cell migration11. Although these studies indicate modulation of signaling cascades by matrix bound VEGF, little is known about the direct consequence of covalently binding VEGF.
Previously, we developed a method to bind VEGF either electrostatically or covalently on a heparin functionalized surface13. The ability of covalently bound VEGF to phosphorylate VEGFR-2 in both a transfected cell line (PAE) and an endogenously producing VEGFR-2 cell line (HUVEC) were shown and VEGF activity was demonstrated via a cellular proliferation assay. In this work, we aim to study covalently bound VEGF in the context of a signaling analysis. Traditionally, cell signaling is studied when confluent cell monolayers are exposed to soluble growth factor for a few minutes. While groups have attempted to study matrix bound growth factor signaling, no method exists where the time scale of exposure is comparable. Usually, surfaces are made, then cells are grown on the surfaces and the signaling is analyzed after hours or even days14. Here, we introduce a method that combines the technology of our surface with a confluent cell monolayer on flexible PDMS. The exposure of the cells can be controlled and limited to the minutes scale, allowing direct comparison to signaling mechanisms observed with the traditional approach. We examined whether VEGF ligand internalization is necessary for VEGFR-2 phosphorylation and downstream signaling, and evaluated the half-life of VEGF after covalent immobilization. To further test our hypothesis that VEGF internalization is reduced and not required for VEGFR-2 activation, we developed a mathematical model using mass action kinetics to describe the trafficking of the ligand and receptor during receptor-mediated endocytosis.
Materials and Methods
Materials
(1-Mercapto-11-undecyl) tetra (ethylene glycol) (EG-OH) was purchased from Asemblon (Redmond, WA). (1-Mercapto-11-undecyl) septa (ethylene glycol) amine (EG-NH2) was obtained from ProChimia (Evanston, IL). Heparin sodium salt from porcine intestinal mucosa was purchased from Alfa Aesar (Ward Hill, MA). Vascular Endothelial Growth Factor (VEGF) was kindly provided by Genentech (South San Francisco, CA). Human umbilical vein endothelial cells (HUVEC) were either a kind gift from Dr. Andrew Putnam of UC Irvine (now University of Michigan) or purchased from Lonza (Walkersville, MD). All other reagents and products were purchased from Fisher Scientific unless noted otherwise.
Cell culture
HUVECs were cultured in EGM-2 complete medium (Lonza, Walkersville, MD) at 37°C and 5% CO2. The HUVECs were first obtained and cultured at passage 2. In order to provide enough cells for all of the experiments, the cells were expanded and frozen at passage 7. For each experiment, the cells were thawed and grown for 2 days in a T75 flask (Corning, Corning, NY). The cells were then split using standard technique and plated 1:2 onto PDMS sheets.
PDMS functionalization and culture with cells
Poly-dimethoxy silane (PDMS) sheets were made as previously described13. Briefly, base silane and curing agent were mixed in a 10:1 ratio, degassed and cast onto a 0.75 mm gel casting plate before being placed in a 170°C oven for 10 minutes to cure. After the cured PDMS sheets were removed, the sheets were placed in a 1:1 v/v methanol:hydrochloric acid solution for 30 minutes at room temperature, then dried and incubated in a 5% v/v amino-propyl triethoxysilane (APTES, Sigma-Aldrich, St. Louis, MO) solution in ethanol overnight at room temperature under inert atmosphere. The sheets were sterilized in 70% ethanol, then incubated with 10 μg/ml fibronectin solution (Millipore, Temecula, CA) for 1 h at 37°C. Harvested cells were plated and cultured for two days. Prior to the experiment, the cell culture was starved with serum-free media for 6 hours. Where indicated, the cells were pre-treated for 30 minutes with 80 μM dynasore, an inhibitor of dynamin, in order to investigate the requirement of receptor endocytosis for cell signaling9, 15. Five minutes before exposure to the cells, sodium vanadate (0.1 mM) was added to the cell culture media9, 16.
VEGF-functionalized gold slides and treatment with cells
VEGF-functionalized glass slides were made as previously described13. Briefly, standard laboratory glass slides were placed in an e-beam evaporator where 5 nm titanium and 30 nm of gold were deposited. The gold slides were incubated with alkanethiol solutions (99% EG-OH, 1% EG-NH2) under inert atmosphere for 3 h at room temperature. A heparin solution was made by oxidizing 62.5 mg/ml heparin in 200 mM sodium periodate in 100 mM sodium acetate pH 4 for 30–60 minutes. The reaction was quenched with addition of glycerol, then diluted to 3 mg/ml heparin and adjusted to pH 7 with PBS. Heparin became photoactive by addition of azido-benzyl hydrazide (ABH, Pierce, Rockford, IL) for 2 hours at room temperature. The solution was then diluted to 1 mg/ml heparin and adjusted to pH 9–9.5 before incubating with the gold slides for 2 hours at room temperature. Then, the slides were incubated with 50 mM sodium cyanoborohydride in 100 mM sodium acetate pH 4 for 5 minutes at room temperature. Overnight incubation of VEGF at 4°C in 1% BSA-PBS at 200 ng/ml was followed by 365 nm wavelength UV light activation for 10 minutes to lock VEGF covalently to the surface at a density of 100 pg/cm2. The VEGF functionalized slides were exposed to cells on PDMS surfaces for the indicated time points. A control, soluble VEGF at 2 ng/ml, was based on a mass transfer analysis that showed the boundary layer surrounding the cells did not have a significant effect in reducing the apparent VEGF concentration at the cell surface (Supplemental Figure 1). Given the VEGF density on the surface and the surface area of cells exposed, 2 ng/ml was an equivalent solution concentration.
Western blot analysis
After growth factor treatment at 37°C, the sheets were placed in Petri dishes on ice. The sheets were rinsed twice with ice cold PBS supplemented with 0.2 mM sodium vanadate9. After aspirating all remnants of liquid from the PDMS sheets, 100 μl of lysis buffer (1% Non-idet, 10 mM Tris-HCl, pH 7.6, 150 mM NaCl, 30 mM sodium pyrophosphate, 50 mM sodium fluoride, 2.1 mM sodium orthovanadate, 1 mM EDTA, 1 mM phenylmethylsulfonyl fluoride, and 2 μg/ml of aprotinin) was added to the surface and scraped9. Insoluble cell material was removed by centrifugation at 4°C for 10 min at 14,000 rpm (Beckman Coulter Microcentrifuge 22R, Brea, CA). Equal amounts of cell lysate (BCA assay, Bio-Rad, Hercules, CA) were diluted in 5X loading buffer (1 M Tris-HCL, pH 6.8, 20% SDS, 50% glycerol) supplemented with 5% (v/v) β-mercaptoethanol, boiled for 10 min at 70°C, separated by SDS-PAGE (8% resolving, 2 h at 130 V), and transferred to nitrocellulose membranes (2 h at 400 mA). The membranes were incubated in blocking buffer (5% milk in 0.1% Tween-20 in TBS) for 1 h at room temperature before overnight incubation with primary antibodies. Phosphorylated proteins were detected by immunoblotting using anti-phosphotyrosine antibodies (pVEGFR-2/1175 Cell Signaling, Boston, MA; pVEGFR-2/1214 Invitrogen, Carlsbad, CA; and phospho-p38 Cell Signaling, Boston, MA in blocking buffer) followed by secondary antibodies coupled with horseradish peroxidase (200 ng/ml, Invitrogen, Carlsbad, CA, 1 h at room temperature) and visualized by chemifluorescence (ECL detection reagents, GE Healthcare, Piscataway, NJ) using a Typhoon scanner (GE, Amersham Biosciences, Piscataway, NJ). Protein-loading control was assessed by Western blot using anti-VEGFR-2 or anti-p38 (Cell Signaling Technology, Boston, MA). Typhoon images were analyzed and normalized with ImageJ software. Statistical comparisons were done with 3 independent experiments. For p38 blot data, film exposure was utilized as previously described9.
Cdc42 GLISA
Cells were treated for 60 minutes following the same method mentioned earlier. After treatment, the cells were lysed and quantified with ProteinRed. The samples were assayed with the CytoSkeleton (Denver, CO) cdc42 GLISA kit following manufacturer’s instructions. Samples loaded at 0.5 mg/ml, and absorbance read at 490 nm.
125I-VEGF internalization
VEGF labeled with Iodine-125 was purchased from Perkin Elmer (Santa Clara, CA) and diluted 1:100 in VEGF without Iodine-125. A standard curve was made to convert CPM to amount VEGF. The same procedure for gold slide synthesis was used, except with this solution of radiolabeled VEGF. The gold slides were exposed to cells on PDMS for the indicated time points. Both the gold slide and PDMS were read in a gamma counter. VEGF internalization curves were constructed based on the CPM readings and conversion via the standard curve.
A pulse-chase experiment was performed to begin to study the receptor-recycling dynamics of Vs, Ve and Vc. First, bound and soluble VEGF (cold) were exposed to cells for approximately 3 seconds, and then immersed in soluble 125I-VEGF (hot) for 30 minutes. Second, bound and soluble VEGF (cold) were exposed to cells for 30 minutes, followed by immersion into 125I-VEGF (hot) for 30 minutes. An additional control was inhibition of endocytosis by a 30-minute cell pre-treatment with 80 μM dynasore, a dynamin inhibitor9, 15, and then treatment with hot and cold soluble VEGF.
Optical trap rupture force measurements
Cells were cultured on glass bottom culture dishes (MaTek, number 0, Ashland, MA) and supplemented with 80 μM dynasore (Sigma-Aldrich, St. Louis, MO) 30 minutes before the experiment. Amine-functionalized polystyrene beads 3 μm in diameter (Spherotech, Lake Forest, IL) were incubated with oxidized heparin, then reduced with sodium cyanoborohydride. Following a 5% BSA incubation, the beads were incubated with 200 ng/ml VEGF overnight at 4°C. The beads were exposed to 365 nm wavelength UV, then washed three times with PBS-T and stored in a 1 mg/ml heparin release solution for three days. On the day of the experiment, the beads were introduced to the cells.
Custom laser tweezers were integrated with an Olympus IX81 Inverted Microscope. A 1064 nm Ytterbium fiber laser (IPG) was focused by a PlanApo 60x 1.45NA oil immersion objective lens to trap a microsphere. Forward scattered light is collected by a high NA Olympus condenser and focused onto a quadrant photo diode (QPD) positioned conjugate to the back focal plane of the objective lens. Petri dishes were coarsely positioned by a stepper motor microscope stage and again with nanometer resolution by a piezoelectric insert. Samples were maintained at 37°C by an objective heater. Olympus Slidebook software and custom software coded in National Instruments LabView controlled data collection and microscope actuation.
Computational modeling and parameter fitting
Computational kinetic models were created using SimBiology (MathWorks) based on the radiometric assays of VEGF internalization over time. The purpose of this model was to generate hypotheses and support experimental results. A reaction mechanism describing the process of VEGF internalization into the cell was developed, with proposed ligand and receptor fates assigned unique rate constants. Differential equations for ligand-receptor binding, activation of the dimer, and subsequent ligand and receptor recycling were utilized in each simulation. Models were based on kinetic mass-action principles with the initial reaction rate parameters derived from literature where possible (kbind, kunbind, kRrecycle, kLrecycle)17, 18. The models were then fit to the experimental data by parameter fitting of the rate constants. Rate constant fitting was based on reducing the deviation of the model from its matching experimental data for a given set of kinetic rate parameters:
Error was calculated as the sum of least squares of modeled versus experimental data for the total N recorded experimental data points. Minimization of the error was performed by a non-linear minimum search algorithm in MATLAB (MathWorks) for the kinetic rate parameters that generated models that best fit the data. Order of magnitude changes in the parameters were tested to be sure the residual error was at an absolute minimum and not one of many local minima. In the proposed reaction mechanism, ligand-dependent and ligand-independent receptor-mediated endocytosis was tested for the bound case to determine which event was more dominant based on the values of the kinetic constants controlling each scenario. This model was developed and executed in order to support the experimental observations made in the radiometric assays.
Statistical analysis
Data are presented as mean ± standard deviation. To identify significant trends in data, statistical comparisons were performed by one-way ANOVA with post-test using the Tukey method. Data were considered significantly different if p < 0.05.
Results
Covalently bound VEGF sustains VEGFR-2 phosphorylation
Previously, we developed a method to covalently bind VEGF (Vc) or electrostatically bind VEGF (Ve) to a heparin-functionalized surface and showed its ability to phosphorylate VEGFR-213. The same method was applied here and cells were exposed to the growth factor-coated surface from 0 to 60 minutes to determine the kinetics of phosphorylation (Figure 1A). At the indicated time points, cell lysates were collected and analyzed by Western blot for phosphorylation of VEGFR2 at Y1175 and Y1214 (Figure 1B–E). The soluble treatment (Vs), 2 ng/ml, was chosen based on a mass transfer calculation and data previously published to be an equivalent concentration (100 pg/cm2) as that initially exposed to the cells in the surface treatment13 (Supplemental Figure 1). The mass transfer model indicated that the boundary layer surrounding the cells had a negligible effect on the diffusion of soluble VEGF from the bulk solution to the surface of the cell. Thus, no gradients in VEGF concentration were present. The boundary layer ( < 10 μm19) was below the threshold for significantly affecting diffusion to cell calculated in the model ( > 20 μm, Supplemental Figure 1). Therefore, for the amount of cells exposed in the given surface area, 2 ng/ml was an equivalent concentration of VEGF from the surface exposure to the soluble treatment. This was done to ensure that the behavior observed was dependent on the presentation of the growth factor. While all treatments except for the negative control (Vn) induced significant levels of phosphorylation at Y1175 during early time points, only Vc treatment led to an extension of this phosphorylation at 60 minutes (p < 0.05, Figure 1B–C). Similar to what has been previously observed for matrix bound VEGF9, Vc and Ve both generated a stronger response from Y1214 of VEGFR-2 than Vs (Figure 1D–E). Vc, again, extended phosphorylation of VEGFR-2 at Y1214 up to 60 minutes over Vs. At 45 and 60-minutes of the treatment, Vc increased the phosphorylation intensity over Ve (p < 0.05, Figure 1E).
Figure 1.

Covalent binding of VEGF to heparin surface extends phosphorylation of VEGFR-2 up to 60 minutes. (A) System set-up. Gold slides are functionalized with VEGF as outlined in materials and methods, and cells are plated on flexible PDMS sheets. First, the cells from the flexible PDMS sheets are flipped onto the cells to mediate contact between the cells and the VEGF on the gold surface. After the cells are exposed to the surface for the desired time, the flexible PDMS sheet is flipped back and cells are lysed with lysis buffer. The cells are then scraped in a petri dish and lysate is collected and analyzed. (B) Western blot data for Y1175 from 0 to 60 minutes. Blots are re-probed for total VEGFR-2. At 60 minutes, Vc sustains activation over Ve and Vs. (C) Quantification of pY1175 for Vc, Ve, and Vs. Vc leads to a higher phosphorylation level at 60 minutes (*p < 0.05). (D) Western blot data for Y1214 from 0 to 60 minutes. Blots are re-probed for total VEGFR-2. Vc and Ve show increased activation over Vs for all time points, and Vc shows extended activation over Ve at 45 and 60 minutes. (E) Quantification of pY1214 for Vc, Ve, and Vs. Vc leads to a higher phosphorylation level over Vs at all time points, and Ve at 45 and 60 minutes (*p < 0.05) (n = 3).
Covalently bound VEGF extends p38 pathway signaling
Activation of Y1214 on the carboxy-terminal domain of VEGFR-2 leads to activation of cdc42 and p38, members of the migration pathway in HUVEC signaling. Since Y1214 is activated more strongly in the bound cases, cdc42 and p38 activation were analyzed to study the effect of Vc on the migration pathway. Both cdc42 and p38 displayed increased and extended magnitude of activation through 60 minutes for Vc (Figure 2A–B, p < 0.001 for cdc42). Vc and Ve had greater than a two-fold increase in activation of p38 over Vs at 60 minutes of treatment (Figure 2B, Supplemental Figure 2).
Figure 2.
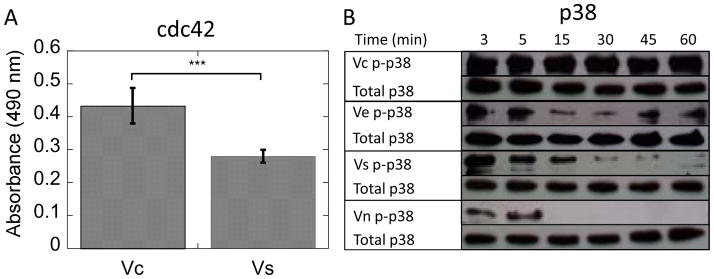
(A) cdc42 GLISA data for Vc and Vs treated cells after 60 minutes of treatment shows increased activation of this pathway by Vc (p < 0.001). (B) Western blot data for phospho and total p38 for various treatment conditions. Vc and Ve increase p38 activation more than two-fold over Vs at 60 minutes. (n = 3).
Inhibition of receptor endocytosis decreased Y1175 activation and increased Y1214 activation
As recently reported, internalization of the receptor is required for receptor phosphorylation9, 15. Intuitively, if VEGF is covalently locked to the surface, the receptor must either remain at the surface or internalize without VEGF. Covalently bound VEGF can be removed from the surface by protease action, but it was assumed that MMP concentration was low, especially in the early time points of activation after the cells were quiescent and serum starved for several hours. Also, it was thought unlikely that VEGF could be removed from the matrix at a rate and magnitude high enough to generate the responses we were observing. We hypothesized that another mechanism was responsible for the data. When inhibiting receptor endocytosis with addition of dynasore to the cell culture medium before activation, Y1175 phosphorylation was reduced (Figure 3A), with Vc, Ve, and Vs resulting in a 57.6%, 85.2%, and 81.3% decrease, respectively, after 5 minutes of treatment. However, both Vc and Ve resulted in 1.5-fold increase in Y1175 phosphorylation at 30 minutes (Figure 3A). Interestingly, Y1214 phosphorylation was increased with addition of dynasore (Figure 3B). For Vc and Vs, the fold increase in activation was at least 2-fold. In Ve, the increase in activation was 1.1-fold for 5 minutes, and 1.4-fold for 30 minutes. In these quantifications, the time point exposed to dynasore was normalized relative to the corresponding non-treated time point (no VEGF added), which was assigned a value of 1.
Figure 3.
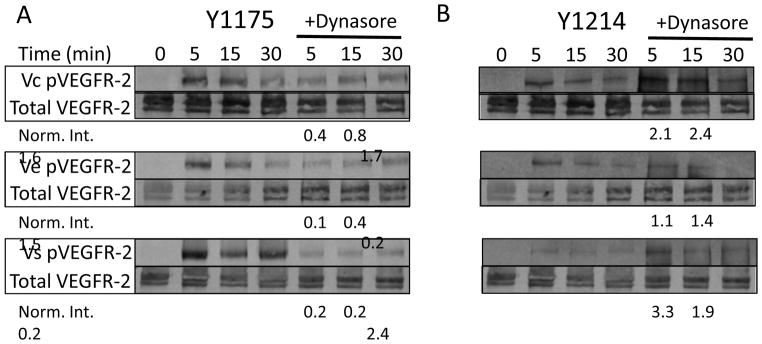
VEGFR-2 phosphorlation requires VEGFR-2 internalization, but not VEGF internalization. (A) Western blot data of phospho-VEGFR-2 (Y1175) under the different treatment conditions for treatment times of 5, 15, and 30 minutes, with and without addition of 80 μM dynasore 30 minutes before cell treatment. Dynasore inhibits receptor endocytosis and decreases Y1175 activation in all cases. Interestingly, Vc is still able to produce some phosphorylation even in the presence of dynasore. The dynasore time point is normalized to the corresponding non-dynasore time point. (B) Western blot data of phospho-VEGFR-2 (Y1214) under the different treatment conditions for treatment times of 5, 15, and 30 minutes, with and without addition of 80 μM dynasore 30 minutes before cell treatment. Interestingly, dynasore increases Y1214 activation in all cases. The dynasore time point is normalized to the corresponding non-dynasore time point.
Covalently bound VEGF shifts VEGF affinity toward matrix and away from VEGFR-2
Covalent binding of VEGF to a biomaterial surface may disrupt the normal physiological interactions between the matrix, VEGF, and VEGFR-2. To quantify the mechanical changes induced by introduction of the covalent bond between VEGF and the matrix, we measured rupture forces. Optical trap technology allows a user to utilize lasers to move polystyrene beads next to cells and measure cell-bead interactions (Figure 4A). Heparin was attached to amine-functionalized 3 μm polystyrene beads using the same chemistry to form the surface13. VEGF was immobilized in the same manner as previously described, and the beads were placed next to HUVECs incubating in serum-free media to allow binding to occur. Once the bead began to interact with the cell, the optical laser oscillated for several minutes, and rupture force measurements were recorded. Vc resulted in a right shift of the histogram (6–12 pN) as compared to Ve (3–8 pN), indicating that the rupture force increased when the covalent bond was introduced (Figure 4B).
Figure 4.
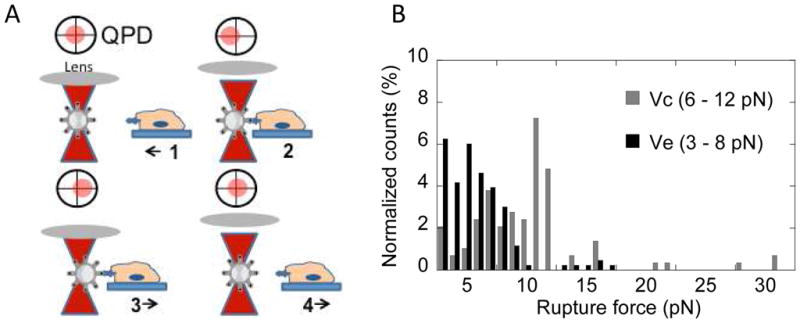
(A) Optical tweezers method follows Kotlarchyk et al45. First, the laser traps the bead. Second, the bead is placed next to the cell and begins interaction with cell. Third, the laser drags bead away from cell while interaction occurs. The displacement of the bead from the laser is proportional to the rupture force. Fourth, the system returns to step one. (B) Histogram shows Ve (dark) and Vc (gray) rupture force distributions. Ve has a range of 3–8 pN while Vc mode is shifted to the right, 6–12 pN, indicating an increase in rupture force required with introduction of the covalent bond.
To answer the question of why Vc increased the rupture force, we turned to affinity data. Under normal physiological conditions, VEGF has a greater affinity for VEGFR-2 than for matrix components such as heparin, collagen, and fibronectin17, 20. The dissociation constants are 0.1 and 40–160 nM for VEGF-VEGFR-2 and VEGF-matrix, respectively, in the absence of a covalent bond (Table 1)17, 20. However, when a covalent bond is introduced between VEGF and the matrix, the theoretical affinity preference shifts toward VEGF and the matrix.
Table 1.
Reported and calculated values for dissociation constants and binding energies of various affinity pair relationships in system
| Affinity Pair | KD (nM) | Binding Energy (kJ/mol) |
|---|---|---|
| Ligand-Receptor* | 0.10 | 53.41 |
| Ligand-Matrix† | 40.00 | 43.90 |
Calculated from values reported in 17 KD=k2/k1. ΔG = RT ln (1/KD).
20. ΔG = RT ln (1/KD).
Internalization of covalently bound VEGF is reduced compared to soluble and heparin bound VEGF
The dynasore and rupture force data identified a change in VEGF/VEGFR-2 dynamics that is dependent on the nature of the growth factor presentation. We hypothesized that this was a result of ligand remaining on the biomaterial surface during receptor phosphorylation. The fate of the ligand was studied using radiolabeled VEGF, with a gamma count performed on both the cell surface and the growth factor surface in order to track the transfer of ligand. Confluent HUVECs were exposed to equal amounts of Vc, Ve, or Vs from 0 to 60 minutes. After the exposure time, the cell surface and growth factor surface were separated and analyzed for presence of radiolabeled VEGF. The data is presented as moles of ligand internalized. Of the 500 fmol VEGF supplied (Supplemental Figure 3), Vc resulted in internalization of approximately 0.4 fmol VEGF, while Ve and Vs had 0.8 fmol and 1 fmol VEGF internalized, respectively (Figure 5A). The 1 fmol VEGF internalized for the Vs condition matched the known density of receptors on the HUVECs18, 21.
Figure 5.
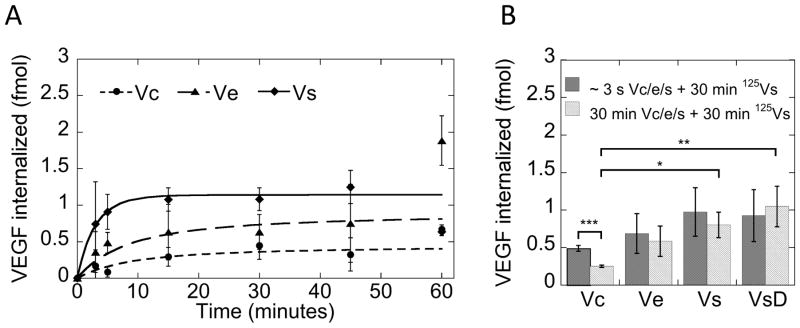
(A) I125-VEGF data indicates covalently binding retards internalization of VEGF during receptor endocytosis. Ve can be removed from heparin surface, but more Vc remains on surface during receptor endocytosis. Model fits are from the chemical reaction kinetics model. Incorporation of the idea of non-internalizing ligand leads to fits of the bound VEGF data. (B) Receptor quenching experiment in which the cells are first exposed to growth factor surface for a few seconds or 30 minutes, and then followed with exposure to I125-VEGF for 30 minutes. The results indicate that receptor recycling is severely altered by covalently bound VEGF (*p < 0.05, **p < 0.01, ***p < 0.001).
We next performed a receptor quenching experiment with radiolabeled VEGF to investigate the receptor-recycling dynamics of the system. In this experiment, the cells were exposed to cold VEGF in Vc, Ve or Vs forms for either a few seconds or 30 minutes, and then pulsed with hot, radiolabeled soluble VEGF for 30 minutes to allow for binding of radiolabeled ligand to residual receptors on the cell surface and internalization. There was a significant reduction in the internalized ligand for the Vc situation, suggesting less receptor availability because of a decrease in receptor recycling (Figure 5B, *p < 0.05, **p < 0.01, ***p < 0.001). Ve and Vs did not show a significant decrease in receptor availability, indicating that receptor recycling was not affected (Figure 5B). When treated with the endocytosis inhibitor dynasore, soluble VEGF (VsD) showed no decrease in receptor availability. The data here represented VEGF bound to the receptor on the cell surface. The 1 fmol of VEGF adhered to the cell surface in this case further supported the idea that Vs saturated the receptors in the internalization assay.
To better understand the mechanisms behind the kinetics of internalization, a mathematical model was developed to describe the trafficking of VEGF and VEGFR-2 during the internalization process. It was hypothesized that the soluble and bound cases undergo different binding and internalization mechanisms described by the following equations:
| Soluble | Bound | ||
|---|---|---|---|
|
|
|
||
|
|
|
||
|
|
|
||
|
|
|
||
|
|
|
||
|
|
|
||
|
|
In this model, VEGF internalization in the soluble case begins by ligand (VEGF, L) binding to receptor (VEGFR-2, R). The constants kbind and kunbind are the forward and reverse reaction constants17, 18. This binding event leads to formation of a complex (C) between ligand and receptor. Two complexes dimerize (D) with kdimer and kundimer as the forward and reverse reaction constants, which leads to internalization of the dimerized complex (Di) and subsequent activation of signaling cascades controlled by the rate constant kintern. During the dimerization and activation phase, the receptor undergoes conformational changes14, 22, 23 and internalization. Internalized dimers dissociate over some time scale into internalized receptors (Ri) and ligands (Li) with rate constant kdissoc. To avoid too many parameters being fit by the radiometric data, this step was described by a single kinetic rate constant (kdissoc), which includes the rates of Di→Ci→2Ri + 2Li. The internalized ligands and receptors then have the potential to be degraded or recycled to the cell membrane surface (kRrecycle and kLrecycle 24).
In the bound case, the initial steps are similar to the soluble case controlled by kinetic constants of the same values as their respective counterpart (kbind, kunbind, kdimer, kundimer). However, two options were proposed for the fate of the ligand based on the observations in the radiometric assay. Free ligand can either be regenerated at the surface by dissociation of the dimer prior to internalization (described by kdissoc for the bound model) and receptor internalization without the ligand (described by kbreak) or internalized into the cell, as is the case with soluble (described by knobreak). Also, the dissociation of the dimer in the bound case due to internalization has two options: dissociation in the usual sense after the entire complex is internalized (knobreak) or the dissociation occurring due to receptor internalization without the ligand (kbreak). Receptor and ligand recycling constants for the bound case were determined using the parameter fitting algorithms.
The radiolabeled ligand internalization data was used to fit the unknown parameters of these three models (Vs, Ve, and Vc). Error between the predicted values and the data was reduced by adjusting the rate constants until a suitable fit was found. In the bound case, the constants governing the breakdown of the dimerization species gave insight into the fate of the ligand during the trafficking process. For the electrostatic situation, the rate at which the receptor and ligand would both be internalized (knobreak) was much greater than the rate at which the receptors and ligands unbind at the cell surface without being internalized (kdissoc), indicating that it was much more likely for the dimer to be internalized as dissociated ligands (Li) and receptors (Ri) than to unbind at the cell surface (L and R). The rate at which the receptor internalized and left the ligand at the cell surface (kbreak) was greater than knobreak, suggesting that receptor internalization and activation without the ligand was possible. For the covalent case, kbreak was an order of magnitude greater than knobreak, suggesting that ligand internalization was reduced compared to the electrostatic and the soluble case and that ligand was left at the surface (Table 2). The dissociation constant, kdissoc, for Vc was two orders of magnitude smaller than the same constant for Vs, indicating that the dimer complex was longer lasting in the covalently bound case. Based on the constants of best fit, the model results suggested that recycling of the receptor was slowed with increasing affinity of growth factor for the matrix (Vs > Ve > Vc).
Table 2.
Fit parameters for curves; L0 is calculated; R0, kbind, kunbind* are from sources (kdimer and kundimer are 1.12×10⁸ M−1s−1 and 1.17 s−1, respectively)
| Constant | Units | Vs | Ve | Vc |
|---|---|---|---|---|
| kintern | s−1 | 4.700 × 10⁻³ | -- | -- |
| kbreak | s−1 | -- | 8.400 × 10⁻³ | 8.400 × 10⁻³ |
| knobreak | s−1 | -- | 1.300 × 10⁻³ | 6.100 × 10⁻⁴ |
| kdissoc | s−1 | 1.878 × 10⁻¹ | 1.390 × 10⁻⁶ | 2.300 × 10⁻³ |
| kRrecycle | s−1 | 2.800 × 10⁻³ | 1.270 × 10⁻¹⁵ | 7.840 × 10⁻¹⁶ |
| kLrecycle | s−1 | 3.970 × 10⁻³ | 1.030 × 10⁻¹⁰ | 8.960 × 10⁻¹¹ |
17, 18
Covalently binding VEGF increases growth factor half-life
The internalization of VEGF was significantly reduced when covalently bound to the surface. Sustained activation of VEGFR-2 may be a result of ligand regeneration at the surface and stability of VEGF when bound to the biomaterial. To study if Ve and Vc have increased stability against degradation compared to Vs, we performed two types of experiments. In the first experiment (long term stability), HUVECs were exposed to Vc surfaces that were incubated at 4°C for up to 27 days, Vc surfaces that were incubated at 37°C for up to 11 days, and Vs solutions (2 ng/mL) that were stored at 4°C for up to 23 days. At the indicated time points, the slides were exposed to untreated serum starved cells for 5 minutes to assess activity through phosphorylation of VEGFR-2 at Y1175. Vc stored at 37°C had similar stability as Vs stored at 4°C (Figure 6A). Vc stored at 4°C was stable throughout the course of the experiment, still exhibiting 21% activity at day 27 (Figure 6A). The normalized quantifications showed stability curves that resembled autocatalytic degradation (Figure 6B). A fit equation derived from autocatalytic degradation was used to calculate the half-life25. Vc at 37°C and Vs at 4°C have the same half-life (2 days). Vc at 4°C had a half-life of one week.
Figure 6.
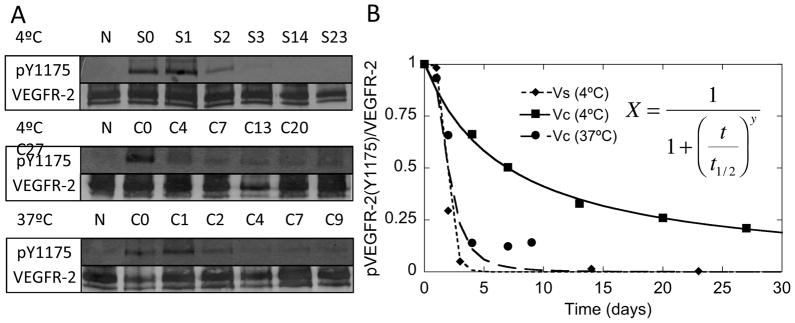
Vc extends VEGF half-life. (A) After storage at 4°C and 37°C for the indicated number of days, Vc slides were exposed to cells for 5 minutes and then probed for detection of phospho-VEGFR-2 (Y1175). Vc stored at 37°C and Vs stored at 4°C have similar half-lives, but Vc stored at 4°C has an extended half-life. (B) Quantification of bands from (A) were fit to mathematical model derived from autocatalytic degradation. Vc stored at 37°C and Vs stored at 4°C have a half-life of 2 days. Vc stored at 4°C has a half-life of one week. (N is Vn, S is Vs, C is Vc, and the numbers indicate days in storage).
In the second experiment (repeat exposure), untreated serum starved cells were exposed to the same surface for 30 minutes each for a total of four rounds of exposure. Both Vc and Ve phosphorylated VEGFR-2 (Y1175 and Y1214) at sustained levels through four rounds of 30-minute cell exposures (Figure 6B). Vs declined in activity toward the third and fourth round of treatments for Y1175, and showed little activity at Y1214 compared to bound, as shown previously. To assure the 100-min half life of soluble VEGF at 37°C did not lead to misinterpretation of the data, refreshments of the growth factor maintained a constant concentration throughout the refresh experiment9 (Figure 6B).
Discussion
VEGF is secreted in multiple isoforms that have different affinities for the extracellular matrix10. These differences in affinities for the ECM have been shown to result in different vascular morphogenesis8 and downstream signaling9. In this report, we used an engineered surface that could immobilize VEGF with different affinities, electrostatic (Ve) and covalent (Vc), to study intracellular signaling by Vc. Intracellular signaling with Ve was studied first to determine if the results were similar as those recently reported for VEGF bound electrostatically to collagen matrices9 and validate our bioengineered surfaces. In agreement with the previous report, Ve results in activation of Y1175/Y1214 and p38 in a manner similar to collagen bound VEGF. These results show that our bioengineered VEGF/heparin surfaces display similar intracellular signaling as VEGF bound to collagen matrices and demonstrates that our system can probe the behavior of Vc.
Covalently bound VEGF to biomaterials has been shown to induce angiogenesis in vivo6 and promote proliferation and cell migration in vitro4, 5. However, intracellular signaling by covalently bound VEGF has not been studied previously. Here we used our bioengineered Vc surfaces to probe intracellular signaling by covalently bound VEGF. Previously, investigating cell signaling from covalently bound growth factors was not possible for studies done on the order of minutes. By combining the technology of our growth factor surface with a flexible cell-binding PDMS material, we are able to now compare signaling by an immobilized growth factor to the extensive signaling studies reported for Vs. We found that the exposure of Vc to HUVECs extends phosphorylation of VEGFR-2 at Y1175 and Y1214, and prevents ligand internalization during receptor endocytosis. Further, we found that Vc can activate downstream signaling through cdc42 and p38 and that it does so for extended periods.
VEGFR-2 phophorylation by Vc, Ve, and Vs was studied in the presence of the endocytosis inhibitor dynasore. Our goal in these experiments was to show that inhibition of VEGFR-2 endocytosis prevented receptor phosphorylation, to further prove that VEGFR-2 internalization is required for phosphorylation as previously shown 9, 15. The data from the endocytosis-inhibition experiments (Figure 2A) showed a greater than 50% decrease in phosphorylation9, 15. Interestingly, Vc is still able to phosphorylate despite the addition of dynasore, albeit with a significant decrease. For Vc, this data would suggest that either the receptor was internalized without VEGF or that the VEGF/VEGFR-2 bond strength was able to detach Vc and internalize it. To determine which was more likely, we performed a series of experiments to evaluate whether Vc was internalized along with VEGFR-2 as is the case in Ve/s. We used radiolabeled VEGF to determine VEGF location after exposure to cells (Figure 2D). For Vs, 1 fmol of VEGF is internalized, which according to calculations, saturates the available receptors. For Ve, 0.8 fmol of VEGF is internalized. For Vc, only 0.4 fmol of VEGF in internalized, suggesting that the phosphorylation observed in this condition results in part from VEGFR-2 internalized without VEGF.
To further test our hypothesis that VEGFR-2 is internalized without Vc, we used theoretical bond strengths and optical tweezers to determine the likelihood that the VEGF-VEGFR-2 bond is broken in the Vc condition. Under normal physiological conditions, VEGF has a greater affinity for VEGFR-2 (KD = 0.1 nM) than for matrix components such as heparin, collagen, and fibronectin (KD = 40–160 nM)17, 20. However, when a covalent bond locks VEGF to the matrix, the theoretical affinity preference shifts toward VEGF and the matrix. Thus, VEGF/matrix affinity in the covalent case is greater than the VEGF/VEGFR-2 affinity. The optical tweezers experiments indicate that the rupture force for Ve is 3–8 pN while the rupture force for Vc is 6–12 pN. The introduction of the covalent bond shifts the rupture force mode to the right in the direction of increasing bond strength. When compared to rupture force values found in the literature for removal of a transmembrane protein from the cell surface, this data is in the correct range. The force required to remove a transmembrane protein from a cell is 160 pN, which is equivalent to a binding energy of 293 kJ/mol26. If our data were interpreted as 3–8 pN for VEGF-heparin interaction and 6–12 pN for VEGF-VEGFR-2 interaction, then these force measurements would correspond to binding energies of 43.90 kJ/mol and 53.41 kJ/mol, respectively (Table 1). Taken together, these results suggest that it is possible for VEGF to remain on the surface while VEGFR-2 is internalized.
Activation of Y1214 leads to downstream signaling through cdc42 and p3811. For Vc, Y1214 remains more activated after 60 minutes of exposure than Ve and Vs. Activation of cdc42 is statistically increased at 60 minutes for Vc over Vs. p38 is over two-fold greater in activation for Ve and Vc over Vs. While Vs is more active at the 3-minute time point, Vc and Ve sustain activation through 60 minutes (Supplemental Figure 2). The activation of downstream markers in the migration pathway could be advantageous in promoting perfusion of tissue-engineered implants. Bound VEGF is capable of sustaining activation of this pathway.
The addition of dynasore shows a decrease in Y1175 phosphorylation, as expected. Interestingly, an increase in Y1214 phosphorylation is also observed. This motivates further study into the time and place of these phosphorylations, and also into the phosphatases that control these interactions. Recent research has suggested that VE-PTP and TC-PTP may independently control the different phosphorylation sites on VEGFR-215, 27, 28.
Binding VEGF to the heparin-functionalized surface extends the half-life of VEGF. We performed two experiments to test the stability of Vc, a repeat exposure experiment and a long-term stability experiment. For the repeat exposure experiment, despite being exposed to new cell monolayers at 37°C during four phosphorylation studies, the surface maintained its ability to phosphorylate VEGFR-2 (Y1175 and Y1214) at the same level. This suggests that the growth factor retains its activity and it is capable of initiating repeated phosphorylation cycles. For the long-term stability experiment, Vc was still able to phosphorylate VEGFR-2 (Y1175) after 5 minutes of treatment to the extent tested (27 days when stored at 4°C and 9 days when stored at 37°C). As a comparison, Vs loses activity after 2 days with the same or more favorable storage conditions (4°C in PBS). Specifically immobilizing protein stabilizes the molecule and extends the half-life29. Biomaterials that utilize covalent attachment of growth factors will greatly enhance the tenure of active protein.
During the kinetic analysis, the half-life of soluble VEGF (100 min at 37°C)9 may become an issue when exposing Vs to cells for 60 minutes. However, the shape of the Y1175 phosphorylation kinetic curve is similar between Vs and Ve, indicating that the changes observed between Ve/s and Vc are not due to molecular instability. Further, this issue has been investigated previously9.
The VEGF internalization data shows that with increasing affinity of VEGF for the surface, internalization during receptor endocytosis decreases. Internalization of the ligand is not halted, however, most likely due to eventual MMP release8, 30, or lack of complete covalent locking on all VEGF surface molecules13. The decrease in VEGF internalization observed for Vc may also be a result of changes in the internalization machinery due to sustained signaling of VEGFR-2. In Ve, a substantial increase is observed in the amount of internalized ligand at 60 minutes. The same trend, to a lesser extent, is also noticeable in Vc. This could be due to MMP-mediated release, with MMP concentration accumulating after 60 minutes of VEGF exposure that leads to a threshold concentration capable of catalyzing the release of VEGF from the surface. This time scale correlates with the time required for MMP production and secretion after cellular exposure to VEGF31–33. Here it is assumed that the initial MMP concentration is low since the cells were confluent and quiescent on the PDMS surface31. Vs shows the opposite trend with a slight decrease in the internalized ligand. Since VEGF is internalized at the beginning time points, this could represent degradation of the VEGF and pumping out of the iodinated fragments.
The lack of receptor recycling in Vc based not only on the model analysis but also from the experimental data mimics what has been found during characterization of the EGF system for tethered growth factors14. This system also had a decrease in receptor recycling when growth factor was covalently bound to a surface. Ligand binding to the receptor induces conformational changes that promote downstream kinase activation and scaffolding proteins binding to cytoplasmic tails of receptor-tyrosine kinases. The downstream signal cascades that are initiated are dependent upon the ligand binding and induced conformational changes. A well-studied example of this is the EGFR system, which binds a number of different ligands. EGF and TGFα both bind EGFR, but with different affinities. EGF induces receptor degradation and TGFα induces receptor recycling. The mechanisms identified that control this are length of time with which the ligand remains bound to the receptor after internalization into the endosomes due to pH change and the subsequent adaptor proteins scaffolded onto the cytoplasmic tails22. Therefore, effectively, the binding of the ligand, which happens prior to internalization, still affects the recycling and downstream behaviors. Additionally, tethering EGF to a biomaterial shows differences in Akt or ERK activation based on presentation of the ligand to its receptor14, 23.
Ve did not show a significant change in receptor recycling, as predicted by the model. In the model, constituents in the cellular microenvironment that can displace VEGF based on heparin affinity are not taken into account. This leads to release of VEGF from the surface, which then changes its character to soluble form. For example, protein secreted by the cells during exposure to the surface can have an affinity for the heparin surface that is similar to the affinity of VEGF for the surface. During the dynamic equilibrium when VEGF is undergoing binding and unbinding with the matrix, these secreted proteins can compete for the binding sites and displace VEGF, releasing it from the matrix and into the interstitial medium between the HUVECs and the VEGF surface.
Taken together, this data strongly suggests that covalently binding VEGF to a biomaterial surface alters the signaling activation profile. Vc and Ve specifically increase phosphorylation of Y1214, but activation of Y1175 is of a similar magnitude between Vc, Ve, and Vs. Since Y1175 activation requires receptor endocytosis9, 15, the receptor must be internalized in all these conditions. However, internalization of VEGF itself appears to not be necessary for VEGFR-2 phosphorylation and downstream signaling (p38 and cdc42 activation). Further, this data suggests that Y1175 is activated in the endosome, which is in agreement with previous reports 9, 15.
Strategies that involve VEGF incorporation into a biomaterial range from encapsulation of the growth factor34–36 to electrostatic sequestration37, 38 and covalent attachment1,4,6–8. Some of these strategies aim to control release of the VEGF over-time34–36, 39, 40. These methods result in the released VEGF diffusing to the cell surface receptor and initiating signaling in the soluble form. However, some of the strategies bind VEGF in a specific electrostatic interaction3, 41–43 or a non-degradable covalent linkage6, 44. These methods lead to VEGF interacting with VEGFR-2 in matrix-bound form. The latter has been shown to improve vascular density6 possibly because of the signaling pathways induced, as described here. Perfusion is a major obstacle to implementing regenerative medicine strategy to a wide range of disease states1. Biomaterial strategies that incorporate covalently bound VEGF and present the growth factor to the cell surface receptor in bound form can promote branching morphogenesis through cdc42/p38 signaling, which may lead to formation of a microvasculature that can support perfusion of the implant. Future methods should consider the incorporation of combinations of Vs, Ve, and Vc in order to form a more physiological, hierarchical blood vessel infrastructure in the engineered tissue implants.
Supplementary Material
Figure 7.

Vc, Ve, Vs, and Vn were exposed to multiple 30-minute rounds of cells, probed for detection of (A) phospho-VEGFR-2 (Y1175) and (B) phospho-VEGFR-2 (Y1214). Vc and Ve maintain phosphorylation of VEGFR-2 in both tyrosine residues through all four treatments. Vs begins to lose phosphorylation intensity during the third exposure for Y1175 and has lower activity for Y1214 overall.
Insight Box.
Cell signaling data is normally collected by exposing a confluent monolayer of cells to a soluble growth factor of interest. The interaction is studied over a course of a few minutes because that is the time scale for receptor activation and signal quenching. Recently, the field has noticed that matrix-bound growth factors lead to an altered profile of cell reaction. Although some groups have studied matrix bound growth factor signaling through plating cells directly on surfaces with the immobilized growth factor, no method exists where the cell signaling can be studied on the order of minutes. Here, growth factors are bound to a biomimetic SAM surface, while a confluent monolayer of cells is grown on a flexible PDMS material. Thus, the cells can be exposed to the immobilized growth factor by flipping the cell sheet on top of the modified surface. This exposure can be for several minutes and then analyzed.
Acknowledgments
We thank Talar Tokatlian for help editing the manuscript; Shayne Siegman and Kajaal Baheti for technical assistance; Carmen Warren and Helena Chia for assistance with equipment/supplies. This work was supported by grants from the National Institutes of Health (5R21EB009516-02 and 5R21EB007730-02) and by the Jonsson Comprehensive Cancer Center at UCLA. This material is also based on work supported by the National Science Foundation under the Science and Technology Center Emergent Behaviors of Integrated Cellular Systems (EBICS) Grant No. CBET-0939511 (MOP and ZTB).
Footnotes
Authorship contributions: S.M.A. and T.S. designed research, analyzed data and wrote paper; S.M.A. and E.M. performed research; Z.T.B. and M.O.P. designed and analyzed mathematical models; B.S. and E.B. performed and analyzed optical tweezers experiments; T.T.C. and M.L.I.A. contributed to the design of the experiments, analysis and new reagents/analytic tools.
Disclosure of conflicts of interest: The authors have no conflict of interest to declare.
References
- 1.Phelps EA, Garcia AJ. Curr Opin Biotechnol. 2010;21:704–709. doi: 10.1016/j.copbio.2010.06.005. [DOI] [PMC free article] [PubMed] [Google Scholar]
- 2.Sun Q, Silva EA, Wang A, Fritton JC, Mooney DJ, Schaffler MB, Grossman PM, Rajagopalan S. Pharm Res. 2010;27:264–271. doi: 10.1007/s11095-009-0014-0. [DOI] [PMC free article] [PubMed] [Google Scholar]
- 3.Peattie RA, Pike DB, Yu B, Cai S, Shu XZ, Prestwich GD, Firpo MA, Fisher RJ. Drug Deliv. 2008;15:389–397. doi: 10.1080/10717540802035442. [DOI] [PubMed] [Google Scholar]
- 4.Backer MV, Patel V, Jehning BT, Claffey KP, Backer JM. Biomaterials. 2006;27:5452–5458. doi: 10.1016/j.biomaterials.2006.06.025. [DOI] [PubMed] [Google Scholar]
- 5.Zisch AH, Schenk U, Schense JC, Sakiyama-Elbert SE, Hubbell JA. J Control Release. 2001;72:101–113. doi: 10.1016/s0168-3659(01)00266-8. [DOI] [PubMed] [Google Scholar]
- 6.Moon JJ, Saik JE, Poche RA, Leslie-Barbick JE, Lee SH, Smith AA, Dickinson ME, West JL. Biomaterials. 2010;31:3840–3847. doi: 10.1016/j.biomaterials.2010.01.104. [DOI] [PMC free article] [PubMed] [Google Scholar]
- 7.Phelps EA, Landazuri N, Thule PM, Taylor WR, Garcia AJ. Proc Natl Acad Sci U S A. 2010;107:3323–3328. doi: 10.1073/pnas.0905447107. [DOI] [PMC free article] [PubMed] [Google Scholar]
- 8.Lee S, Jilani SM, Nikolova GV, Carpizo D, Iruela-Arispe ML. J Cell Biol. 2005;169:681–691. doi: 10.1083/jcb.200409115. [DOI] [PMC free article] [PubMed] [Google Scholar]
- 9.Chen TT, Luque A, Lee S, Anderson SM, Segura T, Iruela-Arispe ML. J Cell Biol. 2010;188:595–609. doi: 10.1083/jcb.200906044. [DOI] [PMC free article] [PubMed] [Google Scholar]
- 10.Fairbrother WJ, Champe MA, Christinger HW, Keyt BA, Starovasnik MA. Structure. 1998;6:637–648. doi: 10.1016/s0969-2126(98)00065-3. [DOI] [PubMed] [Google Scholar]
- 11.Olsson AK, Dimberg A, Kreuger J, Claesson-Welsh L. Nat Rev Mol Cell Biol. 2006;7:359–371. doi: 10.1038/nrm1911. [DOI] [PubMed] [Google Scholar]
- 12.Murata T, Lin MI, Aritake K, Matsumoto S, Narumiya S, Ozaki H, Urade Y, Hori M, Sessa WC. Proc Natl Acad Sci U S A. 2008;105:20009–20014. doi: 10.1073/pnas.0805171105. [DOI] [PMC free article] [PubMed] [Google Scholar]
- 13.Anderson SM, Chen TT, Iruela-Arispe ML, Segura T. Biomaterials. 2009;30:4618–4628. doi: 10.1016/j.biomaterials.2009.05.030. [DOI] [PMC free article] [PubMed] [Google Scholar]
- 14.Platt MO, Roman AJ, Wells A, Lauffenburger DA, Griffith LG. J Cell Physiol. 2009;221:306–317. doi: 10.1002/jcp.21854. [DOI] [PMC free article] [PubMed] [Google Scholar]
- 15.Sawamiphak S, Seidel S, Essmann CL, Wilkinson GA, Pitulescu ME, Acker T, Acker-Palmer A. Nature. 2010;465:487–491. doi: 10.1038/nature08995. [DOI] [PubMed] [Google Scholar]
- 16.Luque A, Carpizo DR, Iruela-Arispe ML. J Biol Chem. 2003;278:23656–23665. doi: 10.1074/jbc.M212964200. [DOI] [PubMed] [Google Scholar]
- 17.Stefanini MO, Wu FT, Mac Gabhann F, Popel AS. BMC Syst Biol. 2008;2:77. doi: 10.1186/1752-0509-2-77. [DOI] [PMC free article] [PubMed] [Google Scholar]
- 18.Mac Gabhann F, Popel AS. Am J Physiol Heart Circ Physiol. 2004;286:H153–164. doi: 10.1152/ajpheart.00254.2003. [DOI] [PubMed] [Google Scholar]
- 19.Williams JB, Kutchai H. Biophys J. 1986;49:453–458. doi: 10.1016/S0006-3495(86)83654-2. [DOI] [PMC free article] [PubMed] [Google Scholar]
- 20.Cochran S, Li CP, Ferro V. Glycoconj J. 2009;26:577–587. doi: 10.1007/s10719-008-9210-0. [DOI] [PubMed] [Google Scholar]
- 21.Bikfalvi A, Sauzeau C, Moukadiri H, Maclouf J, Busso N, Bryckaert M, Plouet J, Tobelem G. J Cell Physiol. 1991;149:50–59. doi: 10.1002/jcp.1041490108. [DOI] [PubMed] [Google Scholar]
- 22.French AR, Tadaki DK, Niyogi SK, Lauffenburger DA. J Biol Chem. 1995;270:4334–4340. doi: 10.1074/jbc.270.9.4334. [DOI] [PubMed] [Google Scholar]
- 23.Platt MO, Wilder CL, Wells A, Griffith LG, Lauffenburger DA. Stem Cells. 2009;27:2804–2814. doi: 10.1002/stem.215. [DOI] [PMC free article] [PubMed] [Google Scholar]
- 24.Starbuck C, Lauffenburger DA. Biotechnol Prog. 1992;8:132–143. doi: 10.1021/bp00014a007. [DOI] [PubMed] [Google Scholar]
- 25.Shuler ML, Kargi F. Bioprocess engineering. Prentice Hall Upper Saddle River; NJ: 2002. [Google Scholar]
- 26.Chen A, Moy VT. Biophys J. 2000;78:2814–2820. doi: 10.1016/S0006-3495(00)76824-X. [DOI] [PMC free article] [PubMed] [Google Scholar]
- 27.Lanahan AA, Hermans K, Claes F, Kerley-Hamilton JS, Zhuang ZW, Giordano FJ, Carmeliet P, Simons M. Dev Cell. 2010;18:713–724. doi: 10.1016/j.devcel.2010.02.016. [DOI] [PMC free article] [PubMed] [Google Scholar]
- 28.Mellberg S, Dimberg A, Bahram F, Hayashi M, Rennel E, Ameur A, Westholm JO, Larsson E, Lindahl P, Cross MJ, Claesson-Welsh L. FASEB J. 2009;23:1490–1502. doi: 10.1096/fj.08-123810. [DOI] [PubMed] [Google Scholar]
- 29.Hodneland CD, Lee YS, Min DH, Mrksich M. Proceedings of the National Academy of Sciences. 2002;99:5048–5052. doi: 10.1073/pnas.072685299. [DOI] [PMC free article] [PubMed] [Google Scholar]
- 30.Zisch AH, Lutolf MP, Ehrbar M, Raeber GP, Rizzi SC, Davies N, Schmokel H, Bezuidenhout D, Djonov V, Zilla P. FASEB J. 2003;17:2260–2262. doi: 10.1096/fj.02-1041fje. [DOI] [PubMed] [Google Scholar]
- 31.Ghajar CM, Chen X, Harris JW, Suresh V, Hughes CC, Jeon NL, Putnam AJ, George SC. Biophys J. 2008;94:1930–1941. doi: 10.1529/biophysj.107.120774. [DOI] [PMC free article] [PubMed] [Google Scholar]
- 32.Taraboletti G, D’Ascenzo S, Borsotti P, Giavazzi R, Pavan A, Dolo V. Am J Pathol. 2002;160:673–680. doi: 10.1016/S0002-9440(10)64887-0. [DOI] [PMC free article] [PubMed] [Google Scholar]
- 33.Vempati P, Mac Gabhann F, Popel AS. PLoS One. 2010;5:e11860. doi: 10.1371/journal.pone.0011860. [DOI] [PMC free article] [PubMed] [Google Scholar]
- 34.Sun Q, Chen RR, Shen Y, Mooney DJ, Rajagopalan S, Grossman PM. Pharm Res. 2005;22:1110–1116. doi: 10.1007/s11095-005-5644-2. [DOI] [PubMed] [Google Scholar]
- 35.Kent Leach J, Kaigler D, Wang Z, Krebsbach PH, Mooney DJ. Biomaterials. 2006;27:3249–3255. doi: 10.1016/j.biomaterials.2006.01.033. [DOI] [PubMed] [Google Scholar]
- 36.Fischbach C, Mooney DJ. Biomaterials. 2007;28:2069–2076. doi: 10.1016/j.biomaterials.2006.12.029. [DOI] [PubMed] [Google Scholar]
- 37.Lode A, Reinstorf A, Bernhardt A, Wolf-Brandstetter C, Konig U, Gelinsky M. J Biomed Mater Res A. 2008;86:749–759. doi: 10.1002/jbm.a.31581. [DOI] [PubMed] [Google Scholar]
- 38.Hosack LW, Firpo MA, Scott JA, Prestwich GD, Peattie RA. Biomaterials. 2008;29:2336–2347. doi: 10.1016/j.biomaterials.2008.01.033. [DOI] [PMC free article] [PubMed] [Google Scholar]
- 39.Rocha FG, Sundback CA, Krebs NJ, Leach JK, Mooney DJ, Ashley SW, Vacanti JP, Whang EE. Biomaterials. 2008;29:2884–2890. doi: 10.1016/j.biomaterials.2008.03.026. [DOI] [PMC free article] [PubMed] [Google Scholar]
- 40.Mooney DJ, Boontheekul T, Chen R, Leach K. Orthod Craniofac Res. 2005;8:141–144. doi: 10.1111/j.1601-6343.2005.00327.x. [DOI] [PubMed] [Google Scholar]
- 41.Freeman I, Cohen S. Biomaterials. 2009;30:2122–2131. doi: 10.1016/j.biomaterials.2008.12.057. [DOI] [PubMed] [Google Scholar]
- 42.Pike DB, Cai S, Pomraning KR, Firpo MA, Fisher RJ, Shu XZ, Prestwich GD, Peattie RA. Biomaterials. 2006;27:5242–5251. doi: 10.1016/j.biomaterials.2006.05.018. [DOI] [PubMed] [Google Scholar]
- 43.Kim SH, Kiick KL. Peptides. 2007;28:2125–2136. doi: 10.1016/j.peptides.2007.08.010. [DOI] [PMC free article] [PubMed] [Google Scholar]
- 44.Shen YH, Shoichet MS, Radisic M. Acta Biomater. 2008;4:477–489. doi: 10.1016/j.actbio.2007.12.011. [DOI] [PubMed] [Google Scholar]
- 45.Kotlarchyk MA, Botvinick EL, Putnam AJ. J Phys Condens Matter. 2010;22:194121. doi: 10.1088/0953-8984/22/19/194121. [DOI] [PMC free article] [PubMed] [Google Scholar]
Associated Data
This section collects any data citations, data availability statements, or supplementary materials included in this article.