A computational method systematically identifies intergenic or noncoding gene-originated target mimics (eTMs) for 20 conserved microRNAs in Arabidopsis and rice and validates the biological functions of some eTMs.
Abstract
Target mimicry is a recently identified regulatory mechanism for microRNA (miRNA) functions in plants in which the decoy RNAs bind to miRNAs via complementary sequences and therefore block the interaction between miRNAs and their authentic targets. Both endogenous decoy RNAs (miRNA target mimics) and engineered artificial RNAs can induce target mimicry effects. Yet until now, only the Induced by Phosphate Starvation1 RNA has been proven to be a functional endogenous microRNA target mimic (eTM). In this work, we developed a computational method and systematically identified intergenic or noncoding gene-originated eTMs for 20 conserved miRNAs in Arabidopsis (Arabidopsis thaliana) and rice (Oryza sativa). The predicted miRNA binding sites were well conserved among eTMs of the same miRNA, whereas sequences outside of the binding sites varied a lot. We proved that the eTMs of miR160 and miR166 are functional target mimics and identified their roles in the regulation of plant development. The effectiveness of eTMs for three other miRNAs was also confirmed by transient agroinfiltration assay.
MicroRNAs (miRNAs) are endogenous small RNAs with essential roles in plant development and physiology regulation (Mallory and Vaucheret, 2006; Voinnet, 2009; Rubio-Somoza and Weigel, 2011; Zhao et al., 2012). In plants, miRNAs are about 21-nucleotide-long single-stranded small RNAs that mainly function as posttranscriptional regulators by targeting mRNAs via sequence complementarity, usually resulting in the degradation of targets (Seitz, 2009).
Most miRNAs can pair with multiple targets. The pairing between plant miRNAs and their target mRNAs is nearly perfectly complementary, with very limited numbers of mismatches or small gaps (Axtell and Bowman, 2008; Mallory and Bouché, 2008). It has been shown that the perfect pairing at the 5′ end ninth to 11th positions of miRNAs with their targets is most important for the effective cleavage of targets by miRNAs (Jones-Rhoades et al., 2006; Zheng et al., 2012). In 2007, studies in Arabidopsis (Arabidopsis thaliana) identified an endogenous long noncoding RNA (lncRNA), Induced by Phosphate Starvation1 (IPS1), which can bind to ath-miR399 with a three-nucleotide bulge between the 5′ end 10th and 11th positions of ath-miR399 (Franco-Zorrilla et al., 2007). Such pairing abolished the cleavage effect of ath-miR399 on IPS1; thus, IPS1 can serve as a decoy for ath-miR399 to interfere with the binding of ath-miR399 to its other targets. This type of inhibitory mechanism of miRNA functions is termed target mimicry, and IPS1 is defined as the target mimic (TM) of miR399.
Artificial TM designed with pairing patterns similar to that of IPS1 and miR399 have been proven to have the ability to cripple the functions of their corresponding miRNAs in transgenic plants (Todesco et al., 2010; Ivashuta et al., 2011; Yan et al., 2012). Recently, genome-wide screens of endogenous target mimics (eTMs) have been carried out in several plant species with fully sequenced genomes by bioinformatics methods and have identified some candidate eTMs (Ivashuta et al., 2011; Banks et al., 2012; Meng et al., 2012). However, the prediction was mainly performed using annotated gene sequences. As IPS1 is a noncoding RNA, it is possible that the presence of other unidentified eTMs originated from intergenic regions or noncoding genes. In addition, none of the predicted eTMs have been proven to be functional. In this work, we developed a computational method to systematically predict intergenic or noncoding gene-originated eTMs for 20 conserved miRNAs in Arabidopsis and rice (Oryza sativa). Most of the predicted eTMs of the same miRNAs shared conserved TM sites but were more divergent in other sequence regions. More than 40% of the predicted eTMs were detected to be expressed according to RNA-Seq data. We proved that the eTMs of several miRNAs can effectively inhibit the functions of their corresponding miRNAs.
RESULTS
Identification of eTMs for Conserved miRNAs in Arabidopsis and Rice
To systematically screen for eTMs, sequences of all intergenic regions, annotated noncoding genes, and short genes with predicted open reading frames (ORFs) of less than 100 amino acids from the genomes of Arabidopsis and rice were collected and used as the eTM prediction libraries. Twenty miRNAs conserved between Arabidopsis and rice were selected from miRBase (Table I). We developed a method to predict eTMs of these 20 miRNAs in the collected libraries in both species according to the pairing pattern between IPS1 and miR399. A total of 36 potential eTMs were identified for 11 Arabidopsis miRNAs, and 189 eTMs were identified for 19 rice miRNAs (Table I; Supplemental Tables S1 and S2; Supplemental Data S1 and S2).
Table I. Summary of predicted eTMs of 20 conserved miRNAs in Arabidopsis and rice.
| miRNA | Arabidopsis |
Rice |
||||||||||
|---|---|---|---|---|---|---|---|---|---|---|---|---|
| No. of eTMs | Genomic Origina |
Expression Support |
No. of eTMs | Genomic Origina |
Expression Support |
|||||||
| ncRNAb | sORFc | IGd | RNA-Seqe | PcEf | ncRNAb | sORFc | IGd | RNA-Seqe | PcEf | |||
| miR156 | 12 | 1 | 1 | 10 | 5 (2) | 2 | 16 | 0 | 1 | 15 | 4 (2) | 1 |
| miR159 | 3 | 0 | 0 | 3 | 1 (1) | 0 | 19 | 0 | 1 | 18 | 10 (4) | 1 |
| miR160 | 2 | 0 | 0 | 2 | 2 (2) | 0 | 11 | 0 | 0 | 11 | 6 (5) | 3 |
| miR162 | – | – | – | – | – | – | – | – | – | – | – | – |
| miR164 | – | – | – | – | – | – | 12 | 0 | 0 | 12 | 6 (4) | 1 |
| miR166 | 1 | 0 | 0 | 1 | 0 | 0 | 2 | 0 | 0 | 2 | 1 (1) | 1 |
| miR167 | 3 | 0 | 0 | 3 | 2 (2) | 1 | 6 | 0 | 0 | 6 | 1 | 0 |
| miR168 | – | – | – | – | – | – | 5 | 0 | 0 | 5 | 1 (1) | 0 |
| miR169 | 1 | 0 | 0 | 1 | 0 | 0 | 11 | 0 | 0 | 11 | 6 (6) | 1 |
| miR171 | 3 | 0 | 0 | 3 | 2 (1) | 0 | 10 | 0 | 0 | 10 | 4 (2) | 0 |
| miR172 | 5 | 0 | 0 | 5 | 2 | 0 | 12 | 0 | 0 | 12 | 5 (3) | 0 |
| miR319 | – | – | – | – | – | – | 20 | 0 | 0 | 20 | 13 (10) | 0 |
| miR390 | – | – | – | – | – | – | 2 | 0 | 0 | 2 | 2 | 0 |
| miR393 | – | – | – | – | – | – | 1 | 0 | 0 | 1 | 0 | 0 |
| miR394 | – | – | – | – | – | – | 17 | 0 | 0 | 17 | 5 (5) | 0 |
| miR395 | 1 | 0 | 0 | 1 | 0 | 0 | 17 | 0 | 0 | 17 | 7 (6) | 0 |
| miR396 | – | – | – | – | – | – | 3 | 0 | 0 | 3 | 1 | 0 |
| miR397 | – | – | – | – | – | – | 12 | 0 | 0 | 12 | 6 (4) | 0 |
| miR398 | 1 | 0 | 0 | 1 | 0 | 0 | 4 | 0 | 0 | 4 | 1 (1) | 0 |
| miR399 | 4 | 0 | 2 | 2 | 4 (3) | 4 | 9 | 0 | 1 | 8 | 5 (4) | 2 |
| Total | 36 | 1 | 3 | 32 | 18 (11) | 7 | 189 | 0 | 3 | 186 | 84 (58) | 10 |
The genomic origin is based on TAIR 10 annotation. bNoncoding RNA. cShort ORF. dIntergenic regions. eNumber of eTMs detected by RNA sequencing data. Numbers in parentheses represent the number of eTMs expressed in at least two independent samples. fNumber of eTMs supported by PlantGDB-assembled unique transcript, cDNA, or EST.
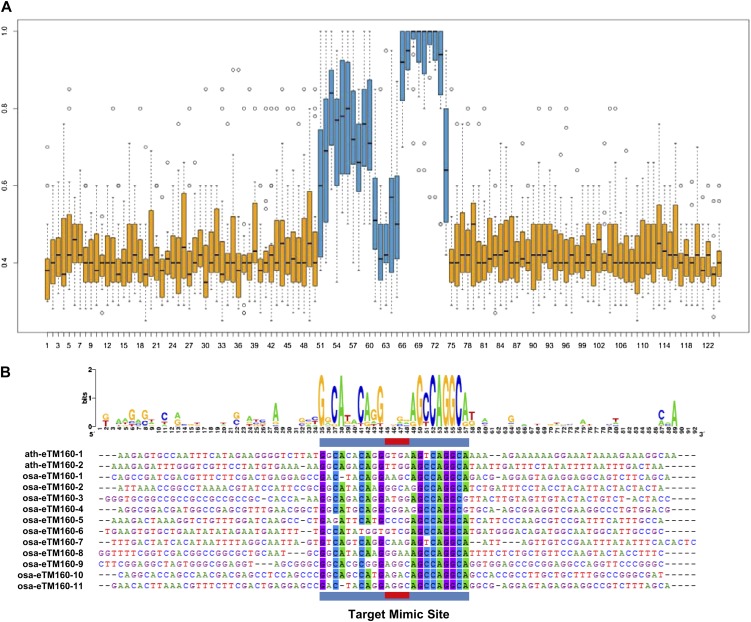
To investigate the evolutionary conservation status of the eTMs, sequences of the predicted eTM binding sites and surrounding regions for the same miRNA in both Arabidopsis and rice were aligned. The predicted miRNA binding sites were well conserved among eTMs of the same miRNA either within or across species, but sequences outside of the predicted miRNA binding sites varied a lot, showing no constraints on sequence composition (Fig. 1A). Previous studies have shown that the double-stranded RNA duplexes formed by eTMs and their corresponding miRNAs usually have a three-nucleotide bulge at the middle of miRNA binding site within eTM sequences, which is supposed to abolish the target cleavage functions of miRNAs (Ivashuta et al., 2011; Rubio-Somoza et al., 2011). In our prediction, we also required a three-nucleotide bulge on eTMs that located between the 5′ end ninth to 12th positions of miRNAs. The nucleotides forming the bulge region were not conserved among eTMs of the same miRNA, either within each species or between Arabidopsis and rice (Fig. 1). This phenomenon indicated that the conservation of miRNA binding sites among eTMs was constrained by evolution in accordance with the sequences of the corresponding miRNAs.
Figure 1.
Conservation of TM sites among predicted miRNA eTMs in Arabidopsis and rice. A, Box plot for the conservation status of TM sites and their surrounding sequences. The y axis represents the occurrence rate of the most frequently occurred nucleotide at each position among all eTMs in Arabidopsis and rice. The x axis represents nucleotide positions in eTMs. Boxes represent the interquartile range (including the 25th percentile to the 75th percentile of the data) of the most frequent nucleotide occurrence rates of all predicted eTMs at each position. TM sites pairing to miRNAs are represented by blue boxes, and TM sites surrounding sequences are represented by orange boxes. Black lines within boxes represent the median of each data set. Vertical dashed lines represent the range of each data set. Extreme values within each data set are represented by circles. B, Conservation analysis of the TM sites and surrounding regions of 13 eTMs for miR160 in Arabidopsis and rice. TM sites pairing with miRNAs are underlined by blue boxes, and the bulge sequences in eTMs are underlined by red boxes. The conservation status of the sequences is analyzed and presented by WebLogo.
Expression Analysis of eTMs
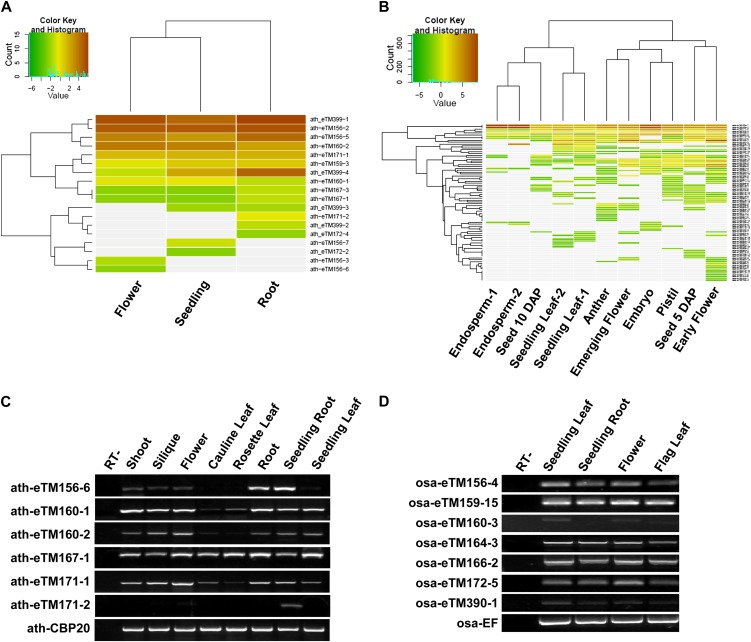
Among the predicted eTMs, one was an annotated noncoding gene, six were annotated short ORFs, and the rest were from nonannotated intergenic regions (Table I). To examine whether these predicted eTMs were indeed transcribed, two RNA-Seq data sets including samples from different tissues and developmental stages of Arabidopsis and rice were downloaded and analyzed (Fig. 2, A and B). A total of 18 Arabidopsis eTMs and 84 rice eTMs were detected in at least one sample, of which more than 60% (11 Arabidopsis eTMs and 58 rice eTMs) were expressed in at least two samples (Supplemental Tables S1 and S2). Among the eTMs with RNA-Seq expression data, seven eTMs for three Arabidopsis miRNAs and 10 eTMs for seven rice miRNAs also had corresponding transcripts among the complementary DNA (cDNA), EST, or Plant Genome Database (PlantGDB)-assembled unique transcript databases (Table I; Supplemental Tables S1 and S2).
Figure 2.
Expression of predicted eTMs in Arabidopsis and rice. A, Expression profile of predicted eTMs in flower, seedling, and root tissues of Arabidopsis obtained from public RNA-Seq data (SRP007511). B, Expression profile of predicted eTMs in nine tissues of rice obtained from public RNA-Seq data (SRP008821). For both A and B, expression is presented by the reads per kilobase per million mapped reads values of transcripts corresponding to each eTM after log2 transformation. Gray color represents no expression in RNA-Seq data. C, Semiquantitative RT-PCR assay of eTMs in eight Arabidopsis samples. Samples were collected from 2-week-old seedlings (seedling root and seedling leaf) and 5-week-old plants. D, Semiquantitative RT-PCR assay of eTMs in four rice samples. Samples were collected from heading stage (flag leaves and flowers) and seedling stage (3-week-old seedling root and 3-week-old seedling leaf) rice. RT- represents the RT-minus negative control (without the addition of reverse transcriptase).
We next used reverse transcription (RT)-PCR to validate the expression of some eTMs in selected samples (Supplemental Tables S1 and S2). A total of 12 selected ath-eTMs including seven eTMs with RNA-Seq reads and five eTMs without RNA-Seq reads were examined in mixed samples (Supplemental Fig. S1). All seven eTMs with RNA-Seq reads together with three eTMs without RNA-Seq reads were validated to be expressed, and the other two eTMs were not detected either among RNA-Seq reads or by the RT-PCR experiment among the selected samples (Supplemental Fig. S1). We then used semiquantitative RT-PCR to analyze the expression of some eTMs in separate samples from different tissues and developmental stages. Except for ath-eTM171-2, which was mainly detected in seeding roots, other examined eTMs were all expressed in multiple tissues (Fig. 2, C and D). The expression of some eTMs showed great variation among tissues. In addition, the expression patterns of eTMs for some homologous miRNAs were also conserved across species. For example, in both Arabidopsis and rice, the eTMs for miR156 had lower expression in leaves than in other tissues. Among the examined multiple eTMs for the same miRNA in Arabidopsis, the two eTMs for miR160 had well-correlated expression patterns, whereas the expression patterns of eTMs for miR171 were diverged.
eTMs Repress miRNA Function and May Induce miRNA Degradation
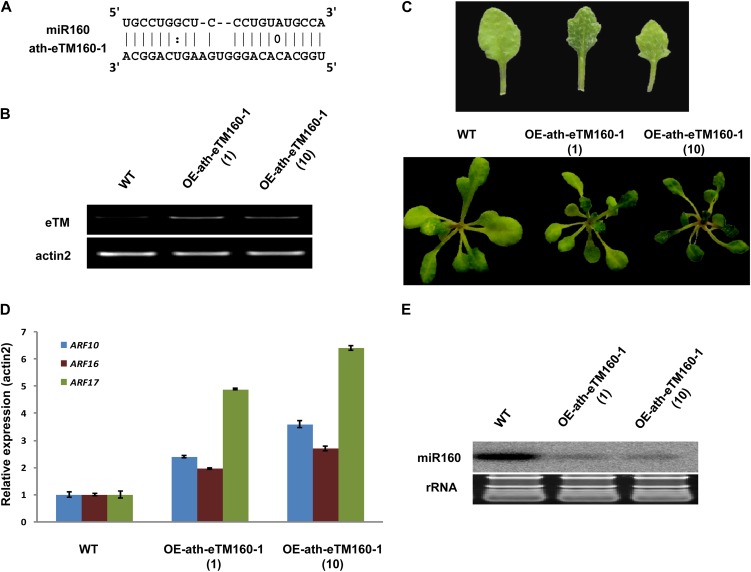
To investigate whether the predicted eTMs can indeed function to abolish the binding between corresponding miRNAs and their targets, we overexpressed one eTM for miR160 (ath-eTM160-1) in Arabidopsis. The pairing between ath-eTM160-1 and miR160 contains a three-nucleotide bulge between the 5′ end ninth and 10th positions of miR160 (Fig. 3A). The transgenic plants overexpressing ath-eTM160-1 (OE-ath-eTM160-1) had smaller and serrated leaves compared with the wide-type plants (Fig. 3, B and C). The known target genes of Arabidopsis miR160 are auxin response factor10 (ARF10; AT2G28350), ARF16 (AT4G30080), and ARF17 (AT1G77850; Mallory et al., 2005). Consistent with the expected effects of eTMs, the expression of all three ARF genes were significantly increased in OE-ath-eTM160-1 plants (Fig. 3D). Moreover, the expression level of miR160 was decreased markedly (Fig. 3E), in agreement with the previous report that some eTMs can induce miRNA degradation (Todesco et al., 2010; Ivashuta et al., 2011; Banks et al., 2012; Yan et al., 2012).
Figure 3.
Functional analysis of ath-eTM160-1. A, Predicted base-pairing interaction between miR160 and ath-eTM160-1. B, Detection of enhanced eTM expression in wild-type (WT) and ath-eTM160-1 overexpression transgenic Arabidopsis by semiquantitative RT-PCR assay. OE-ath-eTM160-1(1) and OE-ath-eTM160-1(10) represent two independent transgenic lines overexpressing ath-eTM160-1. C, Phenotypes of ath-eTM160-1 overexpression plants. Smaller leaf size and serrated leaf margin are observed. D, Quantitative RT-PCR analysis of miR160 target genes (ARF10, ARF16, and ARF17) in wild-type and OE-ath-eTM160-1 plants. Error bars indicate the sd of three replicates. E, Detection of miR160 expression in OE-ath-eTM160-1 plants by northern-blot hybridization. rRNA, Ribosomal RNA.
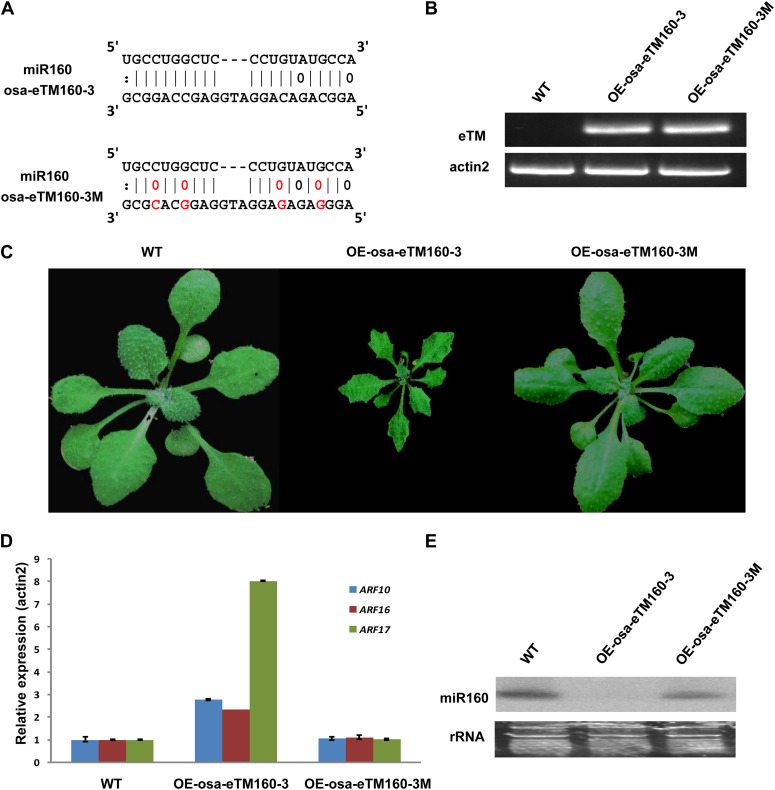
The pairing sequence and bulge position of ath-eTM160 were also conserved in rice (Fig. 4A). Similar to ath-eTM160-1, the rice eTMs for miR160 (osa-eTM160-3) also form a central bulge with miR160 in the position of the traditional cleavage site (Fig. 4A). As miR160 is highly conserved during evolution with identical sequence in Arabidopsis and rice, theoretically, eTMs for miR160 in one species should also be functional once it is overexpressed in the other species. Thus, to accelerate the experimental process, we overexpressed rice osa-eTM160-3 in Arabidopsis to study its functions. Transgenic plants overexpressing osa-eTM160-3 (OE-osa-eTM160-3) had severe developmental defects, with dwarf size and serrated leaves (Fig. 4, B and C), as well as accelerated flowering time (data not shown). These phenotypes resembled those of plants overexpressing artificial miR160 target mimics (Todesco et al., 2010; Yan et al., 2012). Correspondingly, the expression of known miR160 target genes was also significantly increased in the osa-eTM160-3 overexpression plants (Fig. 4D). We also found that the mature miR160 level was decreased in the transgenic plants (Fig. 4E).
Figure 4.
Functional analysis of osa-eTM160-3. A, Predicted base-pairing interaction between miR160 and osa-eTM160-3 (top alignment) as well as miR160 and osa-eTM160-3 with designed mutations (osa-eTM160-3M; bottom alignment). Mutation sites are shown in red. B, Detection of enhanced eTM expression by semiquantitative RT-PCR assay in wild-type Arabidopsis (WT) and Arabidopsis overexpressing osa-eTM160-3 (OE-osa-eTM160-3) as well as plants overexpressing osa-eTM160-3 with designed mutations (OE-osa-eTM160-3M). C, Phenotypes of osa-eTM160-3 and osa-eTM160-3M overexpression plants. Smaller leaf size and serrated leaf margin are observed in OE-osa-eTM160-3 plants, yet OE-osa-eTM160-3M plants look normal. D, Quantitative RT-PCR analysis of miR160 target genes (ARF10, ARF16, and ARF17) in wild-type and OE-osa-eTM160-3 as well as OE-osa-eTM160-3M plants. Error bars indicate the sd of three replicates. The increased miR160 target expression in OE-osa-eTM160-3 plants is abolished in OE-osa-eTM160-3M plants. E, Detection of miR160 expression in OE-osa-eTM160-3 and OE-osa-eTM160-3M plants by northern-blot hybridization. rRNA, Ribosomal RNA.
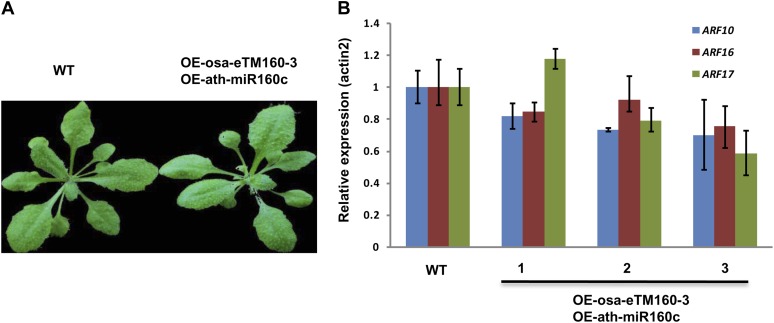
To examine whether the identified eTMs indeed function via pairing with miRNAs, we introduced four point mutations to osa-eTM160-3 within sequences pairing with miR160 (osa-eTM160-3M; Fig. 4A). Overexpressing osa-eTM160-3M under the control of a 35S promoter in Arabidopsis did not cause observable phenotype or expression changes of either miR160 or its targets (Fig. 4, C and D), suggesting an abolishment of osa-eTM160-3 function. Furthermore, when overexpressing osa-eTM160-3 in plants already with the overexpression of ath-miR160c, no phenotypes or expression increment of miR160 targets was observed (Fig. 5).
Figure 5.
Overexpression of ath-miR160c rescues the phenotypes of OE-osa-eTM160-3. A, Phenotype analysis of plants overexpressing both osa-eTM160-3 and ath-miR160c. OE-ath-miR160c represents transgenic plants overexpressing ath-miR160c, which can pair with osa-eTM160-3. WT, Wild type. B, Expression analysis of miR160 targets in transgenic plants overexpressing both osa-eTM160-3 and ath-miR160c by quantitative RT-PCR. The expression of three miR160 target genes (ARF10, ARF16, and ARF17) was tested in three independent lines (labeled 1, 2, and 3). Error bars indicate the sd of three replicates.
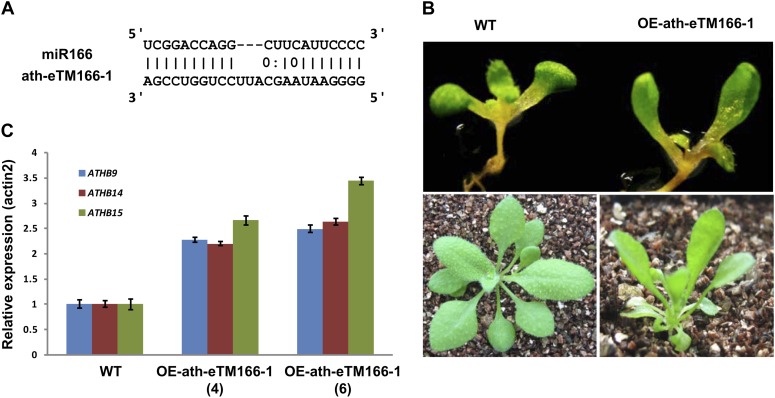
In addition to miR160, we also investigated the functions of eTMs for miR166. The pairing between miR166 and its eTM ath-eTM166-1 also had a bulge at the middle of the miRNA sequence (Fig. 6A), and such a pairing pattern was conserved in rice (Supplemental Fig. S2). The transgenic plants overexpressing ath-eTM166-1 (OE-ath-eTM166-1) had spoon-shaped cotyledons and abnormal rosette leaf shapes (Fig. 6B). The known target genes of Arabidopsis miR166 are three homeodomain-Leu zipper III genes, ATHB-9 (AT1G30490), ATHB-14 (AT2G34710), and ATHB-15 (AT1G52150; Kim et al., 2005; Zhou et al., 2007; Zhu et al., 2011). The expression of all three of these genes was significantly increased in OE-ath-eTM166-1 plants (Fig. 6C). Similar phenotypes were also observed in plants overexpressing the rice miR166 eTM osa-eTM166-2 (Supplemental Fig. S2).
Figure 6.
Functional analysis of ath-eTM166-1. A, Predicted base-pairing interaction between miR166 and ath-eTM166-1. B, Phenotypes of ath-eTM166-1 overexpression plants. Spoon-shaped cotyledons and curled rosette leaves are observed. C, Quantitative RT-PCR analysis of miR166 target genes (ATHB9, ATHB14, and ATHB15) in wild-type (WT) and OE-ath-eTM166-1 plants. OE-ath-eTM166-1(4) and OE-ath-eTM166-1(6) represent two independent transgenic lines overexpressing ath-eTM166-1. Error bars indicate the SD of three replicates.
We next used a transient agroinfiltration assay to test whether other eTMs were also functional. We constructed expression vectors containing eTMs of four miRNAs (miR156, miR159, miR169, and miR172) separately and overexpressed them in the leaves of Nicotiana benthamiana. The above functionally confirmed ath-eTM160-1 and ath-eTM166-1 were also included as positive controls. The sequences of these tested miRNAs and their target sites were all well conserved between Arabidopsis and N. benthamiana. The previously published small RNA sequencing data showed that all these miRNAs were expressed in the leaves of N. benthamiana with relatively high abundance (Tang et al., 2012). Therefore, overexpression of the exogenous eTMs should repress the functions of the corresponding endogenous miRNAs. As examined at 2 d after agrobacteria infiltration, all the examined eTMs except for ath-eTM169-1 dramatically increased the mRNA abundance of the corresponding miRNA targets in their transiently expressed leaves, suggesting that they indeed inhibited the functions of the corresponding miRNAs (Supplemental Fig. S3).
DISCUSSION
Target mimicry has emerged as a new regulatory mechanism for miRNA functions. Recently, computational efforts have been taken to search for eTMs. Yet, the published work mainly focused on eTMs derived from annotated genes (Ivashuta et al., 2011; Banks et al., 2012; Meng et al., 2012). As the known functional eTM in plants, IPS1, is an lncRNA (Franco-Zorrilla et al., 2007), it is possible that functional eTMs may be composed mainly of lncRNAs. In this work, we carried out eTM prediction using intergenic and noncoding sequences of the Arabidopsis and rice genomes and identified potential eTMs for 20 highly conserved miRNAs. We were able to find expression evidence for nearly half the eTMs from either RNA-Seq or RT-PCR experiments. For some eTMs, expression evidence from multiple resources was identified, suggesting that they may be real functional transcripts.
The target mimicry phenomenon was discovered by the identification of IPS1 as an eTM in Arabidopsis (Franco-Zorrilla et al., 2007). However, until now, no functional eTMs other than IPS1 have been identified in plants. Here, we were able to verify the functions of predicted eTMs for miR160 and miR166, which when overexpressed were able to cause the increased expression of corresponding miRNA targets. The varied expression of eTMs in different tissues can serve as modulators for corresponding miRNAs. For example, the expression levels of miR160 were similar in cauline leaf and silique (Supplemental Fig. S4), yet the expression level of miR160 target genes was higher in silique than in cauline leaf (Supplemental Fig. S4), which was in agreement with the higher expression levels of miR160 eTMs in silique (Fig. 2D), indicating that eTMs can function to inhibit miRNA functions in spatial- or temporal-specific manners, thus contributing to the regulation of transcriptome complexity in plants.
Among the transgenic plants overexpressing osa-eTM160-3, only one-half showed visible phenotypes; the other one-half looked normal. Further analysis revealed that the transgenic plants with visible phenotypes all expressed osa-eTM160-3 at higher levels than those without phenotypes, suggesting that the expression of eTMs has to reach certain amount to effectively saturate the corresponding miRNAs. The fact that the overexpression of osa-eTM160-3 in plants already overexpressing ath-miR160c had no eTM effects also supported this hypothesis. Although further confirmation is needed, such potential dosage-dependent regulation may render eTMs as an endogenous modulator for plant miRNA functions, which may fine-tune miRNAs in a more temporal- or cell type-specific manner.
Although the identified eTMs for the same miRNAs in Arabidopsis and rice are highly conserved in sequences complementary to corresponding miRNAs, the majority of their sequences were very diverse outside of the target mimicry region. A previous report showed that when different sequences were used as backbones to design artificial target mimics for selected miRNAs, variations in inhibition efficiency existed (Ivashuta et al., 2011). Recently, another work identified that Short Tandem Target Mimic, which is composed of two target mimicry sites separated by a short linker, has a high efficiency to degrade miRNAs and exert target mimicry functions (Yan et al., 2012). These findings suggested that there may be some specific sequence motifs and/or spatial structures required for effective eTM functions. In our experiments, we found that osa-eTM160 had stronger miR160 inhibitory effects than ath-eTM160 when both were overexpressed in Arabidopsis (Figs. 3C and 4C), although they had similar complementary sequences to miR160. This result suggested that the backbone sequences of ath-eTM160 and osa-eTM160 may contribute to their functional differences. Further experiments are needed to verify this hypothesis after the functions of more eTMs are validated.
MATERIALS AND METHODS
Prediction of eTMs
A total of 20 conserved miRNAs between Arabidopsis (Arabidopsis thaliana) and rice (Oryza sativa) were collected from miRBase (version 18). Noncoding RNAs, short ORF-encoding genes (with coding potential of less than 100 amino acids), and intergenic sequences in The Arabidopsis Information Resource (TAIR) 10 for Arabidopsis and the Michigan State University Rice Genome Annotation Project (release 7) annotations were collected and used as the eTM prediction libraries. eTMs for the 20 selected miRNAs were predicted using local scripts with the following rules: (1) bulges were only permitted at the 5′ end ninth to 12th positions of miRNA sequence; (2) the bulge in eTMs should be composed of only three nucleotides; (3) perfect nucleotide pairing was required at the 5′ end second to eighth positions of miRNA sequence; and (4) except for the central bulge, the total mismatches and G/U pairs within eTM and miRNA pairing regions should be no more than three. The distance between qualified intergenic eTMs and their upstream/downstream genes should be longer than 200 nucleotides.
Conservation Analysis of eTMs
The miRNA pairing sites along with 50-nucleotide sequences upstream or downstream of the miRNA pairing sites of the predicted eTMs for each miRNA were extracted and aligned. The conservation status of the eTMs was analyzed as follows: among all homologous eTMs for each orthologous miRNA pair in Arabidopsis and rice, the occurrence frequency of the most common nucleotide at each position was calculated as the conservation score. Conservation scores of all eTMs for the same position were plotted by the box-plot package in the R environment. ClustalW and WebLogo were employed to generate the multiple alignment and sequence logos of 13 predicted eTMs of Arabidopsis and rice for miR160.
Expression Analysis of eTMs
Two RNA-Seq data sets from the National Center for Biotechnology Information Gene Expression Omnibus database, SRP007511 for Arabidopsis and SRP008821 for rice, were downloaded and assembled to evaluate the expression of predicted eTMs. The raw RNA-Seq data were mapped to Arabidopsis TAIR 10 and the Michigan State University Rice Genome Annotation Project (release 7), respectively, using TopHat version 2 with default parameters. The reads per kilobase per million mapped reads values of transcripts derived from the eTM corresponding genomic loci were taken as the expression of eTMs. Further expression evidence for eTMs was collected by checking their presence among the sequences of cDNAs, ESTs, and PlantGDB-assembled unique transcripts collected in the PlantGDB.
Plant Materials and Transgenic Plant Construction
Arabidopsis (ecotype Columbia) plants were grown under standard conditions (16 h of light/8 h of dark) at 22°C. The eTMs were amplified by PCR from cDNA using the specific primers shown in Supplemental Table S3. The PCR products of eTMs were placed behind the cauliflower mosaic virus 35S promoter in the pCAMBIA1300 vector. The floral dip method (Clough and Bent, 1998) was used to generate transgenic Arabidopsis plants.
The OE-ath-miR160c (MIR160c) transgenic plants (Wang et al., 2005) were provided by Xiao-Ya Chen.
RT-PCR Analysis of Gene Expression
Total RNA was isolated using Trizol (Invitrogen) from each sample. In the quantitative RT-PCR experiments, 1 μg of total RNAs treated with DNase I (New England Biolabs) was synthesized to cDNA by Moloney murine leukemia virus (New England Biolabs) using poly(dT) oligonucleotides. Each RT-PCR was combined with the RT-minus (without reverse transcriptase) negative control run to confirm that the RNA samples had no DNA contamination. SYBR Green PCR Master Mix (Applied Biosystems) was used in all quantitative RT-PCR experiments. The relative fold expression changes of genes were calculated using the comparative threshold cycle method (Livak and Schmittgen, 2001). Semiquantitative PCR products were amplified for no more than 30 cycles to avoid the reaction reaching plateau stage. Primers used in all RT-PCR experiments are listed in Supplemental Table S4.
Small RNA Northern-Blot Hybridization
Small RNA northern-blot hybridization was carried out following previously reported procedures (Zhao et al., 2012) using 20 μg of total RNA in each experiment. The complementary sequences of miRNAs were labeled by [γ-32P]ATP and used as probes.
Transient Agroinfiltration Assay in Nicotiana benthamiana
To construct agroinfiltration transient expression vectors, the HindIII-GUS-EcoRΙ fragment of the pBI121 vector was inserted into HindIII/EcoRΙ-digested pCAMBIA3301 vector, producing the pCAMBIA3301-121 vector. For constructing pCAMBIA1300-121-GFP (3-1-G-GUS) vector, the GFP fragment was amplified and inserted into NcoΙ/BstEII-digested pCAMBIA3301-121 vector. All eTM fragments were inserted into XbaΙ/SacΙ-digested 3-1-G-GUS, generating the pCAMBIA1300-121-GFP-eTM (3-1-G-eTM) vector. The amplification primers for eTMs are shown in Supplemental Table S3.
The eTM overexpression vector (3-1-G-eTM) was transformed into Agrobacterium tumefaciens strain EHA105. Agrobacterial cells were infiltrated into leaves of N. benthamiana using 3-1-G-GUS as the control vector. The transient agroinfiltration assay was performed as described previously (He et al., 2008). The leaves were harvested 2 d after infiltration. The expression profiles of target genes for corresponding miRNAs were detected. All primers are shown in Supplemental Table S4. Target genes of miRNAs in N. benthamiana were predicted by psRobot (Wu et al., 2012).
Supplemental Data
The following materials are available in the online version of this article.
Supplemental Figure S1. RT-PCR assay of ath-eTMs.
Supplemental Figure S2. Functional analysis of osa-eTM166-2.
Supplemental Figure S3. Functional analysis of eTMs by transient agroinfiltration assay.
Supplemental Figure S4. Expression analysis of miR160 and target genes.
Supplemental Table S1. Summary of predicted eTMs in Arabidopsis.
Supplemental Table S2. Summary of predicted eTMs in rice.
Supplemental Table S3. Primers used for vector construction.
Supplemental Table S4. Primers used for semiquantitative or quantitative RT-PCR.
Supplemental Data S1. Predicted eTMs of 20 conserved miRNAs in Arabidopsis.
Supplemental Data S2. Predicted eTMs of 20 conserved miRNAs in rice.
Acknowledgments
We thank Prof. Xiao-Ya Chen (Institute of Plant Physiology and Ecology, Chinese Academy of Sciences, Shanghai) for providing OE-ath-miR160c transgenic Arabidopsis and Prof. Hui-Shan Guo (Institute of Microbiology, Chinese Academy of Sciences, Beijing) for providing A. tumefaciens strain EHA105.
Glossary
- miRNA
microRNA
- lncRNA
long noncoding RNA
- TM
target mimic
- eTM
endogenous target mimic
- ORF
open reading frame
- RT
reverse transcription
- TAIR
The Arabidopsis Information Resource
- cDNA
complementary DNA
- PlantGDB
Plant Genome Database
References
- Axtell MJ, Bowman JL. (2008) Evolution of plant microRNAs and their targets. Trends Plant Sci 13: 343–349 [DOI] [PubMed] [Google Scholar]
- Banks IR, Zhang Y, Wiggins BE, Heck GR, Ivashuta S. (2012) RNA decoys: an emerging component of plant regulatory networks? Plant Signal Behav 7: 1188–1193 [DOI] [PMC free article] [PubMed] [Google Scholar]
- Clough SJ, Bent AF. (1998) Floral dip: a simplified method for Agrobacterium-mediated transformation of Arabidopsis thaliana. Plant J 16: 735–743 [DOI] [PubMed] [Google Scholar]
- Franco-Zorrilla JM, Valli A, Todesco M, Mateos I, Puga MI, Rubio-Somoza I, Leyva A, Weigel D, García JA, Paz-Ares J. (2007) Target mimicry provides a new mechanism for regulation of microRNA activity. Nat Genet 39: 1033–1037 [DOI] [PubMed] [Google Scholar]
- He XF, Fang YY, Feng L, Guo HS. (2008) Characterization of conserved and novel microRNAs and their targets, including a TuMV-induced TIR-NBS-LRR class R gene-derived novel miRNA in Brassica. FEBS Lett 582: 2445–2452 [DOI] [PubMed] [Google Scholar]
- Ivashuta S, Banks IR, Wiggins BE, Zhang Y, Ziegler TE, Roberts JK, Heck GR. (2011) Regulation of gene expression in plants through miRNA inactivation. PLoS ONE 6: e21330. [DOI] [PMC free article] [PubMed] [Google Scholar]
- Jones-Rhoades MW, Bartel DP, Bartel B. (2006) MicroRNAS and their regulatory roles in plants. Annu Rev Plant Biol 57: 19–53 [DOI] [PubMed] [Google Scholar]
- Kim J, Jung JH, Reyes JL, Kim YS, Kim SY, Chung KS, Kim JA, Lee M, Lee Y, Narry Kim V, et al. (2005) MicroRNA-directed cleavage of ATHB15 mRNA regulates vascular development in Arabidopsis inflorescence stems. Plant J 42: 84–94 [DOI] [PMC free article] [PubMed] [Google Scholar]
- Livak KJ, Schmittgen TD. (2001) Analysis of relative gene expression data using real-time quantitative PCR and the 2(-Delta Delta C(T)) method. Methods 25: 402–408 [DOI] [PubMed] [Google Scholar]
- Mallory AC, Bartel DP, Bartel B. (2005) MicroRNA-directed regulation of Arabidopsis AUXIN RESPONSE FACTOR17 is essential for proper development and modulates expression of early auxin response genes. Plant Cell 17: 1360–1375 [DOI] [PMC free article] [PubMed] [Google Scholar]
- Mallory AC, Bouché N. (2008) MicroRNA-directed regulation: to cleave or not to cleave. Trends Plant Sci 13: 359–367 [DOI] [PubMed] [Google Scholar]
- Mallory AC, Vaucheret H. (2006) Functions of microRNAs and related small RNAs in plants. Nat Genet (Suppl) 38: S31–S36 [DOI] [PubMed] [Google Scholar]
- Meng Y, Shao C, Wang H, Jin Y. (2012) Target mimics: an embedded layer of microRNA-involved gene regulatory networks in plants. BMC Genomics 13: 197. [DOI] [PMC free article] [PubMed] [Google Scholar]
- Rubio-Somoza I, Weigel D. (2011) MicroRNA networks and developmental plasticity in plants. Trends Plant Sci 16: 258–264 [DOI] [PubMed] [Google Scholar]
- Rubio-Somoza I, Weigel D, Franco-Zorilla JM, García JA, Paz-Ares J. (2011) ceRNAs: miRNA target mimic mimics. Cell 147: 1431–1432 [DOI] [PubMed] [Google Scholar]
- Seitz H. (2009) Redefining microRNA targets. Curr Biol 19: 870–873 [DOI] [PubMed] [Google Scholar]
- Tang S, Wang Y, Li Z, Gui Y, Xiao B, Xie J, Zhu QH, Fan L. (2012) Identification of wounding and topping responsive small RNAs in tobacco (Nicotiana tabacum). BMC Plant Biol 12: 28. [DOI] [PMC free article] [PubMed] [Google Scholar]
- Todesco M, Rubio-Somoza I, Paz-Ares J, Weigel D. (2010) A collection of target mimics for comprehensive analysis of microRNA function in Arabidopsis thaliana. PLoS Genet 6: e1001031. [DOI] [PMC free article] [PubMed] [Google Scholar]
- Voinnet O. (2009) Origin, biogenesis, and activity of plant microRNAs. Cell 136: 669–687 [DOI] [PubMed] [Google Scholar]
- Wang JW, Wang LJ, Mao YB, Cai WJ, Xue HW, Chen XY. (2005) Control of root cap formation by microRNA-targeted auxin response factors in Arabidopsis. Plant Cell 17: 2204–2216 [DOI] [PMC free article] [PubMed] [Google Scholar]
- Wu HJ, Ma YK, Chen T, Wang M, Wang XJ. (2012) PsRobot: a Web-based plant small RNA meta-analysis toolbox. Nucleic Acids Res 40: W22–W28 [DOI] [PMC free article] [PubMed] [Google Scholar]
- Yan J, Gu Y, Jia X, Kang W, Pan S, Tang X, Chen X, Tang G. (2012) Effective small RNA destruction by the expression of a short tandem target mimic in Arabidopsis. Plant Cell 24: 415–427 [DOI] [PMC free article] [PubMed] [Google Scholar]
- Zhao Y-T, Wang M, Fu S-X, Yang W-C, Qi C-K, Wang X-J. (2012) Small RNA profiling in two Brassica napus cultivars identifies microRNAs with oil production- and development-correlated expression and new small RNA classes. Plant Physiol 158: 813–823 [DOI] [PMC free article] [PubMed] [Google Scholar]
- Zheng Y, Li Y-F, Sunkar R, Zhang W. (2012) SeqTar: an effective method for identifying microRNA guided cleavage sites from degradome of polyadenylated transcripts in plants. Nucleic Acids Res 40: e28. [DOI] [PMC free article] [PubMed] [Google Scholar]
- Zhou GK, Kubo M, Zhong R, Demura T, Ye ZH. (2007) Overexpression of miR165 affects apical meristem formation, organ polarity establishment and vascular development in Arabidopsis. Plant Cell Physiol 48: 391–404 [DOI] [PubMed] [Google Scholar]
- Zhu H, Hu F, Wang R, Zhou X, Sze SH, Liou LW, Barefoot A, Dickman M, Zhang X. (2011) Arabidopsis Argonaute10 specifically sequesters miR166/165 to regulate shoot apical meristem development. Cell 145: 242–256 [DOI] [PMC free article] [PubMed] [Google Scholar]


