

Abstract
The epithelial Na+ channel (ENaC) is a key transporter participating in the fine tuning of Na+ reabsorption in the nephron. ENaC activity is acutely upregulated by epidermal growth factor (EGF), insulin, and insulin-like growth factor-1 (IGF-1). It was also proposed that reactive oxygen species (ROS) have a stimulatory effect on ENaC. Here we studied whether effects of EGF, insulin, and IGF-1 correlate with ROS production in the mouse cortical collecting duct (mpkCCDc14) cells. Western blotting confirmed the expression of the NADPH oxidase complex subunits in these cells. Treatment of mpkCCDc14 cells with EGF, insulin, or IGF-1 evoked an increase in ROS production as measured by CM-H2DCF-DA fluorescence. ROS production caused by a xanthine-xanthine oxidase reaction also resulted in a significant elevation in short-circuit current through the mpkCCDc14 monolayer. Transepithelial current measurements showed an acute increase of amiloride-sensitive current through the mpkCCDc14 monolayer in response to EGF, insulin, or IGF-1. Pretreatment with the nonselective NADPH oxidase activity inhibitor apocynin blunted both ROS production and increase in ENaC-mediated current in response to these drugs. To further test whether NADPH oxidase subunits are involved in the effect of EGF, we used a stable M-1 cell line with a knockdown of Rac1, which is one of the key subunits of the NADPH oxidase complex, and measured amiloride-sensitive currents in response to EGF. In contrast to control cells, EGF had no effect in Rac1 knockdown cells. We hypothesize that EGF, insulin, and IGF-1 have a common stimulatory effect on ENaC mediated by ROS production.
Keywords: NADPH oxidase, oxidative stress, hydrogen peroxide, Rac1, growth factors
in the kidney, discretionary Na+ reabsorption in response to endocrine input to the aldosterone-sensitive distal nephron (ASDN) is a determinant of the pressure-natriuresis relationship, which has fundamental importance in the long-term control of arterial pressure (15). ENaC activity is the rate-limiting step for this Na+ transport (2). Dysfunction and aberrant regulation of ENaC lead to a spectrum of diseases associated with abnormal Na+ handling, ranging from hyper- and hypotension with Na+ retention and wasting, respectively, to respiratory syndromes linked to cystic fibrosis (6, 11, 51).
Development of hypertension is linked to aberrations in the Na+ handling in the cortical collecting duct (CCD), where the fine tuning of Na+ reabsorption takes place (56). Increased levels of oxidative stress have been described in several experimental models of hypertension (30) and hypertensive patients (29, 30, 49). Principal cells of the CCD are capable of producing and secreting reactive oxygen species (ROS), particularly hydrogen peroxide (H2O2; Ref. 52). CCD cells contain several sources of ROS, like the enzymes in the mitochondrial respiration chain and NADPH oxidases in the plasma membrane. These enzymes mediate many pathophysiological processes in the kidney including those that are associated with improper regulation of ion channels (30). H2O2 reportedly decreased the activity of ROMK channels and the inhibitory effect of H2O2 was more significant in the CCD derived from rats on a K+-deficient diet than that from rats on a normal-K+ or a high-K+ diet (63). It has also been recently demonstrated that insulin increases generation of ROS in part through activation of NADPH oxidases and contributes to modulation of transient receptor potential canonical 6 channel activity in the podocytes (28). Importantly, it was recently shown that H2O2 increased ENaC activity in amphibian A6 cells via a phosphatidylinositol 3-kinase (PI3-kinase)-mediated increase in apical phosphatidylinositol 3,4,5-trisphosphate level (33). The author provides evidence that H2O2 modulates both channel open probability and single channel current amplitude. The change in current amplitude in response to H2O2 (33) most likely reflects a change in electrochemical driving force that might be generated by other channels/transporters, such as Na+-K+-ATPase. However, the effects of ROS on Na+-K+-ATPase-mediated sodium absorption in the ASDN require further investigations. Moreover, superoxide (O2·−) can increase aldosterone-mediated stimulation of ENaC by scavenging nitric oxide (65). Therefore, ROS participate in the regulation of various channels and transporters in the CCD, particularly ENaC, and thus their generation might be linked to diseases associated with ion channels. However, it has been essentially unknown what mechanisms trigger ROS production in this case.
It is known that epidermal growth factor (EGF; Refs. 31, 32, 37, 66), insulin (7, 8, 10, 22, 24, 36, 39), and insulin-like growth factor-1 (IGF-1; Refs. 22, 57) acutely stimulate ENaC-mediated currents as shown both in patch-clamp studies and in equivalent transepithelial current measurements involving kidney epithelial cell lines. EGF, insulin, and IGF-1 also participate in generation of the ROS (3, 21, 50). For instance, the NADPH oxidase subunit NOX4 was identified as a novel molecular link between insulin-stimulated ROS production and mechanisms involved in the insulin signal transduction (21, 34). It was also demonstrated that insulin and EGF produce an intracellular burst of H2O2 that leads to a subsequent stimulation of Na+ transport (37, 38). Furthermore, it was reported that Rac1-mediated NOX2 activity is an important component in O2·− regulation of ENaC in lung cells (60). It was further proposed that insulin- and EGF-stimulated Na+ transport across A6 cell is mediated by ROS production (37, 38). We and others have also recently demonstrated that angiotensin II (ANG II; Refs. 35, 59) and ethanol (4) elevate ENaC activity in both freshly isolated CCD of mice and immortalized principal cells in a NADPH-dependent manner.
The striking similarity among EGF, insulin, IGF-1, and ROS stimulation of ENaC-mediated Na+ transport in the ASDN may suggest that these ligands induce production of the ROS, which subsequently activates downstream signaling cascades. The aim of this study was to test whether EGF, insulin, and IGF-1 have a common ROS-mediated stimulatory effect on transepithelial current in principal cells of ASDN.
MATERIALS AND METHODS
Cell culture and lentiviral transduction.
Immortalized mouse cortical collecting duct (mpkCCDc14) cells were kindly provided by Dr. Alain Vandewalle (INSERM, Paris, France) and described previously (5). M-1 cells (58) were obtained from ATCC (Manassas, VA) and maintained under standard culture conditions (DMEM, 10% FBS, 1× Pen/Strep, 37°C, and 5% CO2-95% air atmosphere). Growth medium for mpkCCDc14 principal cells was composed of equal volumes of DMEM and Ham's F-12, 50 nM dexamethasone, 1 nM triiodothyronine, 2% FBS, and 1%/vol Pen/Strep. The mpkCCDc14 cells were also grown in a 5% CO2-95% air atmosphere incubator at 37°C. For electrophysiological experiments, M-1 and mpkCCDc14 cells were grown in defined medium on permeable supports (Costar Transwells; 0.4-μm pore, 24-mm diameter) as described previously (5, 27, 47, 57). The cells were seeded onto permeable supports at a density of 0.2–0.3 × 10⁶ cells/filter and kept on filter supports for at least 7 days. The medium was changed every other day allowing cells to polarize and form monolayer with high resistance and avid Na+ absorption. Eighteen hours before use in any experiment, the medium of the cells incubated on filter supports was replaced with minimal medium that contained only DMEM, Ham's F-12 and antibiotics.
Rac1 short hairpin (sh)RNA lentiviral particles (sc-36352-V; Santa Cruz Biotechnology, Santa Cruz, CA) were used for the inhibition of Rac1 expression in M-1 cells (27). Control shRNA lentiviral particles (sc-108080; Santa Cruz Biotechnology) were used to confirm the selectivity of the lentiviruses. After transduction with Santa Cruz transfection reagent (sc-108061), a stable cell line expressing the shRNA was isolated via puromycin selection (27).
Electrophysiological studies.
Equivalent short circuit current (Ieq) across the mpkCCDc14 cell monolayer was calculated using Ohm's law as the quotient of transepithelial voltage (VT) to transepithelial electrical resistance (RT) under open circuit conditions using a Millicel Electrical Resistance System with dual Ag/AgCl pellet electrodes (Millipore) to measure VT and RT. To determine the amiloride-sensitive current, 10 μM amiloride were added to the apical cell surface at the end of experiments. EGF (E4127), insulin (I6634), and apocynin (W508454) were obtained from Sigma-Aldrich (St. Louis, MO). IGF-1 (50-990-805) was received from Fisher Scientific. ML171 (492002) was obtained from EMD Millipore.
Western blot analysis.
mpkCCDc14 were washed twice in PBS and lysed in a buffer as described previously (46). Equal amounts of proteins were separated by using 7.5% SDS-PAGE and were electrophoretically transferred onto nitrocellulose membrane (Millipore, MA), immunoblotted with the appropriate antibody, and visualized by ECL (Amersham Biosciences). Antibodies for the NADPH oxidase subunits were from Sigma-Aldrich (NOX1; cat. no. SAB4200097), BD Biosciences (NOX2; cat. no. 611414), Novus Biologicals (NOX4; NB110-58851), Santa Cruz (p22-phox; sc-271262), and Millipore (p67-phox and Rac1; 07-502 and 05-389, respectively).
Total ROS detection.
mpkCCDc14 cells were maintained with standard culture conditions. The day before the experiment, the cells were seeded onto glass slides to ensure 50–70% confluence on the day of the experiment. Cells were incubated with apocynin (500 μM) overnight. For the measurements of H2O2 production, cells were loaded with 4 μg/ml of CM-H2DCF-DA (2′,7′-dichlorofluorescein acetate, DCF; Enzo Life Sciences) dissolved in PBS and incubated for 1 h in the dark at room temperature. Incubation times and concentrations of EGF/IGF-1/insulin were carefully selected from transepithelial current measurements in response to EGF/IGF-1/insulin and published literature (8, 31, 37, 38, 57). We have selected approximately half maximum concentrations and times required to acutely activate ENaC-mediated transport. Vehicle or experimental agents were added to the cells 1 h (EGF, 50 ng/ml), 20 min (IGF, 100 ng/ml), or 10 min (insulin, 100 nM) before the end of incubation. A ROS inducer (200 μM pyocyanin; ENZ-53001-C001; Enzo Life Sciences) and inhibitor (5 mM N-acetyl-l-cysteine; ALX-105-005-G001; Enzo Life Sciences) were added 30 min before the end of the incubation to demonstrate that the cells provided the predicted response to these drugs. After incubation with the dye and the reagent, the cells were washed with 1× PBS twice, and then the glass slides were immediately overlaid with a coverslip and observed under the fluorescent microscope. For the staining with DCF, the images of the mpkCCDc14 cells were taken with the same exposure time with a fluorescence microscope Eclipse E-600 (Nikon Instruments, Tokyo, Japan) using a ×20 objective. The signal was excited at 490 nm, and emission was collected at 525 nm. Fluorescent images were processed with the Metamorph 7.5 software (Molecular Devices) and open source software ImageJ 1.42q (http://rsb.info.nih.gov/ij). Twenty or more regions were chosen on each coverslip; at least two coverslips were treated with an agent or vehicle. Three sets of similar experiments were conducted for each agent tested, and background levels were subtracted. Smaller regions on the coverslips were chosen rather than the whole coverslip to avoid the cells with low fluorescence levels and to record the CM-H2DCF-DA signal from the cells fluorescing above the defined threshold that would amount to 50–55% of the highest fluorescence level detected on the slide (signal levels were detected with ImageJ software; no postprocessing of the images intensity/brightness/contrast was performed).
Staining with rhodamin-phalloidin.
M-1 cells were seeded on 12-mm round coverslips coated with poly-d-lysine (BD Biosciences) 24 h before experiments and grown to confluence of ∼70%. Before staining, the cells were washed with PBS and fixed with 1.2% paraformaldehyde (Sigma-Aldrich). Then, cells were treated with 0.1% Tryton X-100 for 5 min, washed with PBS and incubated with 2 μM of rhodamine-phalloidin (Life Technologies) for 15 min at 37°C. Stained cells were mounted on glass slides with Vectashield mounting medium (Vector Laboratories). M-1 cells stained with rhodamine-phalloidin were visualized with an Eclipse E-600 microscope, (Nikon Instruments, Tokyo, Japan), using a ×60 oil objective equipped with a CCD camera (Princeton Instruments). The signal was excited at 546 nm, and emission was collected at 590 nm.
Electron microscopy.
For the electron microscopy experiments, wild-type and Rac1 knockdown M-1 cells were fixed in 2% glutaraldehyde buffered in 0.1 M cacodylate (pH 7.4) for 1 h at room temperature and washed three times for 5 min in 0.1 M cacodylate buffer. After that, the cells were postfixed in 1% osmium tetroxide reduced with 1.25% potassium ferricyanide on ice for 2 h. Then, the specimen was washed three times for 5 min in distilled water, dehydrated through graded methanol, and embedded in EMBed 812 epoxy resin. After embedding, ultrathin sections were cut on a RMC Powertome and stained with uranyl acetate and Reynolds lead citrate. Sections were viewed in a Hitachi HS600 transmission electron microscope (Hitachi High Technologies), and images were recorded via an AMT 1K digital imaging camera.
Statistics.
All summarized data are reported as means ± SE. Data are compared using either the Student's (two-tailed) t-test or a one-way ANOVA, and P < 0.05 is considered significant.
RESULTS
NADPH oxidase subunits are expressed in the CCD principal cells.
NADPH oxidase is comprised of the membrane-bound proteins NOX2 (gp91phox) and p22phox, as well as several regulatory proteins termed p40phox, p47 phox, and p67 phox, and of the small GTPase Rac (30). In addition to NOX2, other NADPH oxidase subunits, such as NOX1, NOX3, NOX4, NOX5, and DUOX1 and DUOX2 have been identified (17, 30). Mouse polarized CCD mpkCCDc14 cells used in this study were tested for the expression of the NADPH oxidase complex subunits. As shown by Western blotting experiments (Fig. 1), mpkCCDc14 cells express all tested proteins. Particularly, NOX1, NOX2, and NOX4 (band observed at ∼31 kDa may represent a reported splice isoform; Ref. 23), as well as p22phox, p67phox, and Rac1 were identified (Fig. 1).
Fig. 1.
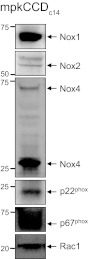
NAPDH subunits expression in cultured mouse cortical collecting duct (mpkCCDc14) principal cells. Western blotting confirmed the expression of the main subunits of the NADPH oxidase complex in the mpkCCDc14 cells. Western blot analysis was repeated 3 times with similar results.
EGF, insulin, and IGF-1 stimulate ROS production in mpkCCDc14 cells.
Fluorescent microscopy measurements were employed to study changes in the production of ROS in the mpkCCDc14 cells in response to acute application of EGF, insulin, and IGF-1. The CM-H2DCF-DA reagent (also referred to as DCF; Ref. 16), a cell-permeable probe that fluoresces upon oxidation, was used to measure the relative production of ROS in vehicle and EGF-, insulin-, and IGF-1-treated cells. Figures 2, 3, and 4 demonstrate that treatment with 50 ng/ml of EGF, 100 nM of insulin, and 100 ng/ml of IGF-1 for 1 h, 10 min, and 20 min, respectively, results in a significant increase of the DCF fluorescence compared with vehicle. Ten minutes for insulin treatment were selected based on the published data (38), which revealed that the maximum signal for hydrogen peroxide production in A6 cells monolayers stimulated by insulin was observed after 5 min of treatment and sustained for at least 30 min. For IGF-1 and EGF stimulation, preliminary experiments were carried out to estimate the time point that would show the initial increase in DCF fluorescence (data not shown).
Fig. 2.

Acute application of epidermal growth factor (EGF) stimulates reactive oxygen species (ROS) formation in the mpkCCDc14 cells. Shown are the representative fluorescent micrographs of the mpkCCDc14 cells loaded with CM-H2DCF-DA and treated with vehicle, the ROS inducer pyocyanin (200 μM), the NADPH complex inhibitor apocynin (500 μM), and EGF (50 ng/ml) in the absence or presence of apocynin. Scale bar shown is common for all the images. Summary graph displays the total fluorescence intensity measured from the images of the mpkCCDc14 cells (n = 24 in each group) treated with different experimental agents. Background fluorescence level was corrected. *Significant difference between groups.
Fig. 3.

Acute application of insulin stimulates ROS formation in the mpkCCDc14 cells. Shown are the representative fluorescent micrographs of the mpkCCDc14 cells loaded with CM-H2DCF-DA and treated with vehicle, the ROS inducer pyocyanin (200 μM), the NADPH complex inhibitor apocynin (500 μM), and insulin (100 nM) in the absence or presence of apocynin. Scale bar shown is common for all the images. Summary graph displays the total fluorescence intensity measured from the images of the mpkCCDc14 cells (n = 25 in each group) treated with different experimental agents. Background fluorescence level was corrected. *Significant difference between groups.
Fig. 4.

Acute application of insulin-like growth factor-1 (IGF-1) stimulates ROS formation in the mpkCCDc14 cells. Shown are the representative fluorescent micrographs of the mpkCCDc14 cells loaded with CM-H2DCF-DA and treated with vehicle, the ROS inducer pyocyanin (200 μM), the NADPH complex inhibitor apocynin (500 μM), and IGF-1 (100 ng/ml) in the absence or presence of apocynin. Scale bar shown is common for all the images. Summary graph displays the total fluorescence intensity measured from the images of the mpkCCDc14 cells (n = 20 in each group) treated with different experimental agents. Background fluorescence level was corrected. *Significant difference between groups.
Treatment with EGF, insulin, and IGF-1 resulted in 1.27 ± 0.04, 1.23 ± 0.04, and 1.25 ± 0.05-fold increases in fluorescence levels for corresponding ligands, respectively, compared with 1 in vehicle-treated cells (Figs. 2–4, summary graphs). For these experiments, all data were normalized to the fluorescence levels detected for cells treated with vehicle and determined consecutively in each group. N-acetyl-l-cysteine and pyocyanin were used as negative (not shown) and positive controls of changes in ROS production and demonstrated almost no fluorescent signal and elevation of DCF fluorescence, respectively, in all studied groups.
To ensure that NADPH oxidase is involved in the mechanism of EGF-, insulin-, and IGF-1-mediated ROS production, we used the NADPH oxidase inhibitor apocynin (16, 17). Apocynin inhibits the NADPH oxidase complex by preventing the transfer of the soluble cytosolic subunits to the membrane complex. Overnight treatment with 500 μM apocynin resulted in impaired relative fluorescence signal that was not significantly increased by treatment with EGF, insulin, or IGF-1 (Figs. 2–4). Thus these data demonstrate that the NADPH oxidase complex is required for EGF, insulin, and IGF-1 to cause acute intracellular ROS production in mpkCCDc14 cells.
Effects of EGF, insulin, and IGF on transepithelial currents are abolished by the inhibition of the NADPH oxidase complex.
To further test whether an increase in ROS production and upregulation of ENaC activity in response to EGF-, insulin-, and IGF-1 intercross, we performed equivalent transepithelial current (Ieq) measurements across the mpkCCDc14 cell monolayer. Amiloride (10 μM) was added to the apical membrane at the end of experiments to reveal amiloride-sensitive current, which most likely represents ENaC-mediated Na+ absorption through the monolayer. The experimental design included treatment with vehicle and incubation with 10 ng/ml of EGF, 20 nM of insulin, and 100 ng/ml of IGF-1 either alone or against the background of overnight apocynin treatment. Overnight pretreatment with 500 μM apocynin was only used as a control treatment that was repeated independently in every experiment. EGF, insulin, and IGF-1 (all applied basolaterally) significantly increased the amiloride-sensitive transepithelial current through the mpkCCDc14 cell monolayer (Fig. 5). However, pretreatment with apocynin significantly blunted the response of the amiloride-sensitive currents to the stimulation with EGF, insulin, or IGF-1 (Fig. 5, A–C).
Fig. 5.

EGF, insulin, and IGF-1 acutely increase transepithelial currents in mpkCCDc14 cells via NADPH-mediated ROS production. Shown are summary graphs of equivalent transepithelial current (Ieq) in mpkCCDc14 principal cells in response to 10 ng/ml of EGF (A), 20 nM of insulin (B), and 100 ng/ml of IGF-1 (C). EGF, insulin, IGF-1 and vehicle were added basolaterally at time 0, and current was normalized to the starting level. For experiments with apocynin, cells were incubated with inhibitor (500 μM) overnight before the experiment. Amiloride (10 μM; arrow) was added to the apical membrane at the end of experiment. Values are means ± SE of at least 6 observations.
Inhibition of the NADPH oxidases with ML171 decreases transepithelial currents evoked by stimulation with EGF.
Apocynin should be used with caution since it was described predominantly as an antioxidant in endothelial cells and vascular smooth muscle cells (25). Therefore, considering that apocynin may be acting predominantly as a scavenger, thereby circumventing NADPH oxidase activity, we used another structurally distinct pharmacological inhibitor of NADPH oxidases, phenothiazine compound ML171 (17, 19, 64). ML171 does not scavenge ROS, this being an important advantage of this drug compared with apocynin used in Figs. 2–5. ML171 (20 μM) significantly blunted the transepithelial currents through mpkCCDc14 cell monolayers stimulated by 10 ng/ml EGF (Fig. 6A). ML171 alone did not have any significant effect on the current. Similarly, 20 μM ML171 diminished the IGF-1- and insulin-mediated increase in transepithelial current in the mpkCCDc14 cells (data not shown). ML-171 has the IC50 of 0.25 μM for NOX1 and the IC50 >3 μM for other NADPH oxidases (17, 19). Concentration of ML171 that was reported to be selectively inhibiting for the NOX1 showed slight inhibition of the Na+ transport that was not statistically significant as illustrated by Fig. 6B, which shows a summary of experiments with mpkCCDc14 cells treated with 0.5 μM of ML171 against the background of Na+ transport stimulated with 20 nM of insulin.
Fig. 6.

Effects of the NADPH oxidase (NOX) inhibitor ML171 on EGF- and insulin-stimulated transepithelial currents in mpkCCDc14 cells. Shown are the summary graph of equivalent transepithelial current (Ieq) across the monolayer of the mpkCCDc14 principal cells in response to 10 ng/ml of EGF (A) or 20 nM insulin (B). EGF or insulin and vehicle were added basolaterally alone or together with ML171 (20 μM for EGF and 0.5 μM for insulin, respectively; bilaterally) at time 0; current was normalized to the starting level. Amiloride (10 μM; arrow) was added to the apical membrane at the end of experiment. Values are means ± SE of at least 6 observations.
Stimulation of the ROS production by xanthine-xanthine oxidase reaction disrupts actin cytoskeleton and increases equivalent short-circuit currents in the mpkCCDc14 cells.
We addressed here a question whether elevated production of the ROS affects the transepithelial current in these cells. Ieq measurements were performed on the monolayers of the mpkCCDc14 cells seeded on permeable supports in the presence or absence of xanthine and/or xanthine oxidase. Xanthine oxidase catalyzes xanthine to uric acid and in an adjacent reaction reduces oxygen to superoxide ion that further spontaneously dismutes to H2O2. Figure 7A illustrates significant increase in equivalent short circuit current across the mpkCCDc14 monolayers in presence of xanthine (250 μM) and xanthine oxidase (15 mU/ml). Neither xanthine nor xanthine oxidase alone had any effect on the transepithelial current. In the adjacent experiments, we tested the effects of the xanthine-xanthine oxidase reaction on the structure of the actin microfilaments. F-actin was visualized by staining with rhodamine-phalloidin. As shown in the representative images in Fig. 7B, microfilaments appear significantly destructed after 2 h of treatment with xanthine-xanthine oxidase.
Fig. 7.

ROS production by a xanthine (X)-xanthine oxidase (XO) reaction results in the destruction of actin microfilaments and an increase of transepithelial currents in mpkCCDc14 cells. A: reaction of 250 μM of xanthine and 15 mU of xanthine oxidase elevated ENaC-mediated currents as measured by equivalent transepithelial current (Ieq) in mpkCCDc14 cells. Xanthine or xanthine oxidase alone and together and vehicle were applied bilaterally at time 0 and current was normalized to the starting level. Values are means ± SE of at least 6 observations. B: visualization of the actin cytoskeleton by staining with rhodamine-phalloidin in mpkCCDc14 cells before (left) and after (right) treatment with 250 μM of xanthine and 15 mU of xanthine oxidase for 2 h. Scale bar shown is 20 μm.
Knockdown of Rac1 decreases ROS production and precludes EGF-mediated increase of transepithelial current in M-1 cells.
We have recently demonstrated an essential role for small GTPase Rac1, which represents an essential subunit of the NADPH oxidase complex, in the regulation of ENaC activity (27). To test a role of the NADPH complex in the regulation of transepithelial current by EGF, we have used a previously generated M-1 stable cell line with knockdown of Rac1, in which Rac1 expression was up to 75% decreased as previously shown by Western blotting and densitometry assays (27). Efficient downregulation of Rac1 expression in M-1 cells stably expressing anti-Rac1 shRNA was verified by Western blot analysis (Fig. 8A). As we have previously shown with transepithelial current measurements and patch clamp analysis, Rac1 knockdown significantly decreased basal transepithelial current and ENaC activity in the M-1 cells (27). Many of the Rac1 functions are mediated through regulation of actin organization (12). To test whether knockdown of Rac1 destroyed the actin cytoskeleton integrity, we performed additional experiments. Staining with rhodamine-phalloidin was performed to trace any changes in the spatial organization of the actin cytoskeleton that could be due to the knockdown of this small GTPase. However, as shown on Fig. 8B, knockdown of Rac1 did not alter the distribution of the actin cytoskeleton within the cells. To further confirm that knockdown of Rac1 did not affect the morphology of the cells and their polarity, electron microscopy experiments were performed. As demonstrated on the representative electron micrographs on Fig. 8C, Rac1 knockdown did not elicit any changes in the M-1 cell phenotype compared with control. For instance, close-up images demonstrate that tight junctions as well as monolayer integrity remain unchanged.
Fig. 8.

Short hairpin (sh)RNA-mediated silencing of Rac1 does not affect integrity of M-1 cells. A: Western blot from control M-1 cells (scrambled shRNA) or a stable cell line expressing shRNA vs. Rac1 (Rac1 KD). Cell lysates were analyzed using anti-Rac1 antibodies (top). Equal loading was verified by anti-β-actin antibodies (bottom). Shown are representative data from 3 experiments. B: representative staining of the actin cytoskeleton with rhodamine-phalloidin in the control (left) and Rac1 KD (right) M-1 cells. C: electron micrographs of the control and Rac1 KD M-1 cell monolayers grown on a permeable support at ×4,000 and ×1,2000 magnifications (top and bottom, respectively). Scale bars are shown.
As we previously demonstrated, Rac1 knockdown cells exhibited diminished equivalent short circuit currents compared with control (scrambled shRNA) cells (27). We further tested whether Rac1 knockdown cells are stimulated by EGF. As shown by equivalent transepithelial current measurements, Rac1 depletion prevents an elevation in amiloride-sensitive currents in response to 10 ng/ml of EGF that is observed in wild-type cells (Fig. 9A). Therefore, Rac1 is required for acute stimulation of transepithelial currents by EGF. Corresponding transepithelial resistances (RT) for the represented Ieq experiment are reported in Fig. 9B. Interestingly, treatment with EGF did not decrease RT, which might suggest that EGF is affecting other components of the ion transport process in these cells. For instance, future studies are required to test whether EGF affects paracellular transport. While the distal nephron, including CCD, is considered a tight epithelium with high transepithelial resistance and low passive ion permeability (56), the paracellular pathway in the collecting duct might also play a role in transepithelial absorption.
Fig. 9.

Effects of EGF on transepithelial currents in control and Rac1 KD M-1 cells. Shown is a summary graph of equivalent transepithelial current (Ieq) in M-1 cells in response to 10 ng/ml of EGF. M-1 cells were serum-starved overnight before the experiment. EGF and vehicle were added bilaterally at time 0 and current was normalized to the starting level (A). Transepithelial resistance (Req) changes in response to EGF stimulation in wild-type and Rac1 knockdown cells are also shown (B). Values are means ± SE of at least 6 observations. Amiloride (10 μM; arrow) was added to the apical membrane at the end of the experiment.
DISCUSSION
Several studies have demonstrated that ROS production can interfere with the activity of channels and transporters in the kidney (18, 33, 37, 38, 43–45, 53–55). NADPH oxidase, mitochondria, xanthine oxidase, lypoxygenase, cytochrome P-450 monooxygenase, and heme-oxygenase 1 are sources of ROS in the organism. Despite the existence of several sources of ROS, NADPH oxidase appears to be especially important for the redox signal in the kidney. Multiple stimuli trigger ROS production, which allows a tight regulation of intracellular ROS levels within the short time required for signal transduction. The kidney has a wide distribution of various NADPH oxidase subunits in its blood vessels, interstitial cells, glomeruli, and tubules. NOX1, NOX2, and NOX4 have all been identified within the kidney (14, 20). NAPDH oxidase complex subunits NOX1, NOX2, NOX4, p22, p67, and Rac1 were found to be expressed in the mouse CCD mpkCCDc14 cell line ensuring that there are all necessary parts for the assembly of the fully functional NADPH complex that can participate in various signaling processes.
As shown by the fluorescent microscopy, mpkCCDc14 cells exhibit elevation in ROS level in response to stimulation with EGF, insulin, and IGF-1. Therefore, insulin and growth factors stimulate signaling mechanisms that lead to ROS production and might be implicated into regulation of various intracellular processes. Equivalent transepithelial current measurements in mpkCCDc14 cell monolayers showed that stimulation of transepithelial currents, which are most likely ENaC mediated, by EGF, insulin, and IGF-1 was significantly impaired when the cells were pretreated with apocynin. Therefore, the inhibition of the NADPH oxidase complex assembly and consequent impairing of the ROS production prevent the effect of EGF, insulin, and IGF-1 on amiloride-sensitive currents. This observation supports the hypothesis that ROS production is implicated in the mechanism of EGF-, insulin-, and IGF-1-mediated increase in ENaC activity. We believe that ENaC is one of the main channels/transporters mediating transepithelial current investigated in current study. However, other channels and transporters such as Na+-K+-ATPase and ROMK could be regulated by ROS production and play a significant role in the current formation.
The stimulatory effects of EGF, insulin, and IGF-1 are initiated by binding of ligands to the corresponding receptors. A number of downstream pathways, including the PI3-kinase and the MAPK1/2 kinase, are proposed (7, 32, 33, 36, 37). However, it is not clear which specific pathways are triggering ROS-mediated acute effects of EGF, insulin, and IGF-1 and whether these pathways are interacting.
There are two major ways to affect ENaC activity: 1) by altering channel gating (Po); or 2) by altering the expression levels of the protein in the membrane (N). Blazer-Yost and colleagues (7–9, 48) demonstrated that insulin stimulated apical Na+ entry in A6 cells by the exocytotic insertion of Na+ channels into the apical membrane in a PI3-kinase-mediated manner. In contrast, Marunaka et al. (39) proposed that stimulation of ENaC activity by insulin is mediated by an increase in the channel open probability. The acute effects of EGF and IGF-1 are also most likely mediated by changes in Po (32, 57). H2O2 also enhances ENaC activity by modifying channel gating (33). We did not study whether ROS production results in the changes in the number of channels at the apical plasma membrane or increase in the Po. However, we hypothesize that ROS, and particularly H2O2 generation, could mediate both the number and Po. We have recently demonstrated that activation of the NADPH oxidase signaling pathway mediates ANG II actions on ENaC and the effects of ANG II on ENaC involved both increase in the Po and the number of active channels (35). Similarly, it was recently shown that inhibition of NADPH oxidase with DPI abolished the stimulatory effect of ANG II on ENaC, and application of superoxide donors, pyrogallol, or xanthine and xanthine oxidase, significantly increased ENaC activity (59). What is more, there has recently been proposed a mechanism in which ethanol through ROS production activates PI3-kinase that stimulates production of phosphatidylinositol 3,4,5-trisphosphate that in turn can increase ENaC open probability and the density of ENaC in the membrane (4).
Small GTPase Rac1 is one of the key subunits that NADPH oxidase is comprised of, and it is essential for ROS production. Rac1 knockdown was performed in mouse CCD principal M-1 cells and neither altered the polarity and integrity of the cell monolayer nor induced any reorganization in the actin cytoskeleton structure. Interestingly, Rac1 knockdown cells as opposed to wild-type cells were not responsive to stimulation with EGF and exhibited significantly blunted ROS production. This would favor the hypothesis that Rac1 as a part of the NADPH complex is important for ROS production in these cells. It has been recently shown that EGF possesses a biphasic effect on ENaC-mediated currents with the acute stimulatory effect and long-term phase characterized by a decrease in the current (31, 32). Interestingly, treatment of the Rac1 knockdown cells with EGF caused a small decrease in the amiloride-sensitive current rate rather than an acute stimulatory effect.
It has been established that ENaC is regulated by reorganization of the actin cytoskeleton (13, 40). We have demonstrated before that Po of ENaC is upregulated by depolymerization of F-actin both in cultured and freshly isolated cells of the CCDs (26). F-actin is one of the final effectors of the ROS in the cells as it is disrupted upon their action. Here we have shown that the reaction of xanthine with xanthine oxidase that produces ROS causes a significant increase of ENaC currents in mpkCCDc14 cells, against the background of the destructed actin microfilaments. These data allow hypothesizing that ROS produced by EGF, IGF-1, and insulin might depolymerize F-actin thus causing the upregulation of ENaC activity.
In summary, the present study provides the first evidence that EGF, insulin, and IGF-1 have a common stimulatory effect on transepithelial currents in principal cells mediated by ROS production. These studies should be further confirmed in vivo. As it was previously demonstrated, high-salt intake in the Dahl salt-sensitive rats elevates both O2·− and H2O2 production (1, 42, 61, 62). Similarly, it was shown that O2·− production was significantly elevated in the medulla and cortex of Dahl salt-sensitive rats fed a high-Na+ diet (41). Our data show that changes in EGF, insulin, and IGF-1 level in the kidney cortex might be involved via ROS production and subsequent depolymerization of the actin microfilaments into upregulation of ENaC and development of ENaC-mediated hypertension.
GRANTS
This research was supported by National Heart, Lung, and Blood Institute Grant R01-HL-108880 and American Diabetes Association Grant 1-10-BS-168 (to A. Staruschenko) and American Heart Association Grant 10POST4140109 (to T. S. Pavlov).
DISCLOSURES
No conflicts of interest, financial or otherwise, are declared by the author(s).
AUTHOR CONTRIBUTIONS
Author contributions: D.V.I. and A.S. conception and design of research; D.V.I., T.S.P., and V.L. performed experiments; D.V.I., T.S.P., and V.L. analyzed data; D.V.I., T.S.P., and A.S. interpreted results of experiments; D.V.I., T.S.P., V.L., and A.S. prepared figures; D.V.I. and A.S. drafted manuscript; D.V.I., T.S.P., and A.S. edited and revised manuscript; D.V.I., T.S.P., V.L., and A.S. approved final version of manuscript.
ACKNOWLEDGMENTS
Glen Slocum is recognized for excellent technical assistance with microscopy experiments.
REFERENCES
- 1. Abe M, O'Connor P, Kaldunski M, Liang M, Roman RJ, Cowley AW., Jr Effect of sodium delivery on superoxide and nitric oxide in the medullary thick ascending limb. Am J Physiol Renal Physiol 291: F350–F357, 2006 [DOI] [PubMed] [Google Scholar]
- 2. Ashkroft FM. Ion channels and disease. San Diego, CA: Academic, 2000, p. 1–502 [Google Scholar]
- 3. Bae YS, Kang SW, Seo MS, Baines IC, Tekle E, Chock PB, Rhee SG. Epidermal growth factor (EGF)-induced generation of hydrogen peroxide. Role in EGF receptor-mediated tyrosine phosphorylation. J Biol Chem 272: 217–221, 1997 [PubMed] [Google Scholar]
- 4. Bao HF, Song JZ, Duke BJ, Ma HP, Denson DD, Eaton DC. Ethanol stimulates epithelial sodium channels by elevating reactive oxygen species. Am J Physiol Cell Physiol. First published August 15, 2012; doi:10.1152/ajpcell.00139.2012 [DOI] [PMC free article] [PubMed] [Google Scholar]
- 5. Bens M, Vallet V, Cluzeaud F, Pascual-Letallec L, Kahn A, Rafestin-Oblin ME, Rossier BC, Vandewalle A. Corticosteroid-dependent sodium transport in a novel immortalized mouse collecting duct principal cell line. J Am Soc Nephrol 10: 923–934, 1999 [DOI] [PubMed] [Google Scholar]
- 6. Bhalla V, Hallows KR. Mechanisms of ENaC regulation and clinical implications. J Am Soc Nephrol 19: 1845–1854, 2008 [DOI] [PubMed] [Google Scholar]
- 7. Blazer-Yost BL, Esterman MA, Vlahos CJ. Insulin-stimulated trafficking of ENaC in renal cells requires PI3-kinase activity. Am J Physiol Cell Physiol 284: C1645–C1653, 2003 [DOI] [PubMed] [Google Scholar]
- 8. Blazer-Yost BL, Liu X, Helman SI. Hormonal regulation of ENaCs: insulin and aldosterone. Am J Physiol Cell Physiol 274: C1373–C1379, 1998 [DOI] [PubMed] [Google Scholar]
- 9. Blazer-Yost BL, Paunescu TG, Helman SI, Lee KD, Vlahos CJ. Phosphoinositide 3-kinase is required for aldosterone-regulated sodium reabsorption. Am J Physiol Cell Physiol 277: C531–C536, 1999 [DOI] [PubMed] [Google Scholar]
- 10. Blazer-Yost BL, Vahle JC, Byars JM, Bacallao RL. Real-time three-dimensional imaging of lipid signal transduction: apical membrane insertion of epithelial Na+ channels. Am J Physiol Cell Physiol 287: C1569–C1576, 2004 [DOI] [PubMed] [Google Scholar]
- 11. Bonny O, Hummler E. Dysfunction of epithelial sodium transport: from human to mouse. Kidney Int 57: 1313–1318, 2000 [DOI] [PubMed] [Google Scholar]
- 12. Bosco EE, Mulloy JC, Zheng Y. Rac1 GTPase: a “Rac” of all trades. Cell Mol Life Sci 66: 370–374, 2009 [DOI] [PMC free article] [PubMed] [Google Scholar]
- 13. Cantiello HF, Stow JL, Prat AG, Ausiello DA. Actin filaments regulate epithelial Na+ channel activity. Am J Physiol Cell Physiol 261: C882–C888, 1991 [DOI] [PubMed] [Google Scholar]
- 14. Chabrashvili T, Tojo A, Onozato ML, Kitiyakara C, Quinn MT, Fujita T, Welch WJ, Wilcox CS. Expression and cellular localization of classic NADPH oxidase subunits in the spontaneously hypertensive rat kidney. Hypertension 39: 269–274, 2002 [DOI] [PubMed] [Google Scholar]
- 15. Cowley AW., Jr Long-term control of arterial blood pressure. Physiol Rev 72: 231–300, 1992 [DOI] [PubMed] [Google Scholar]
- 16. Dikalov S, Griendling KK, Harrison DG. Measurement of reactive oxygen species in cardiovascular studies. Hypertension 49: 717–727, 2007 [DOI] [PMC free article] [PubMed] [Google Scholar]
- 17. Drummond GR, Selemidis S, Griendling KK, Sobey CG. Combating oxidative stress in vascular disease: NADPH oxidases as therapeutic targets. Nat Rev Drug Discov 10: 453–471, 2011 [DOI] [PMC free article] [PubMed] [Google Scholar]
- 18. Garvin JL, Ortiz PA. The role of reactive oxygen species in the regulation of tubular function. Acta Physiol Scand 179: 225–232, 2003 [DOI] [PubMed] [Google Scholar]
- 19. Gianni D, Taulet N, Zhang H, DerMardirossian C, Kister J, Martinez L, Roush WR, Brown SJ, Bokoch GM, Rosen H. A novel and specific NADPH oxidase-1 (Nox1) small-molecule inhibitor blocks the formation of functional invadopodia in human colon cancer cells. ACS Chem Biol 5: 981–993, 2010 [DOI] [PMC free article] [PubMed] [Google Scholar]
- 20. Gill PS, Wilcox CS. NADPH oxidases in the kidney. Antioxid Redox Signal 8: 1597–1607, 2006 [DOI] [PubMed] [Google Scholar]
- 21. Goldstein BJ, Mahadev K, Wu X, Zhu L, Motoshima H. Role of insulin-induced reactive oxygen species in the insulin signaling pathway. Antioxid Redox Signal 7: 1021–1031, 2005 [DOI] [PMC free article] [PubMed] [Google Scholar]
- 22. Gonzalez-Rodriguez E, Gaeggeler HP, Rossier BC. IGF-1 vs insulin: respective roles in modulating sodium transport via the PI-3 kinase/Sgk1 pathway in a cortical collecting duct cell line. Kidney Int 71: 116–125, 2007 [DOI] [PubMed] [Google Scholar]
- 23. Goyal P, Weissmann N, Rose F, Grimminger F, Schafers HJ, Seeger W, Hanze J. Identification of novel Nox4 splice variants with impact on ROS levels in A549 cells. Biochem Biophys Res Commun 329: 32–39, 2005 [DOI] [PubMed] [Google Scholar]
- 24. Herrera FC. Effect of insulin on short-circuit current and sodium transport across toad urinary bladder. Am J Physiol 209: 819–824, 1965 [DOI] [PubMed] [Google Scholar]
- 25. Heumuller S, Wind S, Barbosa-Sicard E, Schmidt HH, Busse R, Schroder K, Brandes RP. Apocynin is not an inhibitor of vascular NADPH oxidases but an antioxidant. Hypertension 51: 211–217, 2008 [DOI] [PubMed] [Google Scholar]
- 26. Karpushev AV, Ilatovskaya DV, Pavlov TS, Negulyaev YA, Staruschenko A. Intact cytoskeleton is required for small G protein dependent activation of the epithelial na channel. PLos One 5: e8827, 2010 [DOI] [PMC free article] [PubMed] [Google Scholar]
- 27. Karpushev AV, Levchenko V, Ilatovskaya DV, Pavlov TS, Staruschenko A. Novel role of Rac1/WAVE signaling mechanism in regulation of the epithelial Na+ channel. Hypertension 57: 996–1002, 2011 [DOI] [PubMed] [Google Scholar]
- 28. Kim EY, Anderson M, Dryer SE. Insulin increases surface expression of TRPC6 channels in podocytes: role of NADPH oxidases and reactive oxygen species. Am J Physiol Renal Physiol 302: F298–F307, 2012 [DOI] [PMC free article] [PubMed] [Google Scholar]
- 29. Lacy F, Kailasam MT, O'Connor DT, Schmid-Schonbein GW, Parmer RJ. Plasma hydrogen peroxide production in human essential hypertension: role of heredity, gender, and ethnicity. Hypertension 36: 878–884, 2000 [DOI] [PubMed] [Google Scholar]
- 30. Lassegue B, San MA, Griendling KK. Biochemistry, physiology, and pathophysiology of NADPH oxidases in the cardiovascular system. Circ Res 110: 1364–1390, 2012 [DOI] [PMC free article] [PubMed] [Google Scholar]
- 31. Levchenko V, Zheleznova NN, Pavlov TS, Vandewalle A, Wilson PD, Staruschenko A. EGF and its related growth factors mediate sodium transport in mpkCCDc14 cells via ErbB2 (neu/HER-2) receptor. J Cell Physiol 223: 252–259, 2010 [DOI] [PubMed] [Google Scholar]
- 32. Liu L, Duke BJ, Malik B, Yue Q, Eaton DC. Biphasic regulation of ENaC by TGF-α and EGF in renal epithelial cells. Am J Physiol Renal Physiol 296: F1417–F1427, 2009 [DOI] [PMC free article] [PubMed] [Google Scholar]
- 33. Ma HP. Hydrogen peroxide stimulates the epithelial sodium channel through a phosphatidylinositide 3-kinase-dependent pathway. J Biol Chem 286: 32444–32453, 2011 [DOI] [PMC free article] [PubMed] [Google Scholar]
- 34. Mahadev K, Wu X, Zilbering A, Zhu L, Lawrence JT, Goldstein BJ. Hydrogen peroxide generated during cellular insulin stimulation is integral to activation of the distal insulin signaling cascade in 3T3–L1 adipocytes. J Biol Chem 276: 48662–48669, 2001 [DOI] [PubMed] [Google Scholar]
- 35. Mamenko M, Zaika O, Ilatovskaya DV, Staruschenko A, Pochynyuk O. Angiotensin II increases activity of the epithelial Na+ channel (ENaC) in the distal nephron additively to aldosterone. J Biol Chem 287: 660–671, 2012 [DOI] [PMC free article] [PubMed] [Google Scholar]
- 36. Markadieu N, Blero D, Boom A, Erneux C, Beauwens R. Phosphatidylinositol 3,4,5-trisphosphate: an early mediator of insulin-stimulated sodium transport in A6 cells. Am J Physiol Renal Physiol 287: F319–F328, 2004 [DOI] [PubMed] [Google Scholar]
- 37. Markadieu N, Crutzen R, Blero D, Erneux C, Beauwens R. Hydrogen peroxide and epidermal growth factor activate phosphatidylinositol 3-kinase and increase sodium transport in A6 cell monolayers. Am J Physiol Renal Physiol 288: F1201–F1212, 2005 [DOI] [PubMed] [Google Scholar]
- 38. Markadieu N, Crutzen R, Boom A, Erneux C, Beauwens R. Inhibition of insulin-stimulated hydrogen peroxide production prevents stimulation of sodium transport in A6 cell monolayers. Am J Physiol Renal Physiol 296: F1428–F1438, 2009 [DOI] [PubMed] [Google Scholar]
- 39. Marunaka Y, Hagiwara N, Tohda H. Insulin activates single amiloride-blockable Na channels in a distal nephron cell line (A6). Am J Physiol Renal Fluid Electrolyte Physiol 263: F392–F400, 1992 [DOI] [PubMed] [Google Scholar]
- 40. Mazzochi C, Benos DJ, Smith PR. Interaction of epithelial ion channels with the actin-based cytoskeleton. Am J Physiol Renal Physiol 291: F1113–F1122, 2006 [DOI] [PubMed] [Google Scholar]
- 41. Meng S, Cason GW, Gannon AW, Racusen LC, Manning RD. Oxidative stress in Dahl salt-sensitive hypertension. Hypertension 41: 1346–1352, 2003 [DOI] [PubMed] [Google Scholar]
- 42. Mori T, O'Connor PM, Abe M, Cowley AW., Jr Enhanced superoxide production in renal outer medulla of Dahl salt-sensitive rats reduces nitric oxide tubular-vascular cross-talk. Hypertension 49: 1336–1341, 2007 [DOI] [PubMed] [Google Scholar]
- 43. O'Connor PM, Lu L, Liang M, Cowley AW., Jr A novel amiloride-sensitive H+ transport pathway mediates enhanced superoxide production in thick ascending limb of salt-sensitive rats, not Na+/H+ exchange. Hypertension 54: 248–254, 2009 [DOI] [PMC free article] [PubMed] [Google Scholar]
- 44. O'Connor PM, Lu L, Schreck C, Cowley AW., Jr Enhanced amiloride-sensitive superoxide production in renal medullary thick ascending limb of Dahl salt-sensitive rats. Am J Physiol Renal Physiol 295: F726–F733, 2008 [DOI] [PMC free article] [PubMed] [Google Scholar]
- 45. Ortiz PA, Garvin JL. Superoxide stimulates NaCl absorption by the thick ascending limb. Am J Physiol Renal Physiol 283: F957–F962, 2002 [DOI] [PubMed] [Google Scholar]
- 46. Pavlov TS, Chahdi A, Ilatovskaya DV, Levchenko V, Vandewalle A, Pochynyuk O, Sorokin A, Staruschenko A. Endothelin-1 inhibits the epithelial Na+ channel through betaPix/14–3-3/Nedd4–2. J Am Soc Nephrol 21: 833–843, 2010 [DOI] [PMC free article] [PubMed] [Google Scholar]
- 47. Pavlov TS, Levchenko V, Karpushev AV, Vandewalle A, Staruschenko A. Peroxisome proliferator-activated receptor gamma antagonists decrease Na+ transport via the epithelial Na+ channel. Mol Pharmacol 76: 1333–1340, 2009 [DOI] [PubMed] [Google Scholar]
- 48. Record RD, Froelich LL, Vlahos CJ, Blazer-Yost BL. Phosphatidylinositol 3-kinase activation is required for insulin-stimulated sodium transport in A6 cells. Am J Physiol Endocrinol Metab 274: E611–E617, 1998 [DOI] [PubMed] [Google Scholar]
- 49. Redon J, Oliva MR, Tormos C, Giner V, Chaves J, Iradi A, Saez GT. Antioxidant activities and oxidative stress byproducts in human hypertension. Hypertension 41: 1096–1101, 2003 [DOI] [PubMed] [Google Scholar]
- 50. Rhee SG. Cell signaling. H2O2, a necessary evil for cell signaling. Science 312: 1882–1883, 2006 [DOI] [PubMed] [Google Scholar]
- 51. Rossier BC, Schild L. Epithelial sodium channel: mendelian versus essential hypertension. Hypertension 52: 595–600, 2008 [DOI] [PubMed] [Google Scholar]
- 52. Rovin BH, Wurst E, Kohan DE. Production of reactive oxygen species by tubular epithelial cells in culture. Kidney Int 37: 1509–1514, 1990 [DOI] [PubMed] [Google Scholar]
- 53. Schreck C, O'Connor PM. NAD(P)H oxidase and renal epithelial ion transport. Am J Physiol Regul Integr Comp Physiol 300: R1023–R1029, 2011 [DOI] [PMC free article] [PubMed] [Google Scholar]
- 54. Silva E, Soares-da-Silva PC. Reactive oxygen species and the regulation of renal Na+-K+-ATPase in opossum kidney cells. Am J Physiol Regul Integr Comp Physiol 293: R1764–R1770, 2007 [DOI] [PubMed] [Google Scholar]
- 55. Silva GB, Ortiz PA, Hong NJ, Garvin JL. Superoxide stimulates NaCl absorption in the thick ascending limb via activation of protein kinase C. Hypertension 48: 467–472, 2006 [DOI] [PubMed] [Google Scholar]
- 56. Staruschenko A. Regulation of transport in the connecting tubule and cortical collecting duct. Comp Physiol 2: 1541–1584, 2012 [DOI] [PMC free article] [PubMed] [Google Scholar]
- 57. Staruschenko A, Pochynyuk O, Vandewalle A, Bugaj V, Stockand JD. Acute regulation of the epithelial Na+ channel by phosphatidylinositide 3-OH kinase signaling in native collecting duct principal cells. J Am Soc Nephrol 18: 1652–1661, 2007 [DOI] [PubMed] [Google Scholar]
- 58. Stoos BA, Naray-Fejes-Toth A., Carretero OA, Ito S, Fejes-Toth G. Characterization of a mouse cortical collecting duct cell line. Kidney Int 39: 1168–1175, 1991 [DOI] [PubMed] [Google Scholar]
- 59. Sun P, Yue P, Wang WH. Angiotensin II stimulates epithelial sodium channels (ENaC) in the cortical collecting duct of the rat kidney. Am J Physiol Renal Physiol 302: F679–F687, 2012 [DOI] [PMC free article] [PubMed] [Google Scholar]
- 60. Takemura Y, Goodson P, Bao HF, Jain L, Helms MN. Rac1-mediated NADPH oxidase release of O2− regulates epithelial sodium channel activity in the alveolar epithelium. Am J Physiol Lung Cell Mol Physiol 298: L509–L520, 2010 [DOI] [PMC free article] [PubMed] [Google Scholar]
- 61. Taylor NE, Cowley AW., Jr Effect of renal medullary H2O2 on salt-induced hypertension and renal injury. Am J Physiol Regul Integr Comp Physiol 289: R1573–R1579, 2005 [DOI] [PubMed] [Google Scholar]
- 62. Taylor NE, Glocka P, Liang M, Cowley AW., Jr NADPH oxidase in the renal medulla causes oxidative stress and contributes to salt-sensitive hypertension in Dahl S rats. Hypertension 47: 692–698, 2006 [DOI] [PubMed] [Google Scholar]
- 63. Wei Y, Wang Z, Babilonia E, Sterling H, Sun P, Wang W. Effect of hydrogen peroxide on ROMK channels in the cortical collecting duct. Am J Physiol Renal Physiol 292: F1151–F1156, 2007 [DOI] [PMC free article] [PubMed] [Google Scholar]
- 64. Wind S, Beuerlein K, Eucker T, Muller H, Scheurer P, Armitage ME, Ho H, Schmidt HH, Wingler K. Comparative pharmacology of chemically distinct NADPH oxidase inhibitors. Br J Pharmacol 161: 885–898, 2010 [DOI] [PMC free article] [PubMed] [Google Scholar]
- 65. Yu L, Bao HF, Self JL, Eaton DC, Helms MN. Aldosterone-induced increases in superoxide production counters nitric oxide inhibition of epithelial Na channel activity in A6 distal nephron cells. Am J Physiol Renal Physiol 293: F1666–F1677, 2007 [DOI] [PubMed] [Google Scholar]
- 66. Zheleznova NN, Wilson PD, Staruschenko A. Epidermal growth factor-mediated proliferation and sodium transport in normal and PKD epithelial cells. Biochim Biophys Acta 1812: 1301–1313, 2011 [DOI] [PMC free article] [PubMed] [Google Scholar]