

Abstract
Mitochondrial NADH fluorescence has been a useful tool in evaluating mitochondrial energetics both in vitro and in vivo. Mitochondrial NADH fluorescence is enhanced several fold in the matrix through extended fluorescence lifetimes (EFL). However, the actual binding sites responsible for NADH EFL are unknown. We tested the hypothesis that NADH binding to Complex I is a significant source of mitochondrial NADH fluorescence enhancement. To test this hypothesis, the effect of Complex I binding on NADH fluorescence efficiency was evaluated in purified protein, and in native gels of the entire porcine heart mitochondria proteome. To avoid the oxidation of NADH in these preparations, we conducted the binding experiments under anoxic conditions in a specially designed apparatus. Purified intact Complex I enhanced NADH fluorescence in native gels approximately 10 fold. However, no enhancement was detected in denatured individual Complex I subunit proteins. In the Clear and Ghost native gels of the entire mitochondrial proteome, NADH fluorescence enhancement was localized to regions where NADH oxidation occurred in the presence of oxygen. Inhibitor and mass spectroscopy studies revealed that the fluorescence enhancement was specific to Complex I proteins. No fluorescence enhancement was detected for MDH or other dehydrogenases in this assay system, at physiological mole fractions of the matrix proteins. These data suggest that NADH associated with Complex I significantly contributes to the overall mitochondrial NADH fluorescence signal and provides an explanation for the well established close correlation of mitochondrial NADH fluorescence and the metabolic state.
NADH fluorescence has been an extremely useful tool in the study of mitochondrial energy metabolism for the past several decades, which was pioneered by Chance and colleagues (1–4). NADH fluorescence provides a rapid, non-invasive, high signal to noise measurement of the redox state of the mitochondrial matrix that is suitable for biochemical, imaging and even clinical applications (1;5–15). However, the actual source of the mitochondrial NADH fluorescent signal has not been fully characterized. It has been appreciated from the earliest studies that the mitochondrial NADH fluorescent signal does not originate from free matrix NADH alone but, based on the fluorescence enhancement and emission characteristics (4;16–23), likely involves immobilized pools within the matrix. The remarkable correlation between NADH fluorescence signals and the metabolic transitions of the mitochondria suggests that the NADH pools detected are intimately coupled to the oxidative process or at least engaged in rapid exchange with the active NADH pools (2;4;24;25). The binding of NADH to several dehydrogenases, including alcohol dehydrogenase (26), aldehyde dehydrogenase (27), glutamate dehydrogenase (28), malate dehydrogenase (29), lactate dehydrogenase (30;31), and other enzymes such as citrate synthase (32), has been demonstrated to modestly enhance (~1.5 to 2 fold) NADH fluorescence efficiency in vitro. However, the relative contribution of these and potentially other NADH binding sites to the overall mitochondrial NADH fluorescence signal has not been established.
Recent mitochondrial NADH fluorescence lifetime studies have also confirmed the presence of a significant pool of NADH with a 10 fold EFL that has similar steady state binding kinetics to the net oxidation of NADH by the cytochrome chain (20) in isolated membranes and intact mitochondria. These data support the notion that the enhanced fluorescence pool of NADH is in fast exchange or directly associated with Complex I, where NADH reducing equivalents are transferred to the cytochrome chain. This binding site could be the NADH catalytic site of the complex or the putative dehydrogenases associated with the complex (33). The purpose of this study was to evaluate whether NADH binding to Complex I is associated with an enhancement of NADH fluorescence, and what contribution Complex I NADH binding may make to the overall mitochondrial NADH fluorescence signal.
Materials and Methods
All the chemical compounds were obtained from Sigma Chemical (St. Louis), unless otherwise indicated.
Mitochondria isolation
Porcine heart mitochondria were isolated according to methods described (34). Briefly, harvested heart was perfused with ~400 mL isolation buffer (0.28 M sucrose, 10 mM N-(2-hydroxyethyl) piperazine-N'-2-ethanesulfonic acid (HEPES), and 0.2 mM EDTA, pH 7.1, 4°C). The perfused heart was weighed, and the left ventricle was dissected free of fat, large vessels, and the right ventricular free wall. The heart section (~ 100 g) was minced in isolation buffer. Trypsin (0.5 mg per 1 g of tissue) was then added, and the tissue was incubated on ice for 15 min. The digestion was stopped by discarding the supernatant trypsin solution and adding isolation buffer containing 1 mg/mL bovine serum albumin (BSA) and 2.6 mg/mL of tissue of trypsin inhibitor. The supernatant was again discarded, and the remaining tissue was resuspended in isolation buffer. The tissue was homogenized with a loose-fitting Teflon homogenizer (two times) followed by a tight-fitting Teflon pestle (five times). The homogenate was centrifuged at 600g for 10 min at 4°C, and the supernatant was decanted and centrifuged at 8000g for 15 min. The pellet was resuspended in isolation buffer. The wash-and-centrifugation step was repeated twice more. The final pellet was stored at −80°C for no more than two weeks before performing electrophoreses. All procedures that were performed were in accordance with the guidelines described in the Animal Care and Welfare Act (7 USC 2142 §13).
Complex I isolation
Complex I isolation protocol was based on the procedures developed for bovine heart mitochondria in (35) and (36) . The only deviation from the published procedure was omission of the gel filtration step, which was not found to increase the enzyme purity in pig heart mitochondria homogenates. Mitochondria were isolated from pig heart as described in (34). Complex I specific activity, as measured by NADH:ferricyanide reductase assay (37), progressed from 2.6 units/mg in the starting material to 26 units/mg in the final preparation.
Native gel electrophoresis
To study NADH fluorescence enhancement by binding to mitochondrial proteins along with classically purified Complex I, native electrophoresis was used to maintain mitochondrial protein complexes in their intact form (38). Blue Native PAGE (BN-PAGE) relies on the binding of Coomassie Blue to the protein complex to enhance the proteins' differential migration in the PAGE process. Clear Native PAGE (CN-PAGE) is similar to BN-PAGE but does not use the Coomassie Blue to enhance the differential surface charge of the proteins; this results in a poorer resolution of the complexes when compared to BN-PAGE (39). However, CN-PAGE offers advantages in the present study, as Coomassie-dye interferes with further fluorescence analyses on the gels due to its strong absorbance in a wide optical range (450–700 nm).
BN-PAGE was performed according to an Invitrogen protocol for NativePAGE Novex Bis-Tris Gel System, based on (38). 3–12% and 4–16% 1 mm bis-tris gels were used. BN-PAGE was performed at 4°C for 1 hour at 150V, then for 1.2 hour at 250 V. CN-PAGE employed the same gels as BN-PAGE, but no blue Coomassie was added either to the sample or to the cathode running buffer.
To avoid the intense optical absorption of blue Coomassie interference with NADH fluorescence, a new technique was developed, referred to as Ghost Native PAGE (GN-PAGE) in this study. The chemically reduced form of blue Coomassie dye was found to be essentially colorless, and was used in GN-PAGE to obtain a better dispersion of protein complex as compared to CN-PAGE. Coomassie Brilliant Blue G-250 (Sigma, St. Louis, #B0770) was dissolved in methanol (1g of G-250 in 33 ml of methanol) and held under an argon atmosphere. Sodium cyanoborohydride (75 mg per 1 g of G-250) was added to this solution, and the reaction was stirred for 1.5 h. Then, an additional amount of sodium borohydride (80 mg) was added to the reaction mixture, which was stirred for another hour to reduce most of the residual colored impurities. During this time, the color changed from a thick dark blue solution to a thin light green. TLC indicated a completed reaction. Reduced G-250 was purified by flash chromatography using an Analogix Intelliflash Workstation. The sample was evaporated on silica and dry-loaded on a SuperFlash Sepra Si 50 SF40–80NP column with a flow rate of 85 ml/min: 0% MeOH (100% CH2Cl2) 2 min; to 20% MeOH over 10 min; 20% 10 min; to 33% MeOH over 10 min; to 50% MeOH over next 20 min. The fraction eluting at 25–33 min was collected and combined, and shown to have an RF of 0.29 on Silica Gel-60 TLC plates run in 3:1 dichloromethane:MeOH. After evaporation of solvent and subsequent lyophilization, the product was a light green solid (43% yield) from the original impure starting material. The reduction of G-250 was confirmed by 1H-NMR spectroscopy and mass spectrometry. The assignments of the reduction sites are listed below:
-
Coomassie G-250
H NMR (CD3OD, 360 MHz) δ 7.81–7.73 (m, 3H), 7.44–7.21 (m, 8H), 7.01–6.96 (m, 5H), 6.80–6.75 (m, 4H), 4.86–4.82 (m, 4H), 4.04 (q, 2H, J = 7.0 Hz), 3.74–3.67 (m, 4H), 3.34 (m, 2H), 1.83 (s, 6H), 1.39 (t, 3H, J = 7.0 Hz), 1.30 (t, 6H, J = 6.8 Hz). MS (m/z): 876.0 [M+Na-H].Na+.
-
Reduced Coomassie G-250
H NMR (CD3OD, 360 MHz) δ7.79–7.68 (m, 4H), 7.37–7.30 (m, 4H), 7.02–6.98 (m, 2H), 6.84–6.75 (m, 6H), 6.54–6.42 (m, 6H), 5.36 (s, 1H), 4.50 (s, 4H), 3.97 (q, 2H, J = 7.0 Hz), 3.44 (q, 4H, J = 6.9 Hz), 2.03 (s, 6H), 1.36 (t, 3H, J = 7.0 Hz), 1.16 (t, 6H, J = 7.0 Hz). MS (m/z): 900 [M+2Na-2H].Na+; (m/z) 878 [M+Na-H].Na+.
The original Coomassie dye showed 20 protons in the aromatic region (δ7.81–6.75) in four multiplets whereas the reduced dye integrated for 22 protons in approximately the same field (δ7.79–6.75). Significantly two protons seen in the multiplet δ4.86–4.82 in the original Coomassie dye, and assigned as one of the CH2 benzyl groups of the benzyl sulfonic acid moiety, was not present in the reduced version of the dye. The other CH2 benzyl group of the second benzyl sulfonic acid moiety in the original dye appeared as a multiplet (probably due to long-range coupling) at δ3.34. However, this peak was also absent in the reduced version of the dye. Instead, in the reduced version of the dye a new peak was seen as a singlet at δ4.50 corresponding to the four protons of the CH2 benzyl groups of the benzyl sulfonic acid moieties, which were now rendered equivalent in the reduced version due to the creation of a plane of symmetry around the central triphenylmethane core. Finally, another new peak appeared in the spectrum of the reduced dye, at δ5.36 (s, 1H) corresponding to the proton added at the triphenylmethane carbon atom upon reduction of the `quinimine-like' group present in the original Coomassie dye. Mass spectral analysis of the Coomassie dye showed an [M + Na]+ molecular ion at m/z 876, as expected, while analysis of the reduced dye showed m/z 878 [M + Na]+ and m/z 900 [M + 2Na]+. Removal of the positive half of the zwitterionic pair on the quaternary nitrogen present in the Coomassie dye, by reduction, allowed the formation of a second sodium salt of the sulfonic acid groups, as observed by the [M + 2Na]+ m/z ion. We provide our suggested structures for the Reduced Coomassie and optical absorbance spectra in supplemental Figure 1.
Reduced Coomassie was found to be `shelf-stable' for at least several months when stored at −80°C in a sealed container under a nitrogen atmosphere. The reduced and purified preparation was used in GN-PAGE at concentrations identical to the blue Coomassie concentration used in BN-PAGE.
UV gel imaging
In preliminary studies we found that both purified Complex I and mitochondria homogenates rapidly oxidize NADH to NAD+ in the presence of oxygen (under ambient conditions). NADH oxidation was accompanied by reactive oxygen species (ROS) production as confirmed by Amplex Red (Invitrogen) oxidation (data are not shown). Thus, all the experiments on NADH fluorescence enhancement in the bound state were conducted in the absence of oxygen to maintain NADH levels. An anaerobic environment was created inside a bench top vinyl chamber (Coylab) 78 L ″× 32″ W × 40″ H filled with a nitrogen:hydrogen mix (20:1). Oxygen was eliminated through a catalytic reaction (oxygen content was less then 0.0005%). The samples were inserted into the chamber through an automatic vacuum airlock.
A custom built UV fluorescence imaging setup was used for the direct imaging of NADH fluorescence in gels of both the purified and native forms of Complex I within a vinyl containment system at room temperature. A Crimescope CS-16–500 (SPEX) equipped with a xenon 500W lamp was used to provide a uniform UV illumination using the manufacturers UV filter system (specification 300–400 nm) supplemented with a 350 (±10) nm band-pass filter (Newport, to narrow the excitation bandwidth. For fluorescence detection, a high sensitivity EMCCD camera (iXon, Andor, South Windsor, CT) was used with an L37c Nikkor UV cut-off filter (50% transmission at 380 nm) for fluorescence detection.
To assay NADH fluorescence enhancement, gels were incubated in a buffer (137mM KCl, 10mM HEPES, 2.5mM MgCl2, 0.5mM K2EDTA, pH 7.1) with 50–100μM NADH. Incubation times varied from 5 min to 15 hours; in both anaerobic conditions and air at RT. The gels were directly placed on a black lexan plate. Images were collected at near maximum gain (255), with exposure times of 0.05 s to 0.3 s. The low signal to noise of these images reflects the limited amount of protein present, as well as the UV excitation only penetrating the outer layer of the protein and NADH laden gel. Protein content was limited by the native gel system to reasonably resolve proteins.
To estimate the degree of fluorescent enhancement per mole of Complex 1, we needed to estimate the concentration of Complex 1 in a given band. For most of our loading conditions we used 200 μg of mitochondria protein per lane (note that 100 μg was used for some studies to conserve material see Figure legends). We previously determined that the concentration of cytochrome oxidase (Complex IV) in porcine heart mitochondria was 1 nM/mg protein (40). Using the ratio of Complex I to Complex IV of 6 (41), consistent with our 2D gel analysis, we estimate approximately 0.17 nM Complex 1/mg mitochondria protein. Within a 200 μg mitochondria protein/lane we are adding ~0.03 nM Complex 1. The Complex 1 band in the gel was 5mm × 2mm × 1mm or 10 μL corresponding to a Complex 1 concentration of ~3 μM under ideal conditions. We used 50–100 μM NADH to assure saturation of the NADH binding sites (20) and minimize the free NADH background signal in the ge1; thus, the ratio of NADH to Complex I was roughly 10–30:1.
Region of interest (ROI) amplitude measurements were conducted for fluorescence bands using open source software (J-Image). Identical ROI masks were placed over the fluorescence protein band and the nearest gel region to estimate fluorescence enhancement in the gel.
Mass spectrometric protein identification
Native gel protein complex bands were excised and washed, reduced with TCEP (5 mM) and alkylated with IAA (25 mM). In-gel trypsin digestion (300 ng) was allowed at 37°C for 18 h. Tryptic peptides were extracted three times with 5% formic acid followed by 50% ACN at 37°C. LC-MS/MS analysis was performed using a Micromass Q-TOF Ultima Global (Micromass, Manchester, UK) equipped with a PST SureSpray (75 μm i.d. packed C18 tip) system (Elkton, MD). Data were processed using the MassLynx software package (version 4.1) to generate peak list files, prior to an in-house licensed Mascot search at http://biospec.nih.gov (MatrixScience Ltd., London, UK) through which we could compare our data against the NCBInr database using mammalian as taxonomy.
Results
Coomassie interferes with NADH oxidation in Complex I
BN-PAGE is based on Coomassie Blue binding to protein complexes that enhances surface charge differences to effectively isolate functionally intact mitochondrial complexes using electrophoresis (38). However, Coomassie Blue is known to bind at the dinucleotide binding site in enzymes (42) and could interfere with NADH binding as well as the enzyme activity of dehydrogenases. Similar effects have been observed for other enzyme activities in BN-PAGE gels(43). To test for this interference, the effects of both Blue and reduced Coomassie dye were tested on the NADH ferricyanide oxidoreductase assay used in following the purification process. Both Coomassie dye and reduced Coomassie decreased NADH oxidation in mitochondria homogenates in an identical dose dependent manner. The rate of NADH oxidation decreased from control, 2.4± 0.2 units/mg, to 1.4 ± 0.3 units/mg and 0.8± 0.3 units/mg with 0.01 and 0.025%, respectively, of either dye (n=4). These data suggest that these Coomassie dyes are not inert to the NADH oxidation reaction, and could interfere with the binding assays. Thus, the early focus of these studies for the intact complex was CN-PAGE, which provides gel separation without Coomassie dyes.
NADH fluorescence enhancement occurs in CN-PAGE bands associated with Complex I
Coomassie stained CN-PAGE gel is shown in Fig. 1A. The mass spectrometric protein identifications of CN-PAGE gel bands C1–C5 are given in Table 1. After electrophoresis, the gel was immersed in 100 μM NADH solution and incubated at ambient conditions (25 C° and room air) for 5 min, and then imaged in the dark room (Fig. 1B). This “in-gel” assay permitted the monitoring of NADH oxidation as well as NADH fluorescence enhancement (see below) in the same gel system. The dark regions on the bright NADH fluorescent background correspond to the locations where NADH was oxidized to the non-fluorescent NAD+ form faster than diffusion could “refill” the areas with NADH from adjacent regions. NADH oxidation occurs in both Complex I protein regions in C1 and C2 bands, but 50 μM DPI, a specific inhibitor of Complex I activity (44), blocked NADH oxidation in the C2 band (Fig. 1C). These data imply that most of the NADH oxidation in the C1 band is caused by DPI insensitive contaminating dehydrogenases such as dihydrolipoyl dehydrogenase, malate dehydrogenase, methylmalonate-semialdehyde dehydrogenase, isocitrate dehydrogenase and peroxisomal alcohol dehydrogenase, which were found in the C1 band using mass spectroscopy. The concentration of these dehydrogenases was apparently much lower in C2, where NADH oxidation was completely inhibited by DPI. We also found that the FMN fluorescence (determined with a 445 nm excitation and 520 nm emission) specifically increased in the regions where NADH emissions decreased, supporting the notion that these bands represent Complex I (see Fig. 2).
Figure 1.

NADH oxidation and fluorescence enhancement occur in Clear Native PAGE bands associated with Complex I. 200 μg of mitochondrial preparation was loaded in each lane of the 3–12% native gel. A) Coomassie stained gel; B, C, D, and E are UV fluorescence images: B) after 5 min incubation in 100 μM NADH solution in the presence of oxygen; C) same as B, but 50μM DPI was added into the incubation media; D) after 4 h incubation in 100 μM NADH solution in an anaerobic environment; E) same as D, but 50μM DPI was added into the incubation media. F and G are NBT-stained gels, with (F) and without (G) the addition of DPI in to the media. Mass spectrometric protein identifications for CN-PAGE bands C1-C5 are provided in Table 1.
Table 1.
Mass spectrometric protein identification in GN-PAGE and CN-PAGE. Specific Mass spectroscopy data is provided in Supplemental Table 1.
| CN-PAGE | GN-PAGE | ||||||||
|---|---|---|---|---|---|---|---|---|---|
| C | C | C | C | C | G | G | G | G | |
| 1 | 2 | 3 | 4 | 5 | 1 | 2 | 3 | 4 | |
| COMPLEX I | |||||||||
|
| |||||||||
| NADH dehydrogenase (ubiquinone) Fe-S protein 1, 75kDa | • | • | • | • | |||||
| NADH dehydrogenase (ubiquinone) Fe-S protein 2, 49 kDa | • | • | • | • | |||||
| NADH dehydrogenase (ubiquinone) Fe-S protein 3, 30kDa | • | • | • | • | |||||
| NADH dehydrogenase (ubiquinone) Fe-S protein 4, 18kDa | • | • | • | ||||||
| NADH dehydrogenase (ubiquinone) Fe-S protein 5, 15kDa | • | ||||||||
| NADH dehydrogenase (ubiquinone) Fe-S protein 7, 20kDa | • | • | |||||||
| NADH dehydrogenase (ubiquinone) Fe-S protein 8, 23 kDa | • | • | • | • | |||||
| NADH dehydrogenase (ubiquinone) flavoprotein 1, 51kDa | • | • | • | • | |||||
| NADH dehydrogenase (ubiquinone) flavoprotein 2, 24kDa | • | • | • | ||||||
| NADH dehydrogenase (ubiquinone) 1 alpha subcomplex, 2, 8kDa | • | ||||||||
| NADH dehydrogenase (ubiquinone) 1 alpha subcomplex, 4, 9kDa | • | ||||||||
| NADH dehydrogenase (ubiquinone) 1 alpha subcomplex, 5, 13kDa | • | ||||||||
| NADH dehydrogenase (ubiquinone) 1 alpha subcomplex, 6, 14kDa | • | • | |||||||
| NADH dehydrogenase (ubiquinone) 1 alpha subcomplex, 8, 19kDa | • | • | |||||||
| NADH dehydrogenase (ubiquinone) 1 alpha subcomplex, 9, 39 kDa | • | • | |||||||
| NADH dehydrogenase (ubiquinone) 1 alpha subcomplex, 10, 42kDa | • | • | • | • | |||||
| NADH dehydrogenase (ubiquinone) 1 alpha subcomplex, 11, 14.7kDa | • | • | • | • | |||||
| NADH dehydrogenase (ubiquinone) 1 beta subcomplex, 3, 12kDa | • | • | |||||||
| NADH dehydrogenase (ubiquinone) 1 beta subcomplex, 4, 15kDa | • | • | • | ||||||
| NADH dehydrogenase (ubiquinone) 1 beta subcomplex, 6, 17kDa | • | • | |||||||
| NADH dehydrogenase (ubiquinone) 1 beta subcomplex, 7, 18kDa | • | ||||||||
| NADH dehydrogenase (ubiquinone) 1 beta subcomplex, 8, 19kDa | • | • | • | • | |||||
| NADH dehydrogenase (ubiquinone) 1 beta subcomplex, 9, 22kDa | • | • | • | ||||||
| NADH dehydrogenase (ubiquinone) 1 beta subcomplex, 10, 22kDa | • | • | • | ||||||
| NADH dehydrogenase (ubiquinone) 1 alpha/beta subcomplex, 1, 8kDa | • | ||||||||
| NADH dehydrogenase (ubiquinone) subunit 1 | • | • | |||||||
| NADH dehydrogenase (ubiquinone) subunit 5 | • | • | |||||||
| NADH dehydrogenase (ubiquinone) B16.6 subunit | • | • | • | ||||||
|
| |||||||||
| COMPLEX II | |||||||||
|
| |||||||||
| succinate dehydrogenase complex, subunit A | • | • | • | ||||||
| succinate dehydrogenase complex, subunit B | • | • | • | ||||||
| succinate dehydrogenase complex, subunit C | • | ||||||||
| succinate dehydrogenase complex, subunit D | • | • | |||||||
|
| |||||||||
| COMPLEX III | |||||||||
|
| |||||||||
| ubiquinol-cytochrome c reductase binding protein | • | • | • | • | |||||
| ubiquinol-cytochrome c reductase core protein I | • | • | • | • | • | ||||
| ubiquinol-cytochrome c reductase core protein II | • | • | • | • | • | ||||
| ubiquinol-cytochrome c reductase, Rieske iron-sulfur protein | • | • | • | • | |||||
| ubiquinol-cytochrome c reductase complex 7.2kDa protein | • | ||||||||
| ubiquinol-cytochrome c reductase complex hinge protein, 11 kDa | • | • | |||||||
| Chain A, cytochrome Bc1 complex | • | • | |||||||
| Chain B, cytochrome Bc1 complex | • | ||||||||
| Chain D, cytochrome Bc1 complex | • | • | • | ||||||
| Chain G, cytochrome Bc1 Complex | • | • | • | ||||||
| Chain H, Cytochrome Bc1 Complex | • | • | |||||||
|
| |||||||||
| COMPLEX IV | |||||||||
|
| |||||||||
| cytochrome c oxidase subunit I | • | • | • | ||||||
| cytochrome c oxidase subunit II | • | • | • | • | • | • | • | ||
| cytochrome c oxidase subunit IV | • | • | • | • | • | • | • | ||
| cytochrome c oxidase subunit Va | • | • | • | • | • | ||||
| cytochrome c oxidase subunit Vb | • | • | • | ||||||
| cytochrome c oxidase subunit VIa | • | ||||||||
| cytochrome c oxidase subunit VIc | • | • | • | ||||||
| cytochrome c oxidase polypeptide VIIa | • | • | • | ||||||
| cytochrome c oxidase Chain D | • | • | • | ||||||
| cytochrome c oxidase Chain J | • | • | |||||||
|
| |||||||||
| COMPLEX V | |||||||||
|
| |||||||||
| ATP synthase F0 complex, subunit e | • | • | |||||||
| ATP synthase F0 complex, subunit g | • | • | • | ||||||
| ATP synthase F0 complex, subunit b | • | • | • | ||||||
| ATP synthase F0 complex, subunit d | • | ||||||||
| ATP synthase F1 complex, alpha subunit | • | • | • | • | • | • | • | • | • |
| ATP synthase F1 complex, beta subunit | • | • | • | • | • | • | • | ||
| ATP synthase F1 complex, delta subunit | • | • | |||||||
| ATP synthase F1 complex, gamma subunit | • | • | • | • | • | ||||
| ATP synthase F1 complex, O subunit | • | ||||||||
|
| |||||||||
| OTHER DEHYDROGENASES | |||||||||
|
| |||||||||
| alcohol dehydrogenase | • | • | |||||||
| aldehyde dehydrogenase | • | • | |||||||
| dihydrolipoyl dehydrogenase, mitochondrial precursor (dihydrolipoamide dehydrogenase) | • | • | • | • | • | ||||
| glutamate dehydrogenase | • | • | |||||||
| hydroxyacyl dehydrogenase | • | • | • | ||||||
| isocitrate dehydrogenase | • | • | • | • | |||||
| isovaleryl coenzyme A dehydrogenase | • | • | |||||||
| malate dehydrogenase | • | • | • | • | |||||
| methylmalonate-semialdehyde dehydrogenase | • | • | |||||||
| oxoglutarate dehydrogenase | • | • | • | ||||||
| peroxisomal short-chain alcohol dehydrogenase | • | • | |||||||
| pyruvate dehydrogenase | • | • | • | ||||||
|
| |||||||||
| OTHER PROTEINS | |||||||||
|
| |||||||||
| gastrin-binding protein, 78 kDa | • | • | • | • | |||||
| acyl coA synthetase | • | • | • | ||||||
| ADP/ADT translocator protein | • | • | • | ||||||
| apoptosis inducing factor | • | • | • | • | |||||
| carnitine acetyltransferase | • | ||||||||
| carnitine palmitoyltransferase | • | • | • | • | • | ||||
| chymodenin | • | • | • | ||||||
| citrate synthase | • | • | • | ||||||
| creatine kinase | • | • | • | ||||||
| dihydrolipoamide S-succinyltransferase | • | ||||||||
| fumarase | • | • | • | ||||||
| heat shock protein | • | • | |||||||
| IgM B-cell receptor associated protein (BAP) 37 | • | ||||||||
| long-chain 3-ketoacyl-CoA thiolase | • | • | • | • | • | • | |||
| microsomal glutathione S-transferase 3 | • | • | |||||||
| mitochondrial aconitase 2 | • | ||||||||
| mitochondrial trifunctional protein | • | • | • | • | • | • | |||
| mitofilin | • | ||||||||
| NAD(P) transhydrogenase | • | • | • | ||||||
| nitrilase | • | • | |||||||
| peroxiredoxin | • | ||||||||
| peroxisomal enoyl coenzyme A hydratase | • | • | • | ||||||
| prohibitin | • | • | |||||||
| propionyl coenzyme A carboxylase | • | ||||||||
| Ras-binding protein SUR-8 | • | ||||||||
| solute carrier family 25 | • | • | • | • | • | • | |||
| stress-70 protein, 75 kDa | • | • | • | ||||||
| ubiquitin specific proteinase 40 | • | • | |||||||
| voltage-dependent anion channel 2 (VDAC 2) | • | • | • | • | • | • | • | ||
| voltage-dependent anion-selective channel protein 1 (VDAC 1) | • | ||||||||
| zinc finger | • | • | • | ||||||
| aconitase | • | ||||||||
| aspartate aminotransferase | • | ||||||||
Figure 2.

NADH/FMN fluorescence image consistent with Complex I oxidation of NADH. 200 μg of mitochondrial preparation was loaded in each lane of the 4–16% native gel. 100 mM NADH incubation for 10 minutes. A) Coomassie stained gel. B) 350 nm excitation (NADH fluorescence). C) 445 nm excitation (FMN fluorescence).
NADH fluorescence enhancement was determined by incubating the gels in NADH in the absence of oxygen, to prevent oxidation. Time courses revealed that NADH equilibrated throughout the gel in less than 4 hours. Any fluorescence enhancement due to protein binding should be reflected by a regional increase NADH fluorescence over background. NADH fluorescence enhancement was only detected in the C2 band (see Fig. 1D and 1E). DPI did not alter the NADH fluorescence enhancement, which is consistent with the notion that DPI blocks NADH oxidation via the iron centers in Complex I rather than the binding of NADH. In addition, another assay for NADH oxidation activity, NBT staining (45), showed that NADH was completely inhibited by DPI (see Fig. 1F, 1G).
Using ROI analysis, the NADH fluorescence intensity was 22% (± 4%: n=3 for 200ug protein loads) higher in the C2 band as compare to the rest of the gel (Fig. 1D, 1E). Assuming that one NADH binds to each Complex I, this intensity corresponds to a ~10 fold NADH fluorescence enhancement in the presence of Complex I. This result is consistent with the intact mitochondria NADH lifetime measurements in this preparation, where ~15% of the matrix NADH had a 10 fold EFL from 0.4 (free NADH) ns to 5.7 ns(20).
Ghost Native PAGE results consistent with NADH fluorescence enhancement by mitochondrial Complex I
GN-PAGE employing a colorless reduced form of Coomassie dye as a charge-shifting agent gives a substantially better resolution as compared to CN-PAGE without the intense blue color of Coomassie, which interferes with the NADH fluorescence measurement. NADH fluorescence enhancement was determined in the hypoxia chamber as described above. Similar to CN-PAGE gels, our results demonstrated NADH fluorescence enhancement in two bands, G1 and G2, even though the protein content for those bands was different from CN-PAGE. Fig. 3A, along with Table 1, provides the Ghost Native band locations and assignments made by mass spectrometric analysis.
Figure 3.

NADH fluorescence enhancement in Ghost Native PAGE. 100 μg of each purified Complex I (lane 1) and mitochondrial preparation (lanes 2, 3) were loaded onto the 3–12% native gel. A) Coomassie stained gel. B) UV fluorescence image of the GN-PAGE gel incubated overnight in 100 μM NADH solution in anaerobic chamber; C) same as B, but 50μM DPI was added into incubation media; D and E are NBT-stained gels, with (E) and without (D) addition of DPI into the media. Mass spectrum protein identifications for GN-PAGE bands G1–G4 can be found in Table 1.
Both G1 and G2 bands (and only those) contain Complex I proteins. More than 20 out of 46 total subunits of Complex I were identified in each of those bands by mass spectroscopy. The G1 band is a super complex containing other proteins along with Complex I, including cytochrome bc1 complex, cytochrome c oxidase, and ATP synthase F1 complex. Band G2 is a cleaner version of Complex I, with a little contamination from complex V and no proteins from complexes II, III or IV. It is important to note that in the GN-PAGE bands G1 and G2, no other dehydrogenases were found, in contrast to CN-PAGE. Again, with this separation scheme the NADH fluorescence enhancement observed in G1 and G2 bands (see Fig. 3B, 3C, lanes 2 and 3) was correlated with specific Complex I activity NBT staining (Fig. 3D, lanes 2 and 3), and stayed unchanged in the presence of DPI in the incubation media. Direct detection of NADH oxidation in GN-PAGE gels was not observed, most likely due to the direct inhibition of Complex I NADH oxidation by the reduced Coomassie dye, as discussed above. NBT staining is much more sensitive than the relatively insensitive direct detection of NADH oxidation, and was successful in observing the Complex I oxidation of NADH.
Isolated Complex I enhances NADH fluorescence
Complex I, purified from porcine heart mitochondria, is a multi-subunit membrane-bound assembly. The Complex I preparation contains all of the subunits identified in other preparations of the enzyme, and has NADH:ferricyanide oxidoreductase activity. When loaded on CN-PAGE gels, purified Complex I did not enter the gel, probably due to a different microenvironment and associated proteins that contribute to the inherent surface charge of the proteins critical for CN-PAGE separation. However, in GN-PAGE, it migrated similarly to the G2 band from the total mitochondrial preparation, which was essentially identical to purified Complex I except for some complex V contamination. This purified form of Complex I in GN-PAGE gels enhanced NADH fluorescence under anoxic conditions (see Fig. 3, lane 1). These data are consistent with the notion that the Complex I binding of NADH enhances NADH fluorescence.
Isolated Complex I subunits denatured and separated in SDS-PAGE do not demonstrate NADH fluorescence enhancement
To determine whether any single subunit of purified Complex I can demonstrate the same NADH fluorescence enhancing behavior, we denatured Complex I and loaded it onto a conventional SDS-PAGE gel. After electrophoresis, these gels were treated with NADH and imaged using the same methodology as for the native gels. We did not see NADH fluorescence enhancement in any resolved subunit, most likely because the proteins lost their NADH binding capacity after strong SDS denaturing. Fig. 4 shows a Coomassie stained image and a UV image of the gel.
Figure 4.
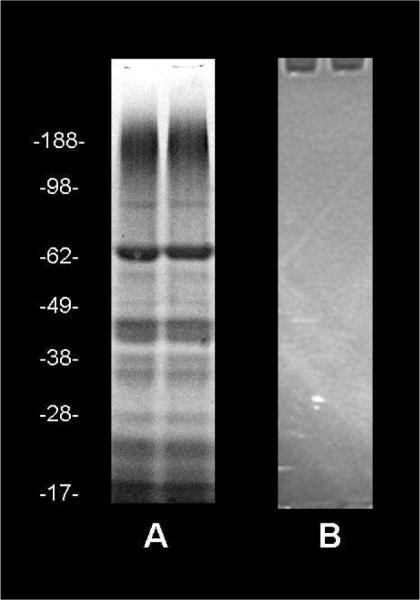
No NADH fluorescence enhancement in denatured isolated subunits of Complex I. 40 μg of purified Complex I per well of SDS-gel was loaded. A) Coomassie stained gel. B) UV image of the SDS-gel incubated overnight in 100 μM NADH solution in an anaerobic chamber.
Discussion
These studies reveal that when the entire porcine heart mitochondria proteome was screened in GN-PAGE and CN-PAGE native gel electrophoreses, Complex I was the only protein complex that significantly increased NADH fluorescence efficiency. Complex I was identified in the gel by mass spectroscopy as well as DPI sensitive NADH oxidation and NBT staining. To confirm that the enhancement of fluorescence was due to Complex I, isolated Complex I run on GN-PAGE gels also revealed NADH fluorescence enhancement. Isolated, denatured subunits of Complex I did not demonstrate any NADH fluorescence enhancement. These data suggest that, taking into account the relative mole fraction and NADH fluorescence enhancement of all the mitochondrial proteins, Complex I is the single most important site for mitochondrial matrix NADH fluorescence enhancement.
Previous studies have shown that NADH fluorescence amplitude is highly correlated with the energy status of the cytochrome chain, as well as reflecting the driving force available for oxidative phosphorylation (1;4;46). We demonstrated (20) a close correlation between the long NADH lifetime pool (4 to 6 ns) content and the cytochrome chain dependent oxidation of NADH in isolated mitochondria and membranes, consistent with the notion that this EFL pool reflects Complex I interactions. The purpose of this study was to screen the mitochondria proteome to search for proteins that could be responsible for the enhancement of NADH fluorescence. Utilizing native gel electrophoresis techniques to minimize denaturing and maintain some protein-protein associations, the only band that enhanced NADH fluorescence was associated with Complex I. This was confirmed by correlating fluorescence enhancement with DPI sensitive NADH oxidation and NBT staining, and demonstrating that purified Complex I also enhanced NADH fluorescence.
Since isolated subunits of Complex I did not enhance NADH fluorescence, the subunit or subunits responsible for NADH fluorescence enhancement remain unknown. The binding site is most likely the catalytic NADH binding site associated with oxidation, since the steady state kinetics of binding and oxidation have been correlated (20). The best candidate for the Complex I NADH binding site is the 51 kDa subunit, which also contains a flavin binding site (47;48). The cDNA-derived amino acid sequence of the 51kDa subunit revealed a cluster of glycine residues, consistent with the identification of a highly conserved sequence common to the NADH-binding domains of many enzymes (49). Finally, mutations in the 51 kDa subunit of Complex I resulted in the lack of NADH-ferricyanide and NADH-Q2 oxidoreductase activities, consistent with the NADH binding role of this sub-unit (50) and, therefore, consistent with the proposition that this sub-unit provides the NADH binding site.
The structure of the hydrophilic region of Complex I from Thermus thermophilus has been published (51;51;51;52). This structure suggests that the NADH binding site groove in the hydrophilic region could easily be dependent on other subunit interactions with the 51kDa subunit (Nqo1: Thermus nomenclature), specifically Nqo2 and Nqo15. The interdependence of these subunits may partially explain the lack of NADH binding, or NADH enhancement, in dissociated subunits. Interestingly, the NADH binding site identified in these studies is located only 10 angstroms from the covalently bound FMN, well within the Forster radius of non-radiation energy transfer from covalently bound FMN. These data imply that, in this location, the bound NADH molecule would directly transfer much of its energy after absorption to the FMN-accepter, which should effectively quench the NADH fluorescence emission. Thus, either the structure in Thermus thermophilus does not accurately reflect the relationship between FMN and the NADH binding site in the mammalian Complex I, or other NADH binding site may be present. Photo-affinity labeling has revealed multiple binding sites in bovine Complex 1 in the 51,42 and 30K subunits(53).
It is also possible that other NADH fluorescence enhancing dehydrogenases are associated with Complex I, such as MDH (54). However, we found no evidence of associated dehydrogenases in our mass spectroscopy analyses of the Complex I GN-PAGE gel bands, while purified Complex I alone enhanced NADH fluorescence. Thus, it is unlikely that another dehydrogenase is contributing to the Complex I NADH emission observed in this study.
Many other studies have demonstrated that dehydrogenases in the matrix, such as MDH, enhance NADH fluorescence when binding occurs. If this is the case, however, why were these NADH binding events not observed in this study? For example, the mass spectroscopy screens of the GN-PAGE gels reveals that MDH was selectively present in the G3 and G4 bands, and distinctly resolved from Complex I in G1 and G2; however, no fluorescence enhancement was detected in the G3–G4 bands. There are several possible explanations for not observing NADH fluorescence enhancement from MDH, or other dehydrogenases. The most obvious explanation is that the relative molar concentration of Complex I is much higher than that of MDH and the other dehydrogenases. To test this hypothesis, we conducted total protein 2D-PAGE analysis of porcine heart mitochondria using the previously published methods (55) to estimate the relative concentrations of Complex I with some of these known NADH binding proteins. By integrating the areas of the protein spots using commercial software (Progenesis PG240, NonLinear Dynamics), the ratio of MDH and isocitrate dehydrogenase to the hydrophilic 51 kD Complex I subunit was 3.9 and 4.2 respectively. Similar ratios were obtained using the other hydrophilic subunits of Complex I. Clearly, the concentration of Complex I is much lower than those of these two dehydrogenases that are known to enhance NADH fluorescence; thus, relative protein concentration alone can not explain Complex I dominance in enhancing NADH fluorescence. To confirm this observation, we loaded overloaded purified MDH (CalBioChem, Sun Diego) 3 fold, on a molar basis, over purified Complex I under our experimental conditions (see Fig. 5) and observed no increase in NADH fluorescence in the MDH band.
Figure 5.
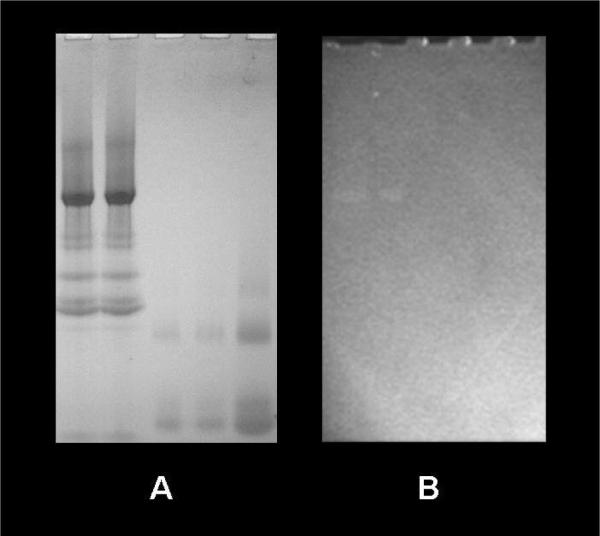
NADH fluorescence enhanced more efficiently by Complex I than by MDH binding First two lanes of 3–12% native gel were loaded with 47 μg (~50 pmol) of purified Complex I and the last three lanes were loaded with 8, 8, and 12 μg of MDH (~ 115, 115, and 170 pmol). Gel was incubated in 100 μM NADH overnight. A) Coomassie stained gel. B) UV fluorescence image.
These later results suggest that Complex I is lower in concentration than most dehydrogenases, but much more efficient in enhancing NADH fluorescence than the other matrix dehydrogenases. Indeed, the shift of the NADH fluorescence emission and enhancement in lifetime within intact and mitochondrial membranes far exceeds the lifetime extension and spectral shifts reported for any other dehydrogenase systems. Isolated dehydrogenases usually only increase the NADH lifetime by 1.5 to 2 fold (56). In contrast, we estimated the fluorescence enhancement of Complex I to be 10 fold consistent with direct measurements in intact porcine mitochondria (20). It is not surprising that Complex I can significantly enhance NADH, due to its large size and tight binding of NADH, which would effectively immobilize and shield NADH for the required redox reactions occurring within the site. Thus, we conclude that Complex I dominated over any other single protein complex in the matrix in terms of fluorescence enhancement of the gels, due to an extremely effective fluorescence lifetime enhancement mechanism. We were not able to directly measure the lifetime of the NADH associated with Complex I to confirm our intensity measurements, because of the difficulties in performing these experiments in the complete absence of oxygen with our current experimental apparatus and limitations in signal to noise.
These data can be directly compared to previous matrix NADH fluorescence lifetime measurements. In these previous studies, three pools of NADH were resolved: 1) a free NADH pool with a lifetime of 0.4 ns (63 % of matrix NADH); 2) an intermediate lifetime pool at 1.8ns (30% of matrix NADH); 3) a long lifetime pool at 5.7 ns (7% of matrix NADH) matrix pool (20). Assuming the ratio of Complex 1 to Complex 4 of 1:6 (41) together with the concentration of 50% fully reduced matrix [NADH] (3.4 nM/nM cyto a) in porcine heart mitochondria (57), we determined the ratio of NADH/Complex I to be 20:1 under resting conditions. Using these assumptions, 5% of the NADH could be associated with Complex I, in reasonable agreement with the 7% pool size for the 5.7 ns lifetime pool that was observed in intact mitochondria (20).
It is important to note that the 20:1 ratio of NADH to Complex I clearly demonstrates that, even with the longest fluorescence lifetimes of ~6 ns in intact mitochondria, a single or even multiple binding sites of NADH on Complex I would not completely dominate the overall mitochondrial matrix NADH fluorescence signal. Based on these comparisons, we propose that the 5.7 ns lifetime pool observed in intact mitochondria, which correlates with NADH oxidation, is NADH associated with Complex I. We suggest that the intermediate, 1.8 ns, lifetime pool represents the numerous dehydrogenase and other binding sites within the matrix, which reflect similar fluorescence lifetime enhancements in vitro. If these assignments are correct, then approximately 33% of the overall fluorescence signal from the mitochondrial matrix originates from Complex I.
Several limitations of the dissociation and chromatography methods need to be mentioned. The solubilization and native gel preparations of enzyme complexes used in this study could have disrupted the association of dehydrogenases with Complex I, or other macromolecular structures. These dehydrogenases, in a freely dissociated state, may not enhance NADH fluorescence as well as in a true native associated state and, as a result, could be missed in the gel fluorescence assay. Without a direct measure of NADH fluorescence efficiency on these dehydrogenases in the intact mitochondrion, or under even less disruptive conditions, this will remain an un-testable hypothesis. Another issue is that the gel assay favors the detection of one dominant band, so that a diffuse group of proteins binding NADH could be overlooked in the gel. This is especially true in our analysis, where we were operating close to the signal to noise limit of this approach. Due to the lack of complete homogeneity of the excitation source, it was difficult to integrate the entire protein lane versus background, which might have provided some insight into the presence or absence of a diffuse enhancement. Thus, it is likely that numerous NADH binding sites occurring in several proteins distributed through the gel are, in combination, contributing significantly to the NADH fluorescence signal. Finally, we did not directly measure the fluorescence lifetime within the gels due to technical issues and the low signal to noise. Thus, we were limited to simply observing the fluorescence enhancement relative to the free NADH in the background. It is possible that the effective concentration of NADH could have been enhanced in the Complex 1 band by extensive binding resulting in a decreasing the effective activity coefficient of NADH, resulting in more NADH diffusing into this volume. This binding would also have to be rather specific since no other protein band revealed this behavior. A 20% fluorescence enhancement of a 100 μM NADH solution by a μM concentrate of Complex 1 would require on the order of 10 binding sites per mole of Complex 1. This is far in excess of the maximum of three sites detected by photo-affinity labeling (53), thus we suggest that this binding mechanism of concentrating NADH is unlikely.
In summary, we demonstrated that Complex I enhances NADH fluorescence ~10 fold in native gels of total mitochondria proteins as well as in purified Complex I preparations. No other single protein complex band revealed significant NADH fluorescence enhancement in the mitochondrial proteins, implying an important role of Complex I in the overall NADH fluorescence signal from the mitochondria matrix. Quantitative analysis suggests that the Complex I interaction with NADH is consistent with the 5.7 ns fluorescence lifetime pool, which is correlated with NADH oxidation rates in the intact porcine heart mitochondria. These data suggest that at least 33% of the matrix NADH fluorescence signal originates from Complex I.
Supplementary Material
Abbreviations
- NAD+
nicotinamide adenine dinucleotide, oxidized form
- NADH
nicotinamide adenine dinucleotide, reduced form
- DPI
diphenylene iodonium
- NBT
nitroblue tetrazolium
- BN-PAGE
blue native polyacrylamide gel electrophoresis
- CN-PAGE
clear native PAGE
- GN-PAGE
ghost native PAGE
- HEPES
N-(2-hydroxyethyl) piperazine-N'-2-ethanesulfonic acid
- EDTA
ethylene diamine tetraacetic acid
Footnotes
Supporting Information Available A supplemental Table (Supplemental Table 1) is provided that reveals the protein ion score, the number of peptides detected and overall protein sequence coverage for each of the proteins identified in the native gel electrophoresis studies. A supplemental Figure (Supplemental Figure 1) is provided that gives the structure of the native and reduced coomassie dye used in GN-PAGE. The absorbance spectrum of the native and reduced coomassie dye is also provided to demonstrate the lack of absorption in the visible light by the reduced coomassie formulation. This material is available free of charge via the Internet at http:// pubs.acs.org
References
- 1.Chance B, Williamson JR, Famieson D, Schoener B. Properties and kinetics of reduced pyridine nucleotide fluorescence of the isolated and in vivo rat heart. Biochemische Zeitschrift. 1965;341:357–377. [Google Scholar]
- 2.Chance B, Baltscheffsky M. Spectroscopic effects of adenosine diphosphate upon the respiratory pigments of rat-heart-muscle sarcosomes. Biochem. J. 1958;68:283–295. doi: 10.1042/bj0680283. [DOI] [PMC free article] [PubMed] [Google Scholar]
- 3.Chance B, Cohen P, Jobsis F, Schoener B. Intracellular Oxidation-Reduction states in vivo. Science. 1962;137:499–508. doi: 10.1126/science.137.3529.499. [DOI] [PubMed] [Google Scholar]
- 4.Chance B, THORELL B. Fluorescence measurements of mitochondrial pyridine nucleotide in aerobiosis and anaerobiosis. Nature. 1959;184:931–934. doi: 10.1038/184931a0. [DOI] [PubMed] [Google Scholar]
- 5.Eng J, Lynch RM, Balaban RS. NADH fluorescence spectroscopy and imaging of isolated cardiac myocytes. Biophys. J. 1989;55:621–630. doi: 10.1016/S0006-3495(89)82859-0. [DOI] [PMC free article] [PubMed] [Google Scholar]
- 6.Williams RM, Piston DW, Webb WW. Two-photon molecular excitation provides intrinsic 3-dimensional resolution for laser-based microscopy and microphotochemistry. FASEB J. 1994;8:804–813. doi: 10.1096/fasebj.8.11.8070629. [DOI] [PubMed] [Google Scholar]
- 7.Ranji M, Kanemoto S, Matsubara M, Grosso MA, Gorman JH, III, Gorman RC, Jaggard DL, Chance B. Fluorescence spectroscopy and imaging of myocardial apoptosis. J. Biomed. Opt. 2006;11:064036. doi: 10.1117/1.2400701. [DOI] [PubMed] [Google Scholar]
- 8.Mayevsky A, Rogatsky GG. Mitochondrial function in vivo evaluated by NADH fluorescence: from animal models to human studies. Am. J. Physiol Cell Physiol. 2007;292:C615–C640. doi: 10.1152/ajpcell.00249.2006. [DOI] [PubMed] [Google Scholar]
- 9.Kierdaszuk B, Malak H, Gryczynski I, Callis P, Lakowicz JR. Fluorescence of reduced nicotinamides using one- and two-photon excitation. Biophys. Chem. 1996;62:1–13. doi: 10.1016/s0301-4622(96)02182-5. [DOI] [PubMed] [Google Scholar]
- 10.Combs CA, Balaban RS. Enzyme-dependent fluorescence recovery after photobleaching of NADH: in vivo and in vitro applications to the study of enzyme kinetics. Methods Enzymol. 2004;385:257–286. doi: 10.1016/S0076-6879(04)85015-8. [DOI] [PubMed] [Google Scholar]
- 11.Kasischke KA, Vishwasrao HD, Fisher PJ, Zipfel WR, Webb WW. Neural activity triggers neuronal oxidative metabolism followed by astrocytic glycolysis. Science. 2004;305:99–103. doi: 10.1126/science.1096485. [DOI] [PubMed] [Google Scholar]
- 12.Piston DW, Masters BR, Webb WW. Three-dimensionally resolved NAD(P)H cellular metabolic redox imaging of the in situ cornea with two-photon excitation laser scanning microscopy. J. Microsc. 1995;178(Pt 1):20–27. doi: 10.1111/j.1365-2818.1995.tb03576.x. [DOI] [PubMed] [Google Scholar]
- 13.Barlow CH, Chance B. Ischemic areas in perfused rat hearts: measurement by NADH fluorescence photography. Science. 1976;193:909–910. doi: 10.1126/science.181843. [DOI] [PubMed] [Google Scholar]
- 14.Brennan AM, Connor JA, Shuttleworth CW. NAD(P)H fluorescence transients after synaptic activity in brain slices: predominant role of mitochondrial function. J. Cereb. Blood Flow Metab. 2006;26:1389–1406. doi: 10.1038/sj.jcbfm.9600292. [DOI] [PubMed] [Google Scholar]
- 15.Skala MC, Riching KM, Gendron-Fitzpatrick A, Eickhoff J, Eliceiri KW, White JG, Ramanujam N. In vivo multiphoton microscopy of NADH and FAD redox states, fluorescence lifetimes, and cellular morphology in precancerous epithelia. Proc. Natl. Acad. Sci. U. S. A. 2007;104:19494–19499. doi: 10.1073/pnas.0708425104. [DOI] [PMC free article] [PubMed] [Google Scholar]
- 16.Chance B, THORELL B. Localization and kinetics of reduced pyridine nucleotide in living cells by microfluorometry. J. Biol. Chem. 1959;234:3044–3050. [PubMed] [Google Scholar]
- 17.Viallet P, Kohen E, Schachtschabel DO, Marty A, Salmon JM, Kohen C, Leising HB, THORELL B. The effect of atebrine and an acridine analog (BCMA) on the coenzyme fluorescence spectra of cultured melanoma and Ehrlich ascites (EL2) cells. Histochemistry. 1978;57:189–201. doi: 10.1007/BF00492079. [DOI] [PubMed] [Google Scholar]
- 18.Galeotti T, van Rossum GD, Mayer D, Chance B. Fluorescence studies of NAD(P)H binding in intact cells. Hoppe Seylers. Z. Physiol Chem. 1970;351:274–275. [PubMed] [Google Scholar]
- 19.Vishwasrao HD, Heikal AA, Kasischke KA, Webb WW. Conformational dependence of intracellular NADH on metabolic state revealed by associated fluorescence anisotropy. J Biol. Chem. 2005;280:25119–25126. doi: 10.1074/jbc.M502475200. [DOI] [PubMed] [Google Scholar]
- 20.Blinova K, Carroll S, Bose S, Smirnov AV, Harvey JJ, Knutson JR, Balaban RS. Distribution of mitochondrial NADH fluorescence lifetimes: steady-state kinetics of matrix NADH interactions. Biochemistry. 2005;44:2585–2594. doi: 10.1021/bi0485124. [DOI] [PubMed] [Google Scholar]
- 21.Avi-Dor Y, Olson JM, Doherty MD, Kaplan NO. Fluorescence of pyridine nucleotides in mitochondria. Journal of Biological Chemistry. 1962;237:2377–2383. [Google Scholar]
- 22.Estabrook RW. Fluorometric measurements of reduced pyridine nucleotide in cellular and subcellular particles. Anal. Biochem. 1962;4:231–245. doi: 10.1016/0003-2697(62)90006-4. h. [DOI] [PubMed] [Google Scholar]
- 23.Wakita M, Nishimura G, Tamura M. Some characteristics of the fluorescence lifetime of reduced pyridine nucleotides in isolated mitochondria, isolated hepatocytes, and perfused rat liver in situ. J. Biochem. (Tokyo) 1995;118:1151–1160. doi: 10.1093/oxfordjournals.jbchem.a125001. [DOI] [PubMed] [Google Scholar]
- 24.Chance B. The kinetics of flavoprotein and pyridine nucleotide oxidation in cardiac mitochondria in the presence of calcium. FEBS Lett. 1972;26:315–319. doi: 10.1016/0014-5793(72)80601-x. [DOI] [PubMed] [Google Scholar]
- 25.Territo PR, French SA, Dunleavy MC, Evans FJ, Balaban RS. Calcium activation of heart mitochondrial oxidative phosphorylation: rapid kinetics of mVO2, NADH, and light scattering. J. Biol. Chem. 2001;276:2586–2599. doi: 10.1074/jbc.M002923200. [DOI] [PubMed] [Google Scholar]
- 26.Iweibo I, Weiner H. Coenzyme interaction with horse liver alcohol dehydrogenase. Evidence for allosteric coenzyme binding sites from thermodynamic equilibrium studies. J. Biol. Chem. 1975;250:1959–1965. [PubMed] [Google Scholar]
- 27.Ambroziak W, Kosley LL, Pietruszko R. Human aldehyde dehydrogenase: coenzyme binding studies. Biochemistry. 1989;28:5367–5373. doi: 10.1021/bi00439a008. [DOI] [PubMed] [Google Scholar]
- 28.Shafer JA, Chiancone E, Vittorelli LM, Spagnuolo C, Mackler B, Antonini E. Binding of reduced cofactor to glutamate dehydrogenase. Eur. J. Biochem. 1972;31:166–171. doi: 10.1111/j.1432-1033.1972.tb02515.x. [DOI] [PubMed] [Google Scholar]
- 29.Shore JD, Evans SA, Holbrook JJ, Parker DM. NADH binding to porcine mitochondrial malate dehydrogenase. J. Biol. Chem. 1979;254:9059–9062. [PubMed] [Google Scholar]
- 30.McClendon S, Zhadin N, Callender R. The approach to the Michaelis complex in lactate dehydrogenase: the substrate binding pathway. Biophys. J. 2005;89:2024–2032. doi: 10.1529/biophysj.105.062604. [DOI] [PMC free article] [PubMed] [Google Scholar]
- 31.Lee CY, Pegoraro B, Topping JL, Yuan JH. Purification and biochemical studies of lactate dehydrogenase-X from mouse. Mol. Cell Biochem. 1977;18:49–57. doi: 10.1007/BF00215279. [DOI] [PubMed] [Google Scholar]
- 32.Duckworth HW, Tong EK. The binding of reduced nicotinamide adenine dinucleotide to citrate synthase of Escherichia coli K12. Biochemistry. 1976;15:108–114. doi: 10.1021/bi00646a017. [DOI] [PubMed] [Google Scholar]
- 33.Robinson JB, Jr., Srere PA. Organization of Krebs tricarboxylic acid cycle enzymes in mitochondria. J. Biol. Chem. 1985;260:10800–10805. [PubMed] [Google Scholar]
- 34.Territo PR, Mootha VK, French SA, Balaban RS. Ca(2+) activation of heart mitochondrial oxidative phosphorylation:role of F0/F1ATPase. Am. J. Physiol. 2000;278:c423–c435. doi: 10.1152/ajpcell.2000.278.2.C423. [DOI] [PubMed] [Google Scholar]
- 35.Sazanov LA, Peak-Chew SY, Fearnley IM, Walker JE. Resolution of the membrane domain of bovine complex I into subcomplexes: implications for the structural organization of the enzyme. Biochemistry. 2000;39:7229–7235. doi: 10.1021/bi000335t. [DOI] [PubMed] [Google Scholar]
- 36.Buchanan SK, Walker JE. Large-scale chromatographic purification of F1F0-ATPase and complex I from bovine heart mitochondria. Biochem. J. 1996;318(Pt 1):343–349. doi: 10.1042/bj3180343. [DOI] [PMC free article] [PubMed] [Google Scholar]
- 37.Hatefi Y. Preparation and properties of NADH: ubiquinone oxidoreductase (complexI), EC 1.6.5.3. Methods Enzymol. 1978;53:11–14. doi: 10.1016/s0076-6879(78)53006-1. [DOI] [PubMed] [Google Scholar]
- 38.Schagger H, von JG. Blue native electrophoresis for isolation of membrane protein complexes in enzymatically active form. Anal. Biochem. 1991;199:223–231. doi: 10.1016/0003-2697(91)90094-a. [DOI] [PubMed] [Google Scholar]
- 39.Wittig I, Schagger H. Advantages and limitations of clear-native PAGE. Proteomics. 2005;5:4338–4346. doi: 10.1002/pmic.200500081. [DOI] [PubMed] [Google Scholar]
- 40.Balaban RS, Mootha VK, Arai A. Spectroscopic determination of cytochrome c oxidase content in tissues containing myoglobin or hemoglobin. Anal. Biochem. 1996;237:274–278. doi: 10.1006/abio.1996.0239. [DOI] [PubMed] [Google Scholar]
- 41.Schagger H, Pfeiffer K. The ratio of oxidative phosphorylation complexes I-V in bovine heart mitochondria and the composition of respiratory chain supercomplexes. J. Biol. Chem. 2001;276:37861–37867. doi: 10.1074/jbc.M106474200. [DOI] [PubMed] [Google Scholar]
- 42.Thompson ST, Cass KH, Stellwagen E. Blue dextran-sepharose: an affinity column for the dinucleotide fold in proteins. Proc. Natl. Acad. Sci. U. S. A. 1975;72:669–672. doi: 10.1073/pnas.72.2.669. [DOI] [PMC free article] [PubMed] [Google Scholar]
- 43.Wittig I, Karas M, Schagger H. High resolution clear native electrophoresis for ingel functional assays and fluorescence studies of membrane protein complexes. Mol. Cell Proteomics. 2007;6:1215–1225. doi: 10.1074/mcp.M700076-MCP200. [DOI] [PubMed] [Google Scholar]
- 44.Majander A, Finel M, Wikstrom M. Diphenyleneiodonium inhibits reduction of iron-sulfur clusters in the mitochondrial NADH-ubiquinone oxidoreductase (Complex I) J. Biol. Chem. 1994;269:21037–21042. [PubMed] [Google Scholar]
- 45.Zerbetto E, Vergani L, bbeni-Sala F. Quantification of muscle mitochondrial oxidative phosphorylation enzymes via histochemical staining of blue native polyacrylamide gels. Electrophoresis. 1997;18:2059–2064. doi: 10.1002/elps.1150181131. [DOI] [PubMed] [Google Scholar]
- 46.Balaban RS. Maintenance of the metabolic homeostasis of the heart: developing a systems analysis approach. Ann. N. Y. Acad. Sci. 2006;1080:140–153. doi: 10.1196/annals.1380.013. [DOI] [PubMed] [Google Scholar]
- 47.Chen S, Guillory RJ. Studies on the interaction of arylazido-beta-alanyl NAD+ with the mitochondrial NADH dehydrogenase. J. Biol. Chem. 1981;256:8318–8323. [PubMed] [Google Scholar]
- 48.Chen S, Guillory RJ. Identification of the NADH-NAD+ transhydrogenase peptide of the mitochondrial NADH-CoQ reductase (Complex I). A photodependent labeling study utilizing arylazido-beta-alanyl NAD+ J. Biol. Chem. 1984;259:5124–5131. [PubMed] [Google Scholar]
- 49.Scrutton NS, Berry A, Perham RN. Redesign of the coenzyme specificity of a dehydrogenase by protein engineering. Nature. 1990;343:38–43. doi: 10.1038/343038a0. [DOI] [PubMed] [Google Scholar]
- 50.Duarte M, Schulte U, Ushakova AV, Videira A. Neurospora strains harboring mitochondrial disease-associated mutations in iron-sulfur subunits of complex I. Genetics. 2005;171:91–99. doi: 10.1534/genetics.105.041517. [DOI] [PMC free article] [PubMed] [Google Scholar]
- 51.Sazanov LA, Hinchliffe P. Structure of the hydrophilic domain of respiratory complex I from Thermus thermophilus. Science. 2006;311:1430–1436. doi: 10.1126/science.1123809. [DOI] [PubMed] [Google Scholar]
- 52.Sazanov LA. Respiratory complex I: mechanistic and structural insights provided by the crystal structure of the hydrophilic domain. Biochemistry. 2007;46:2275–2288. doi: 10.1021/bi602508x. [DOI] [PubMed] [Google Scholar]
- 53.Yamaguchi M, Belogrudov GI, Matsuno-Yagi A, Hatefi Y. The multiple nicotinamide nucleotide-binding subunits of bovine heart mitochondrial NADH:ubiquinone oxidoreductase (complex I) Eur. J. Biochem. 2000;267:329–336. doi: 10.1046/j.1432-1327.2000.00999.x. [DOI] [PubMed] [Google Scholar]
- 54.Amarneh B, Vik SB. Direct transfer of NADH from malate dehydrogenase to complex I in Escherichia coli. Cell Biochem. Biophys. 2005;42:251–261. doi: 10.1385/CBB:42:3:251. [DOI] [PubMed] [Google Scholar]
- 55.Johnson DT, Harris RA, French S, Blair PV, You J, Bemis KG, Wang M, Balaban RS. Tissue heterogeneity of the mammalian mitochondrial proteome. Am. J Physiol Cell Physiol. 2007;292:C689–C697. doi: 10.1152/ajpcell.00108.2006. [DOI] [PubMed] [Google Scholar]
- 56.Lakowicz JR, Szmacinski H, Nowaczyk K, Johnson ML. Fluorescence lifetime imaging of free and protein-bound NADH. Proc. Natl. Acad. Sci. U. S. A. 1992;89:1271–1275. doi: 10.1073/pnas.89.4.1271. [DOI] [PMC free article] [PubMed] [Google Scholar]
- 57.Joubert F, Fales HM, Wen H, Combs CA, Balaban RS. NADH enzyme-dependent fluorescence recovery after photobleaching (ED-FRAP): applications to enzyme and mitochondrial reaction kinetics, in vitro. Biophys. J. 2004;86:629–645. doi: 10.1016/S0006-3495(04)74141-7. [DOI] [PMC free article] [PubMed] [Google Scholar]
Associated Data
This section collects any data citations, data availability statements, or supplementary materials included in this article.