Abstract
Systematic analysis of the RNA-protein interactome requires robust and scalable methods. We here show the combination of two completely orthogonal, generic techniques to identify RNA-protein interactions: PAR-CLIP reveals a collection of RNAs bound to a protein whereas SILAC-based RNA pull-downs identify a group of proteins bound to an RNA. We investigated binding sites for five different proteins (IGF2BP1-3, QKI and PUM2) exhibiting different binding patterns. We report near perfect agreement between the two approaches. Nevertheless, they are non-redundant, and ideally complement each other to map the RNA-protein interaction network.
INTRODUCTION
Messenger RNAs (mRNAs) are bound by RNA-binding proteins that determine their localization, stability and translational efficiency. In the last decade, introduction of systematic and global methodologies have greatly improved our knowledge of the nature and the complexity of mRNA-protein interactions. In particular, protein-centric methods, in which the protein of interest is immunoprecipitated by an antibody and the interacting RNAs identified on a transcriptome-wide scale by microarray hybridization (RIP-chip) or next-generation sequencing (RIP-seq), have uncovered a complex target recognition pattern for RNA-binding proteins (1–3). Photoactivatable-Ribonucleoside-Enhanced Crosslinking and Immunoprecipitation (PAR-CLIP), a recently developed technique, uses 4-thiouridine (4SU) to label mRNAs in vivo combined with UV-crosslinking to improve recovery and to facilitate the identification of the crosslinking site (4). However, in all these approaches technical parameters influence the identification of binding sites (5) and there is no complete overlap between individual experiments and sometimes low overlap between different laboratories.
In RNA-centric methods, the discovery of proteins interacting with a selected RNA is commonly performed by mass spectrometry (MS). In most cases, the proteins bound to an RNA are selected for MS analysis by visual inspection of stained sodium dodecyl sulphate (SDS) gels. We recently increased throughput and enabled streamlined systematic studies using a quantitative proteomics method based on stable isotope labeling of amino acids in cell culture (SILAC). That approach allows for the discovery of RNA-binding proteins specifically bound to an RNA recognition element (RRE) embedded within a longer RNA fragment interacting with a large number of unspecific binding proteins (6). However, systematic studies require the confident identification of proteins in complex mixtures, which still presents a challenge in many mass spectrometric laboratories (7). Apart from our previous study on a 3′-UTR fragment of HDAC2 (6), a similar quantitative MS-based concept has also been used to characterize proteins binding to the untranslated region (UTR) of viral DENV-2 (8). Recently, another group reported the purification of crosslinked MS2-tagged ribonucleoproteins (RNPs) under denaturing conditions using SILAC (9).
Although some factors in our previous study were validated using other methods, we were particularly interested in how our quantitative in vitro RNA pull-down approach compares to PAR-CLIP, another streamlined and generic method to identify RNA-protein interactions. Besides their intrinsic technical challenges, PAR-CLIP and quantitative RNA pull-downs have additional but not identical caveats due to the generic nature of these approaches. In the absence of suitable antibodies, PAR-CLIP is generally performed with overexpressed, FLAG-tagged protein and 4SU-labeled RNA in vivo followed by next-generation sequencing of the bound RNA fraction. In contrast, SILAC-based RNA pull-downs are currently performed in vitro, but expose non-modified RNA baits to endogenous protein levels. Given these completely different approaches, RNA-protein interactions that are common to them is very likely to be true. Likewise, a strong overlap between these different techniques would, by necessity, validate both approaches.
MATERIALS AND METHODS
SILAC cell extract
HeLa S3 cells were SILAC-labeled in RPMI 1640 (-Arg, -Lys) medium containing 10% dialyzed fetal bovine serum (Gibco) supplemented with 84 mg/l 13C615N4 L-arginine and 40 mg/l 13C615N2 L-lysine (Eurisotop) or the corresponding non-labeled amino acids, respectively. Three consecutive batches of cells were independently harvested and cell extracts prepared as described by Dignam et al. (10). For this study, the cytosolic fraction of this extraction procedure was used.
Production of RNA templates
To create RNA templates, regions of interest were cloned into pcDNA3.3 (Invitrogen) and amplified forward primers containing the T7 promoter and reverse primers with the minimal S1 aptamer sequence (11). The control fragment was amplified from pDEST17 vector and also subcloned into pcDNA3.3 whereas the IRE fragment was constructed by primer extension (Supplementary Table S1, Supplementary Figure S7). Polymerase chain reaction (PCR) fragments (1 µg) were used in in vitro run-off transcription using T7 RNA polymerase and tagged RNA oligonucleotides were purified with G-50 micro spin columns (GE Healthcare). Successful in vitro transcription was monitored by running an aliquot of the reaction on a 10% denaturing polyacrylamide gel (Rotiphorese), staining with ethidium bromide and subsequent UV detection. RNA concentration was determined by UV absorbance measurement on a Nanodrop (Peqlab).
RNA pull-down
25 µg of S1-tagged RNA was bound to paramagnetic streptavidin beads (Dynabeads C1, Invitrogen) in RNA binding buffer (150 mM NaCl, 50 mM Hepes-HCl pH 7.5, 0.5% NP40 (v/v), 10 mM MgCl2) and incubated on a rotation wheel at 4°C. Beads were washed three times with RNA wash buffer containing 250 mM NaCl, 50 mM Hepes-HCl pH 7.5, 0.5% NP40 and 10 mM MgCl2 before incubation at 4°C for 30 min with 400 µg of cytoplasmic extract; 40 units RNase inhibitor (Fermentas) and 20 µg yeast tRNA (Invitrogen). After incubation beads were washed another three times with RNA wash buffer, fractions combined and RNA was eluted from the beads with buffer containing 16 mM biotin. The ethanol-precipitated supernatant was resuspended in 8 M urea/50 mM ammonium bicarbonate pH 8 (Sigma) for subsequent MS analysis.
MS data acquisition and data analysis
In-solution digestion and MS analysis was performed essentially as previously described (6). Peptides were desalted on StageTips and separated on a C18-reversed phase column packed with Reprosil (Dr Maisch), directly mounted on the electrospray ion source on a Orbitrap mass spectrometer (Thermo Fisher Scientific). We used a 120 min gradient from 2% to 60% acetonitrile in 0.5% acetic acid at a flow of 200 nl/min. Measurements were either performed on a LTQ-Orbitrap XL using CID fragmentation or a Velos-Orbitrap using HCD fragmentation (12) with a data-dependent Top10 MS/MS spectra acquisition method per MS full scan in the Orbitrap analyser. The raw files were processed with MaxQuant (6,13) (version 1.0.11.5) and searched with the Mascot search engine (version 2.2.04, Matrix Science) against the IPI human v3.37 protein database concatenated with a decoy of the reversed sequences. Carbamidomethylation was set as fixed modification whereas methionine oxidation and protein N-acetylation were considered as variable modifications. The search was performed with an initial mass tolerance of 7 ppm mass accuracy for the precursor ion and 0.5 Da (CID) or 20 ppm (HCD) for the MS/MS spectra. Search results were processed with MaxQuant and identification up to a false discovery rate of 0.01 were accepted. Prior to statistical analysis, known contaminants and reverse hits were removed. Only proteins identified with at least two unique peptides and quantification events were considered for analysis. Two-dimensional interaction plots were plotted in R (prerelease version 2.8.0).
Overexpression of IGF2BP2
The IGF2BP2 gene sequence from the Orfeome Collection (OCAAo5051F0895D) was recombined into a FLAG/pcDNA3.1 gateway compatible expression vector. HeLa cells were labeled in DMEM (-Arg, -Lys) medium containing 10 % dialyzed fetal bovine serum (Gibco) supplemented with 58 mg/l 13C615N4 L-arginine and 34 mg/l 13C615N2 L-lysine (Eurisotop) or the corresponding non-labeled amino acids, respectively. One 10 cm dish with around 7 million cells (80% confluence) each for light and heavy were transfected with FLAG/pcDNA3.1/IGF2BP2 using Lipofectamine 2000 (Life Technologies) according to the manufacturer’s instructions. Optimem medium (Life Technologies) containing the complexes was replaced 4 hr after transfection by light and heavy SILAC medium, respectively. After 24 hr, cells were trypsinized, harvested and cell extracts were prepared as described in Dignam et al. (10).
RESULTS AND DISCUSSION
To compare the two technologies for RNA-protein mapping in an unbiased way, we performed a blind study with RNA regions selected by one group (Tuschl) without prior knowledge of the binding proteins by the other group (Mann). Five different RNA binding proteins previously analysed by PAR-CLIP were chosen to represent different mRNA binding patterns (Supplementary Figure S8): these included the three members of the IGF2BP family, QKI and PUM2. IGF2BP1-3 share the same CAU RRE, often repeated on G-poor RNA segments. The three members appear to have overlapping target specificities, however, the variable sequencing depth between PAR-CLIP experiments leads to incomplete overlap, especially for less abundant mRNAs. QKI has a well-defined 6-nt RRE (AYUAAY). The last candidate, PUM2, is part of a two-protein family in humans, which share an 8-nt RRE (UGUANAUA). The three protein families have distinct distributions of binding sites reflecting their different subcellular localization and function. IGF2BP and PUM proteins are predominantly cytoplasmic and their binding sites are predominantly found in exons; however, while IGF2BP proteins distribute binding sites about equally across coding sequence (CDS) and UTR, PUM binding sites are almost exclusively located in 3′-UTRs. In contrast, the QKI protein is predominantly nuclear and the majority of binding sites are intronic; those sites that are exonic predominantly distribute to the 3′-UTR (4).
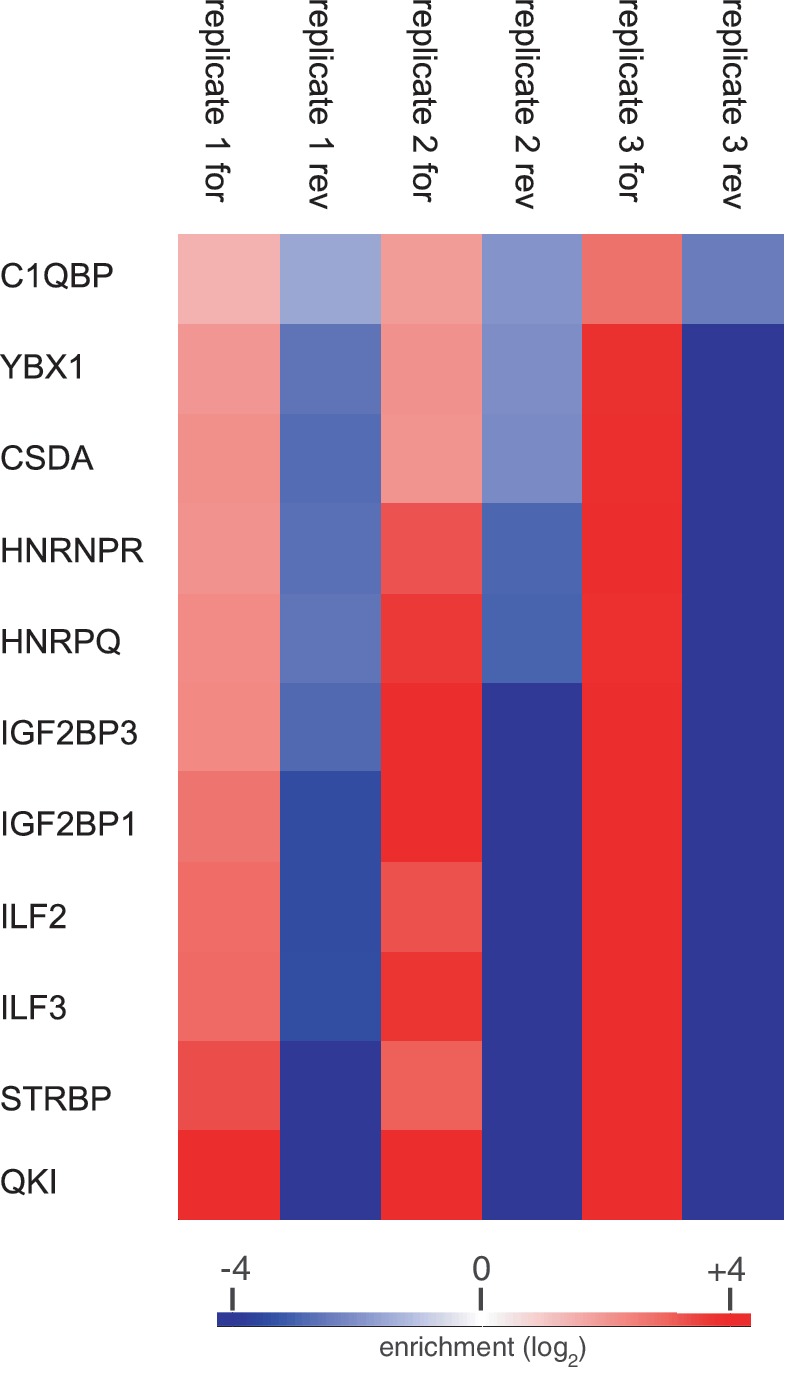
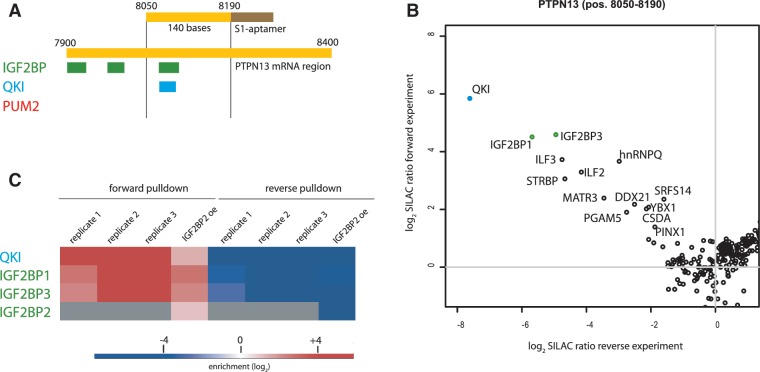
We designed fragments of around 100–150 bases (Supplementary Table S2), which allows a natural context of the binding site, but limits the number of putative additional interaction sites for other RNA-binding proteins in close vicinity. We first focused on the PTPN13 mRNA 3′-UTR region (pos. 8050–8190), which in PAR-CLIP experiments yielded binding sites for IGF2BP1, IGF2BP2, IGF2BP3 and QKI (Figure 1A). To ensure high specificity of the quantification experiments, the pull-downs were always conducted in duplicate with switched isotope labels. Specific binders showing high SILAC ratios in the forward pull-down (target sequence incubated with heavy extract, control sequence incubated with light extract) need to have a reciprocal value in the reverse pull-down (target sequence incubated with light extract, control sequence incubated with heavy extract) (Supplementary Figure S1, Supplementary Table S3). These experiments identified IGF2BP1, IGF2BP3 and QKI as specific interactors to this fragment as compared with an unrelated control RNA fragment. Furthermore, these three proteins had some of the highest SILAC ratios obtained in this data set (Figure 1B). We did not detect binding of IGF2BP2 to this fragment. This is likely due to its at least 10 times lower abundance in HeLa cells (14) compared with IGF2BP1 and IGF2BP3 and dynamic range limitations in the mass spectrometer in the presence of highly abundant unspecific background binders. As expected, specific IGF2BP2 binding was readily detectable in lysates from cells overexpressing FLAG-IGF2BP2 (Figure 1C, Supplementary Figure S2). Additionally, we identified 11 other RNA-binding proteins that were at least 2-fold enriched on our bait PTPN13 RNA. Notably, eight of them are found in all three independent replicates: the cold-shock domain proteins YBX1 and CSDA, the complement factor C1QBP, the heterogeneous nuclear particles HNRNPR and HNRPQ, the heterodimer composed of ILF2 and ILF3, and the double strand RNA binding protein STRBP (Figure 2).
Figure 1.
(A) RNA bait fragment of the PTPN13 mRNA (pos. 8050–8190) fused 5′ of the S1-aptamer together with an overview of PAR-CLIP reported RNA binding sites. (B) Example of a two-dimensional interaction plot for the pos. 8050–8190 PTPN13 mRNA fragment incubated with HeLa wild-type extract. IGF2BP1, IGF2BP3 and QKI were previously reported to bind to this fragment. (C) Biological replicates show reproducible enrichment of specific binding events in forward and reverse pull-down. IGF2BP2 is detected in the screen only when expressed ectopically.
Figure 2.

Heatmap of specifically enriched proteins in all replicates of the PTPN13 mRNA (pos. 8050–8190) fragment shows eight proteins with an enrichment pattern similar to IGF2BPs and QKI.
To eliminate any potential systematic effect of the control fragment, we repeated the experiment with another unrelated RNA fragment containing an iron response element (IRE). This control fragment should specifically bind the IRE-binding proteins with inverted SILAC ratios while still preserving detection of the specific candidates at the PTPN13 mRNA fragment. Indeed, we were able to enrich IGF2BPs and QKI on the PTPN13 mRNA fragment (pos. 8050–8190) whereas the IRE control sequence was bound by its known binding partner IREB1 (Supplementary Figure S3). When we tested this IRE containing RNA fragment against itself, IREB1 was detected with a SILAC ratio of around one and no protein showed a SILAC ratio indicative of specific binding (Supplementary Figure S4). To investigate the reproducibility of our results, we performed the pull-downs of PTPN13 mRNA fragment (pos. 8050–8190) versus pDEST17 control fragment with extracts derived from three independent cell populations. In all three experiments we confirmed that IGF2BP1 and 3, as well as QKI, were specific binders as indicated by their SILAC ratios (Figure 1C, Supplementary Figure S5). Furthermore, while triplicates showed high reproducibility for detection of the specific interactors, each single experiment already unambiguously identified the binding partners. To validate the interaction of PUM2, which did not bind to the former PTPN13 mRNA fragment, we chose the PDCD10 mRNA 3′-UTR region (pos. 1274–1380) and readily identified PUM2 as a binder (Supplementary Figure S6).
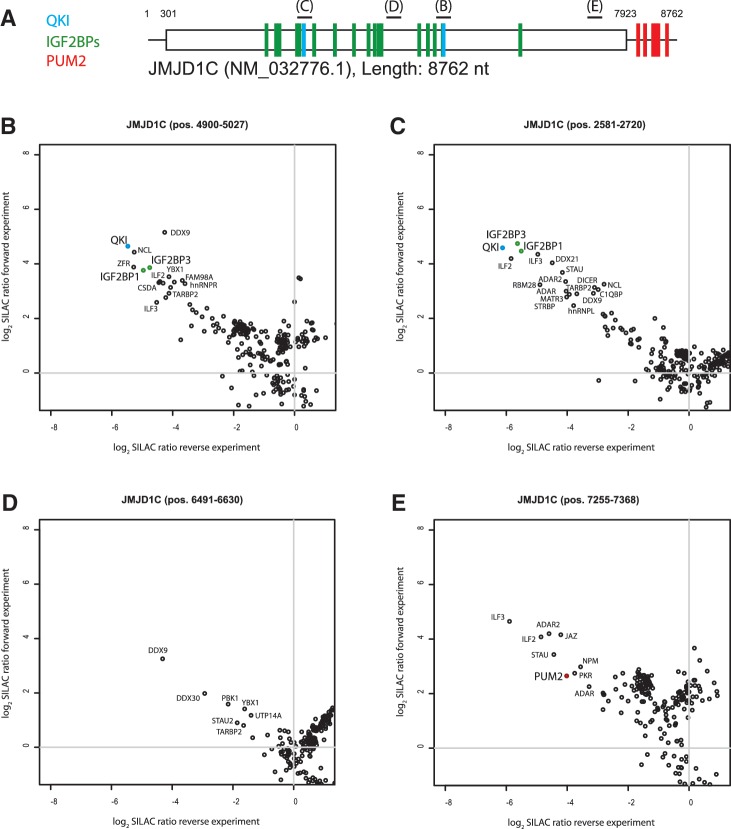
Having validated the approach for each of the five proteins, we focused on the JMJD1C mRNA, which interacts with all five proteins, but in different regions (Figure 3A). The JMJD1C mRNA CDS fragment (pos. 4900–5027) (Figure 3B) and JMJD1C mRNA CDS fragment (pos. 2581–2720) (Figure 3C) both bind IGF2BP family members and QKI. Two further JMJD1C CDS region (pos. 6491–6630 and pos. 7255–7368) were selected as controls devoid of PAR-CLIP binding sites. The SILAC assay showed no enrichment for any of the tested proteins for the first region (pos. 6491–6630) (Figure 3D), however, the second region (pos. 7255–7368), which comprised a perfect PUM2 consensus motif (UGUAAAUA) identified PUM2 as a specific binder (Figure 3E). This was unanticipated, given that PAR-CLIP revealed several PUM2 binding sites located in the 3′-UTR (222 reads in 5 clusters), and none covering the PUM2 site located in the CDS region or any other region in its CDS (4). Presumably in vivo, PUM2 can only stably associate with the 3′-UTR and translation through the CDS prevents stable PUM2 binding.
Figure 3.
(A) Representation of PAR-CLIP binding sites for JMJD1C mRNA: IGF2BPs (green), QKI (blue) and PUM2 (red). (B–E) Two-dimensional interaction plots for four regions of the JMJD1C mRNA: (B) regions pos. 4900–5027 and (C) pos. 2581–2720 bind QKI and IGF2BP family members. (D) A control region, which binds neither IGF2BP family members nor QKI or PUM2 in PAR-CLIP. (E) PUM2 is detected as binder to the pos. 7255–7368 fragment harboring a PUM2 consensus binding site that was not occupied in PAR-CLIP.
In summary, our blind comparison of protein-centric and RNA-centric methods for characterizing RNA-protein binding found a nearly perfect overlap between binding sites identified by PAR-CLIP and SILAC-based RNA pull-downs, even in different cell lines. We were able to validate nearly all interactions detected by PAR-CLIP, which implies in vitro versus in vivo reproducibility of the detected mRNA-protein interactions and stability of mRNPs in our range of experimental conditions.
We reproducibly demonstrated the binding of 8 other proteins to our PTPN13 mRNA fragment (pos. 8050–8190) (Figure 2). The sequence stretch of 150 bases is long enough to harbor additional RRE for these proteins. As in the known case of IGF2BP family members it is, however, also possible that RNA-binding proteins recognize the same binding site and thus compete for binding, which under the conditions of the RNA pull-down will also result in their detection. Furthermore, although most of the proteins have RNA-binding domains, it cannot be ruled out that some are recruited to the bait by secondary protein–protein interactions. For example, we have previously used a shorter 26 nt RNA bait containing the zip-code binding sequence to identify IGF2BP1 and IGF2BP3 in an identical setup (6). In this experiment, we already co-purified CSDA, YBX1 and C1QBP, which may have interacted via protein–protein interactions, especially as YBX1 has previously been shown to be part of the CRD-mediated mRNA stability complex (15). In such a situation, PAR-CLIP can then be used to close the circle by characterizing the binding characteristics of these proteins.
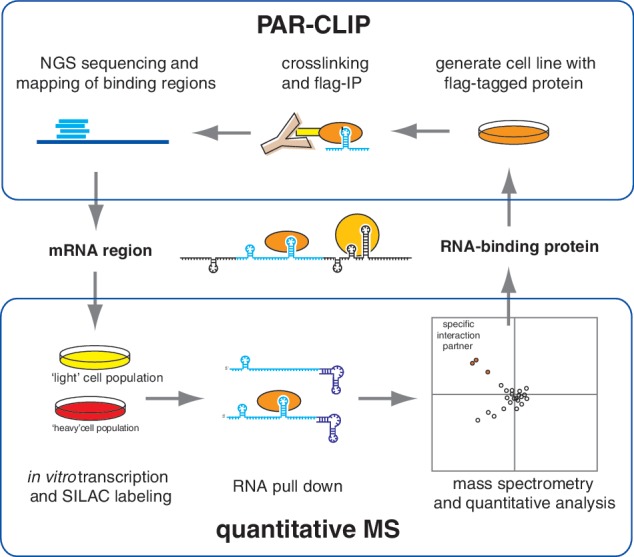
Despite the good overlap, the two methods are not redundant: the protein-centric method will typically be used when one is interested in the RNA binding profile of a particular protein whereas the RNA-centric method will be used when one is interested in a particular RNA. These complementary methods can then validate the found RRE with high confidence. The two technologies are well suited for systematic analysis of mRNPs as they are orthogonal of each other, use different experimental conditions, do not rely on specialized reagents, and can be performed quite rapidly for any protein or any RNA sequence. We therefore propose the iterative use of these two powerful technologies to map the mRNP interactome (Figure 4).
Figure 4.

PAR-CLIP reports transcriptome-wide binding sites for RNA-binding proteins based on deep sequencing. These binding sites can then be screened for additional mRNA-binding proteins by quantitative MS using PAR-CLIP data as positive control. Quantitative MS identifies the specific RNA-binding proteins from the endogenous proteome, which can be targeted for immunoprecipitation and analysis by PAR-CLIP for cross-validation.
SUPPLEMENTARY DATA
Supplementary Data are available at NAR Online: Supplementary Tables 1–3 and Supplementary Figures 1–8.
FUNDING
Max Planck Society for the Advancement of Science and the European Union [HEALTH-F4-2008-201648]. M.H. is funded by a fellowship of the Charles H. Revson Foundation. T.T. is an HHMI investigator, and this work in his laboratory was supported by National Institutes of Health [1RC1CA145442], and Starr Foundation grants. Funding for open access charge: Max Planck Society.
Conflict of interest statement. T.T. is cofounder and scientific advisor to Alnylam Pharmaceuticals and Regulus Therapeutics.
Supplementary Material
ACKNOWLEDGEMENTS
The authors thank Anja Wehner and Korbinian Mayr for technical assistance.
REFERENCES
- 1.Licatalosi DD, Mele A, Fak JJ, Ule J, Kayikci M, Chi SW, Clark TA, Schweitzer AC, Blume JE, Wang X, et al. HITS-CLIP yields genome-wide insights into brain alternative RNA processing. Nature. 2008;456:464–469. doi: 10.1038/nature07488. [DOI] [PMC free article] [PubMed] [Google Scholar]
- 2.Takizawa PA, DeRisi JL, Wilhelm JE, Vale RD. Plasma membrane compartmentalization in yeast by messenger RNA transport and a septin diffusion barrier. Science. 2000;290:341–344. doi: 10.1126/science.290.5490.341. [DOI] [PubMed] [Google Scholar]
- 3.Ule J, Jensen KB, Ruggiu M, Mele A, Ule A, Darnell RB. CLIP identifies Nova-regulated RNA networks in the brain. Science. 2003;302:1212–1215. doi: 10.1126/science.1090095. [DOI] [PubMed] [Google Scholar]
- 4.Hafner M, Landthaler M, Burger L, Khorshid M, Hausser J, Berninger P, Rothballer A, Ascano M, Jr, Jungkamp AC, Munschauer M, et al. Transcriptome-wide identification of RNA-binding protein and microRNA target sites by PAR-CLIP. Cell. 2010;141:129–141. doi: 10.1016/j.cell.2010.03.009. [DOI] [PMC free article] [PubMed] [Google Scholar]
- 5.Kishore S, Jaskiewicz L, Burger L, Hausser J, Khorshid M, Zavolan M. A quantitative analysis of CLIP methods for identifying binding sites of RNA-binding proteins. Nat. Methods. 2011;8:559–564. doi: 10.1038/nmeth.1608. [DOI] [PubMed] [Google Scholar]
- 6.Butter F, Scheibe M, Morl M, Mann M. Unbiased RNA-protein interaction screen by quantitative proteomics. Proc. Natl Acad. Sci. USA. 2009;106:10626–10631. doi: 10.1073/pnas.0812099106. [DOI] [PMC free article] [PubMed] [Google Scholar]
- 7.Bell AW, Deutsch EW, Au CE, Kearney RE, Beavis R, Sechi S, Nilsson T, Bergeron JJ. A HUPO test sample study reveals common problems in mass spectrometry-based proteomics. Nat. Methods. 2009;6:423–430. doi: 10.1038/nmeth.1333. [DOI] [PMC free article] [PubMed] [Google Scholar]
- 8.Ward AM, Bidet K, Yinglin A, Ler SG, Hogue K, Blackstock W, Gunaratne J, Garcia-Blanco MA. Quantitative mass spectrometry of DENV-2 RNA-interacting proteins reveals that the DEAD-box RNA helicase DDX6 binds the DB1 and DB2 3' UTR structures. RNA Biol. 2011;8:1173–1186. doi: 10.4161/rna.8.6.17836. [DOI] [PMC free article] [PubMed] [Google Scholar]
- 9.Tsai BP, Wang X, Huang L, Waterman ML. Quantitative profiling of in vivo-assembled RNA-protein complexes using a novel integrated proteomic approach. Mol. Cell. Proteomics. 2011;10:M110 007385. doi: 10.1074/mcp.M110.007385. [DOI] [PMC free article] [PubMed] [Google Scholar]
- 10.Dignam JD, Lebovitz RM, Roeder RG. Accurate transcription initiation by RNA polymerase II in a soluble extract from isolated mammalian nuclei. Nucleic Acids Res. 1983;11:1475–1489. doi: 10.1093/nar/11.5.1475. [DOI] [PMC free article] [PubMed] [Google Scholar]
- 11.Srisawat C, Engelke DR. Streptavidin aptamers: affinity tags for the study of RNAs and ribonucleoproteins. RNA. 2001;7:632–641. doi: 10.1017/s135583820100245x. [DOI] [PMC free article] [PubMed] [Google Scholar]
- 12.Olsen JV, Macek B, Lange O, Makarov A, Horning S, Mann M. Higher-energy C-trap dissociation for peptide modification analysis. Nat. Methods. 2007;4:709–712. doi: 10.1038/nmeth1060. [DOI] [PubMed] [Google Scholar]
- 13.Cox J, Mann M. MaxQuant enables high peptide identification rates, individualized p.p.b.-range mass accuracies and proteome-wide protein quantification. Nat. Biotechnol. 2008 doi: 10.1038/nbt.1511. [DOI] [PubMed] [Google Scholar]
- 14.Nagaraj N, Wisniewski JR, Geiger T, Cox J, Kircher M, Kelso J, Paabo S, Mann M. Deep proteome and transcriptome mapping of a human cancer cell line. Mol. Syst. Biol. 2011;7:548. doi: 10.1038/msb.2011.81. [DOI] [PMC free article] [PubMed] [Google Scholar]
- 15.Weidensdorfer D, Stohr N, Baude A, Lederer M, Kohn M, Schierhorn A, Buchmeier S, Wahle E, Huttelmaier S. Control of c-myc mRNA stability by IGF2BP1-associated cytoplasmic RNPs. RNA. 2009;15:104–115. doi: 10.1261/rna.1175909. [DOI] [PMC free article] [PubMed] [Google Scholar]
Associated Data
This section collects any data citations, data availability statements, or supplementary materials included in this article.


