Summary
Haematopoiesis is a self-renewing and multi-directional differentiation process of haematopoietic stem cells (HSCs), which is modulated very precisely by the haematopoietic microenvironment in bone marrow. Our previous study has demonstrated that oestrogen-deficiency leads to haematopoiesis dysfunction which manifests as a decrease in haematopoietic tissues and an increase in adipose tissues in bone marrow. However, the mechanism involved in the oestrogen-deficiency effects on haematopoiesis dysfunction is not completely understood. In this study, we established an oestrogen-deficiency rat model by ovariectomy (OVX group). Haematopoiesis was evaluated at the 12th, 16th, 20th, 24th and 28th weeks after operation in the OVX group and its control (Sham group) by pathological examination; the number and function of HSCs were evaluated by flow cytometry analysis and colony-forming assay respectively. Haematopoietic growth factors levels including granulocyte/macrophage-colony-stimulating factor (GM-CSF), stem cell factor (SCF) and interleukin-3 (IL-3) were examined by ELISA kits at different time points. We found that in the OVX group, haematopoiesis dysfunction in bone marrow was observed (P < 0.05) from the 12th week when compared with the Sham group, and extramedullary haematopoiesis began to appear in the liver and spleen from the 16th week. The number of HSCs and colony-forming units-granulocyte/macrophage (CFUs-GM) in bone marrow was reduced significantly (P < 0.05) from the 20th and 16th week respectively. Furthermore, GM-CSF, SCF and IL-3 in the OVX group decreased significantly (P < 0.05) since the 12th, 16th and 24th week respectively. Taken together, these results suggested that oestrogen is required for normal haematopoiesis. Oestrogen-deficiency inducing haematopoiesis dysfunction may be via reduction in HSCs and haematopoietic growth factors at a late stage.
Keywords: haematopoiesis dysfunction, haematopoietic growth factor, haematopoietic stem cell, oestrogen-deficiency, ovariectomy
Haematopoiesis is a biological process that is regulated precisely by the haematopoietic microenvironment, including mesenchymal cells, extracellular matrix components, haematopoietic growth factors (HGFs) and adhesion molecules that are secreted by mesenchymal cells (Dexter et al. 1997). At the foetal stage of vertebrate ontogeny, haematopoiesis takes place sequentially from the embryonic yolk sac, foetal liver to bone marrow, which finally becomes the primary haematopoietic site throughout the whole life (Ogawa et al. 1988). When haematopoiesis in bone marrow is disrupted by a variety of stimuli then extramedullary haematopoiesis (EMH) supervenes to meet the body’s demands. It is well known that common sites of EMH are liver, spleen and spine (Tefferi 2000).
Haematopoietic stem cells (HSCs) are a population of pluripotent cells, which are capable of continuously producing mature blood cells of all lineages which enter the peripheral blood. In addition they give rise to daughter progeny for self-renewal throughout life (Lemischka et al. 1986). Haematopoietic growth factors, a group of haematopoietic regulatory proteins, which are produced by mesenchymal cells, together with HSCs constitute the HSC niches in bone marrow (Heinrich et al. 1993). HSC make the process of self-replication and are regulated in a complicated fashion by HGFs and other cytokines in the HSC niches and then release the daughter cells outside for further proliferation and differentiation (Zhang et al. 2003). Granulocyte/macrophage-colony-stimulating factor (GM-CSF), stem cell factor (SCF), interleukin-3 (IL-3), erythropoietin (Epo) and thrombopoietin (TPO) all belong to HGFs. These factors exert the biological effects on binding to their corresponding receptors, most of which promote the proliferation and differentiation of HSCs (Leary et al. 1992). Besides, synergistic actions among these HGFs often occur to further enhance haematopoietic function (Nocka et al. 1990; McNiece et al. 1991).
More and more evidence has shown that oestrogen plays an important role in haemocytogenesis. Early in 1966, Edward & Reisner reported that oestrogen in vitro promotes on granulopoiesis. In addition, in mice and in postmenopausal women, high dose of oestrogen and hormone-replacement therapies improve the proliferation and differentiation of megakaryocytes (Bord et al. 2000; Perry et al. 2000). In our previous studies, oestrogen-deficiency led to significant changes in bone marrow pathology: the volume of haematopoietic tissue decreased and the volume of adipose tissue increased from the 8th week. Furthermore, the number of megakaryocytes decreased. Thus, haematopoietic dysfunction correlate well with oestrogen-deficiency. However, the profound effect of oestrogen-deficiency on haematopoiesis and the underlying mechanism have not been fully elucidated. In this study, we use the ovariectomized rat as a model to explore the relationship between oestrogen-deficiency and haematopoiesis and its mechanism further.
Materials and methods
Animals and experimental design
Fifty 3-month-old female Sprague-Dawley rats weighing 241–262 g were purchased from Shanghai Experimental Animal Center of Chinese Academy of Sciences (Shanghai, China). These rats were randomly assigned into ovariectomized (OVX) and sham-operated (Sham) groups (n = 25 per group). Before surgeries, the rats in both groups were anesthetized by intraperitoneal injection of 10% chloral hydrate. Both ovaries were removed in the rats of OVX group but not in the Sham group. Then both groups were fed at Zhejiang Chinese Medical University Laboratory Animal Research Center, with a 12h:12 h light/dark cycle and no-limit access to food and water. At the 12th, 16th, 20th, 24th and 28th weeks after surgeries, five rats randomly selected from each group were killed by cervical dislocation and their peripheral blood samples, bone marrow aspirates, livers, spleens, femurs and tibias were collected for further analysis.
All procedures were approved by the Institutional Animal Care and Use Committee of Zhejiang Chinese Medical University and conformed to the National Institutes of Health Guide for the Care and Use of Laboratory Animal.
Oestrogen assay
Peripheral blood samples were collected from the postglobal veins, allowed to clot at room temperature and centrifuged at 800 g for 5 min. The upper layer of serum was removed and used to measure oestrogen levels. Each sample was tested in triplicate. A Rat Estradiol Radioimmunoassay kit (KeyGEN Biotech, Nanjing, China) was used following the manufacturer’s protocols.
Pathological examination
The samples derived from metaphysic cancellous bone of femurs were fixed in 10% formalin and decalcified in 10% buffered EDTA (pH 7.0) for 2 weeks. The dehydrated and decalcified tissues were embedded in paraffin. Four micrometre slices were cut and stained with haematoxylin–eosin (H–E) for bone marrow morphological analysis. The haematopoietic tissue and adipose tissue were counted as described by Zhu et al. (2009) and the percentage of each component was calculated as described previously (Revell 1983). For megakaryocytes all cells were counted and then the and number per square millimetre was calculated (Pu & Yang 2002). Liver and spleen samples were also fixed, dehydrated and prepared for paraffin section with H–E staining as described above.
Blood testing
Anti-coagulated peripheral blood samples were collected and the percentages and absolute values of leucocytes, erythrocytes and platelets were identified using a CELL-DYN1600 automated hematology analyzer (Abbott Laboratories, Abbott Park, IL, USA). The procedures were performed according to the manufacturers’ instructions.
Cell suspension preparation
Femurs and tibias were separated without accessory tissues. A syringe needle was inserted into the bone marrow cavity several times to flush all cells out using a 5-ml syringe filled with Iscove’s modified Dulbecco’s medium (IMDM) (GIBCO, Grand Island, NY, USA) supplemented with 10% foetal bovine serum (Siji Qing Biotech, Hangzhou, China). The single-cell suspension from bone marrow was harvested by density gradient centrifugation at 2383 g for 20 min.
The liver samples prepared for single-cell suspension were firstly sheared into 1 cm3 pieces, then digested in 0.25% trypsin/0.02% EDTA (GENOM Biotech, Hangzhou, China) and passed through a cell filter to remove clumps and undigested tissues. The mixtures were centrifuged at 200 g for 10 min and the supernatants were removed. Cell pellets were resuspended for use. More than 95% viability was achieved as assessed by trypan blue staining.
Flow cytometry analysis
The samples from bone marrow and liver were harvested. Labelling of cells was by standard staining procedures according to the manufacturer’s protocols with lineage-specific monoclonal antibodies: FITC Mouse Anti-Rat CD90(Thy-1) (BD Pharmingen, San Jose, CA, USA) and PE Mouse Anti-Rat CD45RC (BD Pharmingen), which were used at optimized concentration and titration. Staining procedures were performed on ice to prevent signal quenching. Flow cytometry analysis was performed on a FACS CantoTM II Flow Cytometer (BD Biosciences).
Colony-forming unit counting
Single-cell suspensions from bone marrow were prepared for use. The methylcellulose medium with recombinant cytokines for colony assays of rat cells (Methocult GF R3774; Stem Cell Technologies, Vancouver, BC, Canada) was applied to support optimal growth of rat colony-forming unit-granulocyte/macrophage (CFU-GM) progenitors. According to the manufacturers’ instructions, 1.5 × 10⁴ cells were seeded in each 35-mm dish and the amount of colonies were counted. Each assay was performed in triplicate.
Haematopoietic growth factor (HGF) assays
Haematopoietic growth factors including GM-CSF, SCF, IL-3, Epo and TPO were detected by the enzyme-linked immunosorbent assay (ELISA) kits in the sera obtained from peripheral blood. All procedures were carried out according to the manufacturers’ instructions. The ELISA kits of HGFs were purchased from KeyGEN Biotech, China.
Statistical analysis
All data were analysed using SPSS version 16.0 for Windows (SPSS Inc., Chicago, IL, USA). All values are presented as mean ± standard deviation (SD) values. Intergroup comparisons of continuous data were performed by independent-samples t-tests. All analyses were two-tailed, and differences were interpreted as statistically significant when P < 0.05.
Results
Successful establishment of an oestrogen-deficiency rat model by ovariectomy
In this study, an oestrogen-deficiency rat model was established by means of bilateral ovariectomy. To prove the success of ovariectomy and ensure the meaningfulness of the follow-up experiments, the concentration of oestrogen in each group was detected and compared at different time points. The levels of oestrogen in Sham group and OVX group at different time points after operations were shown in Figure 1. We found that the oestrogen level in the OVX group were decreased significantly in comparison with the Sham group at 12 weeks after ovariectomy (P < 0.05). At the 12th week, the oestrogen levels in OVX and Sham groups were 168.3 ± 13.4 pmol/l and 402.6 ± 20.5 pmol/l respectively.
Figure 1.
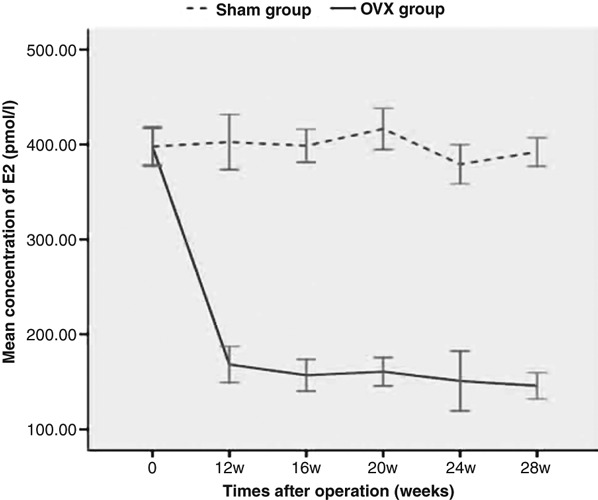
The levels of oestrogen in Sham and ovariectomy (OVX groups) at the 12th, 16th, 20th, 24th and 28th weeks after operation. The oestrogen level was detected via radioimmunoassay, and the data represented as mean (±SD) of five rats in each group. The oestrogen level in the OVX group was decreased significantly (P < 0.05) in comparison with the Sham group since 12 weeks after OVX.
Decrease in oestrogen inducing haematopoietic dysfunction
Bone marrow haematopoiesis
We counted and calculated the proportion of haematopoietic tissue and adipose tissue in bone marrow to evaluate the functional haematopoiesis. As shown in Table 1 in OVX group, a decrease in haematopoietic tissue and megakaryocytes and an increase in adipose tissue were observed in the 12th week compared with the Sham group (P < 0.05). However, at the 24th and 28th weeks after operations, the volumes of haematopoietic tissue and adipose tissue and the number of megakaryocytes varied so much that the differences between OVX and Sham groups were narrowed (P > 0.05) (Figure 2).
Table 1.
The changes in volumes of haematopoietic tissue and adipose tissue in bone marrow in Sham and ovariectomy (OVX groups)
| Volume of haematopoietic tissue (%) | Volume of adipose tissue (%) | Number of megakaryocytes (per mm2) | |||||||
|---|---|---|---|---|---|---|---|---|---|
| Time after operation (weeks) | Sham | OVX | P | Sham | OVX | P | Sham | OVX | P |
| 12 | 58.50 ± 1.29 | 47.60 ± 2.52 | 0.000 | 22.70 ± 1.50 | 33.60 ± 2.89 | 0.000 | 40.70 ± 3.58 | 32.80 ± 2.47 | 0.002 |
| 16 | 54.30 ± 1.41 | 34.20 ± 1.71 | 0.000 | 25.20 ± 1.71 | 50.50 ± 1.00 | 0.000 | 35.60 ± 4.52 | 24.20 ± 3.32 | 0.013 |
| 20 | 50.00 ± 3.89 | 25.70 ± 7.09 | 0.018 | 24.50 ± 2.11 | 66.20 ± 3.20 | 0.003 | 30.70 ± 2.56 | 15.80 ± 3.21 | 0.005 |
| 24 | 28.70 ± 4.21 | 23.50 ± 8.56 | 0.89 | 60.80 ± 9.32 | 67.40 ± 7.47 | 0.67 | 12.50 ± 5.45 | 10.70 ± 4.34 | 0.643 |
| 28 | 24.70 ± 6.88 | 22.60 ± 4.53 | 0.991 | 65.20 ± 9.91 | 70.40 ± 7.90 | 0.38 | 10.20 ± 4.20 | 8.30 ± 5.75 | 0.524 |
P < 0.05 is interpreted as statistical difference between the Sham and OVX groups.
Figure 2.
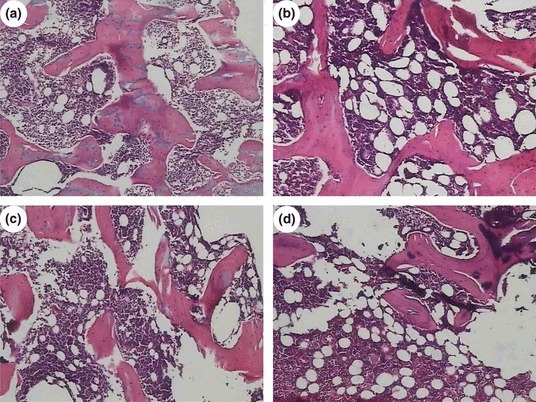
The changes in haematopoietic tissue and adipose tissue in Sham and ovariectomy (OVX groups) (H–E staining, 10 × 10). (a) and (c) correspond to the bone marrow sections of Sham groups at the 12th and 16th weeks; (b) and (d) correspond to the bone marrow sections of OVX groups at the 12th and 16th weeks. Compared with the Sham group, decrease in haematopoietic tissues and increase in adipose tissues were significantly different in the OVX group at the 12th and 16th weeks.
Extramedullary haematopoiesis in liver and spleen
The tissue sections of liver and spleen derived from the OVX and Sham groups at the 12th, 16th, 20th, 24th and 28th weeks after operations were chosen to assess EMH secondary to impaired bone marrow function. Our results showed that foci of EMH could be found in the liver and spleen from the 16th week in the OVX group. The density of foci increased in the 20th week. At the 24th and 28th weeks in the OVX groups, the number of foci of EMH did not increase and was maintained at the same level as at 20th week (data not shown). On the other hand, in Sham group, either single or no EMH foci were found (Figure 3).
Figure 3.
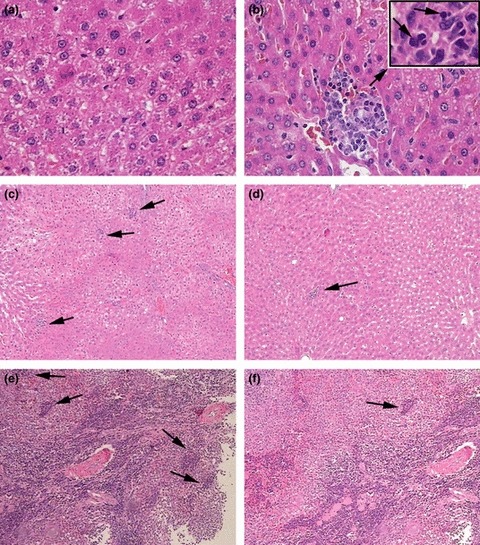
Extramedullary haematopoiesis (EMH) can be observed in liver in the ovariectomy (OVX group) (H–E staining). (a) representatives section from the liver of a 16th week Sham group rat shows normal hepatic tissues (10 × 40); (b) representative section of liver of a 16th week OVX group rat and shows a single focus of EMH, accompanied with the cellular swelling and fatty degeneration of hepatocytes (10 × 40). The insert shows the microstructure of the focus of EMH, which is composed of proerythroblasts, myeloblasts and megakaryoblasts (10 × 100); (c) representative section of the foci of EMH in the liver of the 20th week OVX group showing the increased density of foci of EMH compared with Sham group (10 × 10); (d) representative section of a focus of EMH in the liver of a 20th week Sham group (10 × 10); (e) representative section of the foci of EMH in the spleen from a 20th week OVX group showing the increased density of a foci of EMH compared with the Sham group (10 × 10); (f) representative focus of EMH in the spleen from a 20th week Sham group (10 × 10).
Peripheral blood
The effect of oestrogen-deficiency on the peripheral blood cell counts is shown in Table 2. From the 20th week in the OVX group, white blood cells (WBCs), haemoglobin (Hb) and platelets (PLTs) decreased to varying degrees. A significant decline in Hb or PLTs in the OVX group was found from the 24th week (P < 0.05), and WBCs declined at the 28th week in the OVX group compared with those in the Sham group (P < 0.05).
Table 2.
The changes in peripheral blood counts in Sham and ovariectomy (OVX groups)
| White blood cell (×103/μl) | Haemoglobin (g/dl) | Platelets (×103/μl) | |||||||
|---|---|---|---|---|---|---|---|---|---|
| Times after operation (weeks) | Sham | OVX | P | Sham | OVX | P | Sham | OVX | P |
| 12 | 6.86 ± 1.15 | 6.50 ± 0.64 | 0.558 | 15.76 ± 0.18 | 15.68 ± 0.90 | 0.855 | 1131.00 ± 59.45 | 1120.60 ± 84.08 | 0.827 |
| 16 | 6.32 ± 0.58 | 6.52 ± 0.87 | 0.681 | 15.34 ± 0.53 | 15.84 ± 0.59 | 0.199 | 1140.20 ± 69.97 | 1171.40 ± 96.69 | 0.681 |
| 20 | 5.98 ± 0.83 | 4.84 ± 1.88 | 0.251 | 15.96 ± 0.65 | 14.94 ± 0.80 | 0.059 | 1125.00 ± 112.81 | 984.40 ± 143.10 | 0.123 |
| 24 | 6.12 ± 0.38 | 4.78 ± 1.31 | 0.083 | 16.06 ± 0.70 | 13.68 ± 1.73 | 0.021 | 1118.80 ± 161.84 | 869.80 ± 74.15 | 0.022 |
| 28 | 6.30 ± 0.27 | 4.46 ± 1.34 | 0.036 | 15.94 ± 0.70 | 11.36 ± 1.82 | 0.003 | 1058.20 ± 139.42 | 691.8 ± 229.13 | 0.016 |
P < 0.05 is interpreted as statistical difference between the Sham and OVX groups.
Reduction in haematopoietic stem/progenitor cells caused by decrease in oestrogen
Flow cytometry
We explored whether the number of haematopoietic stem/progenitor cells was affected by OVX. We measured the percentage of HSCs based on immunophenotypes from bone marrow and liver and analysed comparatively the difference between the OVX and Sham groups at different time points by flow cytometry. The population positive for CD90+ but negative for CD45RC was identified as HSCs (Castagnola et al. 1982; McCarthy et al. 1987). The number of these CD90+ CD45RC−HSCs in bone marrow decreased slightly at the 12th and 16th weeks in the OVX groups (P > 0.05) and more clearly from the 20th week in the OVX group (P < 0.05). In contrast, the HSCs in liver increased significantly from the 20th week in the OVX group (P < 0.05), compared with the corresponding Sham group. The number of haematopoietic stem cells (HSCs) in bone marrow and liver, comparing the between Sham group and the OVX group at 16th and 20th weeks after operation is shown in Figure 4. In the OVX group, the number of HSCs in bone marrow decreased from 2.6% in the 16th week to 0.6% in the 20th week, while the number of HSCs increased in liver from 9.6% in the 16th week to 24.4% in the 20th week.
Figure 4.
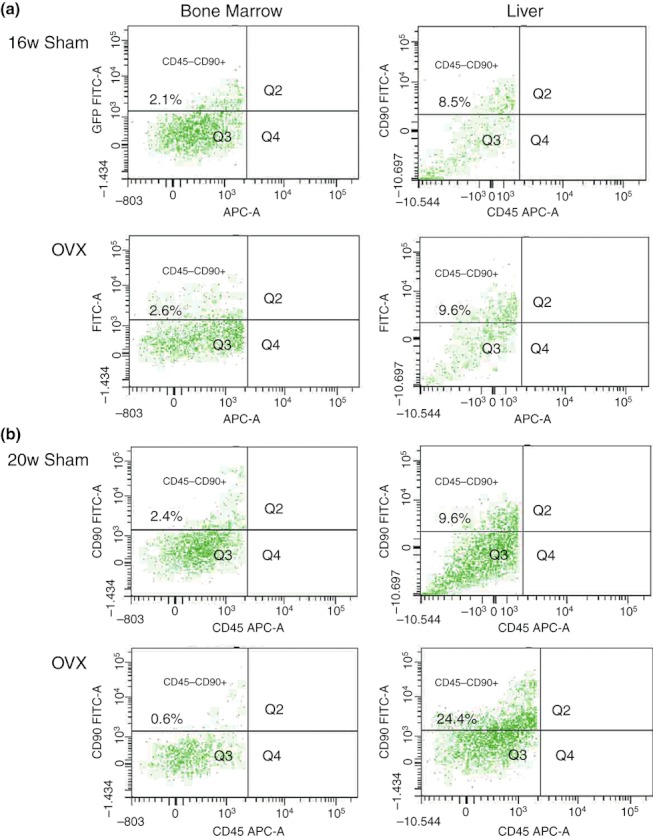
The comparison of the number of haematopoietic stem cells (HSC) in bone marrow and liver between Sham and ovariectomy (OVX groups) at 16th and 20th weeks after operations. The single-cell suspensions derived from bone marrow and liver were stained with two monoclonal antibodies (FITC Anti-Rat CD90 and PE Anti-Rat CD45RC) and analysed by FCM. In the 16th week OVX group, the number of HSCs in bone marrow and liver were not significantly different (P > 0.05) when compared with the 16th week Sham group. (b) In the 20th week OVX group, there was a significant decrease in HSCs in bone marrow compared to the 20th week Sham group (P < 0.05), and the significant increase in the number of liver HSCs in the 20th week OVX group (P < 0.05).
Colony-forming assay
In order to characterize the differentiation potential of bone marrow cells into granulocyte and macrophage components, a cluster of HSCs/HPCs was grown in the methylcellulose-based medium with a cocktail of cytokines. We found that the change in colony formation capacity was consistent with the presence of HSCs in bone marrow (Figure 5). When compared with the Sham group, the number of colonies in the OVX group decreased significantly from the 16th week (P < 0.05) and continued to decrease until the 28th week. The number of colonies was 383.0 ± 21.97/1.5 × 104 cells at the 16th week and 264.0 ± 55.39/1.5 × 104 cells at the 28th week.
Figure 5.
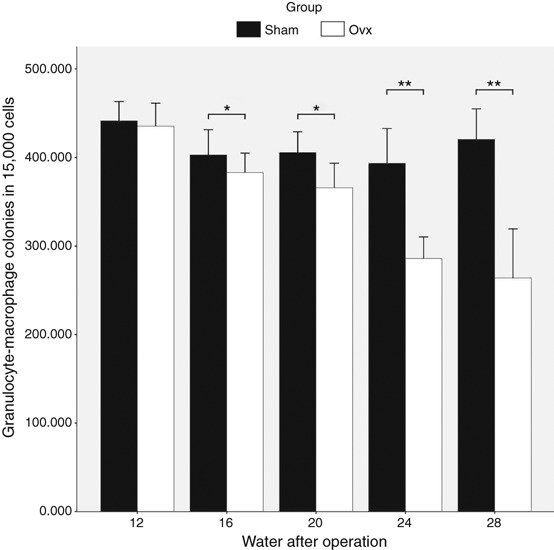
The changes in colony-forming units-granulocyte/macrophage (CFUs-GM) between Sham and ovariectomy (OVX groups) at the 12th, 16th, 20th, 24th and 28th weeks after operations. The black column corresponds to the number of CFUs-GM in Sham groups at the 12th, 16th, 20th, 24th and 28th weeks after surgeries, and the white column corresponds to the number of CFUs-GM in OVX groups at the same time points. The difference between OVX and Sham group at the 12th week were not significantly different. From the 16th week, the number of CFUs-GM decreased significantly in the OVX group compared to the corresponding Sham group. In the 24th and 28th weeks, the differences became more obvious than before.*P < 0.05, **P < 0.01.
Haematopoietic growth factors (HGFs) are involved in the development of haematopoiesis dysfunction caused by decrease in oestrogen
It is well known that HSCs and haematopoietic microenvironment act cooperatively in regulating haematopoiesis. In this paper, we want to know whether haematopoiesis dysfunction after ovariectomy is affected by HGFs. ELISA was used to detect the serum level of HGFs at the 12th, 16th, 20th, 24th and 28th weeks after surgery. The results are shown in Figure 6. We found that in the Sham group, the expression of GM-CSF, SCF and IL-3 showed no significant fluctuations at different time points (P > 0.05). In contrast, the levels of GM-CSF and SCF decreased gradually from the 12th to 28th week in the OVX group, and the differences between OVX and Sham groups were significant (P < 0.05) in GM-CSF from the 12th week and in SCF from the 16th week. The reduction in IL-3 concentration in the OVX group occurred later than that in GM-CSF and SCF, and the significant decrease (P < 0.05) was from the 24th week in the OVX group compared with the corresponding Sham group. The levels of both Epo and TPO increased significantly (P < 0.05) in the OVX group compared with the Sham group from the 24th week. At the 28th week especially, Epo and TPO increased to approximately twofold levels compared to the Sham group.
Figure 6.
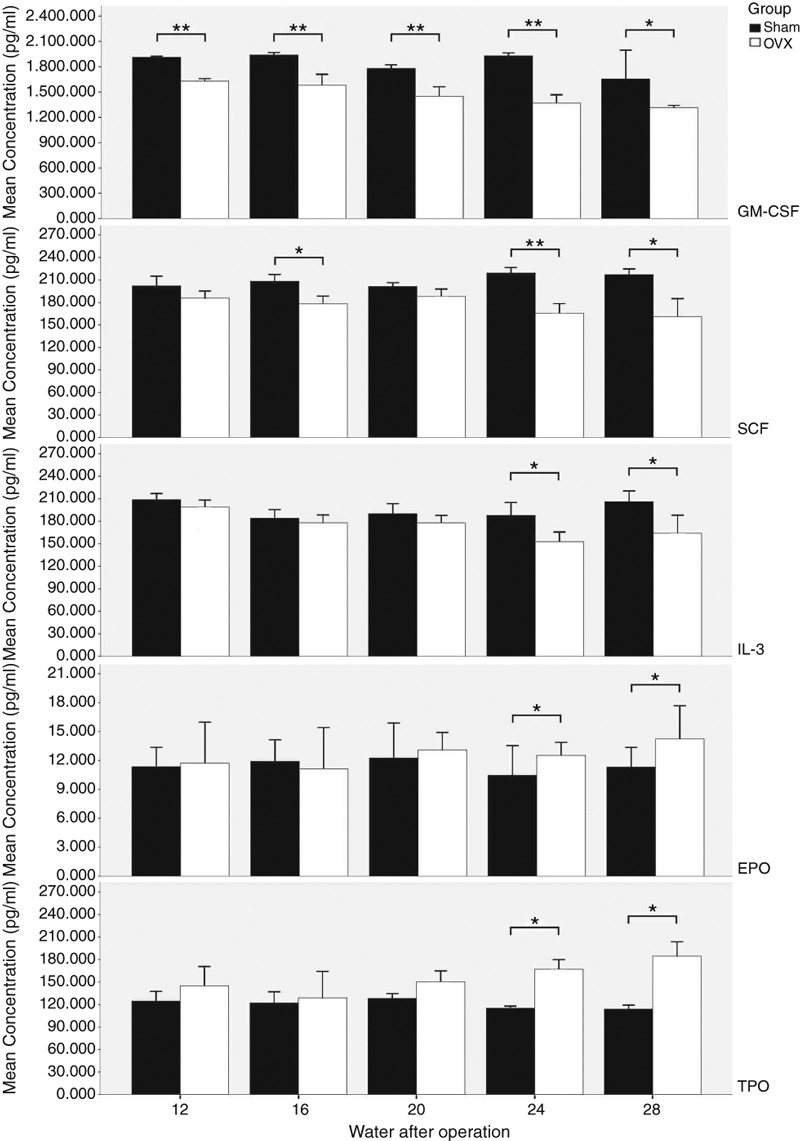
The changes in GM-CSF, SCF, IL-3, Epo and TPO between Sham and ovariectomy (OVX groups) at the 12th, 16th, 20th, 24th and 28th weeks after operation. The levels of haematopoietic growth factors (HGFs) were determined by ELISA, and the data represented as mean (±SD) of five rats in each group. The black column corresponds to the levels of HGFs in Sham groups at the 12th, 16th, 20th, 24th and 28th weeks after surgeries, and the white column corresponds to the levels of HGFs in OVX groups at the same time points. The differences between OVX and Sham groups was significant with respect to GM-CSF from the 12th week but was only evident at the 24th and 28th weeks for SCF. The reduction in IL-3 concentration in the OVX group occurred later than that in GM-CSF and SCF: the significant decrease was seen from the 24th week in the OVX group when compared with the 24th week in the Sham group. In contrast, the levels of Epo and TPO increased significantly compared with the Sham group from the 24th week in the OVX group. *P < 0.05, **P < 0.01.
Discussion
Previously, we have investigated bone mineral density (BMD) and haematopoiesis in a rat model of OVX at the 4th, 8th and 12th weeks after operations. We have revealed that oestrogen-deficiency had a notable impact on bone structure and induced haematopoiesis dysfunction from the 8th week (Zhu et al. 2009). This study is a follow-up beginning from the 12th week. We focused on the investigation of the effect of oestrogen-deficiency on haematopoiesis, especially on HSCs, and on the underlying mechanism.
After successful establishment of an oestrogen-deprived rat model, a decrease in haematopoietic tissues/megakaryocytes and an increase in adipose tissues in bone marrow were observed from the 12th week in the group. This was followed by EMH in liver and spleen from the 16th week and a decrease in peripheral blood cells from the 24th week. Thus there is no doubt that oestrogen-deficiency can induce haematopoiesis dysfunction, in accordance with our previous study (Zhu et al. 2009). This observation has common side effects (anaemia, thrombocytopenia as is seen when anti-oestrogens (such as tamoxifen and aromatase inhibitors) are used in the adjuvant treatment of breast cancer (US Food and Drug Administration 2004). Similarly, anaemia as a side effect of anti-androgen therapy (Strum et al. 1997) has been observed for many years and now androgen is usually used by patients with aplastic anaemia.
Surprisingly, at the 24th and 28th weeks, we found that differences in haematopoiesis dysfunction between the OVX and Sham groups became smaller. The phenomenon may be interpreted to mean that haematopoiesis function deteriorates with ageing in the Sham group, so that when female Sprague-Dawley rats are 10 months of age or older, haematopoietic function weakens so much that the differences from the decrease induced by oestrogen-deficiency are narrowed. This is in accordance with the previous study reported by Chen et al. (2003). The haematopoiesis dysfunction in the OVX group caused by oestrogen-deficiency was closely associated with decrease in osteoblasts in this study (data not shown), which led to long term osteoporosis (Zhu et al. 2009). Another interpretation could be that there is increased compensation in then OVX group in response to the haematopoiesis dysfunction with increase in some haematopoietic growth factors (such as Epo and TPO) and EMH in liver and spleen. Georgiou et al. (2010, 2012) suggested that the CXCL12/CXCR4 signalling pathway plays a key role in the compensatory process. However, the exact mechanism was not well defined and required further exploration.
It is well known that HSCs have two main functions: self-renewal and multilineage differentiation. In this study, we found a decrease in the number of HSCs in bone marrow and an increase in EMH which was significant from the 20th week in the OVX group as judged by flow cytometry. Phenotypic analysis, which is a key tool to ascertain the biology of stem cells, has been studied for many years, but there remains no consensus about the optimum method of isolation of HSCs from rats Thy-1.1(CD90) is reported to express on rat HSCs (Pu & Yang 2002) and has been used to purify the population. However, CD90 is also expressed on early myeloid, erythroid cells and immature lymphocytes, and other specific combined surface markers are still required in the analysis and purification of the HSCs, such as CD45 and CD3 (McCarthy et al. 1987; Zhan et al. 2006). In this study, we defined the group expressing CD90+CD45RC− as HSCs. It is considered that the reduction in HSCs was caused by either increased multilineage differentiation potential or time extension of self-renewal (Naveiras et al. 2009). Given the decrease in differentiation potential of HSCs from the 16th week in the OVX group by colony-forming assay, presumably the reduction in HSCs is related to slower cell cycle time. In addition, both the G-protein-coupled oestrogen receptor 1 (GPER) (Di et al. 2010) and the classical ERα (Ray et al. 2008) were found recently on the surface of HSCs. Thus we assumed that oestrogen-deficiency may affect the biological functions of HSCs directly through interacting with ER on HSCs, resulting in a decrease in HSCs and finally inducing haematopoiesis.
We also examined whether the levels of HGFs were changed after OVX. It has been reported that development of HSCs is maintained and regulated in cooperation with mesenchymal cells and various kinds of cytokines secreted from mesenchymal cells in bone marrow. Osteoblasts are one of the most important mesenchymal cells, associated intimately with haematopoiesis (Visnjic et al. 2004). Some cytokines from osteoblasts, such as interleukin-6 (IL-6), granulocyte-colony-stimulating factor (G-CSF), macrophage-colony stimulating factor (M-CSF), granulocyte/macrophage-colony-stimulating factor (GM-CSF) (Taichman & Emerson 1998; Taichman 2005) and matrix factors, could act cooperatively in regulating with HSCs. In this study, we found that GM-CSF secreted from osteoblasts decreased significantly from the 12th week in the OVX group, in accordance with the changes in osteoblasts in our study (data not shown). In addition, SCF and IL-3 in the OVX group were decreased significantly at the later time point. The reason for the reduction in selected HGFs at different time points is still obscure and needs to be explored further. Surprisingly we also found that the reduction in HSCs and HGFs appeared at the same time point or later than haematopoiesis dysfunction did from the 8th week (as found in our previous study, Zhu et al. 2009). It seemed that the decrease in HSCs and HGFs (including GM-CSF, SCF and IL-3) did not play the vital role at the early stage of haematopoiesis dysfunction. As time went by, multiple HGFs, synergistically in cooperation with HSCs, accelerated the progression of haematopoiesis failure, which is in accordance with previous studies (Nocka et al. 1990; McNiece et al. 1991).
We ackoweldge that there were several limitations to this study. Firstly, a third group of OVX rats with supplementary oestrogen was not incorporated into the initial design of the study. However, the OVX rat model is the most physiological oestrogen-deprived model and oestrogen-deficiency is the direct effect of OVX. Therefore it is reasonable to infer that all the following changes of HSCs and HGFs after OVX were caused by oestrogen-deficiency. Even so, it will be more meaningful if the group of OVX rats with supplementary oestrogen is included in further explorations. Secondly, we did not measure the level of GM-CSF at the time points before the 12th week. Thus whether GM-CSF decreased at an earlier time before haematopoiesis dysfunction occured, such as from the 8th week, was not clear. As a result we could not document fully the nature of the haematopoiesis dysfunction at the early stage and again further investigations are still required.
In conclusion, this study showed that when the oestrogenic level reduced after OVX, normal haematopoiesis in bone marrow decreased and EMH in liver occurred. Oestrogen-deficiency inducing haematopoiesis dysfunction may be mediated via decrease in HSCs and HGFs including changes in GM-CSF, SCF and IL-3 at the late stage. However, the mechanism for the precise role of ER on haematopoiesis dysfunction at the early stage requires further investigation.
Acknowledgments
This work was supported by a grant from Natural Science Foundation of China (NSFC) (30950004). And we appreciate Zhengkuan Xu and Bailai Hu for their professional technical assistance.
References
- Bord S, Vedi S, Beavan SR, et al. Megakaryocyte population in human bone marrow increases with estrogen treatment: a role in bone remodeling? Bone. 2000;27:397–401. doi: 10.1016/s8756-3282(00)00336-7. [DOI] [PubMed] [Google Scholar]
- Castagnola C, Visser J, Boersma W, et al. Purification of rat pluripotent hemopoietic stem cells. Stem Cells. 1982;1:250–260. [PubMed] [Google Scholar]
- Chen HQ, Yao R, Han J, et al. Effect of aging on the ability of growth and differentiation of rat bone marrow stromal cells. Acta Acad. Med. Sini. 2003;25:244–249. [PubMed] [Google Scholar]
- Dexter TM, Allen TD, Lajtha LG. Conditions controlling the proliferation of haemopoietic stem cells in vitro. J. Cell. Physiol. 1997;91:335–344. doi: 10.1002/jcp.1040910303. [DOI] [PubMed] [Google Scholar]
- Di VC, Bergante S, Balduini A, et al. The oestrogen receptor GPER is expressed in human hematopoietic stem cells but not in mature megakaryocytes. Br. J. Hematol. 2010;149:150–152. doi: 10.1111/j.1365-2141.2009.08028.x. [DOI] [PubMed] [Google Scholar]
- Edward H, Reisner JR. Tissue culture of bone marrow: II effect of steroid hormones on hematopoiesis in vitro. Blood. 1966;27:460–469. [PubMed] [Google Scholar]
- Georgiou KR, Foster BK, Xian CJ. Damage and recovery of the bone marrow microenvironment induced by cancer chemotherapy-potential regulatory role of chemokine CXCL12/receptor CXCR4 signaling. Curr. Mol. Med. 2010;10:440–453. doi: 10.2174/156652410791608243. [DOI] [PubMed] [Google Scholar]
- Georgiou KR, Scherer MA, King TJ, et al. Deregulation of the CXCL12/CXCR4 axis in methotrexate chemotherapy-induced damage and recovery of the bone marrow microenvironment. Int. J. Exp. Pathol. 2012;93:104–114. doi: 10.1111/j.1365-2613.2011.00800.x. [DOI] [PMC free article] [PubMed] [Google Scholar]
- Heinrich MC, Dooley DC, Freed AC, et al. Constitutive expression of steel factor gene by human stromal cells. Blood. 1993;82:771–773. [PubMed] [Google Scholar]
- Leary AG, Zeng HQ, Clark SC, et al. Growth factor requirements for survival in G0 and entry into the cell cycle of primitive human hemopoietic progenitors. Proc. Natl Acad. Sci. USA. 1992;89:4013–4017. doi: 10.1073/pnas.89.9.4013. [DOI] [PMC free article] [PubMed] [Google Scholar]
- Lemischka IR, Raulet DH, Mulligan RC. Developmental potential and dynamic behavior of hematopoietic stem cells. Cell. 1986;45:917–927. doi: 10.1016/0092-8674(86)90566-0. [DOI] [PubMed] [Google Scholar]
- McCarthy KF, Hale ML, Fehnel PL. Purification and analysis of rat hematopoietic stem cells by flow cytometry. Cytometry. 1987;8:296–305. doi: 10.1002/cyto.990080310. [DOI] [PubMed] [Google Scholar]
- McNiece IK, Langley KE, Zsebo KM. Recombinant human stem cell factor synergises with GM-CSF, G-CSF, IL-3 and Epo to stimulate human progenitor cells of the myeloid and erythroid lineages. Exp. Hematol. 1991;19:226–231. [PubMed] [Google Scholar]
- Naveiras O, Nardi V, Wenzel PL, et al. Bone-marrow adipocytes as negative regulators of the haematopoietic microenvironment. Nature. 2009;460:259–263. doi: 10.1038/nature08099. [DOI] [PMC free article] [PubMed] [Google Scholar]
- Nocka K, Buck J, Levi E, et al. Candidate ligand for the c-kit transmembrane kinase receptor: KL, a fibroblast derived growth factor stimulates mast cells and erythroid progenitors. EMBO J. 1990;9:3287–3294. doi: 10.1002/j.1460-2075.1990.tb07528.x. [DOI] [PMC free article] [PubMed] [Google Scholar]
- Ogawa M, Nishikawa S, Ikuta K, et al. B cell ontogeny in murine embryo studied by a culture system with the monolayer of a stromal cell clone, ST2: B cell progenitor develops first in the embryonal body rather than in the yolk sac. EMBO J. 1988;7:1337–1343. doi: 10.1002/j.1460-2075.1988.tb02949.x. [DOI] [PMC free article] [PubMed] [Google Scholar]
- Perry MJ, Samuels A, Bird D, et al. Effects of high-dose estrogen on murine hematopoietic bone marrow precede those on osteogenesis. Am. J. Physiol. Endocrinol. Metab. 2000;279:E1159–E1165. doi: 10.1152/ajpendo.2000.279.5.E1159. [DOI] [PubMed] [Google Scholar]
- Pu Q, Yang MR. Diagnostic Pathology of the Bone Marrow in Hematology. Beijing: Science Press; 2002. pp. 23–24. [Google Scholar]
- Ray R, Novotny NM, Crisostomo PR, et al. Sex steroids and stem cell function. Mol. Med. 2008;14:493–501. doi: 10.2119/2008-00004.Ray. [DOI] [PMC free article] [PubMed] [Google Scholar]
- Revell PA. Histomorphometry of bone. J. Clin. Pathol. 1983;36:1323–1331. doi: 10.1136/jcp.36.12.1323. [DOI] [PMC free article] [PubMed] [Google Scholar]
- Strum SB, McDermed JE, Scholz MC, et al. Anemia associated with androgen deprivation in patients with prostate cancer receiving combined hormone blockade. Br. J. Urol. 1997;79:933–941. doi: 10.1046/j.1464-410x.1997.00234.x. [DOI] [PubMed] [Google Scholar]
- Taichman RS. Blood and bone: two tissues whose fates are intertwined to create the hematopoietic stem-cell niche. Blood. 2005;105:2631–2639. doi: 10.1182/blood-2004-06-2480. [DOI] [PubMed] [Google Scholar]
- Taichman RS, Emerson SG. The role of osteoblasts in the hematopoietic microenvironment. Stem Cells. 1998;16:7–15. doi: 10.1002/stem.160007. [DOI] [PubMed] [Google Scholar]
- Tefferi A. Myelofibrosis with myeloid metaplasia. N. Engl. J. Med. 2000;342:1255–1265. doi: 10.1056/NEJM200004273421706. [DOI] [PubMed] [Google Scholar]
- US Food and Drug Administration. 2004. Professional information brochure: nolvadex tamoxifen citrate.
- Visnjic D, Kalajzic Z, Rowe DW, et al. Hematopoiesis is severely altered in mice with an induced osteoblast deficiency. Blood. 2004;103:3258–3264. doi: 10.1182/blood-2003-11-4011. [DOI] [PubMed] [Google Scholar]
- Zhan Y, Wang Y, Wei L, et al. Differentiation of hematopoietic stem cells into hepatocytes in liver fibrosis in rats. Transplant Proc. 2006;38:3082–3085. doi: 10.1016/j.transproceed.2006.08.132. [DOI] [PubMed] [Google Scholar]
- Zhang J, Niu C, Ye L, et al. Identification of the haematopoietic stem cell niche and control of the niche size. Nature. 2003;425:836–841. doi: 10.1038/nature02041. [DOI] [PubMed] [Google Scholar]
- Zhu L, Zhao XY, Lu XG. Ovariectomy-associated changes in bone mineral density and bone marrow hematopoiesis in rats. Int. J. Exp. Pathol. 2009;90:512–519. doi: 10.1111/j.1365-2613.2009.00661.x. [DOI] [PMC free article] [PubMed] [Google Scholar]


