Abstract
Fanconi Anemia is a cancer predisposition syndrome caused by defects in the repair of DNA interstrand crosslinks (ICL). Central to this pathway is the FANCI-FANCD2 (ID) complex, which is activated by DNA damage-induced phosphorylation and monoubiquitination. The 3.4 Å crystal structure of the ~300 kDa ID complex reveals that monoubiquitination and regulatory phosphorylation sites map to the I-D interface, suggesting that they occur on monomeric proteins or an opened-up complex, and that they may serve to stabilize I-D hetero-dimerization. The 7.8 Å electron density map of FANCI-DNA crystals and in vitro data show that each protein has binding sites for both single- and double-stranded DNA, suggesting that the ID complex recognizes DNA structures that result from the encounter of replication forks with an ICL.
Fanconi Anemia (FA) is a recessive cancer predisposition and developmental syndrome characterized by hypersensitivity to DNA inter-strand crosslinking (ICL) agents (1). The proteins mutated in the thirteen FA complementation groups act in a common pathway that results in DNA-repair by homologous recombination (HR) (2, 3). The FA pathway is activated when a DNA replication fork encounters an ICL, although FA proteins can be recruited to ICLs in the absence of DNA-replication as well (4-7).
Central to the FA pathway is the ID complex formed by the Fanconi Anemia D2 (FANCD2) and I (FANCI) proteins (8-11). Activation of the pathway culminates in FANCD2 and FANCI phosphorylation by ATR (1, 12), their mono-ubiquitination by the FA Core Complex ubiquitin ligase (1, 2, 13), and their localization to chromatin foci considered sites repair (9, 14, 15).
Replication-dependent ICL repair involves nucleolytic incisions flanking the ICL on one strand, translesion DNA synthesis across the unhooked ICL, removal of the ICL by additional incisions, and homologous recombination (3-5). Depletion of FANCD2 or mutation of its ubiquitination site arrests the process prior to the initial incision step (5). Among the nucleases implicated in these incisions, FAN1 and SLX4-SLX1 contain a ubiquitin-binding UBZ domain required for their association with mono-ubiquitinated ID (3, 16).
FANCI and FANCD2 consist of 1328 and 1451 amino acids, respectively. They share a ~150 amino acid region of homology around their mono-ubiquitination sites, and they have been proposed to be paralogs (17). Neither protein has any recognizable sequence motifs. They have been shown to bind to DNA, although the nature of their specific DNA substrates has not been clear (18-20).
Here, we present the 3.4 Å crystal structure of the 296 kDa ID complex, the 3.3 Å structure of individual FANCI, as well as the 7.8 Å crystallographic electron density map of a FANCI bound to a splayed Y DNA.
Overall structure of the ID complex
Crystals were grown using mouse FANCI (residues 1 to 1301) and FANCD2 (residues 33-1415) proteins that were truncated to remove regions highly susceptible to proteolysis (figs. S1 and S2).
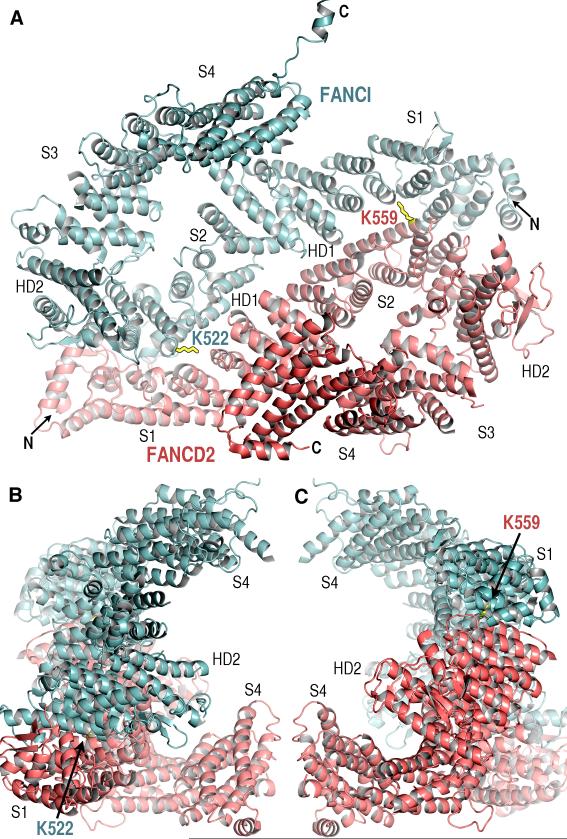
The structures of FANCI and FANCD2 have overall similar shapes and share extensive local similarity essentially throughout their length (Fig. 1A fig. S3). They consist predominantly of α helices, the majority of which are arranged in antiparallel pairs that form α–α superhelical structural segments, commonly referred to as α solenoids. Each structure has four distinct α solenoid segments that range in size from 156 to 310 residues (Solenoids 1 to 4; Fig. 1A and fig. S4). Two other, mostly helical segments intervene between Solenoids 1 and 2 (~80 residue helical domain HD1), and between Solenoids 2 and 3 (~240 residue HD2; fig. S4).
Fig. 1. The overall structure of the ID complex.
(A) View looking into the interior of the trough-like structure. The FANCI (cyan) and FANCD2 (pink) Solenoid (S1 to S4), HD1 and HD2 domains are labeled near to their center. The ubiquitination site lysine side chains are in black-outlined yellow. The FANCD2 K559 side chain is poorly ordered.
(B) View orthogonal to (A) looking down the left end. Only the segments closest to the viewer are labeled.
(C) View orthogonal to (A) looking down the right end.
FANCI and FANCD2 fold into a saxophone-like structure consisting of a long N-terminal neck (Solenoid 1 – HD1 – Solenoid 2), a U-shaped middle bow (HD2), and a bulbous C-terminal bell (Solenoid 3 – Solenoid 4; Fig. 1A and fig. S4). The ID complex has a trough-like shape with partially open ends (Fig. 1, B and C). The interior of the trough, which is ~105 Å long, ~70 Å wide and ~40 Å deep, is marked by multiple grooves that have a highly positive electrostatic potential. Two of these grooves contain electron density for double-stranded and single-stranded DNA in the 7.8 Å map of Y DNA-FANCI crystals (fig. S3C). The FANCD2 K559 and FANCI K522 mono-ubiquitination sites are within the ID interface, in solvent-accessible tunnels located at the bottom of the trough-like structure (Fig. 1A).
The individual Solenoid and HD segments of FANCI and FANCD2 share extensive structural homology, although the entire structures cannot be superimposed because of the cumulative effects of differences in individual segments and in inter-segment packing arrangements. The most homologous are the Solenoid 2 segments, which contain the monoubiquitination sites and the reported FANCI-FANCD2 sequence homology. They can be superimposed with a 1.7 Å Cα root mean square deviation (rmsd) for ~82 % of their residues (table S2 and fig. S4B). For the remainder of the segments, the fraction of the superimposing residues ranges from ~66 % for Solenoid 4 to ~60 % for HD2 (table S2). These local and global structural similarities indicate that FANCI and FANCD2 evolved from a common ancestor [fig. S4 and supporting online material (SOM) text].
Ten of the eleven FA-I and FA-D2 missense mutations (21) map to buried residues with clear structure-stabilizing roles, indicating that their pathogenic effects result from structural defects in the mutant proteins (fig. S5).
I-D interface
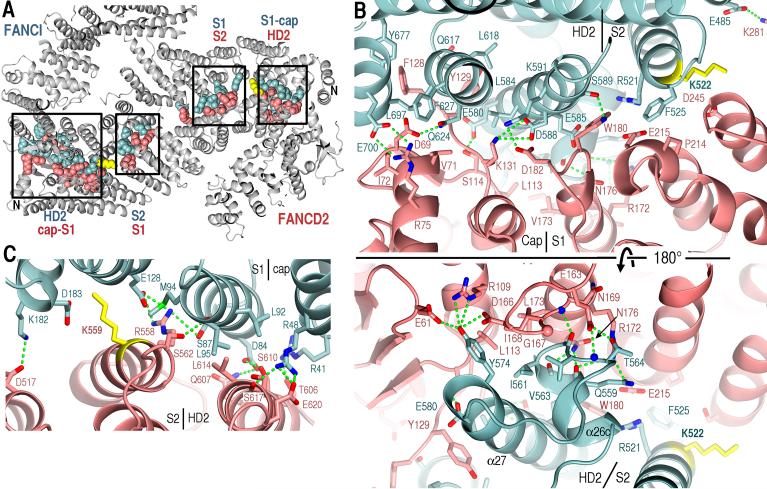
The two proteins interact along the long dimension of their saxophone-like shape (Solenoid 1 – HD1 – Solenoid 2 and part of HD2) in an anti-parallel, two-fold pseudo-symmetric manner (Fig. 2A and fig. S4A). The interface extends along a ~560 residue-region on each protein, and buries a total of ~7,100 Å2 of solvent accessible area. It is nearly continuous, except for gaps at the mono-ubiquitination site of each protein, and an additional gap at the center of pseudo-symmetry (between opposing HD1 segments).
Fig. 2. The I-D interface.
(A) Portion of the ID structure (gray) showing CPK representations of side chains within intermolecular-contact distance. Boxes indicate clusters of contacts with their respective segments labeled.
(B) Close-up view of the FANCD2 Cap-Solenoid 1 and FANCI Solenoid 2-HD2 segments showing side chains from (A). Green dotted lines indicate hetero-atoms within hydrogen bonding distance and geometry. Top-panel orientation is similar to (A), with bottom panel rotated ~180° about the horizontal axis. The approximate boundaries of segments are labeled.
(C) The reciprocal end of the interface formed by the FANCI Cap-Solenoid 1 and FANCD2 Solenoid 2-HD2 segments.
The interface has comparable numbers of hydrophobic (42 side chains) and polar (44 side chain and 11 backbone groups) residues within intermolecular-contact distance (Fig. 2A; contacts marked on fig. S1). Most of these contacts are clustered near the ends of the extended interface, although with substantial asymmetry in the density of contacts at the two ends. The end where the FANCD2 Solenoid 1 packs with the FANCI Solenoid 2-HD2 segments has 60 residues involved in contacts (Fig. 2B) compared to only 30 at the reciprocal end (Fig. 2C). This asymmetry results primarily from two structurally non-homologous regions. One of these involves the N-terminal portions of Solenoid 1 segments (thereafter “caps”; fig. S4), with the FANCD2 cap having 11 contact residues (Fig. 2B) compared to only 2 for the FANCI cap at the reciprocal end (Fig. 2C). The other involves a FANCI-specific HD2 insertion with 9 side chain and backbone groups that contact FANCD2 (α26b-α26c; Fig. 2B bottom). The asymmetry in these elements and their intermolecular contacts might have evolved to drive the duplicated ancestral protein to form heterodimers instead of homodimers.
The remaining intermolecular contacts are scattered in small groups throughout the porous middle portion of the interface, except around the ubiquitination site lysine residues, which make no contacts (Fig. 2A and fig. S6).
Mono-ubiquitination sites
Although the FANCI K522 and FANCD2 K559 side chains are embedded in the I-D interface (Fig. 1A), the absence of I-D contacts next to each results in two tunnels, one for each lysine, that allow free access to bulk solvent from either side of the trough wall. In the monomeric proteins, both lysine side chains are fully solvent exposed.
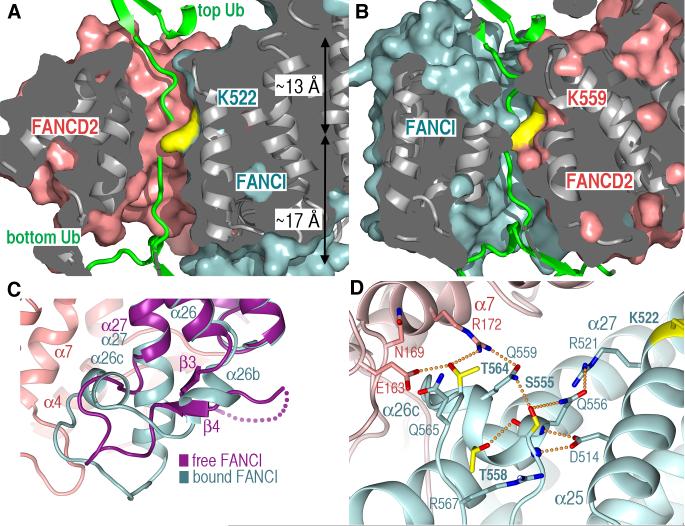
The solvent-accessible tunnels of both sites are wide enough (~7 to 9 Å) and short enough to accommodate the four amino acid ubiquitin tail, whose C-terminus would be covalently linked to the lysine epsilon amino group (Fig. 3, A and B; fig. S7). The ubiquitin tail is conformationally flexible (22), and this should aid in the tail navigating the tunnels, while the ubiquitin structural domain is positioned outside the interface. It is also possible, however, that ubiquitination induces a conformational change or a rearrangement of the complex that fully exposes the mono-ubiquitination sites.
Fig. 3. Mono-ubiquitination and phosphorylation sites of the ID complex.
(A) Surface representation of the solvent-accessible tunnel harboring the FANCI K522 ubiquitination site, looking from the interface center. The surface portion above the figure plane is clipped, and the surface interior is gray. The approximate distances from the lysine to the tunnel exits are indicated. Free ubiquitin structure (green) was manually docked with its tail approaching from either the “top” or “bottom” exits of the tunnel.
(B) Surface representation of the FANCD2 K559 tunnel. As in (A), two ubiquitin molecules were docked approaching from either tunnel exit.
(C) The FANCI Ser555, Thr564 and Thr566 phosphorylation sites map to an HD2 segment that undergoes a conformational change between free FANCI (purple) and FANCD2-bound FANCI (cyan). In free-FANCI, the three sites map to a disordered loop (dotted purple line). FANCD2 is in pink.
(D) The hydrogen bond network centered on the phosphorylation sites, also showing neighboring residues that may interact with the phosphorylated residues.
In principle, the tunnels can accommodate a ubiquitin residing either at the trough interior or exterior. The tunnel entrance at the trough interior (“top” entrance looking down the plane of Fig. 1A) is ~13 Å away from the lysine epsilon amino group. The entrance at the “bottom” is farther away at ~17 Å, although the relatively more open, funnel shape of this entrance could also accommodate part of the ubiquitin structural domain (Fig. 3, A and B; fig. S7 and SOM text).
Irrespective of where the ubiquitin is positioned, the dimensions of the tunnels and entrances suggest that the ubiquitin tail and structural domains may contact both their conjugated protein and its hetero-dimerization partner. As these interactions would be repeated in a reciprocal fashion, the structure raises the possibility that ubiquitination may contribute to the stability of the ID complex. In this respect, we note that the mouse ID complex has a short half-life, as it dissociates during gel filtration chromatography at concentrations of ≤1 μM (fig. S8).
Although the tunnels can readily accommodate the ubiquitin tail, they are too small for the active site of the ubiquitin-conjugating (E2) enzyme to access the lysine side chains. The structure thus suggests that ubiquitination either occurs on a cellular pool of monomeric FANCI and FANCD2, or it involves a process that opens up the I-D interface.
The sequestration of the lysine-ubiquitin isopeptide bond at the I-D interface would also protect it against de-ubiquitination by the FA-associated USP1 ubiquitin protease (23). Coupled to a possible role of ubiquitination stabilizing I-D association, this may explain why cells lacking either FANCI or FANCD2 exhibit loss or reduction of the ubiquitinated form of the paralog (9).
Phosphorylation sites
The DNA-damage dependent phosphorylation of FANCI has been suggested to act as a molecular switch that activates the pathway, as multiple alanine substitutions at putative phosphorylation sites impeded the mono-ubiquitination and chromatin association of both FANCI and FANCD2 (12). Three phosphorylation sites have the ATM/ATR kinase consensus and are also conserved in vertebrates (Ser555, Thr558, Thr564 in mouse FANCI; fig. S9).
These three sites map to the 37-amino acid FANCI-specific HD2 insertion at the I-D interface. This region undergoes a complete conformational change on FANCD2 binding. In free FANCI, it forms the β3-β4 sheet and part of it is disordered. In the ID complex it instead forms two new helices (α26b and α26c) and a 10-residue extension to α27, becoming ordered in its entirety (Fig. 3C). This changes entirely the structural context of the phosphorylation sites. In free FANCI, they map to the disordered segment where they can be readily phosphorylated. In the complex, they end up at the start, middle and immediately after the α26c helix. Their side chains are embedded in hydrogen bond networks that anchor α26c in the FANCI structure and also contact FANCD2 (Fig. 3D and Fig. 2B bottom panel). The structure suggests that their phosphorylation may augment the intramolecular hydrogen bond networks, stabilizing the FANCD2-bound conformation of this region, and may also result in new FANCD2 contacts (SOM text in fig. S9 legend). These two effects may cooperate to stabilize I-D association. The magnitude of this stabilization could, in principle, be substantial, as the FANCI α26b-α26c-α27 segment accounts for ~27 % of the total solvent accessible area buried on complex formation (Fig. 2, A and B).
The model of phosphorylation stabilizing I-D association, thereby protecting against deubiquitination, may explain why mutations in FANCI phosphorylation sites reduce levels of the ubiquitinated forms of both FANCI and FANCD2 (12).
Electron density map of the Y DNA-FANCI complex
FANCD2 and FANCI have been shown to bind to double-stranded DNA (dsDNA) with a minor preference for diverse branched DNA structures such as Holliday Junction (HJ), splayed Y, overhang and replication fork DNA (18-20). In co-crystallization experiments with a variety of branched DNA structures, we obtained diffraction-quality crystals of FANCI bound to a splayed Y DNA consisting of a 16-base pair (bp) dsDNA segment and two 20-nucleotide (nt) single-stranded DNA (ssDNA) arms. FANCI binds to this Y DNA with a dissociation constant (Kd) of 19 nM, which is ~10-fold tighter than its affinity for either 18-bp dsDNA or for 32-nt ssDNA (fig. S10).
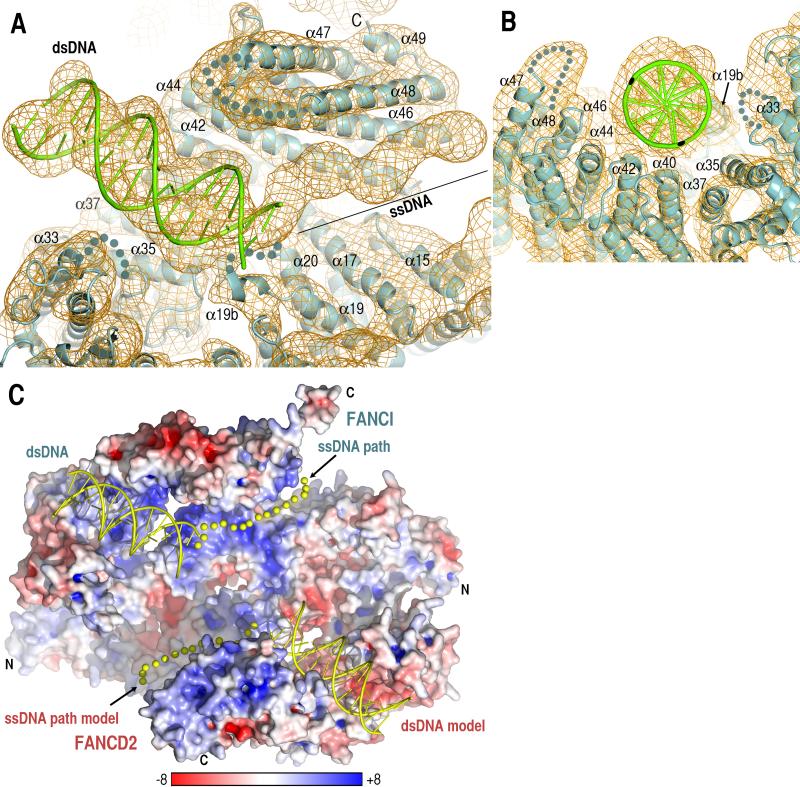
The Y DNA-FANCI crystals diffract to 7.8 Å resolution and contain three complexes in the asymmetric unit (table S1). The electron density map, calculated after three-fold non-crystallographic symmetry (ncs) averaging, shows unambiguously double-helical electron density, which extends throughout the length of a 16 bp ideal B-type DNA model positioned into the map manually (Fig. 4A and fig. S3C).
Fig. 4. Electron density map of the Y DNA-FANCI crystals reveals bound double- and single-stranded DNA segments.
(A) 7.8 Å resolution Fo(αcalc) map, contoured at 1.2 σ, calculated with molecular replacement phases that were improved by 3-fold ncs and multi-crystal averaging. The manually-positioned model of ideal B-type DNA is shown in cartoon representation (green), and the tubular density of ssDNA is marked by a black line. Orientation similar to Figure 1A.
(B) View looking down the blunt-end of the Y DNA.
(C) The electrostatic potential of the ID molecular surface showing the dsDNA cartoon and ssDNA path (yellow spheres) from the Y DNA-FANCI maps, as well as their models on FANCD2, positioned by superimposing Solenoids 3-4 of the two paralogs. The electrostatic potential was calculated with APBS (24) and illustrated (-8 to +8 kT) with Pymol (25).
At one end of the dsDNA, the map shows an undulating tube of continuous electron density that has shape consistent with one ssDNA segment. We do not observe clear electron density for the second ssDNA segment of the Y DNA, and we presume it is disordered. Consistent with FANCI having only one major site for binding to ssDNA, we find that its affinity for Y DNA is indistinguishable from its affinity for the corresponding 3’ overhang DNA (19 nM Kd for both; fig. S10).
The dsDNA lies in a groove that has a semicircular cross-section (Fig. 4B). The groove is built by Solenoid 4 forming one side, and by Solenoid 3 forming the bottom and part of the other side, the remainder of which is completed by portions of HD1, Solenoid 2 and HD2. There are 7 FANCI regions that are within contact distance to 13 bps of dsDNA (α19b, α20, α35, α40, α42, α44, α46; Fig. 4, A and B). Most of these regions involve the second helix of individual repeats, and in particular the N-termini of the helices and the loops immediately preceding them. In addition, 4 loops or helix ends that are disordered in the FANCI and ID structures become at least partially ordered near the DNA (α19b-α20, α33-α34, α36-α37 and α47-α48 loops; Fig. 4, A and B). The DNA-proximal FANCI segments are rich in conserved basic residues (marked on fig. S1A).
The transition from double- to single-stranded DNA electron density has α19b and α20 abutting the last base pair of the duplex (Fig. 4A). The ~55 Å path of the tubular ssDNA electron density could correspond to ~8 to 11 nucleotides, depending on the ssDNA backbone conformation and extent of base-base stacking. The electron density follows a groove formed by the long α44, α46 and α48 helices of Solenoid 4 on one side, and by the α15 and α17 helices of HD1 on the other (Fig. 4A and fig. S11). This groove is lined with residues containing basic, hydroxyl and amide groups, as well as two conserved phenylalanine residues that are fully solvent exposed (fig. S11).
The polarity of the ssDNA is not clear due to the limited resolution of the map and the proximity of multiple protein elements at the ss-dsDNA junction. In vitro, FANCI exhibits only a minor preference for 3’ overhang (19 nM Kd) over 5’ overhang DNA (40 nM Kd; fig. S10).
Implications for the DNA-binding activity of the ID complex
The overall shapes and highly positive electrostatic potential of the dsDNA/ssDNA binding grooves of FANCI are conserved in FANCD2 (Fig. 4C; fig S12 and SOM text). Consistent with this, FANCD2 binds to dsDNA and ssDNA with affinities comparable to those of FANCI (fig. S10). Taken together, our data suggest that the ID complex has two sets of ds/ssDNA binding sites arranged in a pseudo-2-fold symmetric manner (Fig. 4C and fig. S12).
This raises the possibility that the ID complex binds to two ds/ssDNA structures crosslinked by an ICL. The pausing of a replication fork at an ICL has been shown to initially generate a splayed Y DNA structure, with the subsequent advancement of leading strand synthesis to the -1 position of the ICL generating a crosslinked 5’ flap structure (4, 5). If two forks converge onto the ICL from opposite directions, this would result in an ICL flanked either by two 5’ flaps, or one Y and one 5’ flap. Both of these would be compatible with the pseudo-2-fold symmetric arrangement of ds/ssDNA-binding sites in the ID complex (Fig. 4C), with the ICL residing near the center of pseudo-symmetry of the complex. It is also possible that both single-fork and double-fork events occur in the cell, with the ID complex evolving a certain level of promiscuity in order to recognize an array of single- and double-Y and 5’ flap DNA structures.
Our data implicate the ID complex in recognizing DNA structures that result from the encounter of replication forks with an ICL. The complex may function in stabilizing and protecting these DNA structures, and also in providing specificity for the initial incisions around the ICL by directing the FA-associated nuclease to these sites.
Supplementary Material
Acknowledgments
We thank David King for mass spectroscopy analysis and the staff of the APS NE-CAT and NSLS X29 beamlines for help with data collection. This work was supported by the NIH and the Howard Hughes Medical Institute. Coordinates and structure factors have been deposited with the PDB (accession codes 3S51 for FANCI, 3S4W for FANCI FANCD2 and 3S4Z for Y DNA-FANCI).
References and Notes
- 1.Moldovan GL, D'Andrea AD. Annu Rev Genet. 2009;43:223. doi: 10.1146/annurev-genet-102108-134222. [DOI] [PMC free article] [PubMed] [Google Scholar]
- 2.Wang W. Nat Rev Genet. 2007 Oct;8:735. doi: 10.1038/nrg2159. [DOI] [PubMed] [Google Scholar]
- 3.Kee Y, D'Andrea AD. Genes Dev. 2010 Aug 15;24:1680. doi: 10.1101/gad.1955310. [DOI] [PMC free article] [PubMed] [Google Scholar]
- 4.Raschle M, et al. Cell. 2008 Sep 19;134:969. doi: 10.1016/j.cell.2008.08.030. [DOI] [PMC free article] [PubMed] [Google Scholar]
- 5.Knipscheer P, et al. Science. 2009 Dec 18;326:1698. doi: 10.1126/science.1182372. [DOI] [PMC free article] [PubMed] [Google Scholar]
- 6.Shen X, et al. Mol Cell. 2009 Sep 11;35:716. doi: 10.1016/j.molcel.2009.06.034. [DOI] [PMC free article] [PubMed] [Google Scholar]
- 7.Ben-Yehoyada M, et al. Mol Cell. 2009 Sep 11;35:704. doi: 10.1016/j.molcel.2009.08.014. [DOI] [PMC free article] [PubMed] [Google Scholar]
- 8.Timmers C, et al. Mol Cell. 2001 Feb;7:241. doi: 10.1016/s1097-2765(01)00172-1. [DOI] [PubMed] [Google Scholar]
- 9.Smogorzewska A, et al. Cell. 2007 Apr 20;129:289. doi: 10.1016/j.cell.2007.03.009. [DOI] [PMC free article] [PubMed] [Google Scholar]
- 10.Sims AE, et al. Nat Struct Mol Biol. 2007 Jun;14:564. doi: 10.1038/nsmb1252. [DOI] [PubMed] [Google Scholar]
- 11.Dorsman JC, et al. Cell Oncol. 2007;29:211. doi: 10.1155/2007/151968. [DOI] [PMC free article] [PubMed] [Google Scholar]
- 12.Ishiai M, et al. Nat Struct Mol Biol. 2008 Nov;15:1138. doi: 10.1038/nsmb.1504. [DOI] [PMC free article] [PubMed] [Google Scholar]
- 13.Meetei AR, et al. Nat Genet. 2003 Oct;35:165. doi: 10.1038/ng1241. [DOI] [PubMed] [Google Scholar]
- 14.Garcia-Higuera I, et al. Mol Cell. 2001 Feb;7:249. doi: 10.1016/s1097-2765(01)00173-3. [DOI] [PubMed] [Google Scholar]
- 15.Shimamura A, et al. Blood. 2002 Dec 15;100:4649. doi: 10.1182/blood-2002-05-1399. [DOI] [PubMed] [Google Scholar]
- 16.Yamamoto KN, et al. Proc Natl Acad Sci U S A. 2011 Apr 19;108:6492. [Google Scholar]
- 17.Smogorzewska A, et al. Mol Cell. 2010 Jul 9;39:36. doi: 10.1016/j.molcel.2010.06.023. [DOI] [PMC free article] [PubMed] [Google Scholar]
- 18.Park WH, et al. J Biol Chem. 2005 Jun 24;280:23593. doi: 10.1074/jbc.M503730200. [DOI] [PubMed] [Google Scholar]
- 19.Longerich S, San Filippo J, Liu D, Sung P. J Biol Chem. 2009 Aug 28;284:23182. doi: 10.1074/jbc.C109.038075. [DOI] [PMC free article] [PubMed] [Google Scholar]
- 20.Yuan F, El Hokayem J, Zhou W, Zhang Y. J Biol Chem. 2009 Sep 4;284:24443. doi: 10.1074/jbc.M109.016006. [DOI] [PMC free article] [PubMed] [Google Scholar]
- 21.Fanconi Anemia Mutation Database. http://www.rockefeller.edu/fanconi/mutate/
- 22.Winget JM, Mayor T. Mol Cell. 2010 Jun 11;38:627. doi: 10.1016/j.molcel.2010.05.003. [DOI] [PubMed] [Google Scholar]
- 23.Cohn MA, et al. Mol Cell. 2007 Dec 14;28:786. doi: 10.1016/j.molcel.2007.09.031. [DOI] [PubMed] [Google Scholar]
- 24.Baker NA, Sept D, Joseph S, Holst MJ, McCammon JA. Proc Natl Acad Sci U S A. 2001 Aug 28;98:10037. doi: 10.1073/pnas.181342398. [DOI] [PMC free article] [PubMed] [Google Scholar]
- 25.Schrodinger LLC. 2010.
Associated Data
This section collects any data citations, data availability statements, or supplementary materials included in this article.


