

Abstract
BACKGROUND
Brain damage markers released in cerebrospinal fluid (CSF) and blood may provide valuable information about diagnosis and outcome prediction after traumatic brain injury (TBI).
OBJECTIVE
This study examined concentrations of a novel brain injury biomarker Ubiquitin C-terminal Hydrolase-L1 (UCH-L1) in CSF and serum of severe TBI patients and their association with clinical characteristics and outcome.
METHODS
This case-control study enrolled ninety-five severe TBI subjects (Glasgow Coma Score [GCS] ≤8). Using sensitive UCH-L1 sandwich ELISA, we studied the temporal profile of CSF and serum UCH-L1 levels over 7 days for severe TBI patients.
RESULTS
Comparison of serum and CSF levels of UCH-L1 in TBI patients versus controls show robust and significant elevation of UCH-L1 in acute phase and over the 7 day study period. Serum and CSF UCH-L1 Receiver Operation Characteristics (ROC) curves further confirm strong specificity and selectivity for diagnosing severe TBI versus controls, with area under the curve (AUC) values in serum and CSF statistically significant at all time points up to 24 h (p < .001). The first 12 hour levels of both serum and CSF UCH-L1 in patients GCS 3–5 were also significantly higher than those with GCS 6–8. Furthermore, UCH-L1 levels in CSF and serum appear to distinguish severe TBI survivors versus non-survivors within the study, with non-survivors having significantly higher and more persistent levels of serum and CSF UCH-L1. Cumulative serum UCH-L1 level >5.22 ng/ml predicted death (odds ratio 4.8).
CONCLUSION
Taken together, serum levels of UCH-L1 appear to have potential clinical utility in diagnosing TBI, including correlating to injury severity and survival outcome.
Keywords: Biomarkers, Critical Care, Diagnosis, Head Injury, Outcome, Proteomics, UCH-L1
INTRODUCTION
The U.S. Centers for Disease Control and Prevention has reported that about 52,000 people die as a result of severe traumatic brain injury (TBI) and 5.3M Americans are permanently impaired.1 About half of the estimated 1.9M Americans who experience TBI each year incur at least short-term disability.2 In addition, military experiences in Iraq and Afghanistan have highlighted the significant contribution of TBI to combat casualties and difficulties associated with accurate diagnosis in the field.3 Unlike other organ-based injuries or diseases where rapid diagnosis employing biomarkers has proven invaluable, no such rapid definitive diagnostic tests have been developed for TBI. Currently, TBI diagnosis depends on a variety of measures including neurological examination and neuroimaging such as CT scanning and MRI, all of which have some limitations. CT scanning has low sensitivity to diffuse brain damage and the availability and utility of MRI is limited in acute settings.4
Beyond the issue of diagnosis, brain trauma presents other crucial issues including the stratification of patients by injury severity,5 the identification of pathophysiologic mechanisms of TBI that allow the classification of patients most likely to benefit from the treatment, and ultimately, the prognosis and risk of death of individual patients.
As a result, neurobiochemical markers have attracted increased attention during the last decade. By analogy with biological markers of acute myocardial infarction, several reviews have highlighted the need for biomarkers that would provide early, quantitative information about the extent of brain tissue damage.6,7
Previously studied markers in large cohorts include neuron-specific enolase (NSE),8,9 glial protein S-100 beta (β),10–12 and myelin basic protein (MBP).8,13 S100β, a calcium-binding protein mainly expressed in astrocytes and released from dying cells, appears to be a promising marker of TBI.14 However, S100β is also present in oligodendrocytes, microglia, neurons, and extracerebral tissue and is actively secreted independent of cell death.14. NSE is present in the cytoplasm of neurons and a rapid appearance in serum after head injury has been reported.15. MBP, a proteolipid specific to the myelin sheet of central myelin, has shown to be released following brain damage or demyelinating diseases.13 Although there are a number of studies suggesting that these potential biomarkers correlate with severity of injury, conflicting results make it difficult to determine their utility for the routine assessment of TBI patients.16,17
Glial fibrillary acidic protein (GFAP) and aII-spectrin breakdown products (SBDPs) have also been reported as glial and axonal markers of TBI, respectively.18–21 Recently, as a result of increased sophistication of proteomics and other discovery techniques, investigators have described ubiquitin C-terminal hydrolase-L1 (UCH-L1), neuron specific and concentrated in neuronal soma,22 as novel potential markers for brain injury. UCH-L1 is involved in either the addition or removal of ubiquitin from proteins that are destined for metabolism (via the ATP-dependent proteosome pathway),23 and its variants have been associated with familial Parkinson’s disease.24 In primary cultures proteosome inhibitors have been shown to cause arrest neurite outgrowth and “dying-back” degeneration.25,26 In focal cerebral ischemia and spinal cord injury, increased protein aggregates and decreased proteosome activity have been observed, respectively.27,28 These data suggest that UCH-L1 plays an important role in the removal of excessive, oxidized or misfolded proteins during both normal and neuropathological conditions, such as neurodegenerative disorders.29
Because of the important function of UCH-L1 and its high brain specificity, we hypothesized a potential utility in the assessment of TBI patients.
This study examined whether UCH-L1 was significantly elevated in serum from severe TBI patients compared to uninjured controls. Temporal profiles of UCH-L1 were compared in serum and CSF from the same severe TBI patient cohort. We also examined relationships between elevations in serum levels of UCH-L1 and mortality following TBI.
METHODS
Design and Population
This prospective case control study enrolled patients who presented to the University of Florida Trauma System (Shands Hospital in Gainesville and Jacksonville, Florida) and the University of Pécs (Pécs, Hungary), over a 12 month period. Inclusion criteria of TBI patients were as follows: a Glasgow coma scale (GCS) score of ≤8, and a ventricular intracranial pressure (ICP) monitoring as part of their routine clinical care. TBI patients had minor concomitant injury of the thorax and/or abdomen and/or extremities. Multiple trauma patients were excluded [Injury Severity Score (ISS) greater than 15]. Serum and cerebrospinal fluid (CSF) samples from severe TBI subjects were collected every 6 hours up to a maximum of 7 days following TBI. CSF samples from severe TBI subjects were directly collected from ventriculostomy catheters, which were placed as a standard of care for severe TBI patients at these institutions. Since the duration of time between injury time and admission, as well as time to ventriculostomy placement varies, sampling for CSF and blood UCH-L1 measurement was not always possible at exactly the same number of hours after TBI, for the first 24 hours. Therefore, we established 6 hr time intervals for sampling of UCH-L1 and documented the time interval of measurement accordingly. Samples were immediately centrifuged at 4000 rpm and frozen and stored at −70°C until the time of analysis. CSF control samples were obtained from either hydrocephalic patients who had VP shunts placed and who had CSF samples taken intraoperatively or unruptured aneursym patients who also had CSF samples taken intraoperatively. Control patients were healthy subjects who had a normal mental status at the time of enrollment and had no evidence of acute brain injury or hemodynamic instability. This study was approved by the respective Institutional Review Boards of the University of Florida and Pecs University. Informed consent was obtained from all patients and/or legal authorized representatives from each site.
Measurement of UCH-L1 Biomarker
Samples were measured using a standard UCH-L1 sandwich enzyme-linked immunosorbent assay (ELISA) protocol as described below. For UCH-L1 sandwich ELISA (swELISA), 96-well plates were coated with 100 μL/well capture antibody (500 ng/well purified mouse monoclonal anti-UCHL1, made in-house) in 0.1 M sodium bicarbonate, pH 9.2. Plates were then incubated overnight at 4°C, emptied and 300 μL/well blocking buffer (Startingblock T20-TBS) was added and incubated for 30 min at ambient temperature with gentle shaking. This was followed by either the addition of the antigen standard (recombinant UCH-L1) for standard curve (0.05 – 50 ng/well) or samples (5 μL CSF; 20 μL serum) in sample diluent (total volume 100 μL/well). The plate was incubated for 2 hours at room temperature, then washed with automatic plate washer (5 × 300 μL/well with wash buffer, TBST). Detection rabbit polyclonal anti-UCH-L1-HRP conjugated (made in-house, 50 μg/mL) in blocking buffer was then added to wells at 100 μL/well and incubated for 1.5 h at room temperature, followed by washing. Lastly, the wells were developed with 100 ul/well chemiluminescent substrate solution (SuperSignal ELISA Femto, Company: Pierce, Cat#: 37075, Rockford, IL, USA) with incubation times of 1 minute. The signal was read by a 96-well chemiluminescence microplate reader (GloRunner DXL Luminometer, Turner BioSystems Inc., Sunnyvale, CA, USA). To assess performance, averaged results from more than 30 independent experiments (each with duplicate samples) performed over a period of 6 months. The raw dose response curves were used to calculate sample recovery (calculated calibrator concentration/input concentration) using Sigma Plot v11 (4 parameter logistic function for curve fitting). The precision is defined as CV of sample recovery.
Acute Injury and Outcome Measures
We compared levels of UCH-L1 in control and TBI patients at each of the specified time points. Acute injury magnitude was functionally assessed by the Glasgow Coma Scale on admission. The 24 hr post injury GCS score was used as an end point because many patients have their GCS confounded by other factors including the presence of alcohol, sedative drugs and neuromuscular blockade agents in the first several hrs after injury. As a result, the GCS is more limited in the first hrs after injury and improves with repeated evaluations.30 Postacute outcome was assessed by the Glasgow Outcome Score (GOS) at 3 months after injury.31 Assessment GOS was obtained by direct patient contact or via telephone interview with the patient and/or a family member. For statistical analyses, outcome considered was mortality.
Data Analysis
For statistical analysis, biomarker levels were treated as continuous data, measured in ng/mL and expressed as mean ± SEM. Data normality was assessed using the Kolmogorov–Smirnov test. The Mann-Whitney U test was used to test differences in biomarker concentration between 2 groups. A receiver operating characteristic (ROC) curve was constructed to explore the diagnostic ability of the biomarker to distinguish between uninjured controls and TBI patients at different time points post-injury. Univariate logistic regression analysis was used to evaluate the prognostic ability of CSF and serum levels of UCH-L1, separately, to predict the probability of death (GOS=1) 3 months after injury. C-statistic indicates an overall measure of classification accuracy (representing the overall proportion of individuals correctly classified), with the value of 1.0 representing perfect accuracy. For analysis of the data, UCH-L1 concentrations were divided in thirtiles, with the lowest thirtile serving as the reference group. Statistical significance was set at 0.05. All analyses were performed using the statistical software package SigmaPlot version 11.0 (Systat Software, Inc.).
RESULTS
UCH-L1 assay performance and clinical study design
This study enrolled 95 severe TBI subjects. Patient characteristics in injury severity are shown in Table 1. There were 167 normal control subjects who provided blood samples (Table 1). CSF samples were also taken from 24 control patients who had CSF taken intraoperatively as a part of routine clinical care for mainly hydrocephalus patients (Table 1).
Table 1.
Summary of Demographic and Clinical Data for Severe Traumatic Brain Injury cases and Controls included in this study
| sTBI (n=95) | Controls (Serum) (n=167) | CSF Control (n=24) | |
|---|---|---|---|
| Age, years Mean (SD) | 35± 19 | 36.91 ± 14.06 | 57.12 ± 16.63 |
| Min-Max | 18–82 | 18–74 | 23–83 |
| F/M, n (%) | 26/69 (27/73) | 72/95 (43/57) | 7/17(29/71) |
|
| |||
| Ethnicity (%) | |||
| Not Hispanic or Latino | 90 | 146† | 24 |
| Hispanic or Latino | 10 | 13 | - |
|
| |||
| Injury GCS (Range) | 5 (3–13) | NA | NA |
| ED GCS (Range) | 4 (3–8) | NA | NA |
|
| |||
| Mechanism of injury (%) | NA | NA | |
| Motor vehicle | 61 | ||
| Motor cycle | 9 | ||
| Fall | 9 | ||
| Assault | 8 | ||
| Other | 13 | ||
Undetermined in 8 controls.
NA, not applicable.
Highly sensitive UCH-L1 sandwich ELISA has been constructed and optimized for both CSF and serum detection for the purpose of this study. Antigen calibrator is recombinant Hist-tag human UCH-L1 produced in E coli and affinity purified using Ni+ column. These preparations of UCH-L1 are routinely over 95% pure by SDS-gel electrophoresis analysis (Fig. 1A). The sandwich ELISA utilizes two antibodies specifically raised against human UCH-L1. Capture antibody is a mouse monoclonal antibody (IgM class) raised against recombinant His-tag UCH-L1 mentioned above. Detection antibody is a rabbit polyclonal antibody (IgG class) raised against a 50 amino acid epitope derived from a region of human UCH-L1. Both antibodies were tested against recombinant His-tag UCH-L1 protein by immunoblotting as well as human brain and other tissue lysate and shown to be specifically detecting single band of UCH-L1 target protein with high intensity. Recombinant UCH-L1 has slightly higher molecular weight than native ICH-L1 porein (24 kDa) due to the presence of N-terminal His-tag and leader sequence (Fig. 1A). Results in Figure 1A also show that UCH-L1 is highly enriched in human brain tissue and almost exclusively expressed in brain with a very minor presence in testis and large intestine, making it an excellent brain injury marker candidate. The configured and optimized UCH-L1 sandwich ELISA has a linear dynamic range of at least 4 order of magnitude and detection limit of 0.01 ng/mL in CSF, and it is liner for at least 3 order of magnitude and a detection limit of at least 0.3 ng/mL for serum (Fig. 1). Assay in serum gave lower chemiluminescence signals than CSF, given the same analyte (UCH-1) concentrations, as it is known that serum has strong matrix signal suppression effects. The precision (% CV) over the linear range is < 10% and 15 % over the detection range for CSF and serum analysis, respectively.
Fig. 1. Characterization of UCH-L1 antigen calibrator, capture and detection antibodies and sandwich ELISA performance.

(A) Recombinant His-tag human UCH-L1 (20 μg) from E. coli was analyzed by SDS-electrophoresis gel stained with Coomassie blue to show proper molecular wright and purity. (B) Capture (Mouse IgM 2018) and detection (Rabbit IgG #21687) antibodies were charactrerized by their specific recognition of recombinant human UCH-L1 (100 ng; see above) and native human UCH-L1 target in human brain vs. other organ lysates (20 μg). (C) Optimized sandwich ELISA was subjected to performance analysis in both CSF and serum matrix. Shown were averages of accumulative data from 17 multi-day standard curve analysis. Background (no antigen) chemiluiminescent values + 3 x SD were also shown on Y-axis and as horizontal line. The horizontal line represents the average background chemiluminescence (no antigen) + 3 x standard deviation = 2,000 chemiluminescence units. MWM = molecular weight marker lane.
UCH-L1 as a serum marker in diagnosing severe TBI
TBI patients had significantly elevated serum and CSF levels of UCH-L1 after injury compared to uninjured control at all time intervals after injury (Fig. 2). As expected, CSF values of UCH-L1 were substantially higher and more sustained than levels of UCH-L1 in serum (Fig. 2). There was a significant overall correlation between median concentrations of UCH-L1 in CSF and serum (rs = 0.59, p <.001). Both CSF and serum UCH-L1 levels are highly detectable over the 7 day time course. The temporal CSF and serum profiles both show that the earliest time points have the highest signals, followed by a rapid decay. However, some delayed increases were also observed, suggesting possible secondary insult or injury (Fig. 2).
Fig. 2. Temporal profile of CSF and serum UCH-L1 levels over 7 days for severe TBI patients in comparison to control subjects.

Data shown are measured by ELISA. Mean ± SEM concentrations are shown. For Control subjects – only single time point samples used.
UCH-L1 levels were highly readily detectible at the earliest time point measured in serum (i.e. within 6 hrs of injury) at 5.32 ng/mL (± 1.10); and within the first 24 h (at 2.09 ng/mL (± 0.43)). Both are significantly above normal control serum levels (Table 2). CSF UCH-L1 levels were again highly detectible within 6 hrs of injury (at 171.1 ng/mL (± 27.94); and within the first 24 h (at 110.60( ng/mL (±14.53). Both are significantly above normal control serum levels (7.69 ng/mL (± 2.78) (Table 2). Overall, mean CSF level of UCH-L1 in TBI patients was 66.21 ng/mL (± 9.72) compared with 7.6 ng/mL (± 2.78) in CSF controls (Table 2).
Table 2. CSF and serum UCH-L1 levels in patients in the first 6 hrs, 24 hrs post-injury and over the 10-day study vs. respective controls.
Controls are CSF controls and normal controls for serum).UCH-L2 levels are mean (±SEM)
| N | CSF UCH-L1 (ng/mL) | N | Serum UCH-L1 (ng/mL) | ||
|---|---|---|---|---|---|
| TBI | First 6 hrs | 21 | 171.10(27.94) * | 35 | 5.32 (1.10) * |
| First 24 hrs | 49 | 110.60(14.53) * | 74 | 2.09 (0.43) * | |
| Over Study | 61 | 66.21 (9.72) * | 86 | 1.02 (0.26) * | |
| GCS 3–5 | 23 | 162.80 (27.41) | 32 | 2.35 (0.43) † | |
| GCS 6–8 | 8 | 101.80 (40.07) | 9 | 0.59 (0.22) | |
| Controls | 24 | 7.69 (2.78) | 167 | 0.12 (0.02) |
p <.001 (p values of the Mann-Whitney test for differences between the groups [TBI versus Controls])
p < .05 (p values of the Mann-Whitney test for differences between the groups [GCS 3–5 versus GCS 6–8])
Fig. 3 presents ROC analyses of serum and CSF levels of UCH-L1 in patients with severe TBI vs. controls at 6, 12, 18 and 24 hrs after injury. AUC values are also plotted over these time periods. AUC values in serum and CSF were statistically significant at all time points (p < .001). Consistent with the marked decline in serum levels of UCH-L1 within the first 24 hrs, AUC values also showed decreases in serum (Fig. 3C and D). In contrast, AUC values in CSF remain relatively constant, consistent with the more sustained elevation in that compartment (Fig. 3A and B).
Fig. 3. UCH-L1 Receiver Operation Characteristics (ROC) Curves.

Comparing 24 h post injury TBI CSF (A) and serum (C) UCH-L1 level vs. CSF controls or serum normal controls, respectively. Area under the curve (AUC) over time was also plotted (B, D).
Serum and CSF UCH-L1 level correlation to severity of TBI
UCH-L1 levels in CSF and serum were also compared against TBI severity by analyzing dichotomized GCS patient groups (GCS 3–5 versus GCS 6–8). GCS scores on admission were used for this analysis. Patients with GCS 3 to 5 (generally reflect more severe injury) had indeed higher CSF and serum UCH-L1 levels within 12-hours post injury than patients with GCS 5 to 8 (p = .07 and p = .02, Mann-Whitney test, respectively) (Table 2).
Serum and CSF UCH-L1 level correlation to severe TBI outcome
We then examined serum and CSF UCH-L1 level correlation to severe TBI outcome in terms of patient survival within the 7-day study period. Within the first 6 hrs post injury, CSF levels of UCHL1 for non-survivors was significantly higher than those of survivors (CSF 292.1±47.17 ng/ml versus 67.16±22.32 ng/ml; p=0.01, Mann-Whitney U test), as well as those levels over the duration of the study (CSF 97.51±10.93 ng/ml versus 34.33±3.2 ng/ml, P<.001), respectively (Fig. 4). Importantly, serum levels of UCHL1 for survivors were also significantly higher than those of non-survivors within the first 6 hrs (serum 8.42±2.58 ng/ml versus 1.00±0.66 ng/ml, p=.01), as well as over the duration of the study (1.62±0.33 ng/ml versus 0.23±0.03 ng/ml; P<.001), respectively (Fig. 4).
Fig. 4. Comparison UCH-L1 levels in CSF (A) and in Serum (B) in survivors versus non-survivors.
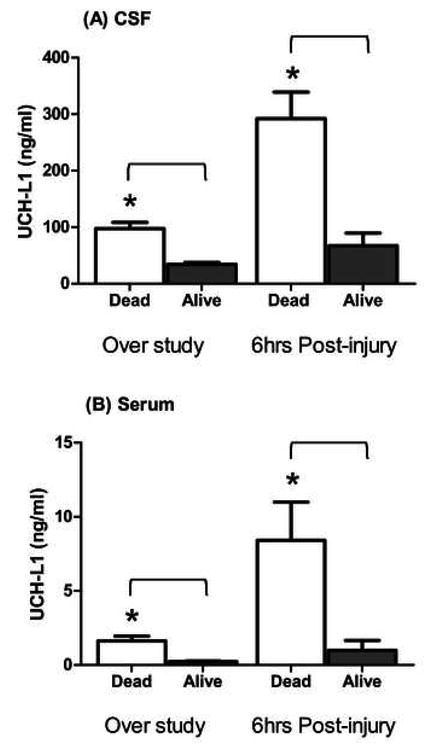
(over study duration and 6 hrs post-injury). *p= 0.05; Mann-Whitney U test).
Furthermore, there was also a significant difference in terms of the CSF and serum UCH-L1 biomarker load in the two outcome groups (Fig. 5A and B).
Fig. 5. Comparison of CSF (A) and Serum (B) levels of UCH-L1 in patients with TBI who survived versus non-survivors within 7 days from TBI.

The graphs show time course of serum and CSF UCH-L1 levels in patients who survived or died. There was a marked difference between the two outcome groups. Increased initial levels of UCH-L1 and secondary increases indicate severe primary injury and the possibility of secondary brain damage associated with death.
Table 3 shows crude odds ratios with 95% confidence intervals of CSF and serum levels of UCH-L1 (by thirtiles) for the prediction of death.
Table 3.
Crude OR of cumulative CSF and serum levels of UCH-L1 (by thirtiles) for the prediction of death (GOS 1) at 3 months after severe traumatic brain injury, using univariate logistic regression
| GOS 1 | |||
|---|---|---|---|
| Variables | OR (95% CI) | P | C-statistic |
| UCH-L1 in CSF | 0.65 | ||
| ≤130.76 ng/ml | 1 | Ref. | |
| 130.77–505.95 ng/ml | 0.55 (0.12–2.55 ) | 0.44 | |
| >505.95 ng/ml | 2.25 (0.52–9.70) | 0.28 | |
| UCH-L1 in serum | 0.67 | ||
| ≤0.69 ng/ml | 1 | Ref. | |
| 0.7–3.96 ng/ml | 2 (0.52–7.69) | 0.31 | |
| >3.96 ng/ml | 4.8 (1.15–20.09) | 0.03 | |
DISCUSSION
Recent advancements in the field of proteomics and increased sophistication of laboratory techniques have facilitated discovery and rapid detection of novel brain injury biomarkers.12,32 UCH-L1 is highly enriched in neurons, and alterations in its activity have been associated with neurodegenerative diseases including Parkinson’s, Huntington’s and Alzheimer’s diseases.29 Neuroproteomic work in our laboratory identified UCH-L1 as a protein with 2-fold increases in abundance in the injured cortex 48 hrs after controlled cortical impact in a rat model of TBI.29 We have also characterized UCH-L1 as a novel biomarker for brain ischemia and TBI in rats.33 There are limited studies assessing UCH-L1 in human cardiac arrest in TBI.34 We previously examined UCH-L1 levels in CSF as a biomarker of severe TBI.35 Siman et al. also reported elevation of UCH-L1 signals in CSF of severe TBI patients, among a panel of other putative markers.36 This study is the first to systematically assess UCH-L1 in human serum following TBI and compare levels with those found in CSF of the same patients (Fig. 2, Fig. 3, Table 2). We confirmed that UCH-L1 protein is present in human serum and that its levels are significantly elevated after severe TBI using ELISA analysis. Additionally, UCH-L1 was detectable in blood very early after injury, related to injury magnitude and an early predictor of mortality. In this study, UCH-L1 levels in serum distinguished between severe TBI patients and uninjured controls. UCH-L1 levels were significantly elevated in injured subject serum within the first 6–24 hrs after injury as well as averaged over the 7 day duration of study. Fig. 2 also illustrates that the temporal profile of UCH-L1 was characterized by secondary increases after the initial injury. Future studies will be needed to determine whether these increases were associated with secondary insults such as increased intracranial pressure (ICP) or hypotension in the same patients. Similar secondary increases were also observed in patients who died (see below). Since our study was not designed to obtain samples sooner than 6 hrs following injury, we were unable to describe the time course of UCH-L1 release in CSF or serum closer to the time of injury. In practice, it is difficult to obtain CSF samples sooner than 6 hrs post injury. Ongoing studies by our group taking blood samples from patients at the site of injury could provide insights into UCH-L1 levels and serum within the first 1–2 hrs following insult.
Although preliminary, ROC curves demonstrated the potential utility of measures of UCH-L1 in serum and CSF for differentiating between TBI patients and controls (Fig. 3). Since we have yet to determine final cutoffs of UCH-L1 values for normal and TBI subjects, sensitivity and specificity analyses as well as predictive power calculations were not conducted in this group of patients. Additionally, as shown by this work and others,37,38 the temporal profile of changes in biomarker levels is an important factor in determining diagnostic utility. Serum levels were most reliably associated with TBI when measured within the first 6 hrs after injury and dropped off markedly thereafter. In contrast, sustained levels of UCH-L1 in CSF resulted in relatively constant AUC values. ROC values for UCH-L1 in CSF were similar to those previously reported.35 Importantly, elevations of UCH-L1 levels in CSF and serum in the first 12 hrs after TBI were significantly associated with initial severity of injury as measured by the GCS score on admission (Table 2).
Mortality within 3 months after severe TBI was significantly associated with increased levels of UCH-L1 in serum and CSF within 6 hrs post injury as well as averaged over the study duration (Fig. 4).
These data are comparable to a previous report that patients who did not survive by 6 weeks had significantly higher values of UCH-L1 in CSF 24 hrs post injury compared to survivors.35 Cumulative serum UCH-L1 level above 5.22 ng/ml was a predictor of death while cumulative CSF UCH-L1 level did not predict death (Table 3). This is potentially related to the mechanism of release of UCH-L1 from the brain to the circulation. The mechanism by which UCHL-1, a neuronal-specific protein, is transported from the brain compartment into the circulation is unknown. We hypothesize that UCHL-1 effluxes into the extracellular fluid upon neural cell disruption, leaks by blood brain barrier breakdown and equilibrates with the blood.39 Therefore serum UCH-L1 levels could more accurately reflect cerebral brain injury as well as blood brain barrier dysfunction/disruption, explaining the difference in the predictive value between CSF and serum. Interestingly, Majetschak et al, measured CSF levels of ubiquitin over 7 days in 6 patients with TBI and found ubiquitin levels progressively recovered in survivors, whereas levels continued to increase until death in non survivors.40 Although this study assessed the parent compound ubiquitin and not UCH-L1, the data illustrate how elevations in this protein family can be associated with poor outcome. Recently, Brophy et al. evaluated exposure and biokinetic parameters of UCH-L1 in CSF and serum. They found a statistically significant increase in the median amount and peak concentration of UCH-L1 in serum, and a shorter Tmax (time it takes to achieve the peak concentration) in non-survivors compared to survivors.41 As with acute diagnosis of injury and injury magnitude, there may be critical periods following injury during which levels of markers provide more reliable predictions of long term outcome. The half-life of UCHL1 is similar in both CSF and serum, ranging from 7 to 9 hrs. 41 Ongoing kinetic studies of UCH-L1 in CSF and serum will further define the optimal frequency and timing of sampling after TBI in humans. Fig. 4 illustrates important differential features of the temporal profile of UCH-L1 in CSF and serum of patients who survived vs. patients who died. Non survivors had more sustained levels of biomarkers in both compartments. These more sustained levels were associated with secondary transient increases. It will be important for future studies to determine the relationship between these temporal characteristics of biomarkers changes and the occurrence of secondary insults following TBI. Such studies are ongoing by our group. In addition, ongoing studies will address whether other clinical variables such as gender and age that are known to influence clinical outcome in the biochemical response to TBI.42
While these data are encouraging, the authors recognize that there are limitations to this study. The current study was performed in a limited cohort of patients with severe TBI, a heterogeneous injury modality. This was a preliminary pilot study focused on GCS as the most widely used method used to evaluate the initial magnitude of injury. Future studies should assess the biomarker value against other measures of injury severity such as duration of coma and duration of post-traumatic amnesia. Also within the current study, only limited data are available regarding neuroimaging, The Marshall score was assessed by a trained neuroradiologist only in one of the sites. In order to avoid interobserver variability in the interpretation of neuroimaging and add a potential confounding condition, we are designing a study that will include initial computed tomography (CT) scans obtained on admission that will be interpreted by a qualified neuroradiologist at a central location.
UCH-L1 is a specific marker of neurons in the CNS. Therefore, it is likely that serum UCH-L1 is entirely derived from the brain. Ongoing studies of patients with peripheral polytrauma are directly assessing the effect of extra cranial injuries on UCH-L1 values. These studies will provide further evidence of the brain specificity of UCH-L1.
Nevertheless, CSF and serum levels present within the first 6 hrs post injury provides a framework for future clinical studies examining the utility of UCH-L1 as a potential biomarker of mild, moderate and severe TBI in larger sample sizes.
CONCLUSION
The present study significantly extends the findings reported in previous research in animal models and human CSF following severe head injury. Taken together, the data provide strong support for the hypothesis that UCH-L1 levels can reliably diagnose the occurrence and magnitude of injury as well as predict outcome.
Acknowledgments
Research Funding
This study was supported in part by NIH (R01 NS049175-01, R01-NS052831-01, and R01 NS051431-01), supported in part by Department of Defense Award numbers DAMD17-03-1-0772 and DAMD17-03-1-0066; National Institutes of Health Award numbers; Navy grant number N00014-06-1-1029 (University of Florida). Material has been reviewed by the Walter Reed Army Institute of Research. There is no objection to its presentation and/or publication. The opinions or assertions contained herein are the private views of the authors, and are not to be construed as official, or as reflecting true views of Department of the Army or Department of Defense.
Footnotes
Authors’ Disclosures of Potential Conflicts of Interest
Drs. Mondello, Buki, Robicsek, Gabrielli, Brophy and Papa are consultants of Banyan Biomarkers, Inc.; Ms. Akinyi is employee of Banyan Biomarkers, Inc.; Drs. Wang and Hayes own stock, receive royalties from, and are officers of Banyan Biomarkers Inc., and as such may benefit financially as a result of the outcomes of this research or work reported in this publication. Dr. Tortella reports no disclosures.
This is an important contribution representing an ambitious study to discover new biomarkers of traumatic brain injury. UCH-L1 was identified from unbiased proteomic studies to be one of the major neuronal proteins found to be elevated in CSF and serum after TBI. This study is a significant contribution to development of UCH-L1 as a biomarker, in that it includes a large (n=95) patients with severe TBI, as well as 24 controls subjects (who contributed ventricular CSF) as well as 167 control subjects who contributed serum. The major conclusion of the study is that UCH-L1 is increased within 6 hours of injury, and although levels fall over the next several hours, they remain significantly elevated in serum for at least 36 hours and in CSF for up to 100 hours. There was also a relationship between UCH-L1 levels and injury severity. There was also an association between UCH-L1 elevations and mortality. There are several important weaknesses. The main one is that we are not provided information on injury severity beyond the GCS, which is a unidimensional and very imperfect measure on injury severity. Duration of coma and duration of post-traumatic amnesia are generally recognized to be better measures of injury severity than initial GCS. We are also provided with little information about the neuroimaging results on these patients. If biomarkers are to fulfill their promise to allow finely grained phenotyping of injury severity and injury type, future studies will have to take full advantage of the best availableclinical information
Ramon Diaz-Arrastia, Dallas, Texas
Clinical advances in neurotrauma (indeed, throughout the spectrum of neurological disease) are hampered by the absence of valid biomarkers of disease severity, treatment, and recovery. The investigators behind this report have been at the forefront of the search for a biomarker in traumatic brain injury over the last decade. The current study provides important data on the potential value of ubiquitin C-terminal hydrolase-L1 (UCHL-1) as a TBI biomarker. Significant clarification remains, including distinguishing changes in serum concentrations of UCLH-1 following TBI from other forms on non-CNS trauma and a more careful assessment of the relationship between UCHL-1 levels and functional impairments from TBI beyond the crude measure of 3 month Glasgow Outcome Scale score. Nevertheless, the strength of this initial data likely augurs the inclusion of UCHL-1 in a forthcoming panel of biomarkers that measure injury and prognosis in TBI.
David O. Okonkwo, Pittsburgh, Pennsylvania
References
- 1.Jager TE, Weiss HB, Coben JH, Pepe PE. Traumatic brain injuries evaluated in U.S. emergency departments, 1992–1994. Acad Emerg Med. 2000;7:134–140. doi: 10.1111/j.1553-2712.2000.tb00515.x. [DOI] [PubMed] [Google Scholar]
- 2.TBI State Demonstration Grants. J Head Trauma Rehabil. 2000;15:750–760. doi: 10.1097/00001199-200002000-00013. [DOI] [PubMed] [Google Scholar]
- 3.Hoge CW, McGurk D, Thomas JL, Cox AL, Engel CC, Castro CA. Mild traumatic brain injury in U.S. Soldiers returning from Iraq. N Engl J Med. 2008;358:453–463. doi: 10.1056/NEJMoa072972. [DOI] [PubMed] [Google Scholar]
- 4.Kesler SR, Adams HF, Bigler ED. SPECT, MR and quantitative MR imaging: correlates with neuropsycholgical. Brain Injury. 2000;14:851–857. doi: 10.1080/026990500445682. [DOI] [PubMed] [Google Scholar]
- 5.Saatman KE, Duhaime AC, Bullock R, Maas AI, Valadka A, Manley GT. Classification of traumatic brain injury for targeted therapies. J Neurotrauma. 2008;25:719–738. doi: 10.1089/neu.2008.0586. [DOI] [PMC free article] [PubMed] [Google Scholar]
- 6.Kochanek PM, Berger RP, Bayir H, Wagner AK, Jenkins LW, Clark RS. Biomarkers of primary and evolving damage in traumatic and ischemic brain injury: Diagnosis, prognosis, probing mechanisms, and therapeutic decision making. Curr Opin Crit Care. 2008;14:135–141. doi: 10.1097/MCC.0b013e3282f57564. [DOI] [PubMed] [Google Scholar]
- 7.Dash PK, Zhao J, Hergenroeder G, Moore AN. Biomarkers for the diagnosis, prognosis, and evaluation of treatment efficacy for traumatic brain injury. Neurotherapeutics. 2010;7:100–114. doi: 10.1016/j.nurt.2009.10.019. [DOI] [PMC free article] [PubMed] [Google Scholar]
- 8.Yamazaki Y, Yada K, Morii S, Kitahara T, Ohwada T. Diagnostic significance of serum neuron-specific enolase and myelin basic protein assay in patients with acute head injury. Surg Neurol. 1995;43:267–270. doi: 10.1007/978-4-431-68231-8_86. [DOI] [PubMed] [Google Scholar]
- 9.Ross SA, Cunningham RT, Johnston CF, Rowlands BJ. Neuron-specific enolase as an aid to outcome prediction in head injury. Br J Neurosurg. 1996;10:471–476. doi: 10.1080/02688699647104. [DOI] [PubMed] [Google Scholar]
- 10.Missler U. S-100 protein and neuron-specific enolase concentrations in blood as indicators of infarction volume and prognosis in acute ischemic stroke. Stroke. 1997;28:1956–1960. doi: 10.1161/01.str.28.10.1956. [DOI] [PubMed] [Google Scholar]
- 11.Usui AKK, Abe T, Murase M, Tanaka M, Takeuchi E. S-100 ao protein in blood and urine during open-heart surgery. Clin Chem. 1989;35:1942–1944. [PubMed] [Google Scholar]
- 12.Pelinka LE, Kroepfl A, Leixnering M, Buchinger W, Raabe A, Redl H. GFAP versus S100B in serum after traumatic brain injury: relationship to brain damage and outcome. J Neurotrauma. 2004;21:1553–1561. doi: 10.1089/neu.2004.21.1553. [DOI] [PubMed] [Google Scholar]
- 13.Berger RP, Beers SR, Richichi R, Wiesman D, Adelson PD. Serum biomarker concentrations and outcome after pediatric traumatic brain injury. J Neurotrauma. 2007;24:1793–1801. doi: 10.1089/neu.2007.0316. [DOI] [PubMed] [Google Scholar]
- 14.Donato R. Functional roles of S100 proteins, calcium-binding proteins of the EF-hand type. Biochim Biophys Acta. 1999;1450:191–231. doi: 10.1016/s0167-4889(99)00058-0. [DOI] [PubMed] [Google Scholar]
- 15.Wang KK, Ottens AK, Liu MC, Lewis SB, Meegan C, Oli MW, et al. Proteomic identification of biomarkers of traumatic brain injury. Expert Rev Proteomics. 2005;2:603–604. doi: 10.1586/14789450.2.4.603. [DOI] [PubMed] [Google Scholar]
- 16.Laskowitz EA. Serum Markers of Cerebral Ischemia. Journal of Stroke and Cerebrovascular Diseases. 1998;7:234–241. doi: 10.1016/s1052-3057(98)80032-3. [DOI] [PubMed] [Google Scholar]
- 17.Martens P. Serum neuron-specific enolase as a prognostic marker for irreversible brain damage in comatose cardiac arrest surviviors. Acad Emerg Med. 1996;3:126–131. doi: 10.1111/j.1553-2712.1996.tb03399.x. [DOI] [PubMed] [Google Scholar]
- 18.Vos PE, Jacobs B, Andriessen TM, Lamers KJ, Borm GF, Beems T, et al. GFAP and S100B are biomarkers of traumatic brain injury: an observational cohort study. Neurology. 2010;75:1786–1793. doi: 10.1212/WNL.0b013e3181fd62d2. [DOI] [PubMed] [Google Scholar]
- 19.Pike BR, Flint J, Dave JR, Lu XC, Wang KK, Tortella FC, Hayes RL. Accumulation of calpain and caspase-3 proteolytic fragments of brainderived alphaII-spectrin in cerebral spinal fluid after middle cerebral artery occlusion in rats. J Cereb Blood Flow Metab. 2004;24:98–106. doi: 10.1097/01.WCB.0000098520.11962.37. [DOI] [PubMed] [Google Scholar]
- 20.Pineda JA, Lewis SB, Valadka AB, Papa L, Hannay HJ, Heaton SC, et al. Clinical significance of alphaII-spectrin breakdown products in cerebrospinal fluid after severe traumatic brain injury. J Neurotrauma. 2007;24:354–366. doi: 10.1089/neu.2006.003789. [DOI] [PubMed] [Google Scholar]
- 21.Mondello S, Robicsek SA, Gabrielli A, Brophy GM, Papa L, Tepas J, et al. alphaII Spectrin Breakdown Products (SBDPs): Diagnosis and Outcome in Severe Traumatic Brain Injury Patients. J Neurotrauma. 2010;27:1203–1213. doi: 10.1089/neu.2010.1278. [DOI] [PMC free article] [PubMed] [Google Scholar]
- 22.Jackson P, Thompson RJ. The demonstration of new human brain-specific proteins by high-resolution two-dimensional polyacrylamide gel electrophoresis. J Neurol Sci. 1981;49:429–438. doi: 10.1016/0022-510x(81)90032-0. [DOI] [PubMed] [Google Scholar]
- 23.Tongaonkar P, Chen L, Lambertson D, Ko B, Madura K. Evidence for an interaction between ubiquitin-conjugating enzymes and the 26S proteasome. Mol Cell Biol. 2000;20:4691–4698. doi: 10.1128/mcb.20.13.4691-4698.2000. [DOI] [PMC free article] [PubMed] [Google Scholar]
- 24.Lincoln S, Vaughan J, Wood N, Baker M, Adamson J, Gwinn-Hardy K, et al. Low frequency of pathogenic mutations in the ubiquitin carboxy-terminal hydrolase gene in familial Parkinson’s disease. Neuroreport. 1999;10:427–429. doi: 10.1097/00001756-199902050-00040. [DOI] [PubMed] [Google Scholar]
- 25.Coleman MP, Ribchester RR. Programmed axon death, synaptic dysfunction and the ubiquitin proteasome system. Curr Drug Targets CNS Neurol Disord. 2004;3:227–238. doi: 10.2174/1568007043337436. [DOI] [PubMed] [Google Scholar]
- 26.Laser H, Mack TG, Wagner D, Coleman MP. Proteasome inhibition arrests neurite outgrowth and causes “dying-back” degeneration in primary culture. J Neurosci Res. 2003;74:906–916. doi: 10.1002/jnr.10806. [DOI] [PubMed] [Google Scholar]
- 27.Hu BR, Liu CL, Ouyang Y, Blomgren K, Siesjo BK. Involvement of caspase-3 in cell death after hypoxia-ischemia declines during brain maturation. J Cereb Blood Flow Metab. 2000;20:1294–1300. doi: 10.1097/00004647-200009000-00003. [DOI] [PubMed] [Google Scholar]
- 28.Keller JN, Huang FF, Zhu H, Yu J, Ho YS, Kindy TS. Oxidative stressassociated impairment of proteasome activity during ischemia-reperfusion injury. J Cereb Blood Flow Metab. 2000;20:1467–1473. doi: 10.1097/00004647-200010000-00008. [DOI] [PubMed] [Google Scholar]
- 29.Gong B, Leznik E. The role of ubiquitin C-terminal hydrolase L1 in neurodegenerative disorders. Drug News Perspect. 2007;20:365–370. doi: 10.1358/dnp.2007.20.6.1138160. [DOI] [PubMed] [Google Scholar]
- 30.Stocchetti N, Pagan F, Calappi E, Canavesi K, Beretta L, Citerio G, et al. Inaccurate early assessment of neurological severity in head injury. J Neurotrauma. 2004;21:1131–1140. doi: 10.1089/neu.2004.21.1131. [DOI] [PubMed] [Google Scholar]
- 31.Teasdale G, Jennett B. Assessment and prognosis of coma after head injury. Acta Neurochir (Wien) 1976;34:45–55. doi: 10.1007/BF01405862. [DOI] [PubMed] [Google Scholar]
- 32.Kobeissy FH, Ottens AK, Zhang Z, Liu MC, Denslow ND, Dave JR, et al. Novel differential neuroproteomics analysis of traumatic brain injury in rats. Mol Cell Proteomics. 2006;5:1887–1898. doi: 10.1074/mcp.M600157-MCP200. [DOI] [PubMed] [Google Scholar]
- 33.Liu MC, Akinyi L, Scharf D, Mo J, Larner SF, Muller U, et al. Ubiquitin C-terminal hydrolase-L1 as a biomarker for ischemic and traumatic brain injury in rats. Eur J Neurosci. 2010;31:722–732. doi: 10.1111/j.1460-9568.2010.07097.x. [DOI] [PMC free article] [PubMed] [Google Scholar]
- 34.Siman R, Roberts VL, McNeil E, Dang A, Bavaria JE, et al. Biomarker evidence for mild central nervous system injury after surgically-induced circulation arrest. Brain Res. 2008;1213:1–11. doi: 10.1016/j.brainres.2008.03.034. [DOI] [PMC free article] [PubMed] [Google Scholar]
- 35.Papa L, Akinyi L, Liu MC, Pineda JA, Tepas JJ, 3rd, Oli MW, et al. Ubiquitin C-terminal hydrolase is a novel biomarker in humans for severe traumatic brain injury Crit Care Med. Crit Care Med. 2010;38:138–144. doi: 10.1097/CCM.0b013e3181b788ab. [DOI] [PMC free article] [PubMed] [Google Scholar]
- 36.Siman R, Toraskar N, Dang A, McNeil E, McGarvey M, Plaum J, et al. A panel of neuron-enriched proteins as markers for traumatic brain injury in humans. J Neurotrauma. 2009;26:1867–1877. doi: 10.1089/neu.2009.0882. [DOI] [PMC free article] [PubMed] [Google Scholar]
- 37.Berger RP, Pierce MC, Wisniewski SR, Adelson PD, Clark RS, Ruppel RA, Kochanek PM. Neuron-specific enolase and S100B in cerebrospinal fluid after severe traumatic brain injury in infants and children. Pediatrics. 2002;109:E31. doi: 10.1542/peds.109.2.e31. [DOI] [PubMed] [Google Scholar]
- 38.Herrmann M, Vos P, Wunderlich MT, de Bruijn CH, Lamers KJ. Release of glial tissue-specific proteins after acute stroke: A comparative analysis of serum concentrations of protein S-100B and glial fibrillary acidic protein. Stroke. 2000;31:2670–2677. doi: 10.1161/01.str.31.11.2670. [DOI] [PubMed] [Google Scholar]
- 39.Mondello S, Muller U, Jeromin A, Streeter J, Hayes RL, Wang KK. Blood-based diagnostics of traumatic brain injuries. Expert Rev Mol Diagn. 2011;11:65–78. doi: 10.1586/erm.10.104. [DOI] [PMC free article] [PubMed] [Google Scholar]
- 40.Majetschak M, King DR, Krehmeier U, Busby LT, Thome C, Vajkoczy S, et al. Ubiquitin immunoreactivity in cerebrospinal fluid after traumatic brain injury: clinical and experimental findings. Crit Care Med. 2005;33:1589–1594. doi: 10.1097/01.ccm.0000169883.41245.23. [DOI] [PubMed] [Google Scholar]
- 41.Brophy GM, Mondello S, Papa L, Robicsek SA, Gabrielli A, Tepas J, et al. Biokinetic Analysis of Ubiquitin C-Terminal Hydrolase-L1 (UCH-L1) in Severe Traumatic Brain Injury Patient Biofluids. J Neurotrauma. 2011 doi: 10.1089/neu.2010.1564. [Epub ahead of print] [DOI] [PMC free article] [PubMed] [Google Scholar]
- 42.Hukkelhoven CW, Steyerberg EW, Rampen AJ, Farace E, Habbema JD, Marshall LF, et al. Patient age and outcome following severe traumatic brain injury: an analysis of 5600 patients. J Neurosurg. 2003;99:666–673. doi: 10.3171/jns.2003.99.4.0666. [DOI] [PubMed] [Google Scholar]