Abstract
The optic tectum of zebrafish is involved in behavioral responses that require the detection of small objects. The superficial layers of the tectal neuropil receive input from retinal axons, while its deeper layers convey the processed information to premotor areas. Imaging with a genetically encoded calcium indicator revealed that the deep layers, as well as the dendrites of single tectal neurons, are preferentially activated by small visual stimuli. This spatial filtering relies on GABAergic interneurons (using the neurotransmitter γ-aminobutyric acid) that are located in the superficial input layer and respond only to large visual stimuli. Photo-ablation of these cells with KillerRed, or silencing of their synaptic transmission, eliminates the size tuning of deeper layers and impairs the capture of prey.
The optic tectum in the vertebrate midbrain, called the superior colliculus in mammals, receives visual inputs from the retina and converts this information into directed motor outputs (1). In larval zebrafish, the tectum is divided into two main areas: the stratum periventriculare (SPV), which contains the cell bodies of most tectal neurons, and the synaptic neuropil area, which contains their dendrites and axons as well as the axons of retinal afferents (2–5). Neurons in the SPV, called periventricular neurons (PVNs), extend a single neurite, which branches extensively and may span the entire depth of the neuropil. Retinal axons mainly target the superficial layers of the tectal neuropil [i.e., the stratum opticum (SO) and the stratum fibrosum et griseum superficiale (SFGS); fig. S1] (5–8), where they make contact with the dendrites of periventricular interneurons (PVINs) that convey the visual information to other PVINs or to periventricular projection neurons (PVPNs). The axons of PVPNs exit the tectum in the deepest neuropil layer and project to premotor regions in the midbrain and hindbrain (2, 5, 6).
The tectum is required for the localization, tracking, and capture of motile prey, such as paramecia (9). Other visual behaviors (e.g., optomotor and optokinetic responses) are mediated by a different pathway not involving the tectum (10, 11). Consistent with a function in the detection of small objects, electrophysiology and optical imaging showed that single tectal neurons, in all vertebrates examined, often respond to small stimuli such as spots or bars, which occupy only a fraction of the neurons’ receptive fields (12–19). To reveal the neural substrate of this size filtering, we used Gal4 enhancer-trap lines (2, 20, 21) to drive the expression of the genetically encoded Ca2+ indicators GCaMP1.6 (22) and GCaMP3 (23). This allowed us to record visually evoked activity in dendrites and axons of specific classes of neurons.
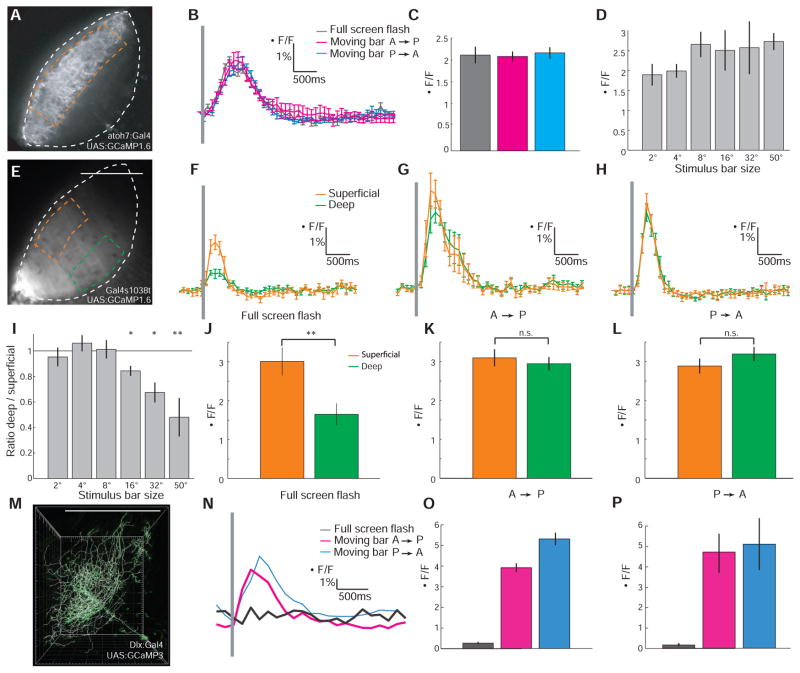
We used the Atoh7:Gal4 transgenic line to drive expression of GCaMP1.6 in retinal axons, demarcating the superficial input layers in the neuropil (Fig. 1A). The fish’s retina was exposed to three visual stimuli, displayed on a miniature LCD screen (fig. S1): (i) a brief (25 or 50 ms) flash that filled the entire screen (horizontal visual angle 50°), (ii) a thin black bar (2°) moving at a speed of 0.25°/ms across the screen from anterior to posterior (A→P), and (iii) a bar of the same size and speed, but moving from posterior to anterior (P→A). The responses of the retinal axons did not differ significantly in amplitude and in time to peak between the large and the small stimuli (Fig. 1, B and C; maximum ΔF/F = 2.11 ± 0.19% for flash versus 2.08 ± 0.11% for A→P and 2.16 ± 0.13% for P→A; time to peak = 0.69 ± 0.03 s for flash versus 0.72 ± 0.11 s for A→P and 0.73 ± 0.05 s for P→A; Pamplitude = 0.31; Ptime-to-peak = 0.54; n = 5). Indeed, responses were similar in amplitude across a range of stimulus sizes (Fig. 1D).
Fig. 1.
Ca2+ responses in the tectal neuropil reveal size selectivity of deep layers. (A) Fluorescent signal from retinal axon terminals in the tectum of an Atoh7:Gal4, UAS:GCaMP1.6 larva. Region of interest (ROI) is demarcated by the orange dashed line. Neuropil boundaries are indicated by white dashed lines. (B) Tectal responses in an Atoh7:Gal4, UAS:GCaMP1.6 larva to a full-screen flash (50° visual angle) or to black bars (2° wide, moving A→P or P→A with a speed of 0.25°/ms). (C) Average maximum responses in the Atoh7:Gal4, UAS:GCaMP1.6 larvae (n = 5). (D) Tuning of retinal axons in the Atoh7:Gal4, UAS:GCaMP1.6 larvae to bars of increasing width (n = 5). (E) Fluorescent signal from posterior PVPNs in Gal4s1038t, UAS:GCaMP1.6 larva. ROIs for superficial (orange) and deep (green) neuropil layers are indicated by dashed lines. Neuropil boundary is white dashed line. (F to H) Responses to three visual stimuli in a Gal4s1038t, UAS:GCaMP1.6 larva. (I) Ratios of maximum responses in deep and superficial neuropil layers to bars of increasing width in Gal4s1038t, UAS:GCaMP1.6 larvae (n = 7 for 2° and 50°; n = 3 for other stimuli). (J to L) Average maximum responses in Gal4s1038t, UAS:GCaMP1.6 larvae (n = 7). *P < 0.05, **P < 0.01 (t test). (M) Reconstruction of a single PVN expressing UAS:GCaMP3, Dlx5/6:Gal4. (N) Ca2+ response of the PVN shown in (M). (O) Average maximum ΔF/F response in this cell. (P) Average response of bar-selective PVNs (n = 7). Error bars indicate SEM. Gray bars in (B), (F), (G), (H), and (N) indicate time of visual stimulation.
In the Gal4s1038t line, a small subset of PVPNs in the posterior-ventral quadrant of the tectum are labeled (2) (Fig. 1E). This population is activated by retinal stimulation, as surgical removal of one eye eliminated GCaMP1.6 responses in the contralateral tectum (fig. S1; maximum ΔF/F = 2.17 ± 0.23% in ipsilateral tectum versus 0.09 ± 0.14 in contralateral tectum; PI-C < 3.16 × 10⁻⁴; n = 5). However, the response to the full-screen flash was weaker in the deep output layer than in the superficial input layer (Fig. 1, F and J; 3.01 ± 0.36% for superficial versus 1.65 ± 0.28% for deep; P < 10−4). Although the absolute fluorescence signals varied between fish, the deep-to-superficial response ratios were consistent (Fig. 1J and fig. S2; deep-to-superficial ratio = 0.48 ± 0.15; P < 0.01, n = 7). In contrast, small moving bars activated Ca2+ rises equally in the deep and the superficial layers (Fig. 1, G, H, K, and L; A→P: 2.95 ± 0.17% for deep versus 3.10 ± 0.22% for superficial, deep-to-superficial ratio = 0.95 ± 0.07; P→A: 3.2 ± 0.18% for deep versus 2.89 ± 0.19% for superficial, deep-to-superficial ratio = 1.10 ± 0.31; PA→P = 0.16 and PP→A = 0.23; n = 7). The tuning curve showed a systematic size-dependent reduction of the response (Fig. 1I), which suggests that large stimuli did not efficiently excite the cellular elements in the deep neuropil layer.
In the Gal4s1013t line, almost all tectal cells are labeled (2), allowing us to record Ca2+ responses across the entire visual field. The deep-to-superficial response ratios in response to a full-screen flash were not significantly different between the anterior and posterior halves of the tectum (0.41 ± 0.19 versus 0.36 ± 0.27; n = 3). Thus, there does not seem to be a topographic bias in size tuning across the visuotopic map
We used a mosaic labeling strategy to image the dendritic activity of individual PVNs. Two DNA constructs encoding UAS:GCaMP3 (23) and Dlx5/6:Gal4 (24) were co-injected at the two-cell stage, and larvae with only one or very few labeled PVNs were used for imaging (Fig. 1M). Of 38 PVNs recorded, 7 (18%) responded to small moving bars; the remaining cells did not respond to any of the stimuli. None of the PVNs was activated by the full-screen stimulus (Fig. 1, N to P, n = 7). In the seven PVNs sensitive to small moving bars, we could not detect significant differences in the Ca2+ response between the distal (superficial) and the proximal (deep) segments of their dendritic trees (P = 0.49), indicating the existence of a circuit that filters out low-frequency spatial inputs before they reach the PVN dendrites.
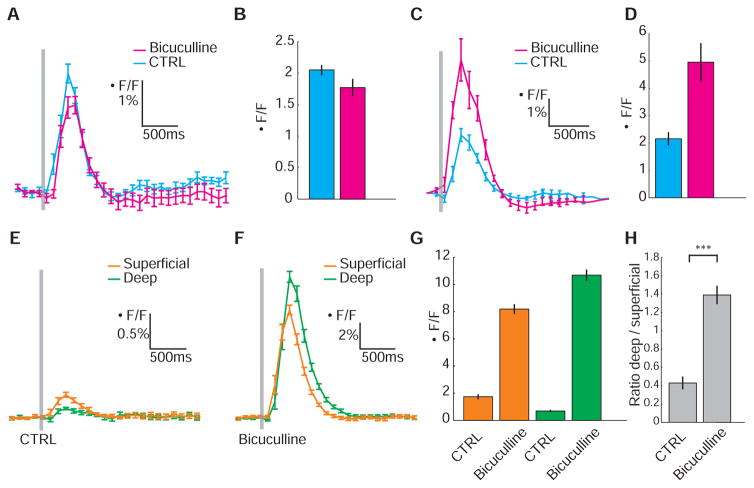
We next showed that spatial filtering is achieved by feedforward inhibition. Local application of the GABAA receptor antagonist bicuculline (Bicu) to the tectum increased responses in the entire neuropil, but not uniformly. In the deep layers of Gal4s1038t, UAS:GCaMP1.6, Ca2+ signals rose by more than a factor of 15, whereas in the superficial layers the increase was by only a factor of 5 (Fig. 2, E to G; superficial, 8.19 ± 0.36% for Bicu versus 1.74 ± 0.19% for control; deep, 10.69 ± 0.41% for Bicu versus 0.69 ± 0.09% for control; PSUP < 1.4 × 10⁻⁷ and PDEEP < 9.9 × 10⁻⁸, n = 4), inverting the normal ratio (Fig. 2H and fig. S3; deep-to-superficial ratio for Bicu = 1.38 ± 0.10 versus 0.43 ± 0.07 for control; P < 3.1 × 10³; n = 4). Bicu administration to the tectum had no detectable effect on the strength of retinal inputs (Fig. 2, A and B; 1.99 ± 0.18% for Bicu versus 2.52 ± 0.19% for control; n = 3). In contrast, intraocular Bicu injection produced a robust increase in the Ca2+ response (Fig. 2, C and D; 4.96 ± 0.70% for Bicu versus 2.16 ± 0.24% for control; n = 4).
Fig. 2.
The neuropil Ca2+ response to a large visual stimulus is shaped by tectum-intrinsic GABAergic inhibition. (A and B) Effect of bicuculline administration to the tectum in Atoh7:Gal4, UAS:GCaMP1.6 transgenics. Response to a full-screen flash in a single larva (A) and average (n = 3) maximal response (B) before (CTRL, blue) and after bicuculline treatment (magenta). (C and D) Effect of intraocular injection of bicuculline in Atoh7:Gal4, UAS:GCaMP1.6. Response to a full-screen flash in a single larva (C) and average (n = 4) maximal response (D) before (CTRL, blue) and after bicuculline treatment (magenta). (E and F) Representative responses in superficial (orange) and deep (green) neuropil layers in Gal4s1038t, UAS:GCaMP1.6 larva before (E) and after bicuculline administration to tectum (F). (G and H) Average maximal response to a full-screen flash (G) and ratios (H) of Gal4s1038t, UAS:GCaMP1.6 larvae (n = 4) in superficial (orange) and deep (green) tectal neuropil layers before (CTRL) and after bicuculline administration. ***P < 0.001 (t test). Error bars indicate SEM. Gray bars in (A), (C), (E), and (F) indicate time of visual stimulation.
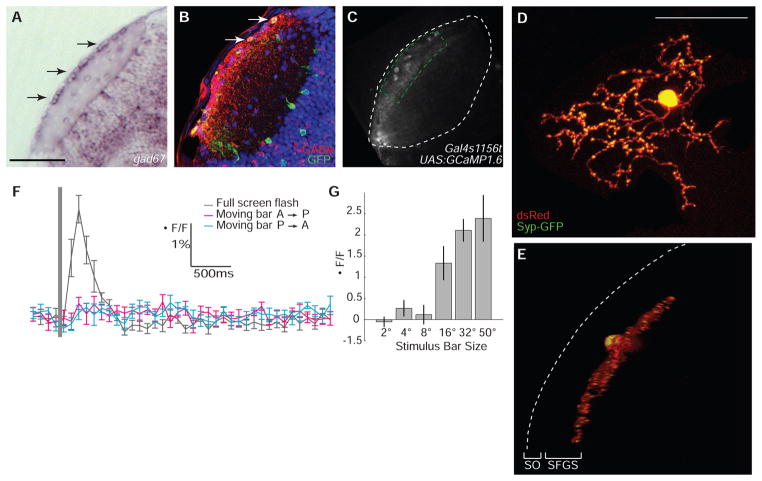
Gal4s1156t drives expression in a specific population of neurons whose cell bodies are located in the SO (Fig. 3, A to C) (2). Antibody staining showed that most, or all, neurons in this layer expressed the GABA markers Gad67 and Reelin (Fig. 3, A and B, and figs. S4 and S5) (94.71 ± 0.6%; 229 cells counted in n = 3 larvae). Furthermore, almost all Gal4s1156t-expressing cells were GABA-positive (54 of 56 cells in n = 4 larvae). Labeling of single cells by mosaic expression of cytoplasmic DsRed and synaptophysin fused to green fluorescent protein (Syp-GFP) (25) revealed that these cells extend a broad, regularly branched axonal arbor, containing many pre-synaptic specializations (Fig. 3, D and E). Cells with similar morphologies have been described in other vertebrate species (26). Strikingly, these superficial interneurons (SINs) showed a robust response only to the full screen, not to small moving bars (Fig. 3, F and G; 2.27 ± 0.32%; P < 1.34 × 10⁻⁴; A→P: 0.21 ± 0.14%; P→A: 0.09 ± 0.16%; P = 0.42; n = 6). We conclude that SINs are tuned to large stimuli.
Fig. 3.
GABAergic identity and size tuning of superficial interneurons. (A) Gad67 in situ hybridization in the tectum at 5 days post-fertilization (dpf). Black arrows indicate expression in SINs. (B) GABA (red) and GCAMP1.6 (green) immunoreactivity in the tectum of a 7 dpf Gal4s1156t, UAS:GCaMP1.6 larva. White arrows indicate colocalization (yellow) of GABA and GCaMP1.6. Nuclei counterstained in blue with DAPI. (C) Fluorescent signal in Gal4s1156t, UAS:GCaMP1.6 larva. ROI is demarcated by a green dashed line. The neuropil boundary is a white dashed line. (D and E) In vivo confocal image of single SIN expressing cytoplasmic DsRed (red) and synaptophysin-GFP (Syp-GFP, green). Top view (maximum projection of image stack) is in (D); side view (50° rotation of image stack) in (E). Dashed line indicates location of skin above the surface of the tectum. (F) Responses to visual stimuli in a Gal4s1156t, UAS:GCaMP1.6 larva. (G) Maximum average responses (n = 4). Scale bars, 50 μm in (A) and (C), 30 μm in (D) and (E). Error bars indicate SEM.
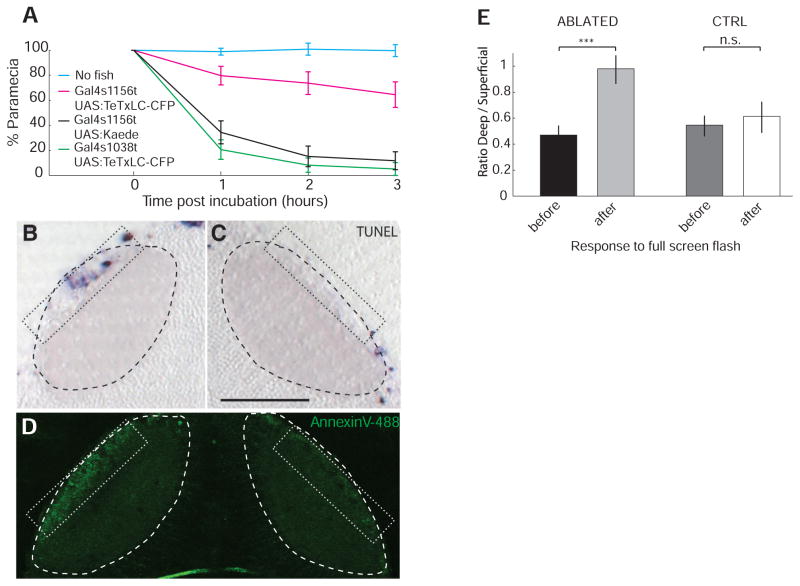
The SINs may provide feedforward inhibition of PVNs. If so, their removal from the circuit should alter the tuning of PVNs and should impair a behavior that relies on this circuit property. We blocked synaptic transmission in the SINs by driving tetanus toxin light chain fused to cyan fluorescent protein (TeTxLC-CFP) (27) in Gal4s1156t. Double-transgenic larvae captured far fewer paramecia than controls (Fig. 4A), whereas their optomotor behavior was unaffected (fig. S6). Blocking transmission from the small number of PVPNs in Gal4s1038t did not reduce prey capture rates. Using the pan-tectum Gal4s1013t line (2), we generated a fish expressing both the genetically encoded photosensitizer KillerRed (28) and GCaMP1.6 in both PVNs and SINs. To selectively kill the SINs, we illuminated the SO with an intense green laser (563 nm). Terminal deoxynucleotidyl transferase– mediated deoxyuridine triphosphate nick end labeling (TUNEL) staining and in vivo annexin V labeling showed apoptotic cells only in the targeted region (9.5 ± 1.8 TUNEL+ cells per section on the ablated SO versus 1.0 ± 0.6 TUNEL+ cells per section on the control side, P < 0.05; 4.5 ± 1.0 TUNEL+ cells in the SPV of the ablated tectum versus 4.0 ± 0.4 in the control SPV, P = 0.5) (Fig. 4, B to D). After photo-ablation of SINs, Ca2+ responses in the PVNs to a full-screen flash were equalized across the neuropil layers (Fig. 4E; deep-to-superficial ratio = 0.47 ± 0.8 before illumination versus deep-to-superficial ratio = 0.98 ± 0.11 after; P < 10−3 after illumination, n = 4). No significant change in response ratios was observed in the tectum contralateral to the illumination (before: deep-to-superficial ratio = 0.55 ± 0.8; after: deep-to-superficial ratio = 0.61 ± 0.12; P = 0.38).
Fig. 4.
Prey capture and PVN Ca2+ responses after silencing or removal of SINs. (A) Prey capture is reduced in Gal4s1156t, UAS:TeTxLC-CFP larvae, but not in Gal4s1038t, UAS:TeTxLC-CFP, relative to control (n = 10 for each genotype). (B and C) TUNEL staining detects KillerRed-induced, localized apoptosis in 7-dpf Gal4s1013t, UAS:KillerRed, UAS:GCaMP1.6 larva after targeted illumination of the SO (B). Contralateral tectum served as control (C). Dotted rectangle indicates targeted area in (B) and control area in (C), where apoptosis was scored. Dashed outlines indicate neuropil boundary. (D) Illuminated region (left) shows elevated staining with annexin V relative to control (right). Dotted rectangles indicate regions where apoptosis was assessed. (E) Ratios of maximum responses to full-screen flash in Gal4s1013t, UAS:KillerRed, UAS:GCaMP1.6 larvae before and after photo-ablation of SINs. Ratio is about 1 in the illuminated tectum and half in control (CTRL). Scale bars, 50 μm. ***P < 0.001 (t test). Error bars indicate SEM.
Together, our findings support a contribution of SINs to the neural mechanism that filters visual inputs in the tectum. In one possible scheme (fig. S7), which is supported by the morphologies of PVN cell types (2, 5), SINs make GABAergic contacts with some PVINs, which in turn convey this information to the dendritic arbors of PVPNs. Thus, the visual information flows from superficial to deep through a neural filter that subtracts low-frequency spatial information. This circuit may support prey capture by allowing the animal to track a moving object against a background that changes uniformly in brightness or is composed of low spatial frequencies. Given that the mammalian superior colliculus has similar layer-specific spatial filtering properties (1, 12), it seems likely that this circuitry is evolutionarily conserved among vertebrates.
Supplementary Material
Acknowledgments
We thank W. Staub for care of animals, T. Müller for the gad67 probe, K. Kawakami for Tol2 and TeTxLC-CFP reagents, L. Garner for advice on the visual setup, and J. Nakai for the GCaMP1.6 vector. F.D.B. and C.W. were supported, respectively, by a Human Frontier Science Program long-term postdoctoral fellowship and a Marie Curie Outgoing International Fellowship (with CNRS UMR5020 “Neurosciences Sensorielles, Comportement Cognition,” Lyon, France). E.R. was supported by an NSF postdoctoral fellowship. This work was funded by the NIH Nanomedicine Development Center for the Optical Control of Biological Function (PN2 EY018241, E.Y.I. and H.B.), NSF/FIBR 0623527 (E.Y.I.), a Sandler Opportunity Award (H.B.), the Byers Basic Science Award (H.B.), and NIH grants R01 EY012406 and R01 NS053358 (H.B.).
Footnotes
References and Notes
- 1.Isa T. Curr Opin Neurobiol. 2002;12:668. doi: 10.1016/s0959-4388(02)00387-2. [DOI] [PubMed] [Google Scholar]
- 2.Scott EK, Baier H. Front Neural Circuits. 2009;3:13. doi: 10.3389/neuro.04.013.2009. [DOI] [PMC free article] [PubMed] [Google Scholar]
- 3.Vanegas H, Laufer M, Amat J. J Comp Neurol. 1974;154:43. doi: 10.1002/cne.901540104. [DOI] [PubMed] [Google Scholar]
- 4.Meek J, Schellart NA. J Comp Neurol. 1978;182:89. doi: 10.1002/cne.901820107. [DOI] [PubMed] [Google Scholar]
- 5.Nevin LM, Robles E, Baier H, Scott EK. BMC Biol. 2010;8:126. doi: 10.1186/1741-7007-8-126. [DOI] [PMC free article] [PubMed] [Google Scholar]
- 6.Sato T, Hamaoka T, Aizawa H, Hosoya T, Okamoto H. J Neurosci. 2007;27:5271. doi: 10.1523/JNEUROSCI.0883-07.2007. [DOI] [PMC free article] [PubMed] [Google Scholar]
- 7.Xiao T, Roeser T, Staub W, Baier H. Development. 2005;132:2955. doi: 10.1242/dev.01861. [DOI] [PubMed] [Google Scholar]
- 8.Nevin LM, Taylor MR, Baier H. Neural Develop. 2008;3:36. doi: 10.1186/1749-8104-3-36. [DOI] [PMC free article] [PubMed] [Google Scholar]
- 9.Gahtan E, Tanger P, Baier H. J Neurosci. 2005;25:9294. doi: 10.1523/JNEUROSCI.2678-05.2005. [DOI] [PMC free article] [PubMed] [Google Scholar]
- 10.Roeser T, Baier H. J Neurosci. 2003;23:3726. doi: 10.1523/JNEUROSCI.23-09-03726.2003. [DOI] [PMC free article] [PubMed] [Google Scholar]
- 11.Portugues R, Engert F. Curr Opin Neurobiol. 2009;19:644. doi: 10.1016/j.conb.2009.10.007. [DOI] [PMC free article] [PubMed] [Google Scholar]
- 12.Dräger UC, Hubel DH. Nature. 1975;253:203. doi: 10.1038/253203a0. [DOI] [PubMed] [Google Scholar]
- 13.Niell CM, Smith SJ. Neuron. 2005;45:941. doi: 10.1016/j.neuron.2005.01.047. [DOI] [PubMed] [Google Scholar]
- 14.Sajovic P, Levinthal C. Neuroscience. 1982;7:2407. doi: 10.1016/0306-4522(82)90204-4. [DOI] [PubMed] [Google Scholar]
- 15.Bollmann JH, Engert F. Neuron. 2009;61:895. doi: 10.1016/j.neuron.2009.01.018. [DOI] [PMC free article] [PubMed] [Google Scholar]
- 16.Ramdya P, Engert F. Nat Neurosci. 2008;11:1083. doi: 10.1038/nn.2166. [DOI] [PMC free article] [PubMed] [Google Scholar]
- 17.Ramdya P, Reiter B, Engert F. J Neurosci Methods. 2006;157:230. doi: 10.1016/j.jneumeth.2006.04.021. [DOI] [PubMed] [Google Scholar]
- 18.Sumbre G, Muto A, Baier H, Poo MM. Nature. 2008;456:102. doi: 10.1038/nature07351. [DOI] [PMC free article] [PubMed] [Google Scholar]
- 19.Smear MC, et al. Neuron. 2007;53:65. doi: 10.1016/j.neuron.2006.12.013. [DOI] [PMC free article] [PubMed] [Google Scholar]
- 20.Scott EK, et al. Nat Methods. 2007;4:323. doi: 10.1038/nmeth1033. [DOI] [PubMed] [Google Scholar]
- 21.Baier H, Scott EK. Curr Opin Neurobiol. 2009;19:553. doi: 10.1016/j.conb.2009.08.001. [DOI] [PMC free article] [PubMed] [Google Scholar]
- 22.Ohkura M, Matsuzaki M, Kasai H, Imoto K, Nakai J. Anal Chem. 2005;77:5861. doi: 10.1021/ac0506837. [DOI] [PubMed] [Google Scholar]
- 23.Tian L, et al. Nat Methods. 2009;6:875. doi: 10.1038/nmeth.1398. [DOI] [PMC free article] [PubMed] [Google Scholar]
- 24.Zerucha T, et al. J Neurosci. 2000;20:709. doi: 10.1523/JNEUROSCI.20-02-00709.2000. [DOI] [PMC free article] [PubMed] [Google Scholar]
- 25.Meyer MP, Smith SJ. J Neurosci. 2006;26:3604. doi: 10.1523/JNEUROSCI.0223-06.2006. [DOI] [PMC free article] [PubMed] [Google Scholar]
- 26.Vanegas H. Comparative Neurology of the Optic Tectum. Plenum; New York: 1984. [Google Scholar]
- 27.Asakawa K, et al. Proc Natl Acad Sci USA. 2008;105:1255. doi: 10.1073/pnas.0704963105. [DOI] [PMC free article] [PubMed] [Google Scholar]
- 28.Bulina ME, et al. Nat Biotechnol. 2006;24:95. doi: 10.1038/nbt1175. [DOI] [PubMed] [Google Scholar]
Associated Data
This section collects any data citations, data availability statements, or supplementary materials included in this article.


