Abstract
Background
Hepatocellular carcinoma (HCC) is one of the most common malignancies in South East Asia. Although activation of the MEK-MAPK is often associated with cellular growth, the role of MEK-MAPK in growth and survival of hepatocarcinoma cells has not been established.
Methods
Immuno-histochemistry was used to localize phosphorylated MAPK and MEK1/2 in the tissues. 3-(4,5-Dimethylthiazol-2-y1)-2,5-diphenyltetrazolium bromide (MTT) assay and ELISA were used to determine cell viability and cell proliferation. Deoxynucleotidyl transferase-mediated dUTP nick-end labeling (TUNEL) assay was used to detect apoptotic cells. Western blots analysis was performed to determine the levels of proteins involved in the MEK-MAPK and apoptotic pathways. Transfection study was performed to assess the role of MEK-MAPK pathway in growth and survival of liver cancer cells.
Results
We report that phosphorylation of MEK1/2 at Ser217/221 was detected by immuno-histochemistry in 100% (46 of 46) of HCCs examined. A positive signal was localized in the nuclei of hepatocarcinoma cells but not in dysplastic hepatocytes or stromal cells. Over-expression and phosphorylation of MAPK was also detected in 91% (42 of 46) and 69% (32 of 46) of HCCs examined, respectively. The percentage of cells showing positively for phosphorylated MEK1/2 increased with advancing tumor stage. In vitro, treatment of human HepG2 and Hep3B cells with MEK1/2 specific inhibitors U0126 and PD98059 led to growth inhibition and apoptosis. U0126 induced the release of cytochrome c and increased the cleavage of caspase-3, caspase-7, and poly ADP-ribose polymerase (PARP). Inhibition of phosphatidylinositol 3-kinase (PI-3K), c-Jun N-terminal kinase (JNK) and p38 kinase activities caused only a mild apoptosis in HepG2 and Hep3B cells. Activated MEK1-transfected cells were more resistant to UO126-induced apoptosis in vitro and formed larger tumors in SCID mice than mock-transfected cells.
Conclusion
In conclusion, our results demonstrate that MEK-MAPK plays an important role in the growth and survival of liver cancer cells and suggest that blocking MEK-MAPK activity may represent an alternative approach for the treatment of liver cancer.
Background
HCC is one of the most common malignancies in South East Asia. The incidence of HCC is between 250,000 to 1,2 million cases per year [1,2]. The disease is associated with environmental exposure to hepatitis B virus, hepatitis C virus, and Aflatoxin B1 [1,2]. Treatment outcomes for HCC have remained generally poor. The majority of the patients with HCC have inoperable disease with a very poor prognosis [3]. Five-year survival rate is limited to 15 to 39% after surgery [4,5]. Long-term survival is uncommon because of the frequency of recurrence in the form of metastases or the development of new primaries [6,7]. There are also not currently accepted adjuvant or palliative treatment modalities that have been conclusively shown to prolong survival in HCC [8].
Several lines of evidence indicate that HCC may be the result of inactivation of tumor suppressor genes, activation of multiple oncogenes and over-expression of growth factors. More than 20 cellular genes have been identified to be associated with HCC (Reviewed in [9]). They include Ras, c-myc, c-fos and c-jun, rho, transforming growth factor-α, hepatocyte growth factor and c-met, c-ErbB-2, u-plasminogen activator, MXR7, MDM2, MAGE, matrix metalloproteinase, Smads, p53, pRB, p16INK4, p21WAF1/CIP1, p27Kip1, PTEN, E-cadherin, β-catenin, AXIN1 and HCCA1. We recently reported [10] that insulin-like growth factor (IGF) II (IGF-II) is over-expressed in approximately 39% of HCC samples. In addition, IGF binding protein 3 (IGFBP-3) is either undetectable (28.5%) or low (71.5%) in HCCs examined compared with adjacent benign liver (ABL) tissues.
One of the most frequent targets downstream of receptor and non-receptor tyrosine kinases and the ras family of GTP-binding proteins is the MEK-MAPK signal transduction pathway [11,12]. Elevated levels of constitutively activated MEK1 are seen frequently in carcinoma cell lines [13,14]. Constitutive MEK1 activation contributes to cell survival (Reviewed in [12]), migration [15], transformation of fibroblasts and epithelial cells [16-18]. Studies with small molecule inhibitors of MEK activity [19,20]. demonstrate a role for MEK in mediating expression of proteinases implicated in invasion and metastasis [21,22], and disruption of normal epithelial morphology [23,24]Treatment of HepG2 with PD98059 resulted in apoptosis [25]. No substrates of MEK have been identified other than p44/42 MAPK (Reviewed in [26]). Increased MAPK (ERK1/2) and MEK1/2 expression and p42 MAPK in 5 HCC samples has been reported [27]. Treatment of cells with various growth factors produces activation of MEK1/2 and its downstream target, MAPK, resulting in proliferation, differentiation and survival
(Reviewed in [12]). Activation of MAPK regulates the activities of a number of substrates including transcription factor p62TCF (Elk-1), c-myc, ATF2 and AP-1 components, c-Jun and c-fos [20]. MAPK is also involved in nuclear transport, nucleosome assembly, and cytoskeletal regulation [28]. The tight selectivity of MEK1/2, coupled with its unique ability to phosphorylate both tyrosine and threonine residues of MAPK, indicates that this kinase is essential in integrating signals into the MAPK pathway. Thus, MEK1/2 represents an excellent target for pharmacological intervention in proliferative disease [19,29,30]. Several MEK-MAPK anticancer drugs are currently in clinical trials [31].
In this study, we report that the protein MEK1/2 is activated in 100% of HCCs examined. Tumor cells were the main sites of activated MEK1/2 and MAPK proteins within HCCs and not the surrounding non-neoplastic tissues. Over-expression and hyperphosphorylation of MAPK were detected in 91% and 69% of HCCs examined, respectively. Treatment of HepG2 and Hep3B cells with U0126 led to a time and dose-dependent reduction in cell proliferation and apoptosis. Over-expression of activated MEK1 in HepG2 enhanced tumor growth in vivo and conferred resistance to U0126-induced apoptosis in vitro. Our data suggest that blocking MEK-MAPK activities may represent a novel approach for the treatment of HCC.
Experimental Procedures
Reagents
U0126, PD98059 and LY294002 were supplied by New England Biolabs, Beverly, MA. p38 kinase inhibitor SB203580 and JNK inhibitor SP600125 were purchased from Calbiochem, San Diego, CA. They were dissolved in dimethylsulfoxide (DMSO) with the final concentration of 20 mM and stored frozen under light-protected conditions at -20°C. Antibodies against α-tubulin, rabbit anti-p38 kinase, rabbit anti-phospho-p38 kinase (Tyr182), rabbit anti-JNK-2, rabbit anti-phospho-JNK (Thr183/Tyr185), mouse anti-cytochrome c, mouse anti-MAPK, rabbit anti-Akt-1 and MEK-1 were obtained from Santa Cruz Biotechnology, Santa Cruz, CA. Anti-cleaved form-specific caspase-7 (20 kDa), caspase-3 and caspase-9, rabbit anti-phospho Akt-1 (Ser473), phospho-specific anti-MEK1/2 (Ser217/221), phospho-specific anti-MAPK (Thr202/Tyr204), and cleaved PARP (89 kDa) antibodies were obtained from Cell Signaling Technology, Beverly, MA. Horseradish peroxidase-conjugated secondary antibodies were supplied by Pierce, Rockford, Illinois. The chemiluminescent detection system was supplied by Amersham, Pharmacia Biotech, Arlington Heights, IL. 96-well plates, tissue culture petri-dishes and 8-chamber slides were from Nunc Inc., Naperville, IL. Cell Proliferation ELISA, BrdU (colorimetric), In Situ Cell Death Detection Kit and Fluorescein were supplied by Roche Diagnostics Corporation, Indianapolis, IN.
Patients and tissue samples
Prior written informed consent was obtained from all patients and the study received ethics board approval at the National Cancer Centre of Singapore as well as the Singapore General Hospital. Tissue samples were obtained intra-operatively from tumors and ABL tissues during liver resection for HCC in 46 patients at the Singapore General Hospital. 14 of 46 resected samples had single tumor and 32 of 46 had two tumors. The samples were snap frozen in liquid nitrogen and stored at -80°C until analysis. A similar set of samples was fixed in 10% formalin and paraffin embedded. The diagnosis of HCC was confirmed histologically in all cases.
Staging of tumors was performed using the TNM system [32]. In addition, every tumor was examined macroscopically and microscopically for capsule formation, satellite nodules, multiplicity and necrosis. Dysplasia and cirrhosis in the surrounding liver tissue were noted. 15 of 46 tumors were associated with cirrhosis. Within 15 cirrhotic HCCs, 12 showed dysplastic changes in adjacent non-neoplastic tissue. Multifocality was defined as multiple small uniformly sized tumors that likely represented independent primary tumors [33]. This is distinguished from satellites, which were defined as tumor nodules, smaller than the main tumor mass, located within a maximum distance of 2 cm. The term multiplicity was used for both multifocal tumors and for multiple intrahepatic metastasis from a single primary tumor that were situated further than 2 cm from the edge of the main tumor mass.
Immunohistochemical analysis and assessment
For immunohistochemical analysis of MEK1/2 and MAPK or Ki-67, sections (5 μM thick) were cut, dewaxed, rehydrated and antigen retrieval as described [10]. After blocking endogenous peroxidase activity and reducing nonspecific background staining, the sections were incubated with the primary antisera against phosphorylated MEK1/2 (Ser217/221) or phosphorylated MAPK (Thr202/Tyr204) (overnight at 4°C). Immunohistochemistry was performed using the streptavidin-biotin peroxidase complex method, according to the manufacturer's instructions (Lab Vision, Fremont, CA) using AEC as the chromogen. Sections known to stain positively were incubated in each batch and negative controls were also prepared by replacing primary antibody with preimmune sera. Only nuclear immunoreactivity was considered positive. For phosphorylated MEK1/2, tumors were scored as 1 (<1.0% of tumor cells positive); 2 (1–5% of tumor cells positive); 3 (5–10% of tumor cells positive) and 4 (>10% of tumor cells positive). To determine the rate of cellular proliferation in vivo, sections derived from tumor xenografts of mock-transfected and activated MEK1-tranfected HepG2 cells were stained with anti-Ki-67 antibody. Five hundred tumor cells were counted in randomly chosen fields at ×400 magnification. The Ki-67 labelling index was expressed as the number of clearly labelled Ki-67 reactive nuclei in 500 cells counted.
Cell viability and cell proliferation
Human hepatoma HepG2 and Hep3B cells were obtained from American Type Culture Collection (Rockville, Maryland) and maintained as monolayer cultures in Modified Eagle's Media (MEM) supplemented with 10% fetal bovine serum (growth medium). For study of proliferation, confluent cultures of cells were trypsinized and plated at a density of 2.0 × 10⁴ cells in 24-well plates with growth medium. After 48 h, the cell monolayer was rinsed twice with phenol-red-free-serum-free MEM (PSF) medium and incubated further in PSF medium for 24 h. After 24 h, various concentrations of U0126 (0, 2, 4, 6, 8 and 10 μM) or 10 μM LY294002 or 50 μM PD98059 or 5 μM SB203580 or 10 μM SP600125 in PSF medium were added and incubated for 24 h or 48 h. Cell viability and cell proliferation were determined by the MTT assay [34] and Cell Proliferation ELISA, Bromo-deoxyuridine (BrdU) kit (Roche) respectively as described by the manufacturer. Experiments were repeated at least 3 times, and the data were expressed as the mean ± SE.
Detection of apoptotic cells
HepG2 and Hep3B cells were grown in 8-chamber slides and treated with appropriate concentrations of U0126 in PSF medium for 48 h. Cells were fixed with phosphate buffer saline (PBS) containing 4% formalin solution for 1 hour at room temperature and washed with PBS. Apoptosis was detected by TUNEL assay using the In Situ Cell Death Detection Kit (Roche) as described by the manufacturer. Apoptotic cells were then visualized under fluorescent microscope equipped with an FITC filter. Labelling indices were obtained by counting cell number of labelled cells among at least 500 cells per region and expressed as a percentage values.
Preparation of mitochondria-free cytosol for detection of cytochrome c release
HepG2 or Hep3B were grown in the presence of indicated concentrations of U0126 or PD98059 or SB203580 or SP600125 in PSF medium for 24 h or 48 h. Cells were harvested, washed with ice-cold PBS. Mitochondria-free cytosol was prepared as described [35]. For detection of cytochrome c release, mitochondria-free cytosol was analyzed by Western blot analysis as described [10].
Western Blotting
Tissue lysates from HCCs and ABL tissues as well as cell lysate were prepared as previously described [10]. Tissue or cell lysate or mitochondria-free cytosol was subjected to Western blot analysis as previously described [10]. Blots were incubated with indicated primary antibodies and 1:7500 horseradish peroxidase-conjugated secondary antibodies. The blots were then visualized with a chemiluminescent detection system (Amersham) as described by the manufacturer.
Stable activated MEK1 cell lines
To examine whether activated MEK was associated with the growth and survival of liver cancer cells, HepG2 cells were transfected with 5 μg of the pUSE-MEK1 (S218D/S222D) or pUSE control plasmid DNA and 28 μl of Lipofectamine reagent (Life Technologies) following the manufacturer's recommendation. The pUSE-MEK1 (S218D/S222D) was the Ha-Tagged rat MEK1 (activated) cDNA (Upstate, Lake Placid, NY). The activating mutations were the substitutions of aspartic acid for serine at residues 218 and 222. Forty-eight hours post-transfection, cells were subcultured at a ratio of 1:10 and replaced with selective growth medium containing 800 μg/ml G418 (Calbiochem, La Jolla, CA). Four weeks post-transfection, individual clones were isolated, expanded and assayed for MEK1 expression by Western blot analysis using anti-HA tag antibody (1:1000 dilution). The phenotype of transfectants expressing activated MEK1 was compared with that of control pUSE plasmid. The proliferative behaviour of the clones and in vivo tumor formation were assayed.
For proliferation study, 2.5 × 10⁴ cells were seeded per well in 24-well plates containing MEM supplemented with 10% fetal bovine serum. Cell number was counted daily by hemocytometer for 5 days. Means were determined from quadruplicate wells and in no case did standard deviation exceed 15% of the mean value.
Tumorigenicity in SCID mice
Male SCID mice of 9–10 weeks of age were purchased from the Animal Resources Centre, Canning Vale, West Australia. All mice were maintained according to the "Guide for the Care and Use of Laboratory Animals" published by National Institute of Health, USA. They were provided with sterilized food and water ad libitum, and housed in negative pressure isolators with 12 h light/dark cycles. 5 × 10⁶ cells (2 mock-transfected clones, pUSE-9 and pUSE-12; and 2 activated MEK1-transfected clones, H-MEK1-15 and H-MEK1-17) were suspended in calcium free phosphate buffer saline and subcutaneously injected on both sides of the SCID mice. Tumor growth was monitored at least twice weekly by vernier caliper measurement of the length (a) and width (b) of tumor. Tumor volumes was calculated as (a × b2)/2. Eight animals per group were used in three sets of independent experiments. All mice were sacrificed when the tumors reached approximately 1 cm3. Tumors were harvested, fixed and paraffin embedded for determination of apoptosis and proliferation. Differences in tumor incidence number and tumor volume among groups were analyzed by ANOVA.
Statistical analysis
For quantitation analysis, the sum of the density of bands corresponding to protein blotting with the antibody under study was calculated, and the amount of α-tubulin normalized. For MAPK, phosphorylated MAPK, MEK1/2 and phosphorylated MEK1/2, the mean of densitometric scanning in the adjacent benign tissues and tumors was determined. To estimate the specific increase in MEK or MAPK phosphorylation, the ratio of pMEK1/2/ MEK and pMAPK/MAPK was calculated. Differences in cell number and the levels of protein under study were analyzed by ANOVA.
Results
Pathologic evaluation of the resected specimens showed cirrhosis without dysplasia (3 of 46) and with dysplasia (12 of 46) in adjacent non-neoplastic liver in 33% (15 of 46) patients. Multiplicity of tumors was detected in 32 cases (70%) with 2 or 3 HCC nodules. Satellite formation occurred in 26 (56%) patients. The overall observed 1-year disease-free survival rate of all patients was 74% (34 of 46). In this study, the median survival of all HCC patients studied and the 5-year survival rate was not calculated.
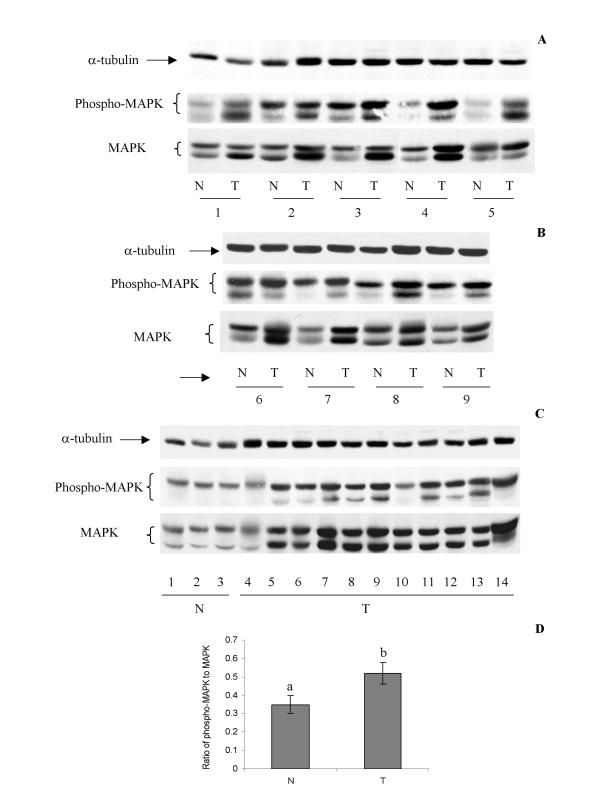
Since the MEK-MAPK pathway has been implicated in regulating cell growth and survival (Reviewed in [12]), the abundance of MAPK was determined in HCCs and ABL tissues. Figure 1 shows that the 42 and 44 kDa forms of MAPK were detected in both HCCs and ABL tissues. Elevation of MAPK was detected in 91% (42 of 46) of HCCs examined. Quantitative analysis revealed that HCCs had approximately 1.6-fold more MAPK than ABL tissues. When the blots were stripped and reblotted with anti-phosphorylated MAPK (active form of MAPK), 69% (32 of 46) of HCCs displayed increased staining as compared with ABL tissues (Fig. 1A, 1B &1C). The ratio of pMAPK/MAPK was significantly higher (p < 0.01) in HCCs as compared to ABL tissues as determined by ANOVA (Fig. 1D).
Figure 1.
MAPK protein and phosphorylated MAPK were markedly elevated in extract of HCCs as compared with ABL tissues. Human HCCs (T) and ABL tissues (N) were collected and tissue lysate was prepared as described under Experimental Procedures. Samples (100 μg protein/sample) were subjected to Western blot analysis as described [10]. Blots were incubated with mouse anti-MAPK and mouse anti-phospho-MAP kinase (Thr202/Tyr204) (A, B and C) (A, B and C) and mouse anti-α-tubulin antibodies. The ratio of phosphorylated MAPK to MAPK is shown in (D). Bars with different letters are significantly different from one another at p < 0.01 as determined by ANOVA test. All the samples in A &B are paired and samples in C are individual.
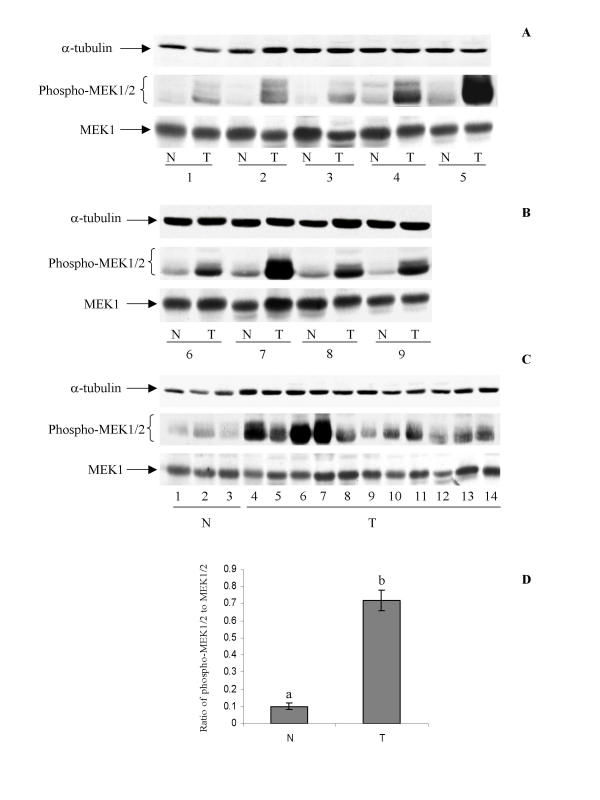
Since increased MAPK phosphorylation may reflect activation of MAPK via upstream signalling elements, the amount of phospho MEK1/2 was determined in tissue extracts from both HCCs and ABL tissues. Immunostaining of the blots displayed a marked increase in phosphorylated MEK1/2 (Fig. 2A, 2B &2C). While MEK 1/2 was heavily phosphorylated on serine 217/221 in 100% (46/46) of HCCs, ABL tissues of the same patients showed little phosphorylated MEK1/2 under the same conditions (Fig. 2A, 2B &2C). Approximately 7-fold increase in MEK1/2 phosphorylation was detected in HCC as compared with ABL tissues (Fig. 2D).
Figure 2.
Phosphorylated MEK1/2 was elevated in extract of HCCs as compared with ABL tissues. Human HCCs (T) and ABL tissues (N) were collected and tissue lysate was prepared as described in Experimental Procedures. Samples (100 μg protein/sample) were subjected to Western blot analysis as described [10]. Blots were incubated with rabbit anti-phospho-MEK1/2 (Ser217/221), mouse anti-α-tubulin and rabbit anti-MEK1 antibodies (A, B and C). The ratio of phosphorylated MEK1/2 to total MEK is shown in (D). Bars with different letters are significantly different from one another at p < 0.01 as determined by ANOVA test. All the samples in A &B are paired and samples in C are individual.
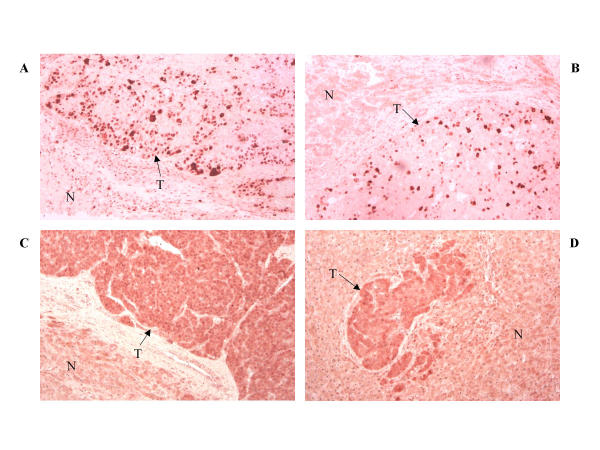
HCC tumors are heterogeneous with respect to cell-type, and therefore it was critical to identify the cell-type responsible for the elevation of phosphorylated MEK1/2 and MAPK. A total of 46 HCCs and their ABL tissues were examined by immunohistochemistry. An antibody specific for phosphorylated MEK1/2 at serine (Ser217/221) was used to stain the tissue sections. Figure 3A and 3B show that intense staining was observed only in the nuclei of cancerous hepatocytes, some of which underwent mitotic division. No nuclear staining was observed in adjacent benign hepatocytes (Fig. 3A &3B). Bile duct epithelial cells were uniformly negative, as were the fibrovascular stroma within cirrhotic livers. A summary of the immunohistochemical analysis of MEK1/2 phosphorylation in human HCCs is shown in table 1. The percentage of cells showing positively for phosphorylated MEK1/2 appears to increase with advancing tumor stage. When the above tissues were stained using phosphorylated MAPK at threonine 202 and tyrosine 204, a strong immunoreactivity of the tumor cells was observed in tumor nodules (Fig. 3C &3D). Surrounding benign hepatocytes were weakly positive for phosphorylated MAPK (Fig. 3C &3D).
Figure 3.
Immunohistochemical demonstration of phosphorylated MEK1/2 and MAPK in malignant and adjacent benign hepatocytes. Human HCCs (T) and ABL tissues (N) were collected and paraffin blocks were prepared as described under Experimental Procedures. 5 μm sections were subjected to immunohistochemical analysis as described under Experimental Procedures. The sections were stained with primary antibody to phospho-MEK1/2 (Ser217/221) (A &B) or mouse anti-phospho-MAP kinase (Thr202/Tyr204) (C &D) antibodies. Original magnification ×400.
Table 1.
A summary of immunohistochemical analysis of MEK1/2 and its phosphorylation at Ser217/221 in human HCC. Human HCCs (T) and adjacent benign liver (ABL) tissues (N) were collected, paraffin blocks were prepared and immunohistochemical analysis was performed as described under Experimental Procedures. Tissue sections were stained with anti-phospho-MEK1/2 (Ser217/221) antibody. Only nuclear immunoreactivity was considered positive. Sections were scored as 1 (<1.0% of tumor cells positive); 2 (1–5% of tumor cells positive); 3 (5–10% of tumor cells positive) and 4 (>10% of tumor cells positive).
| Genes examined | Normal adjacent Liver tissues (n = 46) | HCC Tumours (n = 46) | |||
| Stages | |||||
| I | II | III | IV | ||
| (n = 4) | (n = 25) | (n = 11) | (n = 6) | ||
| MEK 1/2 | 46/46 (100%) | 4/4 (100%) | 25/25 (100%) | 11/11 (100%) | 6/6 (100%) |
| Phosphorylated MEK 1/2 Score (% of positive cells) | 0/0 (0%) | ||||
| 1 (< 1.0) | 0 | 2/4 (50%) | 20/25 (80%) | 4/11 (36.36%) | 1/6 (16.67%) |
| 2 (1 – 5) | 0 | - | 4/25 (16%) | 4/11 (36/36%) | - |
| 3 (5 – 10) | 0 | 1/4 (25%) | 1/25 (4%) | 1/11 (9.09%) | 3/6 (50%) |
| 4 (>10) | 0 | 1/4 (25%) | - | 2/11 (18.19%) | 2/6 (33.33%) |
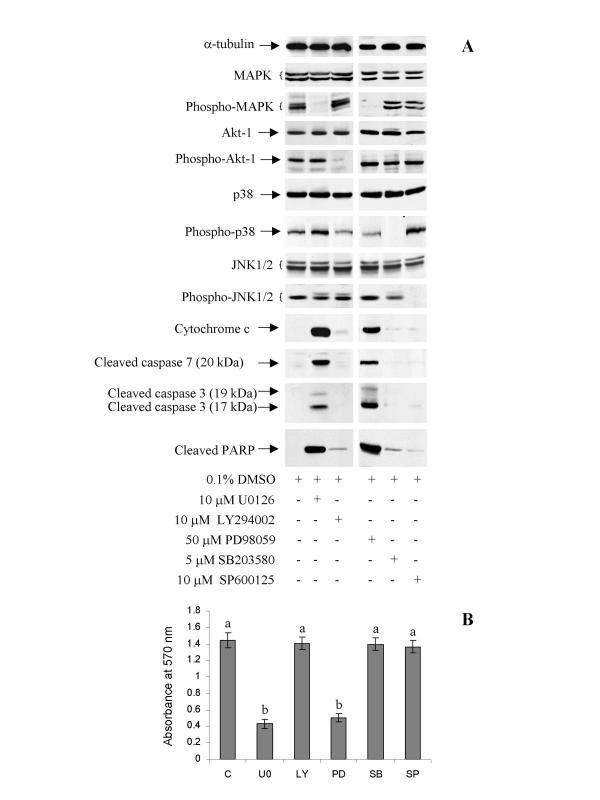
The immunohistochemistry and Western blot analysis of HCC samples suggested an important link between HCC and activation of the MEK-MAPK pathway. However, the role of MEK-MAPK activation in hepatogenesis and survival of hepatoma cells was not well understood. It has been shown that MEK-MAPK activation generally plays a critical role in cell proliferation and apoptosis (Reviewed in [12]). It was reasoned that MEK-MAPK activation in HCCs might enhance tumor cell proliferation and survival. To elucidate the role of MEK1/2 activation in the growth and survival of hepatocarcinoma cells, we challenged human HepG2 cells with either vehicle or 10 μM of highly selective MEK1/2 inhibitor U0126 or 50 μM of PD98059. To serve as controls, HepG2 cells were also treated with 5 μM of p38 kinase inhibitor SB203580 or 10 μM of JNK inhibitor SP600125 or 10 μM of PI-3 kinase inhibitor LY294002. Figure 4 demonstrates that U0126 and PD98059 inhibited phosphorylation of MAPK while SB203580, SP600125 and LY294002 effectively blocked phosphorylation of p38 kinase and JNK and Akt-1 respectively (Fig. 4A). While SB203580, SP600125 and LY294002 had a little effect on cell viability as determined by the MTT assay, both U0126 and PD98059 significantly decreased the cell viability in HepG2 cells (Fig. 4B). Similar effects were observed when Hep3B were used (data not shown).
Figure 4.
Effects of MEK1/2 inhibitor U0126 or PD98059, p38 kinase inhibitor SB203580, JNK inhibitor SP600125 and PI-3 kinase inhibitor LY294002 on cell viability, MAPK, Akt-1, phosphorylation of MAPK (Thr202/Tyr204), phosphorylation of Akt-1 (Ser473), p38 kinase, phosphorylation of p38 kinase (Tyr182), JNK, phosphorylation of JNK (Thr183/Tyr185), cytochrome c release, and cleavage of caspase 3, caspase 7 and PARP in HepG2 cells. Cells were grown and treated with 0.1% of DMSO (C) or 10 μM of U0126 (U0) or 10 μM of LY294002 (LY) or 50 μM of PD98059 (PD) or 5 μM of SB203580 (SB) or 10 μM of SP600125 (SP) in phenol red free serum free MEM (PSF) medium for 48 h as described under Experimental Procedures. Total cell lysate (for detection of all proteins except cytochrome c) or mitochondria free cytosol (detection of cytochrome c) from HepG2 (A) cells was subjected to Western blot analysis as described under Experimental Procedures. Blots containing total cell lysate were incubated with mouse anti-α-tubulin, mouse anti-phospho-MAPK (Thr202/Tyr204), rabbit anti-Akt-1, rabbit anti-phospho Akt-1 (Ser473), rabbit anti-p38, rabbit anti-phospho-p38 (Tyr182), rabbit anti-JNK1/2, rabbit anti-phospho-JNK1/2 (Thr183/Tyr185), rabbit anti-caspase-3, rabbit anti-cleaved caspase-7 (20 kDa), rabbit anti-cleaved PARP antibodies. Blots containing mitochondria free cytosol were blotted with mouse anti-cytochrome c antibody. All the antibodies were used at a final concentration of 1 μg per ml. (B) Cell viability of HepG2 following different treatments was analyzed by MTT assay as described under Experimental Procedures. Bars with different letters are significantly different from one another at (p < 0.01) as determined by ANOVA test. The results represent the mean of 3 experiments ± SE is shown.
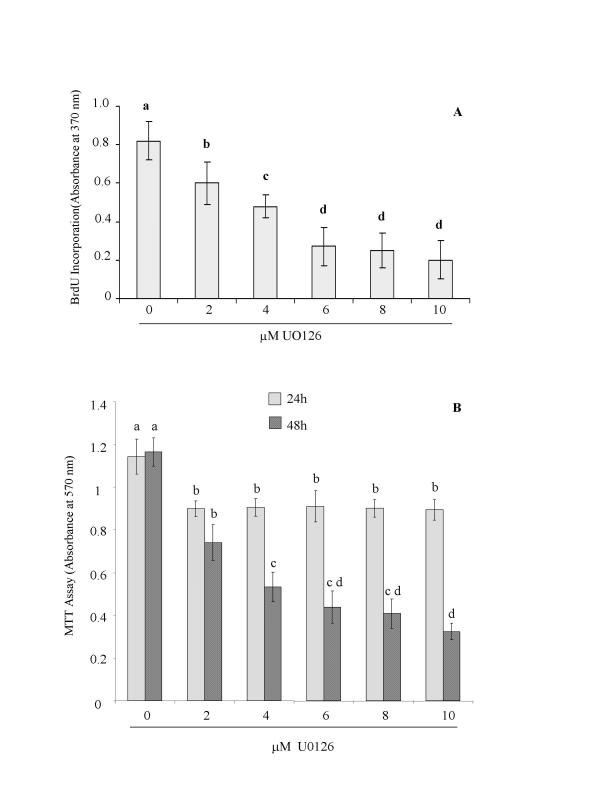
Because HepG2 and Hep3B cells responded similarly to U0126 or PD98059, subsequent experiments were mainly performed on HepG2 cells. For the time-course and dose-response experiments, HepG2 cells were treated with 0, 2, 4, 6, 8 and 10 μM U0126 in serum free medium for 24 h and 48 h. Cell viability and cell growth were then assessed by the MTT assay and BrdU incorporation, respectively. Figure 5 shows that U0126 caused a dose-dependent reduction in cell growth and viability. Significant inhibition in cell viability was observed as early as 24 hours post-treatment. The effects were more pronounced and dose-dependent at 48 h of treatment (Fig. 5B). Fifty-percent inhibitions in cell growth and viability were detected at a dose of 4 μM U0126. The influence of U0126 on cell growth and viability occurred at the dose expected to suppress phosphorylation of MAPK (Fig. 8). Another hepatoma cell line of human origin PLC/PRF/S was also inhibited by U0126 treatment in a similar manner (data not shown).
Figure 5.
Effects of U0126 on HepG2 cell viability and proliferation. HepG2 cells were grown and treated with 0.1% DMSO or escalating doses of U0126 in PSF medium. Cell proliferation and cell viability were determined by BrdU incorporation and MTT assay, respectively as described under Experimental Procedures. HepG2 cell proliferation at 48-h (A) and cell viability at 24 and 48 h (B) are shown. Experiments were performed in quadruplicate, with the results reflecting the mean of the quadruplicate of each group. Bars with different letters are significantly different from one another at (p < 0.01) as determined by ANOVA test. The results represent the mean of 3 experiments ± SE is shown.
Figure 8.
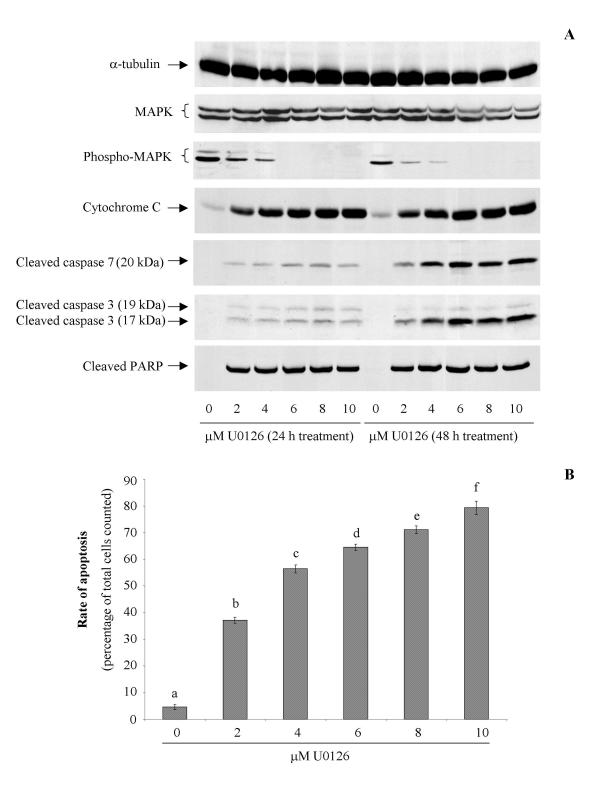
Effects of MEK1/2 inhibitor U0126 on MAPK, phospho-MAPK (Thr202/Tyr204), cytochrome c release, and cleavage of caspase 3, caspase 7 and PARP in HepG2 cells. HepG2 cells were cultured as described under Experimental Procedures. Cells were incubated with PSF medium containing 0.1% DMSO or indicated concentrations of U0126 for 24 h or 48 h. Total cell lysate (for detection of cleaved caspase 3, cleaved caspase 7, cleaved PARP, and α-tubulin) or mitochondria free cytosol (for detection of cytochrome c) was prepared for Western blot analysis as described under Experimental Procedures (A). Blots containing cell lysate were incubated with mouse anti-α-tubulin, mouse anti-MAPK, mouse anti-phospho-MAPK (Thr202/Tyr204), rabbit anti-caspase 3, rabbit anti-cleaved caspase 7, rabbit anti-cleaved PARP antibodies. Blots containing mitochondria free cytosol were blotted with mouse anti-cytochrome c antibody. All the antibodies were used at a final concentration of 1 μg per ml. Apoptotic cells were determined by TUNEL assay 48 h post-UO126 treatment as described under Experimental Procedures. Apoptotic cells were expressed as a percentage of total cells counted (B). Representative samples are shown.
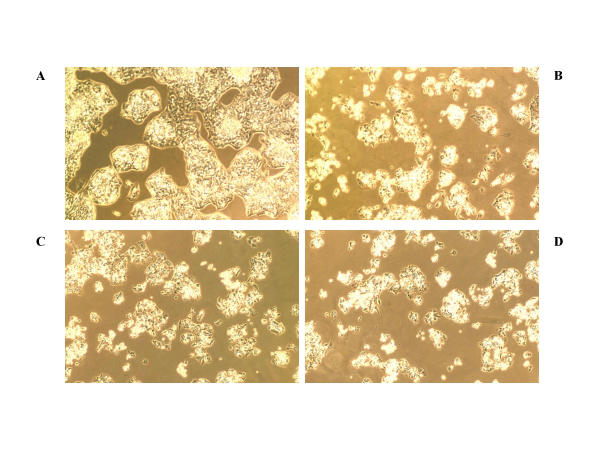
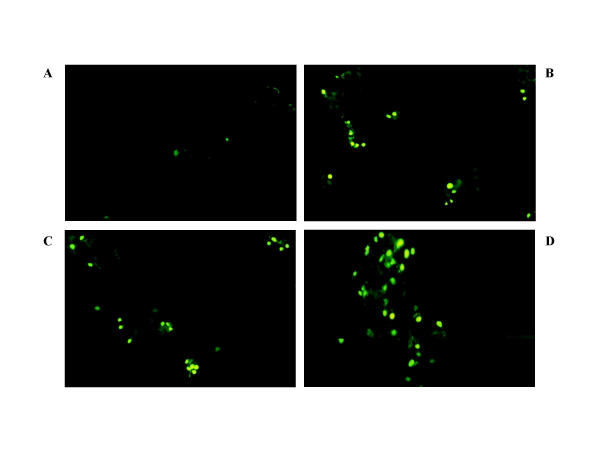
Phase-contrast photomicrographs revealed that U0126-treated HepG2 cells displayed typical features of apoptosis: shrinkage of cytoplasm and membrane blebbing (Fig. 6). To assess if the cell death observed above represented apoptosis, TUNEL assay was performed. While LY294002, SB203580 and SP600125 caused a little cell death (data not shown), U0126 induced apoptosis in a dose-dependent manner (Fig. 7 &8B).
Figure 6.
Effects of U0126 on HepG2 cell morphology. HepG2 cells were grown and treated with either 0.1% DMSO or 3 doses of U0126 in PSF medium for 48 h as described under Experimental Procedures. Bright field views of cells treated with 0.1% DMSO (A) or 2 (B), 4 (C), and 6 (D) μM of U0126 for 48 hours. Representative samples are shown. Original magnification, ×200.
Figure 7.
Induction of apoptosis by U0126 treatment in HepG2 cells. HepG2 cells were grown and treated with either 0.1% DMSO (A) or 2 (B), 4 (C) and 6 (D) μM of U0126 in PSF medium for 48 h. Apoptotic cells were determined by TUNEL assay as described under Experimental Procedures. Apoptotic cells in 0.1% DMSO and U0126-treated samples were visualized under a fluorescent microscope. Representative samples are shown. Original magnification, ×200.
Since cytochrome c release plays a major role in mediating apoptosis in several experimental systems [36-38], we determined whether U0126-induced apoptosis in HepG2 cells was associated with cytochrome c release in the cytoplasm. Figures 4 shows that levels of cytochrome c in the cytoplasm of HepG2 cells were significantly increased following U0126 or PD98059 treatment. Since the proteolytic cleavage of caspase-3 and caspase-7 plays a central role in PARP cleavage during apoptosis [39], we investigated whether this apoptosis machinery was activated upon U0126 or PD98059 treatment. The activation of these two caspases and cleaved PARP were determined by Western blot analysis using antibodies capable of detecting cleaved caspase-3, caspase-7 and PARP. Cleaved caspase-7 and cleaved caspase-3 fragments were detectable at 24 and 48 hours of U0126 treatment and increased in a dose-dependent manner (Fig. 8A). The cleaved caspase-7 and -3 were detected at similar time course as PARP cleavage (Fig. 8A). In contrast, blocking PI-3 kinase, p38 kinase and JNK activities by LY294002, SB20358 and SP600125 respectively abolished the phosphorylation of Akt-1, p38 kinase and JNK without affecting the levels of cleaved caspase-3 and -7 (Fig. 4A). Furthermore, the levels of cytochrome c released from mitochondria and PARP cleavage were only slightly elevated following LY294002 or SB20358 or SP600125 treatment (Fig. 4A) indicating that MEK-MAPK but not PI-3 kinase or p38 or JNK plays a critical role in HepG2 cell survival under serum deprivation.
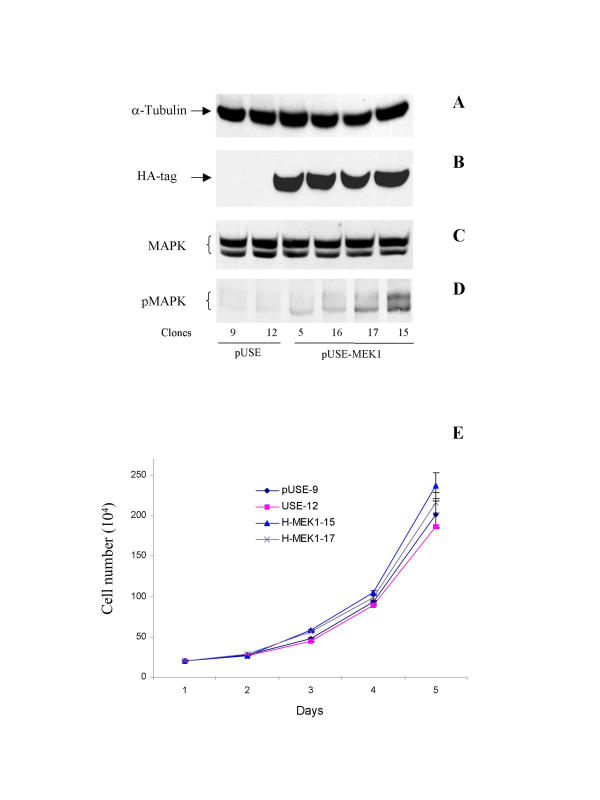
Since our in vitro study indicated that MEK1/2 activity was required for the survival of liver cancer cells, transfection studies were performed to determine whether over-expression of MEK-MAPK would protect cells from U0126-induced apoptosis and enhance tumor growth in vivo. HepG2 cells were transfected with Ha-Tagged rat MEK1 (activated) cDNA. The activating mutations were the substitutions of aspartic acid for serine at residues 218 and 222. As shown in figure 9B, HA-MEK1 expression was detected in representative transfected clones (H-MEK1-5, H-MEK1-15, H-MEK1-16 and H-MEK1-17). Basal levels of phosphorylated MAPK were also higher in activated MEK1-transfected clones compared with mock pUSE-transfected clones, pUSE-9 and pUSE-12 (Fig 9D). Since the MEK-MAPK pathway has been implicated in regulating cell growth (Reviewed in [12]), the proliferative behavior of H-MEK1-15, H-MEK1-17, pUSE-9 and pUSE-12 clones was evaluated by determining cell number on plastic dishes daily for 5 days. As shown in figure 9E, there was no significant increase in cell number in activated MEK1-transfectant cells compared with mock-transfected cells. The results suggest that over-expression of activated MEK1 did not alter growth rate of HepG2 cells in culture.
Figure 9.
Western blot analysis for levels of HA-MEK1 and phosphorylated MAPK and in vitro growth of transfectant clones. For detection of HA-MEK1 and phosphorylated MAPK, mock-transfectant (pUSE-9 and pUSE-12) and activated MEK1-transfectant (H-MEK1-5, H-MEK1-15, H-MEK1-16 and H-MEK1-17) clones were grown and total cell lysate was prepared for Western blot analysis as described under Experimental Procedures. Blots were incubated with mouse anti-α-tubulin (A), rabbit anti-HA-MEK1 (B), mouse anti-MAPK (C), mouse anti-phospho-MAPK (Thr202/Tyr204) antibodies (D). All the antibodies were used at a final concentration of 1 μg per ml. For proliferation study, pUSE-9, pUSE-12, H-MEK1-15, H-MEK1-17 clones were seeded at a density of 2.5 × 10⁴ cells per well in 24-well plates containing MEM supplemented with 10% fetal calf serum. (E) Cell number was counted daily by hemocytometer for 5 days and is plotted against number of days. Means were determined from quadruplicate wells and in no case did standard deviation exceed 15% of the mean value.
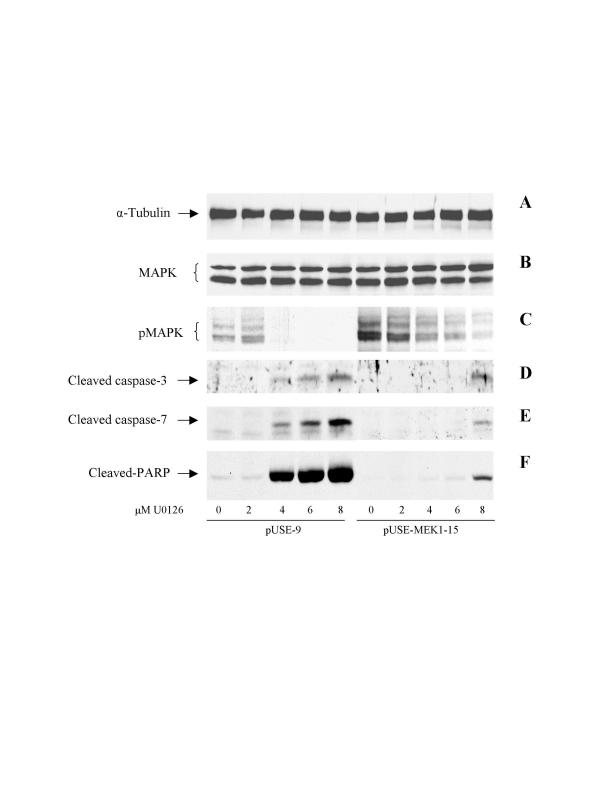
Since constitutive MEK1 activation contributes to cell survival (Reviewed in [12]), we wished to determine if constitutive activation of MEK-MAPK in HepG2 cells would make the cells more resistant to U0126-induced apoptosis. Mock-transfectant pUSE-9 and activated MEK1-15 clones were selected for this study. They were treated with 0, 2, 4, 6 and 8 μM U0126 for 24 h. Because cleaved caspase-3 and -7 and PARP has been proposed as one of the events in the execution phase of apoptosis, the levels of cleaved caspase-3, -7 and PARP were used as markers for apoptosis. As shown in figures 10, cleaved caspase-3, -7 and PARP were readily detected in pUSE-9 cells at a dose as low as 4 μM. In contrast, these apoptotic markers were not detected in the H-MEK-15 cells at low doses of U0126. They became visible only at a dose of 8 μM. Similar results were obtained when the H-MEK1-17 clone was used (data not shown). These results further supported the important role of activated MEK-MAPK in the survival of liver cancer cells.
Figure 10.
Effects of MEK1/2 inhibitor U0126 on MAPK, phospho-MAPK (Thr202/Tyr204), and cleavage of caspase 3, caspase 7 and PARP in pUSE-9 and H-MEK1-15 clones. pUSE-9 and H-MEK1-15 cells were cultured as described under Experimental Procedures. Cells were incubated with PSF medium containing 0.1% DMSO or indicated concentrations of U0126 for 24 h. Total cell lysate was prepared for Western blot analysis as described under Experimental Procedures. Blots containing total cell lysate were incubated with mouse anti-α-tubulin (A), mouse anti-MAPK (B), mouse anti-phospho-MAPK (Thr202/Tyr204) (C), rabbit anti-caspase 3 (D), rabbit anti-cleaved caspase 7 (E), rabbit anti-cleaved PARP (F) antibodies. All the antibodies were used at a final concentration of 1 μg per ml. Representative blots are shown.
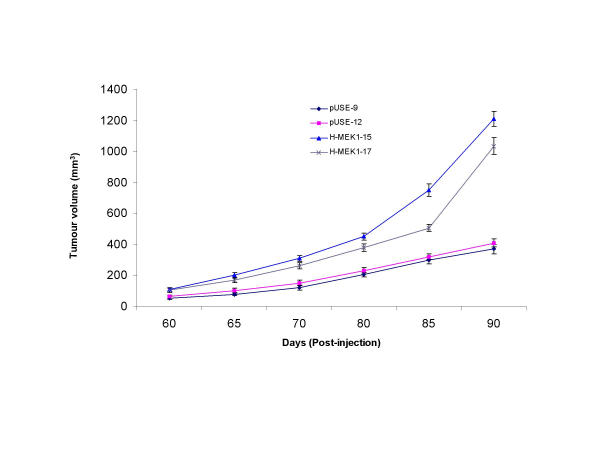
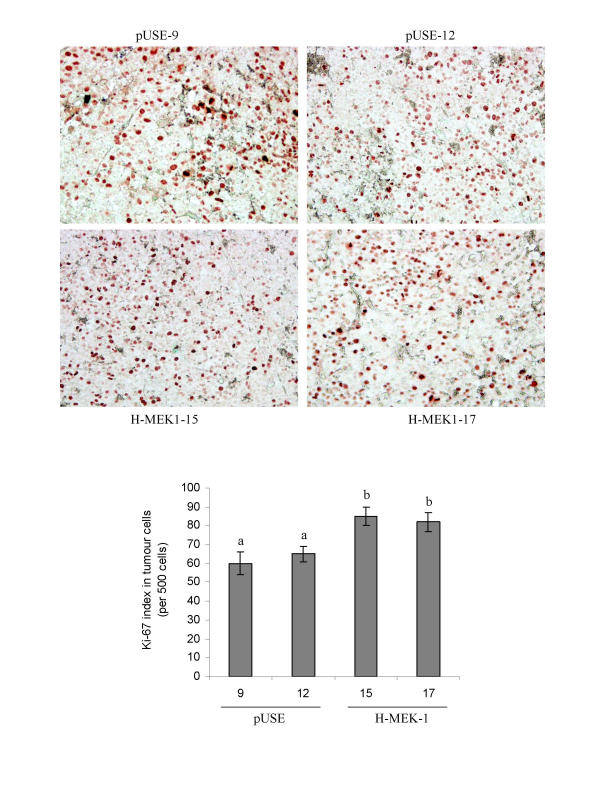
To test the neoplastic behaviour of activated MEK1 cells in vivo, mock-transfected pUSE-9 and pUSE-12 and activated MEK1-transfected pMEK1-15 and pMEK1-17 clones were injected in the flanks of SCID mice. Tumor formation was detected in 40–45 and 55–60 days for activated MEK1-transfected (H-MEK-15, H-MEK-17) and mock-transfected (pUSE-9, pUSE-12) clones respectively. By day 60, tumor incidence was 100% in both mock-transfected clones (pUSE-9 and pUSE-12) and two activated MEK1 clones (H-MEK1-15 and H-MEK1-17). However, both the H-MEK1-15 and H-MEK1-17 clones grew much faster than the pUSE-9 and pUSE-12 clones (Fig. 11). The final tumor volume was 270 ± 30 mm3 and 309 ± 25 mm3 for pUSE-9 and pUSE-12 mock transfected clones respectively and 1,210 ± 49 mm3 and 1,034 ± 54 mm3 for H-MEK1-15 and H-MEK1-17 clones respectively. Differences in tumor volume between mock-transfected and activated MEK1-transfected clones were statistically significant at p < 0.01 as analyzed in the ANOVA-test. To determine whether the increased growth rate of HepG2-MEK1 tumors was due to increase in cell proliferation, Ki-67 labelling index was performed. As shown in figure 12, the Ki-67 labelling index was slightly but significantly higher in HepG2-MEK-1 than HepG2-mock tumors (p < 0.05). The results suggest that over-expression of activated MEK1 enhances the survival and to a lesser extent, the proliferation of HepG2 cells in vivo.
Figure 11.
In vivo growth of activated MEK1 tranfected cells. Mock transfected (pUSE-9 and pUSE-12) and activated MEK1 (H-MEK1-15 and H-MEK1-17) clones were subcutaneously injected on both flanks of male SCID mice as described under Experimental Procedures. Tumor growth was measured and calculated as described under Experimental Procedures. Tumor volume at a given time for mock transfected clones and activated MEK1-transfected clones is plotted and shown. Differences in tumor volume between mock-transfected and activated MEK1-transfected clones were statistically significant at p < 0.01 as analyzed by ANOVA test.
Figure 12.
Immunostaining of Ki-67 in HepG2-mock (pUSE-9 and pUSE-12) and HepG2-MEK1 (H-MEK1-15 and H-MEK1-17) tumors. pUSE-9, pUSE-12 H-MEK1-15 and H-MEK1-17 clones were subcutaneously injected on both flanks of male SCID mice as described under Experimental Procedures. Tumors were harvested, fixed, paraffin embedded and immunohistochemical analysis was performed as described under Experimental Procedures. The sections were stained with mouse anti-Ki-67 antibody (A). For each clone, 500 cells were counted in randomly chosen fields at 400 × magnification. The Ki-67 labelling index was expressed as the number of clearly labelled Ki-67 reactive nuclei in 500 cells counted (B). Differences in Ki-67 labelling index between HepG2-mock and HepG2-MEK1-tumours were statistically significant at p < 0.05 as analyzed by ANOVA test. Original magnification × 400.
Discussion
Molecular genetic and biochemical studies of HCC have revealed abundant evidence for aberrant growth factor signalling, thus implicating downstream signalling pathways in HCC pathogenesis. Immunohistochemical application of a phospho-state specific antibody MEK1/2 and MAPK enables the morphological imaging of dynamic intratumor signalling events. Using phospho-specific MEK1/2 antibody we demonstrate significant activation of MEK1/2 in 100% (46 of 46) of HCC tumors at both early and late stages of malignancy. Only tumor cells exhibit elevated MEK1/2 phosphorylation. Consistent patterns of selective activation in tumor cells suggest that activation of MEK1/2 may contribute to the neoplastic liver phenotype. This in vivo analysis of active MEK1/2 and MAPK in human HCCs, reported herein, reveals sharply elevated activities of these proteins. The activation of MAPK observed in HCCs could not be ascribed solely to phosphorylation of the protein. Immunoblotting reveals a marked increase in the amount of MAPK in 91% (42 of 46) of HCCs when compared with adjacent benign liver tissues. The results are consistent with an early observation by Schmidt et al. [27] who demonstrated that MAPK expression and p42 MAPK activity were significantly higher in 5 HCCs examined as compared with 5 adjacent normal control tissues. Treatment of human liver cancer cells with MEK1/2 inhibitor U0126 or PD98059, which inhibits MEK-MAPK activation, leads to a time- and dose-dependent reduction in cell proliferation and viability. Our data are in agreement with previous study [25] showing that in vitro treatment of HepG2 with MEK inhibitor PD98059 resulted in apoptosis. Furthermore, over-expression of activated MEK1 in HepG2 enhances tumor growth in vivo and confers resistance to U0126-induced apoptosis implicating the requirement of MEK-MAPK activity for liver cancer cells to survive and tumor growth in vivo. Although the etiology and pathogenesis of HCC remain unclear, our observation suggests a role for the MEK-MAPK regulatory network. It remains to be determined to what extent MEK-MAPK represents a common point of activation by agents promoting HCC cell proliferation or whether MEK-MAPK is itself a critical element in the etiology or pathogenesis of HCC.
The presence of highly activated MEK1/2 in high grade HCCs suggests that MEK activation may tie into malignant progression of liver cancer. In the present study, we show that over-expression of activated MEK1 in HepG2 cells does not alter the growth rate of HepG2 cells in vitro. However, over-expression of activated MEK1 enhances tumor growth in vivo and confers drug resistance in vitro. This is in agreement with early studies demonstrating that transient expression of active MEK1 into HepG2 prevented apoptosis in serum-deprived condition [25]. Because the in vitro growth rate is similar between pUSE-transfected cells and activated MEK1-tranfected cells, susceptibility to apoptosis and low basal MAPK phosphorylation may explain in part by the slower growth of the mock-transfected cells than activated MEK1-transfected cells in SCID mice. We also noticed that both HepG2-mock and HepG2-MEK1-transfected cells grew slowly for the first 40 days in SCID mice, then HepG2-MEK1 tumors grew faster. The long latent period in tumors expressing an active MEK1 may reflect a need of MEK1-expressing cells to generate neovascularization or may be due to low basal level of MAPK phosphorylation and weak induction that active MEK1 induces.
In the present study, the more focal pattern of MEK-MAPK observed in HCC nodules may reflect local autocrine/paracrine signalling. It has been observed that paclitaxel [40] or cisplatin [41] preferentially induced phosphorylation of p42 MAPK (ERK2) while phosphorylation of p44 MAPK was found during EGF- [42], PDGF- [29] and arachidonic acid- [43] induced MAPK activation. Thus, the widespread activation of MEK1/2 and phosphorylation of p44 MAPK (ERK1) observed in HCCs could reflect constitutive activation mediated by absence of growth inhibitor [10] or over-expression of ras [44], IGF-II [10], TGF-α [45], HGF, c-met [46], and Shc [47]. Activation of MEK-MAPK by autocrine/paracrine growth factors may help the cells to survive even in the presence of limited nutrients and to increase the secretion of angiogenic factors from the tumor cells [48,49]In vivo, these angiogenic factors then stimulate neovascularization, which is essential for growth, survival, invasion and metastasis of liver cancer cells.
In the present study, activated MAPK is predominantly localized in the cytoplasm. It has been reported that MAPK has cytoplasmic substrate in addition to the better-characterized nuclear transcription factors [50,51]. Potential cytoplasmic substrates of MAPK include cytoskeletal elements and regulatory enzymes, including microtubule-associated proteins and myosin light chain kinase. [52,53] Thus, our observation of significant cytoplasmic activated MAPK in neoplastic cells suggests possible nontranscriptional roles, such as the regulation of cytoarchitecture and cell motility.
In the present study we are unable to co-localize activated MAPK and MEK1/2. While phosphorylated MEK1/2 was localized in mitotic cells (those with nuclear phosphorylated MEK1/2 immunolabelling), phosphorylated MAPK is found in every cell in the tumor nodule. Furthermore, activated MAPK is detected only in 69% (32 of 46) of HCCs examined, while activated MEK1/2 is in 100% of tumors. This observation is consistent with a previous report [54] showing absent or diminished MAPK phosphorylation in mitotic tumor cells. It is also possible that changes in MAPK phosphorylation are rapid. The time from the tumor removal to the time when the tumor is frozen or fixed may have been too long. This may explain our failure to co-localize activated MAPK in certain tumor samples.
Although it is well documented that apoptosis is also regulated by the Bcl-2 family of proteins [55], we do not detect any significant changes in the levels of Bax, Bad, Bcl-2 and Bcl-xL followed by U0126 treatment (data not shown). Previous studies have shown that p90Rsk is activated by the MEK-MAPK [56-60]. Activated p90Rsk can phosphorylate Bad and prevent its proapoptotic activity [61]. Furthermore, blocking p90Rsk activity by over-expression of a catalytically inactive form of p90Rsk enhanced Fas-mediated cell death [61]. Using anti-phospho-specific Bad (Ser122) and Bad (Ser136) antibodies, we observed that blocking MEK1/2 activity did not alter the levels of Bad phosphorylation at Serine 112 and Serine 136 (data not shown). Therefore, it is unlikely that alterations of Bcl-2 family of proteins or phosphorylation of Bad are responsible for apoptosis seen in HepG2 and Hep3B cells following U0126 treatment.
Although activated Akt-1 exerts an anti-apoptotic effect against various stimuli [62] and confers resistance to chemotherapeutic drugs [63], blocking the phosphorylation of Akt by LY294002 only causes mild apoptosis in HepG2 and Hep3B cells. The results indicate that at least under our experimental conditions, Akt activity does not play a significant role in the survival of liver cancer cells in serum-deprived condition. In vivo the tumor cells may depend on more than one survival pathway. Interaction with extracellular matrices in vivo allows the tumor cells to activate other survival pathways such as fibronectin-FAK-JNK [64], which also plays an important role in the survival of tumor cells.
In mammalian cells, there are at least two pathways involved in apoptosis. One involves caspase 8, which is recruited by the adapter molecule Fas/APO-1 associated death domain protein to death receptors upon extracellular ligand binding [65,66]. The other involves cytochrome c release-dependent activation of caspase 9 through Apaf-1 [37,38]. We did not observe any changes in either Fas or FasL expression in U0126-treated HepG2 and Hep3B cells. We did, however, observe an increase in cleaved caspase 3, cleaved caspase 7, cleaved PARP and cytoplasmic cytochrome c in U0126 treated cells indicating that cytochrome c release following U0126 treatment may be responsible for the activation of both caspase 7 and 3 which, in turn, induce apoptosis. This hypothesis is supported by Germain et al. [67] who demonstrate that activation of caspase 7 is involved in cleavage of PARP and apoptosis.
In summary, we have shown that high expression levels of MAPK, phosphorylated MAPK and phosphorylated MEK1/2 are found in tumors of HCC patients. Treatment of liver cancer cells with MEK inhibitor U0126, leads to growth inhibition and apoptosis in vitro. Over-expression of activated MEK1 enhances tumor growth in vivo and confers resistance to U0126-induced apoptosis. Our data point to the role(s) of activated MEK1/2 and MAPK in hepatocarcinoma cell survival and tumor growth, and the potential use of MEK1/2 inhibitors in treatment of HCC.
List of abbreviations
Hepatocellular carcinoma, HCC; mitogen-activated protein kinase, MAPK; mitogen-activated protein kinase kinase, MEK; poly ADP-ribose polymerase, PARP; phosphatidylinositol 3-kinase, PI-3K; insulin-like growth factor, IGF; insulin-like growth factor II, IGF-II; IGF binding protein 3, IGFBP-3; c-Jun N-terminal kinase, JNK; adjacent benign liver, ABL; dimethylsulfoxide, DMSO; Modified Eagle's Media, MEM; phenol-red-free-serum-free MEM, PSF; [3-(4,5-Dimethylthiazol-2-y1)-2,5-diphenyltetrazolium bromide], MTT; Bromo-deoxyuridine, BrdU; terminal deoxynucleotidyl transferase-mediated dUTP nick-end labelling, TUNEL.
Competing Interests
This work was supported by National Cancer Centre Tissue Repository and grants from National Medical Research Council of Singapore (NMRC/0541/2001), SingHealth Cluster Research Fund (EX 008/2001), A*STAR-BMRC (LS/00/017) and A*STAR-BMRC (LS/00/019) to Huynh Hung.
Authors' contributions
HH performed immunohistochemistry, transfection study and in vitro tumorigenicity in addition to the drafting of the manuscript. SKC and CP contributed the HCC tissues and some clinical data required for this study. TPH performed the pathological classification and staging of tumor samples. NTTT and TE performed cell culture and western blot analysis. All authors read and approved the final manuscript.
Pre-publication history
The pre-publication history for this paper can be accessed here:
Acknowledgments
Acknowledgements
We thank Dr. John Robertson for his critical review of the manuscript.
Contributor Information
Hung Huynh, Email: cmrhth@nccs.com.sg.
Thi Thanh Tuyen Nguyen, Email: cmrnttt@nccs.com.sg.
Kah-Hoe Pierce Chow, Email: gsupc@sgh.com.sg.
Puay Hoon Tan, Email: gpttph@sgh.com.sg.
Khee Chee Soo, Email: admskc@nccs.com.sg.
Evelyne Tran, Email: cmrhth@nccs.com.sg.
References
- Hussain SA, Ferry DR, El Gazzaz G, Mirza DF, James ND, McMaster P, Kerr DJ. Hepatocellular carcinoma. ann oncol. 2001;12:161–172. doi: 10.1023/A:1008370324827. [DOI] [PubMed] [Google Scholar]
- Ince N, Wands JR. The increasing incidence of hepatocellular carcinoma. N Engl J Med. 1999;340:798–799. doi: 10.1056/NEJM199903113401009. [DOI] [PubMed] [Google Scholar]
- Okuda K, Ohtsuki T, Obata H, Tomimatsu M, Okazaki N, Hasegawa H, Nakajima Y, Ohnishi K. Natural history of hepatocellular carcinoma and prognosis in relation to treatment. Study of 850 patients. Cancer. 1985;56:918–928. doi: 10.1002/1097-0142(19850815)56:4<918::aid-cncr2820560437>3.0.co;2-e. [DOI] [PubMed] [Google Scholar]
- Lai EC, Fan ST, Lo CM, Chu KM, Liu CL, Wong J. Hepatic resection for hepatocellular carcinoma. An audit of 343 patients. Ann Surg. 1995;221:291–298. doi: 10.1097/00000658-199503000-00012. [DOI] [PMC free article] [PubMed] [Google Scholar]
- Takenaka K, Kawahara N, Yamamoto K, Kajiyama K, Maeda T, Itasaka H, Shirabe K, Nishizaki T, Yanaga K, Sugimachi K. Results of 280 liver resections for hepatocellular carcinoma. Arch Surg. 1996;131:71–76. doi: 10.1001/archsurg.1996.01430130073014. [DOI] [PubMed] [Google Scholar]
- Huguet CSFaGA. Primary hepatocellular cancer: Western experience. In: Blumgart L, editor. Surgery of the Liver and Billary Tract. London: Churchill Livingstone; 2000. pp. 1365–1369. [Google Scholar]
- Lai EaWJ. Hepatocellular carcinoma: the Asian experience. In: Blumgart L, editor. Surgery of the Liver and the Biliary Tract. London: Churchill Livingstone; 1994. pp. 1349–1363. [Google Scholar]
- Chan ES, Chow PK, Tai B, Machin D, Soo K. Neoadjuvant and adjuvant therapy for operable hepatocellular carcinoma. Cochrane Database Syst Rev. 2000:CD001199. doi: 10.1002/14651858.CD001199. [DOI] [PubMed] [Google Scholar]
- Zeng JZ, Wang HY, Chen ZJ, Ullrich A, Wu MC. Molecular cloning and characterization of a novel gene which is highly expressed in hepatocellular carcinoma. Oncogene. 2002;21:4932–4943. doi: 10.1038/sj.onc.1205652. [DOI] [PubMed] [Google Scholar]
- Huynh H, Chow PK, Ooi LL, Soo KC. A possible role for insulin-like growth factor-binding protein-3 autocrine/paracrine loops in controlling hepatocellular carcinoma cell proliferation. Cell Growth Differ. 2002;13:115–122. [PubMed] [Google Scholar]
- Lewis TS, Shapiro PS, Ahn NG. Signal transduction through MAP kinase cascades. Adv Cancer Res. 1998;74:49–139. doi: 10.1016/s0065-230x(08)60765-4. [DOI] [PubMed] [Google Scholar]
- Ballif BA, Blenis J. Molecular mechanisms mediating mammalian mitogen-activated protein kinase (MAPK) kinase (MEK)-MAPK cell survival signals. Cell Growth Differ. 2001;12:397–408. [PubMed] [Google Scholar]
- Hoshino R, Chatani Y, Yamori T, Tsuruo T, Oka H, Yoshida O, Shimada Y, Ari-i S, Wada H, Fujimoto J, Kohno M. Constitutive activation of the 41-/43-kDa mitogen-activated protein kinase signaling pathway in human tumors. Oncogene. 1999;18:813–822. doi: 10.1038/sj.onc.1202367. [DOI] [PubMed] [Google Scholar]
- Amundadottir LT, Leder P. Signal transduction pathways activated and required for mammary carcinogenesis in response to specific oncogenes. Oncogene. 1998;16:737–746. doi: 10.1038/sj.onc.1201829. [DOI] [PubMed] [Google Scholar]
- Krueger JS, Keshamouni VG, Atanaskova N, Reddy KB. Temporal and quantitative regulation of mitogen-activated protein kinase (MAPK) modulates cell motility and invasion. Oncogene. 2001;20:4209–4218. doi: 10.1038/sj.onc.1204541. [DOI] [PubMed] [Google Scholar]
- Cowley S, Paterson H, Kemp P, Marshall CJ. Activation of MAP kinase kinase is necessary and sufficient for PC12 differentiation and for transformation of NIH 3T3 cells. Cell. 1994;77:841–852. doi: 10.1016/0092-8674(94)90133-3. [DOI] [PubMed] [Google Scholar]
- Mansour SJ, Matten WT, Hermann AS, Candia JM, Rong S, Fukasawa K, Vande Woude GF, Ahn NG. Transformation of mammalian cells by constitutively active MAP kinase kinase. Science. 1994;265:966–970. doi: 10.1126/science.8052857. [DOI] [PubMed] [Google Scholar]
- Montesano R, Soriano JV, Hosseini G, Pepper MS, Schramek H. Constitutively active mitogen-activated protein kinase kinase MEK1 disrupts morphogenesis and induces an invasive phenotype in Madin-Darby canine kidney epithelial cells. Cell Growth Differ. 1999;10:317–332. [PubMed] [Google Scholar]
- Dudley DT, Pang L, Decker SJ, Bridges AJ, Saltiel AR. A synthetic inhibitor of the mitogen-activated protein kinase cascade. Proc Natl Acad Sci U S A. 1995;92:7686–7689. doi: 10.1073/pnas.92.17.7686. [DOI] [PMC free article] [PubMed] [Google Scholar]
- Favata MF, Horiuchi KY, Manos EJ, Daulerio AJ, Stradley DA, Feeser WS, Van Dyk DE, Pitts WJ, Earl RA, Hobbs F, Copeland RA, Magolda RL, Scherle PA, Trzaskos JM. Identification of a novel inhibitor of mitogen-activated protein kinase kinase. J Biol Chem. 1998;273:18623–18632. doi: 10.1074/jbc.273.29.18623. [DOI] [PubMed] [Google Scholar]
- Liu E, Thant AA, Kikkawa F, Kurata H, Tanaka S, Nawa A, Mizutani S, Matsuda S, Hanafusa H, Hamaguchi M. The Ras-mitogen-activated protein kinase pathway is critical for the activation of matrix metalloproteinase secretion and the invasiveness in v-crk-transformed 3Y1. Cancer Res. 2000;60:2361–2364. [PubMed] [Google Scholar]
- Reddy KB, Krueger JS, Kondapaka SB, Diglio CA. Mitogen-activated protein kinase (MAPK) regulates the expression of progelatinase B (MMP-9) in breast epithelial cells. Int J Cancer. 1999;82:268–273. doi: 10.1002/(SICI)1097-0215(19990719)82:2<268::AID-IJC18>3.3.CO;2-W. [DOI] [PubMed] [Google Scholar]
- Chen Y, Lu Q, Schneeberger EE, Goodenough DA. Restoration of tight junction structure and barrier function by down-regulation of the mitogen-activated protein kinase pathway in ras- transformed Madin-Darby canine kidney cells. Mol Biol Cell. 2000;11:849–862. doi: 10.1091/mbc.11.3.849. [DOI] [PMC free article] [PubMed] [Google Scholar]
- Lu Q, Paredes M, Zhang J, Kosik KS. Basal extracellular signal-regulated kinase activity modulates cell-cell and cell-matrix interactions. Mol Cell Biol. 1998;18:3257–3265. doi: 10.1128/mcb.18.6.3257. [DOI] [PMC free article] [PubMed] [Google Scholar]
- Mitsui H, Takuwa N, Maruyama T, Maekawa H, Hirayama M, Sawatari T, Hashimoto N, Takuwa Y, Kimura S. The MEK1-ERK map kinase pathway and the PI 3-kinase-Akt pathway independently mediate anti-apoptotic signals in HepG2 liver cancer cells. Int J Cancer. 2001;92:55–62. doi: 10.1002/1097-0215(200102)9999:9999<::AID-IJC1143>3.3.CO;2-F. [DOI] [PubMed] [Google Scholar]
- Anderson NG, Maller JL, Tonks NK, Sturgill TW. Requirement for integration of signals from two distinct phosphorylation pathways for activation of MAP kinase. Nature. 1990;343:651–653. doi: 10.1038/343651a0. [DOI] [PubMed] [Google Scholar]
- Schmidt CM, McKillop IH, Cahill PA, Sitzmann JV. Increased MAPK expression and activity in primary human hepatocellular carcinoma. Biochem Biophys Res Commun. 1997;236:54–58. doi: 10.1006/bbrc.1997.6840. [DOI] [PubMed] [Google Scholar]
- Lewis TS, Hunt JB, Aveline LD, Jonscher KR, Louie DF, Yeh JM, Nahreini TS, Resing KA, Ahn NG. Identification of novel MAP kinase pathway signaling targets by functional proteomics and mass spectrometry. Mol Cell. 2000;6:1343–1354. doi: 10.1016/s1097-2765(00)00132-5. [DOI] [PubMed] [Google Scholar]
- Sebolt-Leopold JS, Dudley DT, Herrera R, Van Becelaere K, Wiland A, Gowan RC, Tecle H, Barrett SD, Bridges A, Przybranowski S, Leopold WR, Saltiel AR. Blockade of the MAP kinase pathway suppresses growth of colon tumors in vivo. Nat Med. 1999;5:810–816. doi: 10.1038/10533. [DOI] [PubMed] [Google Scholar]
- Alessi DR, Cuenda A, Cohen P, Dudley DT, Saltiel AR. PD 098059 is a specific inhibitor of the activation of mitogen- activated protein kinase kinase in vitro and in vivo. J Biol Chem. 1995;270:27489–27494. doi: 10.1074/jbc.270.46.27489. [DOI] [PubMed] [Google Scholar]
- Sebolt-Leopold JS. Development of anticancer drugs targeting the MAP kinase pathway. Oncogene. 2000;19:6594–6599. doi: 10.1038/sj.onc.1204083. [DOI] [PubMed] [Google Scholar]
- Spiessl B, Beahrs OH, Hermanek P, Hutter RVP, Scheibe O, Sobin LH, Wagner G. TNM – Atlas. Illustrated Guide to the TNM/pTNM Classification of Malignant Tumours. 104–111. 1992. Springer Verlag, Berlin Heidelberg New York. 1989. p. 357.
- Ishak KG, Goodman ZD, Stocker JT. Tumors of the liver and intrahepatic bile. Atlas of tumor pathology, Third Series. Armed Forces Institute of Pathology. 2001. pp. 199–230.
- Lim IJ, Phan TT, Song C, Tan WT, Longaker MT. Investigation of the influence of keloid-derived keratinocytes on fibroblast growth and proliferation in vitro. Plast Reconstr Surg. 2001;107:797–808. doi: 10.1097/00006534-200103000-00022. [DOI] [PubMed] [Google Scholar]
- Gewies A, Rokhlin OW, Cohen MB. Cytochrome c is involved in Fas-mediated apoptosis of prostatic carcinoma cell lines. Cancer Res. 2000;60:2163–2168. [PubMed] [Google Scholar]
- Green DR, Reed JC. Mitochondria and apoptosis. Science. 1998;281:1309–1312. doi: 10.1126/science.281.5381.1309. [DOI] [PubMed] [Google Scholar]
- Cai J, Yang J, Jones DP. Mitochondrial control of apoptosis: the role of cytochrome c. Biochim Biophys Acta. 1998;1366:139–149. doi: 10.1016/S0005-2728(98)00109-1. [DOI] [PubMed] [Google Scholar]
- Zou H, Li Y, Liu X, Wang X. An APAF-1.cytochrome c multimeric complex is a functional apoptosome that activates procaspase-9. J Biol Chem. 1999;274:11549–11556. doi: 10.1074/jbc.274.17.11549. [DOI] [PubMed] [Google Scholar]
- Cohen GM. Caspases: the executioners of apoptosis. Biochem J. 1997;326:1–16. doi: 10.1042/bj3260001. [DOI] [PMC free article] [PubMed] [Google Scholar]
- MacKeigan JP, Collins TS, Ting JP. MEK inhibition enhances paclitaxel-induced tumor apoptosis. J Biol Chem. 2000;275:38953–38956. doi: 10.1074/jbc.C000684200. [DOI] [PubMed] [Google Scholar]
- Wang X, Martindale JL, Holbrook NJ. Requirement for ERK activation in cisplatin-induced apoptosis. J Biol Chem. 2000;275:39435–39443. doi: 10.1074/jbc.M004583200. [DOI] [PubMed] [Google Scholar]
- Lobenhofer EK, Huper G, Iglehart JD, Marks JR. Inhibition of mitogen-activated protein kinase and phosphatidylinositol 3-kinase activity in MCF-7 cells prevents estrogen-induced mitogenesis. Cell Growth Differ. 2000;11:99–110. [PubMed] [Google Scholar]
- Hii CS, Ferrante A, Edwards YS, Huang ZH, Hartfield PJ, Rathjen DA, Poulos A, Murray AW. Activation of mitogen-activated protein kinase by arachidonic acid in rat liver epithelial WB cells by a protein kinase C-dependent mechanism. J Biol Chem. 1995;270:4201–4204. doi: 10.1074/jbc.270.9.4201. [DOI] [PubMed] [Google Scholar]
- Kim YC, Song KS, Yoon G, Nam MJ, Ryu WS. Activated ras oncogene collaborates with HBx gene of hepatitis B virus to transform cells by suppressing HBx-mediated apoptosis. Oncogene. 2001;20:16–23. doi: 10.1038/sj.onc.1203840. [DOI] [PubMed] [Google Scholar]
- Chung YH, Kim JA, Song BC, Lee GC, Koh MS, Lee YS, Lee SG, Suh DJ. Expression of transforming growth factor-alpha mRNA in livers of patients with chronic viral hepatitis and hepatocellular carcinoma. Cancer. 2000;89:977–982. doi: 10.1002/1097-0142(20000901)89:5<977::AID-CNCR6>3.0.CO;2-I. [DOI] [PubMed] [Google Scholar]
- Ueki T, Fujimoto J, Suzuki T, Yamamoto H, Okamoto E. Expression of hepatocyte growth factor and its receptor c-met proto- oncogene in hepatocellular carcinoma. Hepatology. 1997;25:862–866. doi: 10.1002/hep.510250413. [DOI] [PubMed] [Google Scholar]
- Pelicci G, Lanfrancone L, Salcini AE, Romano A, Mele S, Grazia BM, Segatto O, Di Fiore PP, Pelicci PG. Constitutive phosphorylation of Shc proteins in human tumors. Oncogene. 1995;11:899–907. [PubMed] [Google Scholar]
- Petit AM, Rak J, Hung MC, Rockwell P, Goldstein N, Fendly B, Kerbel RS. Neutralizing antibodies against epidermal growth factor and ErbB-2/neu receptor tyrosine kinases down-regulate vascular endothelial growth factor production by tumor cells in vitro and in vivo: angiogenic implications for signal transduction therapy of solid tumors. Am J Pathol. 1997;151:1523–1530. [PMC free article] [PubMed] [Google Scholar]
- Eliceiri BP, Klemke R, Stromblad S, Cheresh DA. Integrin alphavbeta3 requirement for sustained mitogen-activated protein kinase activity during angiogenesis. J Cell Biol. 1998;140:1255–1263. doi: 10.1083/jcb.140.5.1255. [DOI] [PMC free article] [PubMed] [Google Scholar]
- Marshall CJ. ERK/MAP kinase kinase kinase, ERK/MAP kinase kinase, and ERK/MAP kinase. Curr Opin Genet Dev. 1994;4:82–89. doi: 10.1016/0959-437x(94)90095-7. [DOI] [PubMed] [Google Scholar]
- Seger R, Krebs EG. The MAPK signaling cascade. FASEB J. 1995;9:726–735. [PubMed] [Google Scholar]
- Morishima-Kawashima M, Kosik KS. The pool of map kinase associated with microtubules is small but constitutively active. Mol Biol Cell. 1996;7:893–905. doi: 10.1091/mbc.7.6.893. [DOI] [PMC free article] [PubMed] [Google Scholar]
- Klemke RL, Cai S, Giannini AL, Gallagher PJ, de Lanerolle P, Cheresh DA. Regulation of cell motility by mitogen-activated protein kinase. J Cell Biol. 1997;137:481–492. doi: 10.1083/jcb.137.2.481. [DOI] [PMC free article] [PubMed] [Google Scholar]
- Mandell JW, Hussaini IM, Zecevic M, Weber MJ, VandenBerg SR. In situ visualization of intratumor growth factor signaling: immunohistochemical localization of activated ERK/MAP kinase in glial neoplasms. Am J Pathol. 1998;153:1411–1423. doi: 10.1016/S0002-9440(10)65728-8. [DOI] [PMC free article] [PubMed] [Google Scholar]
- Lotem J, Sachs L. Regulation of bcl-2, bcl-XL and bax in the control of apoptosis by hematopoietic cytokines and dexamethasone. Cell Growth Differ. 1995;6:647–653. [PubMed] [Google Scholar]
- Fan HY, Tong C, Lian L, Li SW, Gao WX, Cheng Y, Chen DY, Schatten H, Sun QY. Characterization of Ribosomal S6 Protein Kinase p90rsk During Meiotic Maturation and Fertilization in Pig Oocytes: Mitogen-Activated Protein Kinase-Associated Activation and Localization. Biol Reprod. 2003;68:968–977. doi: 10.1095/biolreprod.102.008839. [DOI] [PubMed] [Google Scholar]
- Wade CB, Dorsa DM. Estrogen activation of cyclic adenosine 5'-monophosphate response element-mediated transcription requires the extracellularly regulated kinase/mitogen-activated protein kinase pathway. Endocrinol. 2003;144:832–838. doi: 10.1210/en.2002-220899. [DOI] [PubMed] [Google Scholar]
- Boglari G, Szeberenyi J. Nuclear translocation of p90Rsk and phosphorylation of CREB is induced by ionomycin in a Ras-independent manner in PC12 cells. Acta Biol Hung. 2002;53:325–334. doi: 10.1556/ABiol.53.2002.3.9. [DOI] [PubMed] [Google Scholar]
- Brognard J, Dennis PA. Variable apoptotic response of NSCLC cells to inhibition of the MEK/ERK pathway by small molecules or dominant negative mutants. Cell Death Differ. 2002;9:893–904. doi: 10.1038/sj.cdd.4401054. [DOI] [PubMed] [Google Scholar]
- Sautin YY, Crawford JM, Svetlov SI. Enhancement of survival by LPA via Erk1/Erk2 and PI 3-kinase/Akt pathways in a murine hepatocyte cell line. Am J Physiol Cell Physiol. 2001;281:C2010–C2019. doi: 10.1152/ajpcell.00077.2001. [DOI] [PubMed] [Google Scholar]
- Bertolotto C, Maulon L, Filippa N, Baier G, Auberger P. Protein kinase C theta and epsilon promote T-cell survival by a rsk-dependent phosphorylation and inactivation of BAD. J Biol Chem. 2000;275:37246–37250. doi: 10.1074/jbc.M007732200. [DOI] [PubMed] [Google Scholar]
- Franke TF, Yang SI, Chan TO, Datta K, Kazlauskas A, Morrison DK, Kaplan DR, Tsichlis PN. The protein kinase encoded by the Akt proto-oncogene is a target of the PDGF-activated phosphatidylinositol 3-kinase. Cell. 1995;81:727–736. doi: 10.1016/0092-8674(95)90534-0. [DOI] [PubMed] [Google Scholar]
- Page C, Lin HJ, Jin Y, Castle VP, Nunez G, Huang M, Lin J. Overexpression of Akt/AKT can modulate chemotherapy-induced apoptosis. Anticancer Res. 2000;20:407–416. [PubMed] [Google Scholar]
- Almeida EA, Ilic D, Han Q, Hauck CR, Jin F, Kawakatsu H, Schlaepfer DD, Damsky CH. Matrix survival signaling: from fibronectin via focal adhesion kinase to c-Jun NH(2)-terminal kinase. J Cell Biol. 2000;149:741–754. doi: 10.1083/jcb.149.3.741. [DOI] [PMC free article] [PubMed] [Google Scholar]
- Muzio M, Stockwell BR, Stennicke HR, Salvesen GS, Dixit VM. An induced proximity model for caspase-8 activation. J Biol Chem. 1998;273:2926–2930. doi: 10.1074/jbc.273.5.2926. [DOI] [PubMed] [Google Scholar]
- Cryns V, Yuan J. Proteases to die for. Genes Dev. 1998;12:1551–1570. doi: 10.1101/gad.12.11.1551. [DOI] [PubMed] [Google Scholar]
- Germain M, Affar EB, D'Amours D, Dixit VM, Salvesen GS, Poirier GG. Cleavage of automodified poly(ADP-ribose) polymerase during apoptosis. Evidence for involvement of caspase-7. J Biol Chem. 1999;274:28379–28384. doi: 10.1074/jbc.274.40.28379. [DOI] [PubMed] [Google Scholar]


