

Abstract
Absolute levels of gene expression in bacteria are observed to vary over as much as six orders of magnitude. Thermodynamic models have been proposed as a tool to describe the expression levels of a given transcriptional circuit. In this context, it is essential to understand both the limitations and linear range of the different methods for measuring gene expression and to determine to what extent measurements from different reporters can be directly compared with one aim being the stringent testing of theoretical descriptions of gene expression. In this article, we compare two protein reporters by measuring both the absolute level of expression and fold-change in expression using the fluorescent protein EYFP and the enzymatic reporter β-galactosidase. We determine their dynamic and linear range and show that they are interchangeable for measuring mean levels of expression over four orders of magnitude. By calibrating these reporters such that they can be interpreted in terms of absolute molecular counts, we establish limits for their applicability: autofluorescence on the lower end of expression for EYFP (at ∼10 molecules per cell) and interference with cellular growth on the high end for β-galactosidase (at ∼20,000 molecules per cell). These qualities make the reporters complementary and necessary when trying to experimentally verify the predictions from the theoretical models.
Introduction
In recent years, our understanding of transcriptional regulation has increased dramatically. This is true both in terms of the number of regulatory circuits that have been dissected and of the precision with which they have been characterized (1–7). As illustrated in Fig. 1, quantitative measurements of gene expression have determined that the mean absolute level of expression of different promoters range over more than six orders of magnitude. The majority of gene products regulated under bacterial and viral promoters is present at levels from 0.1 to 105 molecules per cell.
Figure 1.
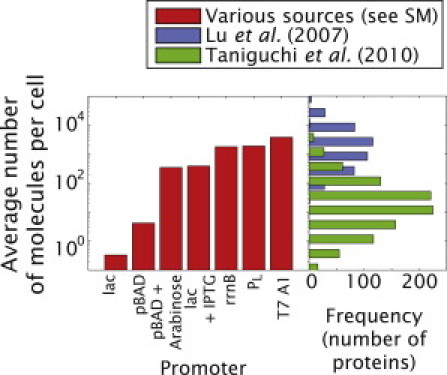
Gene expression levels in E. coli. (Red) The estimated absolute expression level of several bacterial and viral promoters obtained from the literature are shown (see the Supporting Material and Table S4 for the corresponding references and assumptions made to determine the level of expression). For comparison, the results from two recent cell censuses of E. coli are also shown as histograms of the number of proteins (7,69). Note that the range of expression spans greater than six orders of magnitude for a given set of measurements illustrating the wide dynamical range associated with bacterial promoters. The discrepancy between the two cell censuses of E. coli is further explored in Fig. S9.
In addition to being concerned with these absolute levels of expression, it is also of interest to know the range over which these promoters can be regulated. As shown in Fig. 2, C and D, the level of expression of a given promoter can in turn be regulated to vary over several more orders of magnitude. These results make it clear that a quantitative, genome-wide characterization of transcriptional regulation requires techniques with a broad dynamic range and for which the experimental uncertainties have been precisely characterized.
Figure 2.
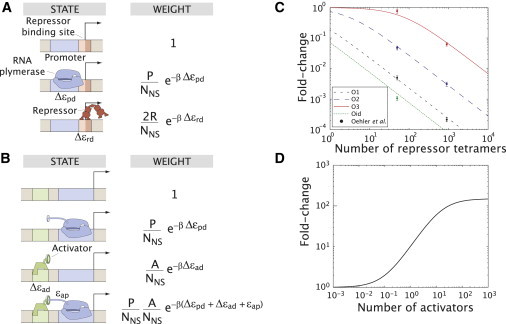
Fold-change of different regulatory motifs. The states and weights from the thermodynamic models are shown for the case of (A) simple repression by Lac repressor and (B) simple activation by CRP. The corresponding fold-change in gene expression as a function of transcription factor concentration predicted by the model is shown (C) for repression and (D) for activation. The fold-change values span over several orders of magnitude. Refer to Bintu et al. (12) for a derivation of the respective formulas and their parameters which are characteristic of bacterial promoters. The data for Lac repressor in panel C has been taken from Oehler et al. (70).
Quantitative experiments like those described above are making it possible to directly compare measurements of regulatory response with the predictions of an increasingly sophisticated host of theoretical ideas for describing regulatory circuits (8–17). This poses an experimental challenge: Is there a technique or techniques that can reliably span the many orders of magnitude in expression and fold-change?
There is a wide variety of different methods for carrying out measurements of gene expression like those described above (18–21). One classic scheme for measuring the level of gene expression is based upon the enzyme action of β-galactosidase (LacZ) as a reporter in which a substrate for this enzyme can be detected colorimetrically upon cleavage (18). However, the use of fluorescent reporters is increasingly becoming the method of choice, especially with the construction of a variety of libraries in which nearly each and every gene in a model organism can be read out fluorescently (1,3,7). In certain cases, this idea has been pushed all the way to the single-molecule limit where individual molecules in regulatory circuits are detected through their fluorescence (22). mRNA counting both in bulk through quantitative PCR and at the single molecule level is also becoming widespread as a means for quantifying levels of gene expression (7,23). In the cases where antibodies against the protein of interest are available, Western or immunoblotting can provide a quantitative measure of the protein contents of a cell (24,25). Finally, another popular enzymatic technique is based on reporting gene expression levels through bioluminescence (19,26–28).
The quest to quantitatively dissect regulatory networks of all types (4,5,23,29) raises questions about the relative merits of these different measurement techniques. For example, one important question is whether they are linearly related, thus rendering them able to report reliably on the level of expression. Additionally, it is important to determine whether the use of reporters affects cellular processes in any observable way. To that end, in this work, we use systematic experimentation in the context of a well-characterized regulatory network to compare enzymatic and fluorescent reporters as a measure of level of gene expression. Similarly, recent measurements have begun to systematically explore the relation between the amount of expressed protein and the level of mRNA (7,23,30) and the quantification of protein levels through Western blotting or immunoblots (24,25). Luminescence has an advantage related to its low background levels (31). As an enzymatic reporter, it requires the addition of a substrate to the medium or the encoding of genes that can produce the substrate within the cell. It has been established that a constant luminescence level per cell can be used to quantify the number of cells in culture with a very high dynamic range (26).
In the context of using luminescence as a reporter for gene expression, luciferase has been compared over a limited range with respect to a different reporter, to the number of plasmids bearing a constitutive promoter expressing luciferase and, recently, to absolute luciferase protein counts (28,32,33). The necessity for providing the cells with a substrate has certainly diminished its use with respect to the widespread fluorescent protein reporters. Additionally, there have been reports of the bioluminescence genes potentially affecting their own expression (34). As such we did not address this technique in this work, though studies similar in spirit to those performed here such as those by Suter et al. (28) would be a useful complement to our own study.
Our aim was to compare enzymatic and fluorescence reporters for the same promoters in a way that spans the large absolute dynamic range found in bacterial and viral promoters. In analogy to previous work (7,35) the main strategy consists in engineering a promoter regulated by Lac repressor into Escherichia coli which we subsequently induce to a variety of different levels with constructs harboring either a fluorescent or an enzymatic reporter. The choice of comparing the enzymatic reporter LacZ and the fluorescence reporter EYFP is based mainly on their wide use in the literature. Additionally, the particular choice of EYFP as a fluorescent reporter has been suggested to be the best compromise between the spectral properties of the available fluorescent proteins and of those molecules associated with cellular autofluorescence (36). It is clear, however, that similar systematic experiments will be required to characterize all the above-mentioned alternative schemes for measuring gene expression.
Theoretical models of gene expression predict the fold-change in gene expression (9,11,12). In particular, this fold-change is given as the ratio of the level of expression in the presence of a transcription factor to the level of gene expression in the absence of that same transcription factor. Further, this level of expression is a function of the concentrations and interaction energies of the different molecular players. Contrasting such relative predictions with experimental data relies heavily on the linearity of the response of the reporter being used. As such, we require not only that reporters span a high dynamic range, but that they also be linear over the fold-change range of the theoretical predictions.
To examine the fold-change, we constructed a variety of different realizations of the network in which the binding affinities for Lac repressor are varied in a way that leads to different fold-change levels that differ over several orders of magnitude. Using these schemes, we can explore the presumed linearity of response of the enzymatic assays and their fluorescent reporter protein counterparts.
Though measurements like those described above focus on the mean level of gene expression, recent years have also seen an exciting set of experiments that address issues of cell-to-cell variability. These efforts have relied on exploring different parts of the central dogma by using fluorescent proteins and luminescence, counting mRNA molecules, and measuring single-cell enzymatic activity (2,7,23,28,37–41). Though in this work we address several strategies to quantify mean levels of gene expression, similar work that explores how these different techniques compare in terms of their ability to report cell-to-cell variability will be of great interest as well.
Another measure by which to judge all these different approaches for quantifying gene expression levels is to ask about their ability to report on its dynamics. As discussed in detail in the Supporting Material, issues about differences in dynamics of expression of the different reporters can affect the steady-state level of expression significantly.
In the following sections we show a comparison and absolute calibration of enzymatic and fluorescence reporters both in terms of their absolute mean levels and the fold-change in gene expression. We show that they are interchangeable over several orders of magnitude of expression, but each method has a limited dynamic range either due to limitations of the reporter or to how the reporter acts on the cells. We conclude that they are both complementary and necessary if a systematic characterization of the predictions generated by thermodynamic models spanning over multiple orders of magnitude is to be achieved.
Materials and Methods
DNA constructs and strains
Please refer to the Supporting Material for a detailed description of the construction of all plasmids and strains. All sequences, plasmids, and strains are available upon request.
Growth conditions and gene expression measurements
Growth conditions are detailed in the Supporting Material. Induction and single cell microscopy was performed on the YFP samples as described in the Supporting Material. Our protocol for measuring LacZ activity is basically a slightly modified version of the one described in Miller (18) and Becker et al. (42). Details are given in the Supporting Material.
Results
In the following sections we show a strategy for obtaining an absolute calibration of our two protein reporters. We then compare these reporters side-by-side and determine their ranges of applicability. Finally, we take these experiments one step further by characterizing the fold-change in gene expression measured with both reporters for a simple transcriptional network. This final analysis allows us to determine a range over which thermodynamic models of gene regulation can be tested using this approach.
Absolute calibration of the reporters
Absolute measurements of gene expression are often reported in arbitrary units, especially for fluorescence measurements where the signal depends on the particular details of the microscope used. Such a quantification of fluorescence makes it hard, if not impossible, to compare results between setups and establish unified standards. On the other hand, having a simple way to turn these arbitrary units into an absolute number of molecules would be helpful in both the context of taking the census of cellular proteins (1,7,43) and of characterizing the limits of each reporter.
In the following sections we obtain an absolute calibration for both the enzymatic and fluorescent reporters characterized throughout this work. In turn, this calibration will allow us to set absolute bounds on the interchangeability of these reporters as well as their effectiveness as reporters of the level of gene expression.
Calibration of the absolute number of EYFP molecules
Several previous experiments have performed absolute calibrations of fluorescence levels by looking at a bulk solution of purified fluorophore in buffer (6,7,44,45) or in cell extract (46). These approaches require a known volume of illumination which can be achieved, for example, by performing either confocal microscopy (44,45) or two-photon microscopy (6).
These methods should be considered in light of at least two caveats:
First, they rely on the extinction coefficient of the fluorophore to determine its concentration. However, the solution will be comprised of active and bleached fluorophores. Therefore the effective extinction coefficient of the solution will be an unknown combination of the extinction coefficients for the active and bleached fluorophores.
Second, they are performed outside the cell. Even in the case of cell extract, the local environment the protein sees might be different than that of the unperturbed cellular interior.
Counting fluorescent proteins inside the cell is, however, not straightforward. Because of the fast diffusion time of free fluorescent proteins in the cytoplasm (47) the signal of individual fluorescent molecules gets blurred over the cell on the timescale of tens of milliseconds. As a result the fluorescence per unit area of a single fluorophore in the cytoplasm becomes comparable to the cell autofluorescence and, hence, not detectable under common continuous illumination conditions. A way to circumvent this is by immobilizing the fluorophore. For example, membrane proteins fused to fluorescent reporters present a much slower diffusion on the membrane than that of proteins in the cytoplasm. Single fluorophores can be then imaged in this way (7,48,49).
Our main approach for calibrating the fluorescence of a single EYFP molecule consists in immobilizing EYFP molecules in vivo by fusing them to a transcription factor which is in turn strongly bound to the genomic DNA of E. coli. Though this method has the advantage of being in vivo, one caveat is that in this case we are not imaging free cytoplasmic EYFP like in the gene expression measurements in this work. The fact that EYFP is fused to another protein that is in turn bound to the DNA could result in a difference of fluorescence.
Puncta of EYFP fused to Tet repressor could be observed inside the cells despite the poor signal/noise ratio of ∼1.5. In some cases these puncta could be observed to disappear in a single step, as shown in the traces in Fig. 3, A and B. We associate this with the photobleaching step of a single EYFP molecule. More often, though, the puncta would correspond to multiple EYFP molecules. These fluorescence traces manifest multiple discrete levels as shown in Fig. 3, C and D. By integrating the fluorescence of the steps over a small area we can obtain the distributions of steps shown in Fig. 3 E. Please refer to the Supporting Material for a detailed discussion of the data analysis process.
Figure 3.
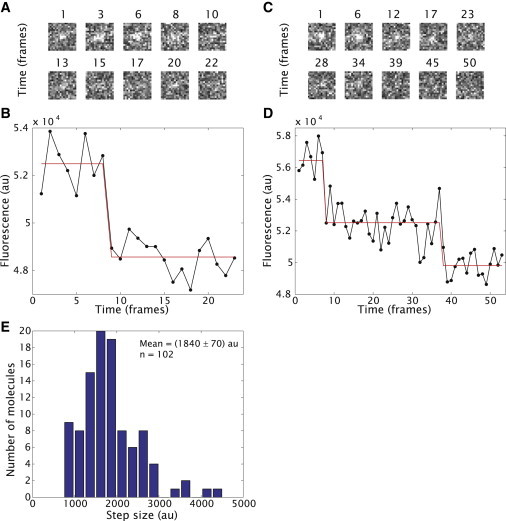
Absolute in vivo fluorescence calibration. (A) Representative fluorescence snapshots of a single molecule seen as a diffraction limited spot and (B) their corresponding fluorescence traces for a single bleaching event of the EYFP-Tet repressor fusion bound to the genomic DNA. The size of a pixel corresponds to ∼143 nm. A total of 200 frames with a 250-ms interval were taken for all traces. (C and D) Snapshots and fluorescent traces for multiple bleaching events of the EYFP-Tet repressor fusion. (Red lines) Least-squares fit to a single or multiple step function. (E) Distribution of fluorescence of bleaching steps for the in vivo sample.
We compared the fluorescence per EYFP molecule to the total fluorescence coming from a particular strain, HG105::galK 〈〉 25O2+11-YFP, under the same conditions. This strain expresses cytoplasmic EYFP. As a result we estimate the number of EYFP molecules in this strain to be 2600 ± 600. The reasoning behind choosing a strain where we directly measure the number of EYFP molecules is that all further gene expression measurements with EYFP as a reporter will be measured with respect to this “reference” strain. In this way we can easily estimate the number of EYFP molecules in any other strain we measure. Finally, we also quantified the fluorescence of single purified EYFP molecules and obtained a consistent result within 15%. Please refer to the Supporting Material for details of this in vitro, single-molecule fluorescence quantification.
As a sanity check on these results, we estimate the expected number of EYFP molecules. The average number of EYFP molecules in steady state can be approximated by
| (1) |
where α is the mRNA production rate, b is the number of proteins made per mRNA molecule, and β is the protein decay rate (50). Due to the long lifetime of EYFP, the “decay rate” is actually nothing more than the cell doubling time because each cell division effectively halves the number of proteins. For the experiments considered here, we have a cell division time of ∼1 h. The number of proteins per mRNA has been measured for the lac operon to be ∼20 protein molecules per mRNA molecule (40) and hence we take b = 20 proteins/mRNA. This number is within the range of the various protein/mRNA measurements performed previously (7). Finally, the transcription rate for the fully induced lac operon has been reported to be between 1 min−1 and 20 min−1 (51,52). However, the lacUV5 promoter is ∼30% weaker than the fully induced, wild-type lac promoter (53) resulting in a range of α = 0.7–14 min−1. When combining the decay rate β, the translation rate b and the transcription rate α we obtain an expected number of EYFP molecules of 1200–20,000 per cell, a range comparable to the intracellular number of EYFP molecules we measure.
Calibration of the absolute number of LacZ molecules
A simplified version of the reaction describing the breakdown of ONPG into ONP by β-galactosidase is given by
| (2) |
From this reaction scheme we can derive the rate equation for the production of the yellow compound ONP, which is given in turn by
| (3) |
and a rate equation for the decay in ONPG concentration due to its hydrolysis,
| (4) |
We wish to obtain the concentration of β-galactosidase, [LacZ], in our reaction to calculate the number of LacZ molecules per cell in the culture that was used to perform it.
If we assume that we have an excess concentration of ONPG and that the time of the reaction is short compared to 1/(k[LacZ]), we can neglect its depletion during the reaction. As a result we take [ONPG] as a constant in Eq. 3. The reaction described by Eq. 3 is the one we perform in the β-galactosidase assay to measure the amount of LacZ molecules per cell in Miller Units (MU). In this assay we monitor the production of ONP over time given by the increase in absorbance at 420 nm of the solution. The standard definition of the Miller Units (18) is
| (5) |
where v is the volume of cells used in mL at a cell density given by OD600 and t is the reaction time in minutes. These Miller Units were defined such that the fully induced wild-type lac operon has an activity of 1000 MU, and its noninduced level would yield ∼1 MU. We seek to relate these arbitrarily-defined Miller Units defined in Eq. 5 to Eq. 3 to obtain an actual number of LacZ molecules inside the cell.
First, the term OD420 – 1.75 × OD550 in Eq. 5 is a measure of the amount of ONP, the product of the breakdown of ONPG by β-galactosidase, in the reaction corrected for the cell debris (see Materials and Methods). We relate the absolute concentration of ONP in the reaction to the absorption reading through this term such that γ[ONP] = OD420 – 1.75 × OD550. From an experimental point of view, the key assumption is that of a linear increase in the amount of ONP over time. Given that at the moment the experiment starts, there is as yet no ONP, we can obtain d[ONP]/dt simply by taking the accumulated ONP at time t and dividing by this elapsed time; that is,
| (6) |
We also invoke a relation between the OD600 reading and the density of cells such that OD600 × v × δ = Ncells, where Ncells is the number of cells. Finally, we wish to obtain the number of LacZ tetramers present in the reaction NLacZ from this previous equation. This can be done by rewriting the concentration as [LacZ] = NLacZ/V, where V is now the reaction volume of the standard Miller LacZ assay. If we insert this in our definition of MU, we get
| (7) |
We determined δ for our strains to be (8.9 ± 0.8) × 108/mL through plating and counting of colonies. The relation between ONP absorption at 420 nm and concentration is ∼0.0045/μMONP (54,18). The volume of the reaction in the standard Miller assay is V = 1.2 mL. However, before the ONP reading the sample gets diluted to ∼1.7 mL by the addition of Na2CO3. Therefore we define γ = 0.0045/μMONP × (1.7 mL/1.4 mL). Finally, we need to obtain the turnover rate of LacZ given by k. Wallenfels and Weil (55) report a turnover rate of , where we are referring to LacZ tetramers. Similar values have been reported by Kennell and Riezman (52) and Craven et al. (56). Because the initial concentration of ONPG in the reaction is 1.86 mM, we get
| (8) |
Although this is only a rough estimate because of a lack of error bars associated with the reported values for the specific activity of LacZ, this gives us a direct connection between Miller Units and number of LacZ molecules per cell.
This LacZ calibration that we have just calculated is consistent with previous experimental results on the lac operon. For example, the expression level of the repressed operon is ∼0.6 MU (4). Our calibration suggests that this corresponds to 0.3 LacZ tetramers/cell. Using single molecule techniques, the average number of LacZ tetramers under repressed conditions was estimated to be 1.2 tetramers/cell (40). The internal consistency of these different estimates is encouraging.
Limits of LacZ and YFP as absolute reporters of gene expression
Recall that our aim was to compare enzymatic and fluorescence reporters for the same promoters in a way that spans the large dynamic range found in natural bacterial and viral promoters.
As we have already noted, the level of expression in such bacterial promoters spans over six orders of magnitude as shown in Fig. 1 and Table S4 in the Supporting Material. Our interest was to design an experiment that would permit us to capture a similar dynamical range in a way that would result in a systematic comparison between the enzymatic and fluorescent reporters. To that end, we use an approach based on induction. We use an inducible lacUV5 promoter with a single binding site for Lac repressor (Oid) located directly downstream from its transcriptional start (see Fig. S7). Two versions of this construct regulating the expression of either the lacZ or EYFP genes were created. These constructs were either located on the bacterial chromosome or a low copy plasmid in strains that bear wild-type levels of Lac repressor (lacI+), high levels of Lac repressor (lacI++), or no Lac repressor (lacI−). By growing the different combinations of resulting strains at different concentrations of the inducer IPTG we were able to compare the total EYFP fluorescence and LacZ enzymatic activity per cell. These induction curves are shown in Fig. S8.
In Fig. 4 we present the corresponding expression levels measured using the two reporters over four orders of magnitude. For comparison, these results are juxtaposed with the literature expression levels of some naturally occurring promoters such as those presented in Fig. 1 and Table S4. The blue line corresponds to a fit to a linear model showing that the data is consistent with a linear relation between the two reporters. This observation is consistent with recently published results (7). The slope or conversion factor is (9.6 ± 0.7) × 10−5 arbitrary fluorescence units/MU. Even if we fit the relation between the two reporters with a more general functional form such as a power law, we find a linear dependence as shown in Fig. S10.
Figure 4.
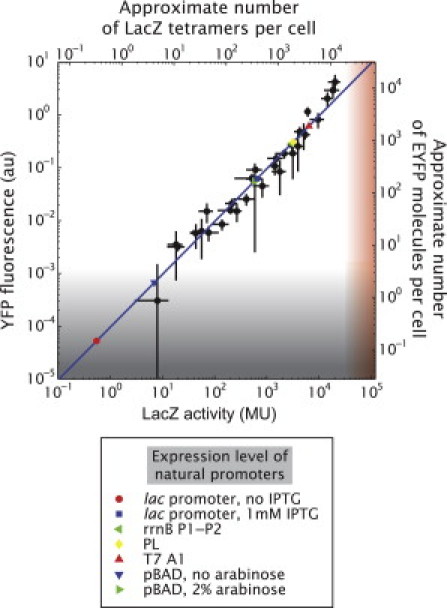
Relation between the mean cell fluorescence and β-galactosidase activity. The fluorescence per cell is plotted against the β-galactosidase activity. Each point corresponds to the same construct bearing either EYFP or lacZ as a reporter in the same strain background and at the same concentration of IPTG. (Blue line) Linear fit fixing the intercept to zero with a slope of (9.6 ± 0.7) × 10−5 fluorescence units/MU or an estimated 0.1 YFP molecules/LacZ monomer. (Gray-shaded area) Range of YFP where the fluorescence signal is comparable to the cell autofluorescence (see discussion in the main text and Fig. S12). (Red-shaded area) Range where our assay can detect LacZ expression affecting cell growth (refer to the main text and to Table S1). (Blue line) The expression values of several natural promoters, some of which are also shown in Fig. 1, are plotted.
Although β-galactosidase activity is measured in absolute units, the fluorescence intensity depends strongly on details of the experimental apparatus used for the measurement such as the illumination intensity and transmission of the optical elements. The calibrations mentioned above that convert YFP arbitrary fluorescent units and LacZ Miller Units into a number of molecules allows for our expression levels to be converted into an approximate absolute number of molecules of each reporter as shown by the labeling on the alternative axes in Fig. 4. We estimate the EYFP-LacZ relation to be (roughly) ∼0.1 EYFP molecules/LacZ monomer. This value seems to be at odds with the fact that they are being expressed from the same promoter. If the transcription rate is the same for both genes, then that leaves some difference at the translation initiation and translation levels (please refer to the Supporting Material for more information on this issue). However, we lack sufficient information to estimate those differences. Alternatively, an underestimation of the number of EYFP molecules inside the cells could be due to issues related to the fluorescence of the molecule itself such as quenching, misfolding, and the presence of immature fluorophores (57,58).
Fluorescence measurements are fundamentally limited for low levels of gene expression. When the fluorescence signal becomes comparable to the autofluorescence level (<10 molecules/cell) the determination of the level of gene expression has a high associated error. In contrast to free cytoplasmic fluorescent proteins, this limitation is less stringent in the case of fluorescent proteins that are immobilized on the cell membrane (48,57) or DNA by a fusion (this work and (59)). The high error in the determination of low expression levels is reflected in the fluorescence distributions shown in Fig. S12. For the lowest expression levels, the dominant error comes from variations in the autofluorescence. For example, we observe a slight systematic bias toward overestimating the level of autofluorescence. Given the size of the autofluorescence variation, we do not regard the mean value of fluorescence as statistically significant.
This limitation is indicated as a gray-shaded area in Fig. 4. To give a sense of the scale, the expression level of the repressed wild-type lac promoter could not be measured with fluorescence unless a more sophisticated technique to visualize single fluorescent proteins is invoked (48). By way of contrast, no significant analogous background was observed in any of our LacZ measurements, showing that this method is more reliable for quantifying very low levels of gene expression. In fact, linearity of the LacZ activity has been reported down to 0.03 MU (4). Of course, this autofluorescence limit is related to the particular choice made of fluorescent protein, growth media, organism, and strain (36). As such it will be important to perform similar comparisons in these different contexts to generalize the results presented here.
When performing a measurement of gene expression using reporters it is important to demonstrate that the presence of the reporter itself is not affecting the state of the cell. We choose the growth rate as an indicator of the cellular state. For all the expression levels shown in Fig. 4 the doubling rate is ∼1 h regardless of the reporter. However, strain lacI- bearing a plasmid with LacZ as a reporter showed a longer doubling time of (74 ± 1) min, which was not the case for the corresponding EYFP strain. These growth rates are shown in Table S1 and the corresponding growth curves are shown in Fig. S11. We confirm previous observations that expression levels above 20,000 LacZ tetramers/cell start affecting the cell significantly (60). Unlike the low end of expression, where EYFP was limited by the autofluorescence, we find that for the high end of expression LacZ becomes limiting not because of signal issues, but because the cell is affected by the fact that high levels of LacZ are being expressed. Interestingly, even some of the stronger promoters such as rrnB and the T7 A1 promoter have levels below this threshold.
Although our measurements primarily focused on the use of microscopy to quantify EYFP fluorescence, it is by no means the only option. An alternative, for example, is to use a plate reader. Although this method is limited to only reporting the mean level of gene expression of a population of cells (it does not provide single-cell information), it is able to produce data in much higher throughput than microscopy. On the other hand, plate readers will be more limited in terms of the minimum level of fluorescence they can quantify reliably. We perform a comparison between fluorescence measurements on the same strains using microscopy and a plate reader in the Supporting Material leading to Fig. S6. We reach the conclusion that they are completely interchangeable, but that the lower limit of detection is now ∼50 molecules/cell—roughly five-times more than with microscopy.
Limits of LacZ and YFP as reporters of the fold-change in gene expression
The fold-change in gene expression due to regulation by a transcription factor is defined as the level of gene expression in the presence of that molecule divided by the level of gene expression in its absence. In particular, it is the key magnitude predicted by thermodynamic models of transcriptional regulation (11,12). These models can predict fold-changes in gene expression that span over multiple orders of magnitude for both repression (fold-change < 1) and activation (fold-change > 1).
To test these models, it is then necessary to be able to decide which reporter will be the best to assay a particular type of regulatory architecture. For example, in the previous section we found that we can reliably measure EYFP fluorescence down to 10 molecules/cell. If we are dealing with a promoter with a basal expression level of ∼3000 YFP molecules/cell like the lacUV5 promoter integrated on the chromosome used in this work, this means that the lowest fold-change we can measure with YFP is 10/3000 ≈ 10−3. On the other hand, the maximum LacZ activity attainable before cell growth starts being compromised is ∼20,000 LacZ tetramers/cell. This means that we can only increase the number of LacZ tetramers beyond the basal level up to this level before the cell senses the presence of these molecules as measured by its growth rate. Because the basal level of our promoter corresponds to 4000 LacZ tetramers/cell, this translates into a maximum measurable fold-change of 20,000/4000 ≈ 101 using LacZ as a reporter.
To test part of this assertion about the maximum fold-change in repression, we performed fold-change measurements on constructs bearing the operators O1, O2, or Oid, and the reporters LacZ or EYFP. Fig. 5 shows the fold-change measured using EYFP as a function of the fold-change measured using LacZ for the different single binding site constructs (O1, O2, and Oid) in two different Lac repressor backgrounds: lacI+ and lacI++. We see that the fold-change levels measured with both reporters are in good correspondence. As expected, when the fold-change in gene expression reaches 10−3, the EYFP readings start becoming too noisy to determine the fold-change in gene expression reliably, setting a limit on the range of fold-change that can be measured using EYFP as a reporter.
Figure 5.
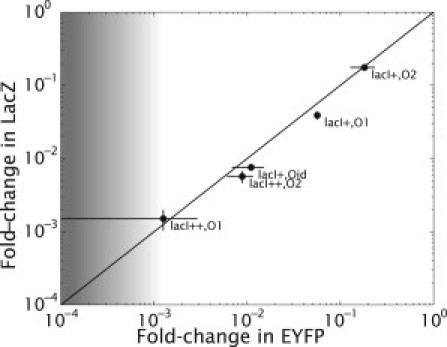
Fold-change in gene expression measured by LacZ and EYFP. The fold-change of a construct bearing a single Lac repressor binding site (Oid, O1, and O2) in the lacI+ and lacI++ backgrounds is compared when lacZ and EYFP are used as reporters. The line has a slope of one. The point in the plot displaying the lowest fold-change corresponds to fluorescence levels that are near the detection limit. This results in the very large error bar shown.
Discussion
In this work we explored the feasibility of testing theoretical models of gene regulation using two reporters of protein expression: EYFP and LacZ. The calibration between EYFP and LacZ levels shown here is an important methodological prerequisite for testing quantitative models of gene expression. One important outcome is that it makes it possible to compare previously available data, generally taken using LacZ as a reporter, with single cell expression data obtained using EYFP over most of the range of expression of bacterial promoters. EYFP and LacZ are just a subset of the reporters commonly used. Our choice to characterize the relative merits of these two reporters stems from the vast literature available in terms of this enzyme and fluorescent proteins and from the fact that EYFP has been suggested to give the best signal/background with respect to cell autofluorescence (36).
Fluorescent molecules have generally been the method of choice recently because they allow for live imaging of single cells. Our work establishes a clear absolute boundary for these measurements: the autofluorescence level. The intuitive expectation that autofluorescence will contaminate fluorescent gene expression measurements is converted into a concrete and precise numerical criterion. We expect this absolute boundary to be dependent on the particular fluorescent protein used as they can vary widely in their spectral properties and as the autofluorescence is also measurably different at different wavelengths (36). Additionally, this autofluorescence can be affected by the particular choice of growth media and bacterial strain or cell type (61,62).
Interestingly, the enzymatic activity of LacZ shows no such limitation. However, for high levels of expression, the presence of LacZ affects cell growth in a detectable way before any similar effect from EYFP can be detected. The experimental capacity to use both methods and to switch between one reporter and the other presented in this work makes it possible to obtain the best of both worlds: very low expression levels can be measured accurately in bulk using LacZ in absolute units, whereas slightly higher levels of expression can be measured at the single cell level using fluorescence. Because of fundamental limitations associated with each reporter, we conclude that both techniques need to be used together if the full range of absolute gene expression is to be measured. The outcome of this work has direct consequences on the fold-change in gene expression detectable with each reporter and, in turn, on the range of predictions that these measurements can be contrasted against.
Finally, the work presented here shows a relatively straightforward way to perform similar calibrations for different reporters. In the case of E. coli, for example, it is straightforward to swap the fluorescent protein in our transcription factor-fusion with another one to calibrate it at the single molecule level. Fusions of these transcription factors and their corresponding binding arrays have been shown to work in bacteria, yeast and in eukaryotic cells grown in culture (63–66). The inducible promoters can be easily engineered in such a fashion to provide a graded level of expression of the protein of interest. Again, such inducible promoters are commonplace in the context of bacteria, yeast, and cell culture and can span multiple orders of magnitude (67,68). By performing this titration with a reporter whose background is much lower (LacZ, for example) and making use of the absolute calibration of the fluorescent protein, one can then determine the point at which the level of fluorescence becomes nondetectable because of the cell autofluorescence.
Similar experiments where each technique is compared systematically will be necessary to judge the relative merits of each reporter. These comparisons need to be made not only with respect to the mean value of gene expression, but also as reporters of the dynamics of these mean values and of cell-to-cell variability.
Acknowledgments
We are grateful to a number of people for instruction, helpful discussions, and reading the manuscript. In particular, we are grateful to Nicole Becker, Jim Maher, Bob Schleif, Terry Hwa, James Locke, Ron Milo, Tom Kuhlman, Alvaro Sanchez, and Franz Weinert. We thank Roberto Chica for help with the EYFP purification.
This work was supported by National Institutes of Health Pioneer award No. DP1 OD000217 (to H.G.G., H.J.L., and R.P.), National Institutes of Health award No. R01 GM085286 and No. R01 GM085286-01S (to H.G.G., J.Q.B., and R.P.), La Fondation Pierre Gilles de Gennes (to R.P.), and the Caltech Division of Biology (to H.J.L.).
Supporting Material
References
- 1.Ghaemmaghami S., Huh W.K., Weissman J.S. Global analysis of protein expression in yeast. Nature. 2003;425:737–741. doi: 10.1038/nature02046. [DOI] [PubMed] [Google Scholar]
- 2.Rosenfeld N., Young J.W., Elowitz M.B. Gene regulation at the single-cell level. Science. 2005;307:1962–1965. doi: 10.1126/science.1106914. [DOI] [PubMed] [Google Scholar]
- 3.Zaslaver A., Bren A., Alon U. A comprehensive library of fluorescent transcriptional reporters for Escherichia coli. Nat. Methods. 2006;3:623–628. doi: 10.1038/nmeth895. [DOI] [PubMed] [Google Scholar]
- 4.Kuhlman T., Zhang Z., Hwa T. Combinatorial transcriptional control of the lactose operon of Escherichia coli. Proc. Natl. Acad. Sci. USA. 2007;104:6043–6048. doi: 10.1073/pnas.0606717104. [DOI] [PMC free article] [PubMed] [Google Scholar]
- 5.Ben-Tabou de-Leon S., Davidson E.H. Gene regulation: gene control network in development. Annu. Rev. Biophys. Biomol. Struct. 2007;36:191–212. doi: 10.1146/annurev.biophys.35.040405.102002. [DOI] [PubMed] [Google Scholar]
- 6.Gregor T., Tank D.W., Bialek W. Probing the limits to positional information. Cell. 2007;130:153–164. doi: 10.1016/j.cell.2007.05.025. [DOI] [PMC free article] [PubMed] [Google Scholar]
- 7.Taniguchi Y., Choi P.J., Xie X.S. Quantifying E. coli proteome and transcriptome with single-molecule sensitivity in single cells. Science. 2010;329:533–538. doi: 10.1126/science.1188308. [DOI] [PMC free article] [PubMed] [Google Scholar]
- 8.Gerland U., Moroz J.D., Hwa T. Physical constraints and functional characteristics of transcription factor-DNA interaction. Proc. Natl. Acad. Sci. USA. 2002;99:12015–12020. doi: 10.1073/pnas.192693599. [DOI] [PMC free article] [PubMed] [Google Scholar]
- 9.Buchler N.E., Gerland U., Hwa T. On schemes of combinatorial transcription logic. Proc. Natl. Acad. Sci. USA. 2003;100:5136–5141. doi: 10.1073/pnas.0930314100. [DOI] [PMC free article] [PubMed] [Google Scholar]
- 10.Vilar J.M., Leibler S. DNA looping and physical constraints on transcription regulation. J. Mol. Biol. 2003;331:981–989. doi: 10.1016/s0022-2836(03)00764-2. [DOI] [PubMed] [Google Scholar]
- 11.Bintu L., Buchler N.E., Phillips R. Transcriptional regulation by the numbers: models. Curr. Opin. Genet. Dev. 2005;15:116–124. doi: 10.1016/j.gde.2005.02.007. [DOI] [PMC free article] [PubMed] [Google Scholar]
- 12.Bintu L., Buchler N.E., Phillips R. Transcriptional regulation by the numbers: applications. Curr. Opin. Genet. Dev. 2005;15:125–135. doi: 10.1016/j.gde.2005.02.006. [DOI] [PMC free article] [PubMed] [Google Scholar]
- 13.Klumpp S., Zhang Z., Hwa T. Growth rate-dependent global effects on gene expression in bacteria. Cell. 2009;139:1366–1375. doi: 10.1016/j.cell.2009.12.001. [DOI] [PMC free article] [PubMed] [Google Scholar]
- 14.Hermsen R., Tans S., ten Wolde P.R. Transcriptional regulation by competing transcription factor modules. PLOS Comput. Biol. 2006;2:e164. doi: 10.1371/journal.pcbi.0020164. [DOI] [PMC free article] [PubMed] [Google Scholar]
- 15.Morelli M.J., Ten Wolde P.R., Allen R.J. DNA looping provides stability and robustness to the bacteriophage λ-switch. Proc. Natl. Acad. Sci. USA. 2009;106:8101–8106. doi: 10.1073/pnas.0810399106. [DOI] [PMC free article] [PubMed] [Google Scholar]
- 16.Hermsen R., Ursem B., ten Wolde P.R. Combinatorial gene regulation using auto-regulation. PLOS Comput. Biol. 2010;6:e1000813. doi: 10.1371/journal.pcbi.1000813. [DOI] [PMC free article] [PubMed] [Google Scholar]
- 17.Sneppen K., Krishna S., Semsey S. Simplified models of biological networks. Annu. Rev. Biophys. 2010;39:43–59. doi: 10.1146/annurev.biophys.093008.131241. [DOI] [PubMed] [Google Scholar]
- 18.Miller J.H. Cold Spring Harbor Laboratory; Cold Spring Harbor, NY: 1972. Experiments in Molecular Genetics. [Google Scholar]
- 19.Van Dyk T.K., DeRose E.J., Gonye G.E. LuxArray, a high-density, genomewide transcription analysis of Escherichia coli using bioluminescent reporter strains. J. Bacteriol. 2001;183:5496–5505. doi: 10.1128/JB.183.19.5496-5505.2001. [DOI] [PMC free article] [PubMed] [Google Scholar]
- 20.Bongaerts R.J., Hautefort I., Hinton J.C. Green fluorescent protein as a marker for conditional gene expression in bacterial cells. Methods Enzymol. 2002;358:43–66. doi: 10.1016/s0076-6879(02)58080-0. [DOI] [PubMed] [Google Scholar]
- 21.Larson D.R., Singer R.H., Zenklusen D. A single molecule view of gene expression. Trends Cell Biol. 2009;19:630–637. doi: 10.1016/j.tcb.2009.08.008. [DOI] [PMC free article] [PubMed] [Google Scholar]
- 22.Raj A., van Oudenaarden A. Single-molecule approaches to stochastic gene expression. Annu. Rev. Biophys. 2009;38:255–270. doi: 10.1146/annurev.biophys.37.032807.125928. [DOI] [PMC free article] [PubMed] [Google Scholar]
- 23.Golding I., Paulsson J., Cox E.C. Real-time kinetics of gene activity in individual bacteria. Cell. 2005;123:1025–1036. doi: 10.1016/j.cell.2005.09.031. [DOI] [PubMed] [Google Scholar]
- 24.Borggrefe T., Davis R., Kornberg R.D. Quantitation of the RNA polymerase II transcription machinery in yeast. J. Biol. Chem. 2001;276:47150–47153. doi: 10.1074/jbc.M109581200. [DOI] [PubMed] [Google Scholar]
- 25.Wu J.Q., McCormick C.D., Pollard T.D. Chapter 9: Counting proteins in living cells by quantitative fluorescence microscopy with internal standards. Methods Cell Biol. 2008;89:253–273. doi: 10.1016/S0091-679X(08)00609-2. [DOI] [PubMed] [Google Scholar]
- 26.Kishony R., Leibler S. Environmental stresses can alleviate the average deleterious effect of mutations. J. Biol. 2003;2:14. doi: 10.1186/1475-4924-2-14. [DOI] [PMC free article] [PubMed] [Google Scholar]
- 27.Cox R.S., 3rd, Surette M.G., Elowitz M.B. Programming gene expression with combinatorial promoters. Mol. Syst. Biol. 2007;3:145. doi: 10.1038/msb4100187. [DOI] [PMC free article] [PubMed] [Google Scholar]
- 28.Suter D.M., Molina N., Naef F. Mammalian genes are transcribed with widely different bursting kinetics. Science. 2011;332:472–474. doi: 10.1126/science.1198817. [DOI] [PubMed] [Google Scholar]
- 29.Oates A.C., Gorfinkiel N., Heisenberg C.P. Quantitative approaches in developmental biology. Nat. Rev. Genet. 2009;10:517–530. doi: 10.1038/nrg2548. [DOI] [PubMed] [Google Scholar]
- 30.Guet C.C., Bruneaux L., Cluzel P. Minimally invasive determination of mRNA concentration in single living bacteria. Nucleic Acids Res. 2008;36:e73. doi: 10.1093/nar/gkn329. [DOI] [PMC free article] [PubMed] [Google Scholar]
- 31.Hautefort I., Hinton J.C. Measurement of bacterial gene expression in vivo. Philos. Trans. R. Soc. Lond. B Biol. Sci. 2000;355:601–611. doi: 10.1098/rstb.2000.0601. [DOI] [PMC free article] [PubMed] [Google Scholar]
- 32.Pfeifer C.G., Finlay B.B. Monitoring gene expression of Salmonella inside mammalian cells: comparison of luciferase and β-galactosidase fusion systems. J. Microbiol. Methods. 1995;24:155–164. [Google Scholar]
- 33.Lutz R., Bujard H. Independent and tight regulation of transcriptional units in Escherichia coli via the LacR/O, the TetR/O and AraC/I1-I2 regulatory elements. Nucleic Acids Res. 1997;25:1203–1210. doi: 10.1093/nar/25.6.1203. [DOI] [PMC free article] [PubMed] [Google Scholar]
- 34.Forsberg A.J., Pavitt G.D., Higgins C.F. Use of transcriptional fusions to monitor gene expression: a cautionary tale. J. Bacteriol. 1994;176:2128–2132. doi: 10.1128/jb.176.7.2128-2132.1994. [DOI] [PMC free article] [PubMed] [Google Scholar]
- 35.Scholz O., Thiel A., Niederweis M. Quantitative analysis of gene expression with an improved green fluorescent protein. p6. Eur. J. Biochem. 2000;267:1565–1570. doi: 10.1046/j.1432-1327.2000.01170.x. [DOI] [PubMed] [Google Scholar]
- 36.Harms G.S., Cognet L., Schmidt T. Autofluorescent proteins in single-molecule research: applications to live cell imaging microscopy. Biophys. J. 2001;80:2396–2408. doi: 10.1016/S0006-3495(01)76209-1. [DOI] [PMC free article] [PubMed] [Google Scholar]
- 37.Elowitz M.B., Levine A.J., Swain P.S. Stochastic gene expression in a single cell. Science. 2002;297:1183–1186. doi: 10.1126/science.1070919. [DOI] [PubMed] [Google Scholar]
- 38.Raser J.M., O'Shea E.K. Control of stochasticity in eukaryotic gene expression. Science. 2004;304:1811–1814. doi: 10.1126/science.1098641. [DOI] [PMC free article] [PubMed] [Google Scholar]
- 39.Zenklusen D., Larson D.R., Singer R.H. Single-RNA counting reveals alternative modes of gene expression in yeast. Nat. Struct. Mol. Biol. 2008;15:1263–1271. doi: 10.1038/nsmb.1514. [DOI] [PMC free article] [PubMed] [Google Scholar]
- 40.Cai L., Friedman N., Xie X.S. Stochastic protein expression in individual cells at the single molecule level. Nature. 2006;440:358–362. doi: 10.1038/nature04599. [DOI] [PubMed] [Google Scholar]
- 41.Larson D.R., Zenklusen D., Singer R.H. Real-time observation of transcription initiation and elongation on an endogenous yeast gene. Science. 2011;332:475–478. doi: 10.1126/science.1202142. [DOI] [PMC free article] [PubMed] [Google Scholar]
- 42.Becker N.A., Kahn J.D., Maher L.J., 3rd Bacterial repression loops require enhanced DNA flexibility. J. Mol. Biol. 2005;349:716–730. doi: 10.1016/j.jmb.2005.04.035. [DOI] [PubMed] [Google Scholar]
- 43.Wu J.Q., Pollard T.D. Counting cytokinesis proteins globally and locally in fission yeast. Science. 2005;310:310–314. doi: 10.1126/science.1113230. [DOI] [PubMed] [Google Scholar]
- 44.Hirschberg K., Miller C.M., Lippincott-Schwartz J. Kinetic analysis of secretory protein traffic and characterization of Golgi to plasma membrane transport intermediates in living cells. J. Cell Biol. 1998;143:1485–1503. doi: 10.1083/jcb.143.6.1485. [DOI] [PMC free article] [PubMed] [Google Scholar]
- 45.Piston D.W., Patterson G.H., Knobel S.M. Quantitative imaging of the green fluorescent protein (GFP) Methods Cell Biol. 1999;58:31–48. doi: 10.1016/s0091-679x(08)61947-0. [DOI] [PubMed] [Google Scholar]
- 46.Sourjik V., Berg H.C. Binding of the Escherichia coli response regulator CheY to its target measured in vivo by fluorescence resonance energy transfer. Proc. Natl. Acad. Sci. USA. 2002;99:12669–12674. doi: 10.1073/pnas.192463199. [DOI] [PMC free article] [PubMed] [Google Scholar]
- 47.Elowitz M.B., Surette M.G., Leibler S. Protein mobility in the cytoplasm of Escherichia coli. J. Bacteriol. 1999;181:197–203. doi: 10.1128/jb.181.1.197-203.1999. [DOI] [PMC free article] [PubMed] [Google Scholar]
- 48.Yu J., Xiao J., Xie X.S. Probing gene expression in live cells, one protein molecule at a time. Science. 2006;311:1600–1603. doi: 10.1126/science.1119623. [DOI] [PubMed] [Google Scholar]
- 49.Choi P.J., Cai L., Xie X.S. A stochastic single-molecule event triggers phenotype switching of a bacterial cell. Science. 2008;322:442–446. doi: 10.1126/science.1161427. [DOI] [PMC free article] [PubMed] [Google Scholar]
- 50.Friedman N., Cai L., Xie X.S. Linking stochastic dynamics to population distribution: an analytical framework of gene expression. Phys. Rev. Lett. 2006;97:168302. doi: 10.1103/PhysRevLett.97.168302. [DOI] [PubMed] [Google Scholar]
- 51.Young R., Bremer H. Analysis of enzyme induction in bacteria. Biochem. J. 1975;152:243–254. doi: 10.1042/bj1520243. [DOI] [PMC free article] [PubMed] [Google Scholar]
- 52.Kennell D., Riezman H. Transcription and translation initiation frequencies of the Escherichia coli lac operon. J. Mol. Biol. 1977;114:1–21. doi: 10.1016/0022-2836(77)90279-0. [DOI] [PubMed] [Google Scholar]
- 53.Deuschle U., Kammerer W., Bujard H. Promoters of Escherichia coli: a hierarchy of in vivo strength indicates alternate structures. EMBO J. 1986;5:2987–2994. doi: 10.1002/j.1460-2075.1986.tb04596.x. [DOI] [PMC free article] [PubMed] [Google Scholar]
- 54.Lederberg J. The β-d-galactosidase of Escherichia coli, strain K-12. J. Bacteriol. 1950;60:381–392. doi: 10.1128/jb.60.4.381-392.1950. [DOI] [PMC free article] [PubMed] [Google Scholar]
- 55.Wallenfels K., Weil R. Beta-galactosidase. Enzyme. 1972;7:617–663. [Google Scholar]
- 56.Craven G.R., Jr., Steers E., Jr., Anfinsen C.B. Purification, composition, and molecular weight of the β-galactosidase of Escherichia coli K12. J. Biol. Chem. 1965;240:2468–2477. [PubMed] [Google Scholar]
- 57.Ulbrich M.H., Isacoff E.Y. Subunit counting in membrane-bound proteins. Nat. Methods. 2007;4:319–321. doi: 10.1038/NMETH1024. [DOI] [PMC free article] [PubMed] [Google Scholar]
- 58.Drepper T., Huber R., Jaeger K.E. Flavin mononucleotide-based fluorescent reporter proteins outperform green fluorescent protein-like proteins as quantitative in vivo real-time reporters. Appl. Environ. Microbiol. 2010;76:5990–5994. doi: 10.1128/AEM.00701-10. [DOI] [PMC free article] [PubMed] [Google Scholar]
- 59.Elf J., Li G.W., Xie X.S. Probing transcription factor dynamics at the single-molecule level in a living cell. Science. 2007;316:1191–1194. doi: 10.1126/science.1141967. [DOI] [PMC free article] [PubMed] [Google Scholar]
- 60.Dong H., Nilsson L., Kurland C.G. Gratuitous overexpression of genes in Escherichia coli leads to growth inhibition and ribosome destruction. J. Bacteriol. 1995;177:1497–1504. doi: 10.1128/jb.177.6.1497-1504.1995. [DOI] [PMC free article] [PubMed] [Google Scholar]
- 61.Benson R.C., Meyer R.A., McKhann G.M. Cellular autofluorescence—is it due to flavins? J. Histochem. Cytochem. 1979;27:44–48. doi: 10.1177/27.1.438504. [DOI] [PubMed] [Google Scholar]
- 62.Aubin J.E. Autofluorescence of viable cultured mammalian cells. J. Histochem. Cytochem. 1979;27:36–43. doi: 10.1177/27.1.220325. [DOI] [PubMed] [Google Scholar]
- 63.Robinett C.C., Straight A., Belmont A.S. In vivo localization of DNA sequences and visualization of large-scale chromatin organization using lac operator/repressor recognition. J. Cell Biol. 1996;135:1685–1700. doi: 10.1083/jcb.135.6.1685. [DOI] [PMC free article] [PubMed] [Google Scholar]
- 64.Straight A.F., Belmont A.S., Murray A.W. GFP tagging of budding yeast chromosomes reveals that protein-protein interactions can mediate sister chromatid cohesion. Curr. Biol. 1996;6:1599–1608. doi: 10.1016/s0960-9822(02)70783-5. [DOI] [PubMed] [Google Scholar]
- 65.Viollier P.H., Thanbichler M., Shapiro L. Rapid and sequential movement of individual chromosomal loci to specific subcellular locations during bacterial DNA replication. Proc. Natl. Acad. Sci. USA. 2004;101:9257–9262. doi: 10.1073/pnas.0402606101. [DOI] [PMC free article] [PubMed] [Google Scholar]
- 66.Wiggins P.A., Cheveralls K.C., Kondev J. Strong intranucleoid interactions organize the Escherichia coli chromosome into a nucleoid filament. Proc. Natl. Acad. Sci. USA. 2010;107:4991–4995. doi: 10.1073/pnas.0912062107. [DOI] [PMC free article] [PubMed] [Google Scholar]
- 67.Garí E., Piedrafita L., Herrero E. A set of vectors with a tetracycline-regula promoter system for modulated gene expression in Saccharomyces cerevisiae. Yeast. 1997;13:837–848. doi: 10.1002/(SICI)1097-0061(199707)13:9<837::AID-YEA145>3.0.CO;2-T. [DOI] [PubMed] [Google Scholar]
- 68.Qin J.Y., Zhang L., Lahn B.T. Systematic comparison of constitutive promoters and the doxycycline-inducible promoter. PLoS ONE. 2010;5:e10611. doi: 10.1371/journal.pone.0010611. [DOI] [PMC free article] [PubMed] [Google Scholar]
- 69.Lu P., Vogel C., Marcotte E.M. Absolute protein expression profiling estimates the relative contributions of transcriptional and translational regulation. Nat. Biotechnol. 2007;25:117–124. doi: 10.1038/nbt1270. [DOI] [PubMed] [Google Scholar]
- 70.Oehler S., Amouyal M., Müller-Hill B. Quality and position of the three lac operators of E. coli define efficiency of repression. EMBO J. 1994;13:3348–3355. doi: 10.1002/j.1460-2075.1994.tb06637.x. [DOI] [PMC free article] [PubMed] [Google Scholar]
Associated Data
This section collects any data citations, data availability statements, or supplementary materials included in this article.