Abstract
Amino acid uptake in the intestine and kidney is mediated by a variety of amino acid transporters. To understand the role of epithelial neutral amino acid uptake in whole body homeostasis, we analyzed mice lacking the apical broad-spectrum neutral (0) amino acid transporter B0AT1 (Slc6a19). A general neutral aminoaciduria was observed similar to human Hartnup disorder which is caused by mutations in SLC6A19. Na+-dependent uptake of neutral amino acids into the intestine and renal brush-border membrane vesicles was abolished. No compensatory increase of peptide transport or other neutral amino acid transporters was detected. Mice lacking B0AT1 showed a reduced body weight. When adapted to a standard 20% protein diet, B0AT1-deficient mice lost body weight rapidly on diets containing 6 or 40% protein. Secretion of insulin in response to food ingestion after fasting was blunted. In the intestine, amino acid signaling to the mammalian target of rapamycin (mTOR) pathway was reduced, whereas the GCN2/ATF4 stress response pathway was activated, indicating amino acid deprivation in epithelial cells. The results demonstrate that epithelial amino acid uptake is essential for optimal growth and body weight regulation.
Keywords: Amino Acid Transport, Epithelial Cell, Genetic Diseases, Insulin Secretion, Intestinal Metabolism, Kidney, Protein Nutrition
Introduction
In a typical Western diet humans consume about 80–100 g of protein per day. Proteins are hydrolyzed by the action of secreted and membrane-bound peptidases into individual amino acids, di- and tripeptides (1). Individual amino acids are taken up by a variety of amino acid transporters, whereas di- and tripeptides are absorbed by the peptide transporter PepT1 (SLC15A1) (2). Together this digestive process makes 90–95% of ingested proteins available to the body. Protein demand is particularly high during growth and development when new proteins are required to build up body mass. In the adult, protein recycling is quite efficient, and only 50 g of protein is needed per day to replace protein lost through urine and feces.
The bulk of neutral amino acids is absorbed in the intestine by the neutral amino acid transporter B0AT1 (SLC6A19), which is also expressed in the kidney where it mediates reabsorption of neutral amino acids (3). Expression studies in heterologous systems have shown that B0AT1 accepts all neutral amino acids with a preference for large neutral amino acids such as branched-chain amino acids and methionine (4, 5). These amino acids are taken up with a Km of about 1 mm, whereas smaller amino acids are taken up with higher Km values. Glycine and proline are poor substrates of B0AT1. As a result additional transporters are involved in the uptake of imino acids and glycine, such as PAT1 (SLC36A1), PAT2 (SLC36A2), and IMINO (SLC6A20) (6). Additional transport systems for other neutral amino acids in the kidney and intestine have been proposed; these include a specific intestinal transporter for methionine and phenylalanine (7) and the amino acid antiporter ASCT2 (SLC1A5) as a mediator of small neutral amino acids and glutamine uptake in kidney and intestine (8).
Efficient trafficking and surface expression of B0AT1 at the apical membrane of the kidney and intestine requires coexpression of the type I membrane protein homologs collectrin (TMEM27) (9) or angiotensin-converting enzyme 2 (ACE2)2 (10), respectively. In the absence of these auxiliary proteins, B0AT1 remains sequestered within intracellular compartments.
Reduced uptake of neutral amino acids is observed in the rare inherited malabsorption syndrome Hartnup disorder (11). Hartnup disorder is characterized by highly elevated levels of neutral amino acids in the urine and reduced neutral amino acid uptake in the intestine. In some individuals clinical symptoms such as skin rash, cerebellar ataxia, and psychotic behavior are observed. Furthermore, individuals with Hartnup disorder tend to be of smaller stature, although the significance of these data is limited due to the small number of clinically evaluable cases (12). In 2004 we and others showed that Hartnup disorder is caused by mutations in SLC6A19 (13, 14). The frequency of one SLC6A19 allele (D173N) was surprisingly common in the normal population (13). Mice lacking collectrin (Tmem27) have a similar renal phenotype as humans with Hartnup disorder but lack the intestinal phenotype (9). Ace2 nullizygous mice have a more complex phenotype including cardiac deficiencies and glomerulosclerosis but exhibit normal urine amino acid levels (15, 16).
A number of questions remain unanswered from studies of Hartnup disorder and intestinal amino acid transport. First, what is the significance of amino acid transport for protein nutrition relative to peptide transport in the intestine? Second, is B0AT1 the only neutral amino acid transporter in the intestine? Last, what is the basis of the clinical symptoms observed in Hartnup disorder?
To address these questions, we have examined a variety of physiological and pathological parameters in a new Slc6a19 nullizygous mouse model to gain further insights into amino acid transport in the intestine and kidney. The results suggest that B0AT1 is the major neutral amino acid transporter in the intestine and that the absence of B0AT1 reduces growth and impairs body weight control and insulin response.
EXPERIMENTAL PROCEDURES
Slc6a19 Nullizygous Mice
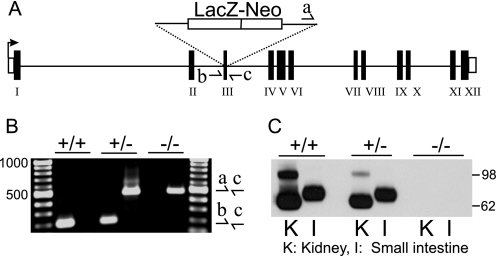
Slc6a19 nullizygous mice were purchased on the 129 background under license from Deltagen (San Mateo, CA). The mice were generated from embryonic stem cells in which exon 3 of Slc6a19 was targeted by homologous recombination by replacing nucleotides 438–466 (RefSeq NM_028878) by a LacZ-Neo (βgeo) cassette (Fig. 1A). Slc6a19 heterozygous mice were then backcrossed onto the inbred C57BL/6J strain for at least four generations (N4). In most experiments N4 nullizygous mice were compared with wild type littermates. Where indicated, nullizygous mice backcrossed for 8 generations (N8) were used for phenotypic analysis and compared with heterozygous and homozygous littermates. The genotype of the mice was confirmed in two independent laboratories using different sets of primers as listed in supplemental Table 2. Genotyping for nicotinamide nucleotide transhydrogenase was performed as described (17). All animal breeding and experimentation was performed according to institutional guidelines for the care and use of experimental animals (ANU F.BMB.35.07 and CI K75-9-2009-3-512). Any blood samples were removed by retroorbital bleeding, and animals were sacrificed by cervical dislocation or CO2 asphyxiation.
FIGURE 1.
Confirmation of gene targeting in Slc6a19 nullizygous mice. A, schematic representation of the insertion of the LacZ-Neo cassette into exon 3 of the Slc6a19 gene is shown. B, genotype confirmation using PCR detecting the targeted allele (primer pair a and c, 485 bp) or the wild type allele (primer pair b and c, 201 bp) is shown. C, expression of B0AT1 protein was detected by SDS-PAGE and Western blotting in BBMV derived from kidney (K) and small intestine (I). Genotypes (Slc6A19 wild type (+/+), heterozygous (+/−), and nullizygous (−/−)) and molecular weights are indicated in the panel margins.
Transport Studies
Radiolabeled amino acids were purchased from GE Healthcare or MP Biomedicals. The following compounds were used: l-[3H]carnosine, [U-14C]glycine, d-[U-14C]glucose, d-[1,3-3H]glucose, l-[U-14C]glutamate, l-[U-14C]glutamine, l-[G-3H]glutamine, l-[U-14C]histidine, l-[U-14C]leucine, l-[3,4,5-3H]leucine, l-[U-14C]proline, l-[2,3,4,5-3H]proline, and l-[5-3H]tryptophan. Usually tritium-labeled compounds were used when a high specific activity was required (e.g. vesicle experiments); otherwise, 14C-labeled compounds were used.
Brush-border membrane vesicles (BBMV) from kidney were prepared following the protocol of Biber et al. (18). Kidney BBMV were used for transport studies when the alkaline phosphatase activity was more than 15-fold enriched in the BBMV compared with homogenate. Vesicles were preloaded with K+ by incubation for 30 min in 93 mm K2SO4, 10 mm MES-Tris, pH 7.5, at 25 °C. Subsequently, vesicles were centrifuged at 48,000 × g for 30 min and resuspended at a concentration of 2–4 μg/μl in mannitol buffer (280 mm mannitol, 10 mm MES-Tris, pH 7.5). The concentrated vesicles (20 μl) were energized for 1 min at 37 °C by the addition of valinomycin at a final concentration of 100 μg/ml. Subsequently, 80 μl of transport buffer was added to this mixture, resulting in a final concentration of 100 μm radiolabeled substrate (for 14C-labeled substrates, 0.3 μCi carrier-free compound was added; for 3H-labeled substrates, 0.5 μCi of carrier-free compound was added). Two types of transport buffer were used: a Na+-containing buffer (100 mm NaCl, 80 mm mannitol, 10 mm MES-Tris, pH 7.5) and a Na+-free buffer (280 mm mannitol, 10 mm MES-Tris, pH 7.5). For amino acid transport the overshoot peak was determined after 15 s, and the equilibrium time point was taken after 5 min. The choice of the equilibrium time point was based on the observation that vesicles appeared to bind labeled amino acids non-specifically when the equilibrium value was measured after 30 or 60 min.
To prepare intestinal vesicles, animals were sacrificed, and all three sections (duodenum, jejunum, and ileum) of the small intestine were quickly removed and placed in an ice-cold storage solution (0.9% NaCl, 1 mm glutamine, “complete” protease inhibitor, EDTA-free (Roche Diagnostics), 1 tablet per 50 ml). Using a syringe, the intestine was rinsed with the storage solution to remove any feces and inverted by sliding it over a metal rod. The inverted intestine was placed in a Petri-dish containing ice-cold 300 mm mannitol, 5 mm EGTA, 12 mm Tris, pH 7.4, solution containing 2 mm glutamine or 2 mm glucose and protease inhibitor. Mucosal cells were removed by scraping the intestine with a microscope slide. Subsequently, BBMV were prepared as described by Biber et al. (18).
BBMV from intestine showed little transport activity and, therefore, inverted sections of small intestine were used for transport studies. The inverted intestine was prepared as described above and placed in a Petri dish containing Hanks' buffered salt solution (136.6 mm NaCl, 5.4 mm KCl, 0.44 mm KH2PO4, 2.7 mm Na2HPO4, 1.26 mm CaCl2, 0.5 mm MgCl2, 0.4 mm MgSO4, 10 mm HEPES, pH 7.4) containing 2 mm glutamine or glucose and protease inhibitor. For transport measurements, the intestine was cut into 1-cm pieces before sliding it onto plastic stirring rods. The rods were placed in 5-ml γ-counter tubes containing 2 ml of Hanks' buffer, 100 μm unlabeled and 5 μCi carrier-free labeled substrate. For transport in Na+-free conditions, NaCl was replaced by choline-Cl and Na2HPO4 was replaced by K2HPO4. All transport experiments were performed at 37 °C.
Immunofluorescence
Kidney and intestinal samples were fixed in 10% neutral-buffered formalin for at least 24 h. Subsequently, specimens were dehydrated by sequential changes of 80, 95, then 100% ethanol followed by washes in xylene. Dehydrated tissues were then embedded in paraffin, sectioned using a microtome, and placed on poly-l-lysine-coated slides. Before staining, the slides were de-paraffinized through sequential 10-min immersions in Histoclear (GeneWorks, Hindmarsh, SA, Australia), 95% ethanol, and 100% ethanol followed by two 10-min washes in PBS and two 5-min washes in triple distilled water. De-paraffinized slides were immersed in 600 ml of 0.1 m citrate buffer, pH 6.0, that was maintained at a rolling boil for 15 min. Submerged slides were further incubated in the cooling buffer for 20 min before washing twice in PBS. Tissues were outlined with a Pap Pen (Invitrogen) before applying 200 μl of 20% BlokHen IITM (Aves Laboratories, Tigard, OR) in PBS to each section. The primary antibodies were applied to the section, and binding was detected with fluorochrome-conjugated secondary antibodies. Both antibodies were applied for 30 min each at 37 °C in a humidified incubation chamber. All reagents were diluted in PBS according to supplemental Table 1. After each incubation, the slides were washed 3 times in PBS to remove any unbound antibodies. Finally, sections were mounted in ProLong Gold anti-fade reagent (Invitrogen) to preserve the fluorescence of the section and set overnight before visualization.
Digital images were obtained using the 40× or 60× oil objective with a Leica Application Suite for Advanced Fluorescence system installed on a Leica TSC SP5 confocal microscope using the lasers according to the fluorochrome used. As a control, sections were stained with secondary antibody only. Images were, if necessary, processed using Adobe Photoshop CS3 Extended Version 10.0.1 (Adobe Systems, San Jose, CA) to enhance contrast. Images of controls and treated slices were processed with the same settings.
SDS-PAGE and Western Blotting
Protein samples were separated by SDS-PAGE and blotted onto nitrocellulose membranes by electrophoretic transfer. After blocking nonspecific binding sites, proteins were probed using antibody dilutions as listed in supplemental Table 1 before being detected by enhanced chemiluminescence (ECL system, GE Healthcare).
Histology
To compare the intestinal morphology of Slc6a19 nullizygous and wild type (C57Bl/6J) mice, three adult male mice of each genotype were sacrificed before segments of jejunum and ileum were harvested. Tissues were fixed in 10% neutral-buffered formalin for subsequent paraffin embedding and sectioning at 6-μm thickness. Slides were then deparaffinized through sequential 10-min immersions in Histoclear (GeneWorks, Australia), 95% ethanol, and 100% ethanol before incubating in Harris hematoxylin (Fronine, Australia) for 40 min to stain cell nuclei. After rinsing for 2 min each in deionized water and Scott's Blueing Solution (Sigma), the slides were briefly dipped in 80% ethanol before incubating in alcoholic Eosin-Y solution containing 0.1% phloxine (Fronine) for 10 min. The slides were then rapidly dehydrated in graded changes of alcohol and Histoclear, mounted in DPX (Sigma), and viewed on a Leica MZ FLIII fluorescence stereomicroscope (Leica Microsystems).
Urine Amino Acid Analysis
Mice were held for 24 h in metabolic cages to collect urine. Urine samples (50 μl) were treated with 50 units of urease (50 μl) at 37 °C for 30 min. Subsequently, samples were cleared by centrifugation and 300 μl methanol and 15 μl ribitol (2 mg/ml) was added. Samples were mixed and dried in a SpeedVac. Methoximation of carbonyl groups was performed by the addition of 20 μl of methoxylamine-HCl to the dry samples followed by incubation for 90 min at 37 °C. Trimethylsilyl esters were then created by the addition of 40 μl N-trimethylsilyl-N-methyltrifluoroacetamide, and the samples were incubated for a further 30 min at 30 °C.
For the gas chromatography-mass spectrometry (GC-MS) analysis, samples were injected as 1 μl of derivatized metabolites in a 20:1 split ratio. The GC-MS equipment consisted of an Agilent 7680 autosampler, an Agilent 7890 gas chromatograph, and an Agilent 5975 N quadrupole mass spectrometer (Agilent, Palo Alto, CA). The GC-MS system was auto-tuned using perflurotributylamine. A 30-m Varian VF-5 ms column with a 10-m integrated Varian EZ-Guard column was used for the gas chromatography (Varian, Palo Alto, CA). Injection temperature was 230 °C, interface temperature was 300 °C, and the ion source temperature was 230 °C. The temperature gradient consisted of an initial temperature of 70 °C increasing 15 °C per min to a final temperature of 300 °C. Mass spectra and chromatograms were normalized to the ribitol internal standard and processed using AnalyzerPro (SpectralWorks Ltd, Runcorn, UK) employing the MatrixAnalyzer function.
Amino Acid Signaling and Insulin Determination
The small intestine was removed, inverted as described for the transport assay, and placed in Hanks' buffered salt solution. The sections were incubated in 50 mm leucine for 30 min at 37 °C. This concentration is similar to the total concentration of amino acids in the lumen of the intestine after a meal (1). Subsequently, two sections of 1 cm each were homogenized in 1 ml of radioimmune precipitation assay buffer (100 mm Tris-HCl, pH 7.5, 150 mm NaCl, 1 mm EDTA, 1% Triton X-100, 0.5% sodium deoxycholate, 0.1% SDS) supplemented with complete protease inhibitor (Roche Diagnostics). The homogenates were centrifuged at 10,000 × g for 10 min, and a volume of the clear supernatant containing 100 μg of protein was used as a sample for SDS-PAGE. Proteins were detected as described under SDS-PAGE and Western blotting.
To determine the insulin response, mice were fasted for 12–16 h, and 20–50 μl of blood was collected before and 60 min after the addition of premoistened chow into the cage. Glucose levels were measured using a calibrated blood glucose meter (Accu-Chek). Plasma insulin levels were determined by an enzyme-linked immunosorbent assay specific for mouse insulin (Alpco Diagnostics, Salem, NH).
Mouse Body Weight and Diet Experiments
Mice body weight experiments were performed with litters from female Slc6a19 heterozygous founders crossed with male Slc6a19 wild type, heterozygous, or nullizygous founders to reduce any variation in maternal nutritional supplementation. All mice were weighed every 2–3 days. Genotype and gender was determined at day 22. For diet experiments, animals were fed ad libitum with either low, normal, or high protein diet (6, 20, or 40% protein, respectively) for at least 11 days with 1–3 animals per cage. Weights of live mice were measured at least every second day using a fine scale. For measuring diet-induced changes in lean and fat tissue contribution to total weight, mice were anesthetized and placed in a Lunar PIXImus densitometer (GE Medical Systems), and each mouse was subjected to three measurements both before and after change of diet.
Expression of Slc6a19
Pancreas tissue was immediately placed in lysis buffer (Nucleospin RNA II, Macherey-Nagel) and homogenized. Slc6a19 mRNA was detected after reverse transcription by 26 cycles of PCR using primers as listed in supplemental Table 2.
Statistical Analysis
All transport experiments were performed three times, and representative samples are shown in the figures. The number of mice used for each experiment is stated in the figure legends. When comparing parametric data from two groups, the unpaired t test was used. When comparing more than two groups, analysis of variance combined with Student-Newman-Keuls multiple comparison test was used. The χ2 test was used to compare the expected versus experimental data. Probability values for differences to occur by chance are indicated: *, p < 0.05; **, p < 0.01; ***, p < 0.001.
RESULTS
The Slc6a19 nullizygous mouse was generated from embryonic stem cells targeted by homologous recombination (Deltagen) to replace nucleotides 438–466 (reference sequence NM_028878) in Slc6a19 exon 3 by a LacZ-Neo cassette (Fig. 1A). The presence of wild type or targeted mutant Slc6a19 alleles was verified by PCR (Fig. 1B), and the lack of B0AT1 protein in BBMV from kidney and intestine was confirmed by SDS-PAGE and Western blotting (Fig. 1C). The ratio of wild type, heterozygous, and homozygous littermates from Slc6a19 heterozygous founders was consistent with inheritance of a Mendelian trait. The numbers of each genotype from a sample of 88 animals were wild type 21, heterozygous 42, and homozygous 25, which is not significantly different from the expected ratio of 22:44:22 (χ2 test p = 0.878). This suggested that the absence of Slc6a19 does not affect the viability of the growing embryo.
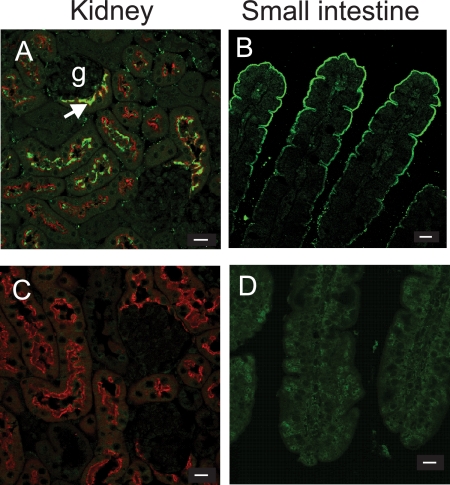
We detected B0AT1 protein by immunofluorescence in both the kidney and intestine of wild type mice (Fig. 2) as we and others have reported recently (10, 19, 20). In wild type kidney, expression of B0AT1 was co-localized with the proximal tubule marker Lotus tetragonolobus agglutinin on the apical membranes of proximal tubular epithelial cells (Fig. 2A). In the intestine, B0AT1 was detected in the apical membrane of enterocytes, with expression increasing toward mature enterocytes at the tip of the villus (Fig. 2B). No immunofluorescence was detected in kidneys of Slc6a19 nullizygous mice (Fig. 2C), whereas in the intestine a weak nonspecific staining was observed (Fig. 2D). To investigate whether the absence of B0AT1 had any consequences on the anatomical structure of the intestine, we performed histological analyses of hematoxylin- and eosin-stained organs from Slc6a19 nullizygous and wild type mice. Blinded examination revealed no difference in the morphology of intestine samples from Slc6a19 nullizygous mice compared with those from wild type mice (data not shown).
FIGURE 2.
Immunolocalization of B0AT1 in intestine and kidney. Expression of B0AT1 protein was detected in wild type (A and B) and Slc6a19 nullizygous mice (C and D) by immunofluorescence (green) in the apical membrane of intestinal enterocytes (B and D) and in the early segments of the kidney proximal tubule (A and C). The arrow in panel A indicates the beginning of the proximal tubule next to a glomerulus (g). Apical staining in the proximal tubule was identified by costaining with L. tetragonolobus lectin (red). The bars in the lower right corner indicate a distance of 10 μm.
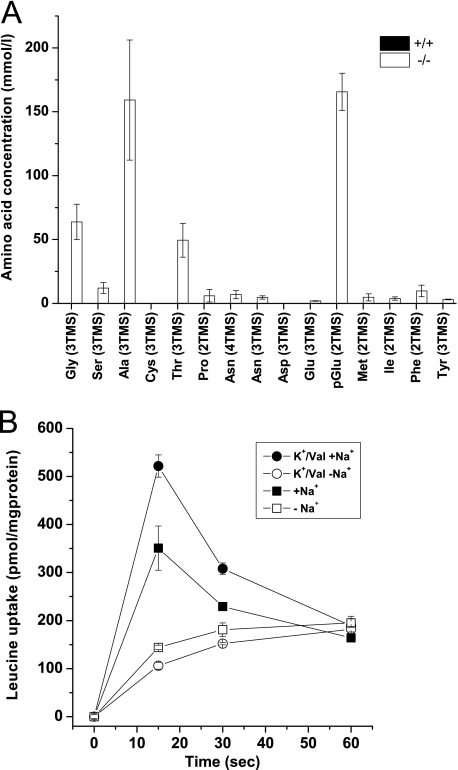
The hallmark of Hartnup disorder is an increased excretion of neutral amino acids with the urine due to reduced reabsorption. To verify that Slc6a19 nullizygous mice display the same aminoaciduria as humans, we analyzed urinary amino acids by GC-MS. Amino acids were below the detection limit in the urine of wild type mice, whereas large amounts of neutral amino acids, such as alanine, asparagine, glycine, glutamine, isoleucine, methionine, phenylalanine, serine, threonine, and tyrosine were observed in the urine of Slc6a19 nullizygous mice (Fig. 3A), consistent with the human Hartnup disorder phenotype. Due to the derivatization method employed, glutamate and the majority of glutamine were converted into pyroglutamate and could not be discriminated, whereas tryptophan cannot be detected by this method.
FIGURE 3.
Urine amino acid analysis and transport assay in BBMV. A, urine was collected for 24 h from each wild type (+/+) and nullizygous (−/−) mice. In the samples, amino acids were analyzed by GC-MS, and the peak areas were normalized to that of the internal control ribitol. The most abundant derivative for each amino acid is shown. Trimethylsilyl (TMS) indicates derivatization with trimethylsilyl residues, and the preceding number refers to the multiplicity of derivatization. The figure shows the mean ± S.E. urine concentration of n = 4 mice from each genotype; amino acids were below the detection limit in the wild type samples. B, basic properties of leucine transport in mouse renal BBMV are shown. Uptake of [14C]leucine (0.1 mm) was studied in renal BBMV derived from wild type mice in the presence and absence of Na+. To establish an inside-negative membrane potential, vesicles were preloaded with 93 mm K2SO4 and treated with valinomycin (Val, 1 μg/ml) before the uptake experiments.
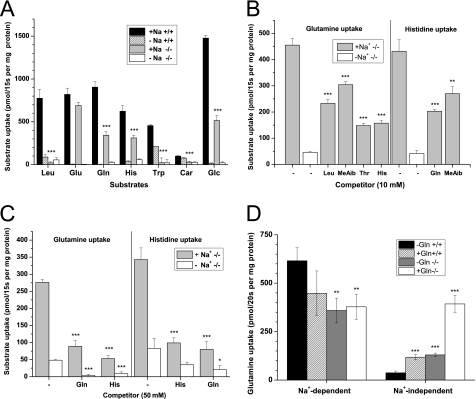
Transport experiments were performed to evaluate the role of B0AT1 in neutral amino acid uptake in kidney and intestine. In mouse renal BBMV isolated from wild type mice, leucine uptake showed a Na+-dependent overshoot (maximal at 15 s), indicating an active transport process (Fig. 3B). Imposition of a K+ diffusion potential using valinomycin in vesicles preloaded with potassium further increased leucine uptake, indicating an electrogenic transport process. These characteristics of Na+-dependent leucine uptake into renal BBMV were consistent with the properties of system B0 as described in earlier studies and with the transport properties of the B0AT1 transporter (4, 21, 22). For all subsequent figures the 15-s time point is presented after subtraction of non-specifically bound radiolabel. The Na+-dependent leucine uptake observed in wild type renal BBMV (Fig. 4A) was absent in Slc6a19 nullizygous mice. The small amount of Na+-independent leucine transport observed in both animal groups may reflect a contamination of the BBMV with fragments of basolateral membrane. Glutamate uptake, which is largely mediated by Slc1a1 (EAAT3/EAAC1) (23, 24), was similar in both groups of mice. Surprisingly, glucose transport was reduced by more than 50% in the Slc6a19 nullizygous mice.
FIGURE 4.
Nutrient uptake in kidney BBMV from wild type and Slc6a19 nullizygous mice. A, uptake of radiolabeled nutrients (0.1 mm) was studied in renal BBMV derived from wild type (+/+, black and hatched bars) and Slc6a19 nullizygous animals (−/−, gray and white bars) in the presence (black and gray bars) and absence (hatched and white bars) of Na+. B and C, glutamine and histidine uptake (0.1 mm) was measured in Slc6a19 nullizygous mice in the presence (gray bars) and absence (white bars) of Na+ and in the presence of 10 mm (B) or 50 mm (C) unlabeled amino acids or amino acid analogues. D, to detect Na+-dependent antiport activity as carried out by ASCT2 (Slc1a5), Na+-dependent and Na+-independent glutamine uptake was determined in vesicles that were preloaded with 20 mm glutamine for 30 min or remained in control buffer. For each experiment kidneys from at least three animals were pooled, and each bar represents the mean ± S.D. of three vesicle samples. Significant differences between wild type and Slc6a19 nullizygous mice are indicated in panels A and D and to the uninhibited controls in panel B and C.
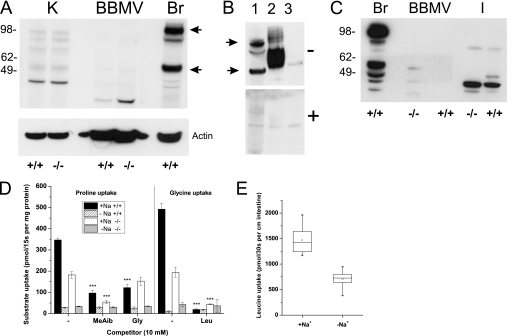
Tryptophan deficiency due to lack of transport is thought to play a crucial role in the development of clinical symptoms in Hartnup disorder (25). Tryptophan transport in wild type renal BBMV was largely Na+-dependent. Both the Na+-dependent and the Na+-independent component of tryptophan uptake were absent in Slc6a19 nullizygous mice (Fig. 4A). Glutamine and histidine uptake were also almost entirely Na+-dependent in wild type mice, but Slc6a19 nullizygous mice showed residual transport activity for both amino acids (Fig. 4A). The remaining Na+-dependent glutamine transport activity in Slc6a19 nullizygous mice was partially inhibited by histidine, threonine, and to a lesser extent by leucine and the amino acid analog N-methylaminoisobutyric acid (MeAib) (Fig. 4B). Vice versa, histidine uptake was also partially inhibited by glutamine and MeAib (Fig. 4B). To evaluate whether the residual activity for both amino acids was mediated by the same carrier, we challenged the uptake of 100 μm [3H]glutamine or 100 μm [14C]histidine with 50 mm unlabeled glutamine or histidine (Fig. 4C). This excess of unlabeled substrate reduced both glutamine and histidine uptake by almost 70%, whereas Na+-independent glutamine transport was completely abolished (Fig. 4C). The Na+-dependent glutamine transporter ASCT2 (Slc1a5) has been reported to be involved in glutamine uptake in the kidney (8). Because ASCT2 is an amino acid antiporter, its activity is only visible in BBMV when preloaded with glutamine as an antiport substrate. No stimulation of Na+-dependent glutamine uptake in vesicles derived from wild type and Slc6a19 nullizygous mice was observed under these conditions, refuting the presence of ASCT2 activity. Only the Na+-independent glutamine uptake was significantly increased (Fig. 4D). To further evaluate the presence of ASCT2 in proximal tubules, we performed SDS-PAGE and Western blotting with renal BBMV proteins using brain tissue as a positive control (Fig. 5A). In brain tissue extract two bands were detected with molecular masses of ∼55 and 100 kDa, consistent with the detection of a monomer (calculated mass 58 kDa) and dimer of the transporter. Both bands disappeared when the antibody was preincubated with the immunogenic peptide (Fig. 5B). Although two bands corresponding to ASCT2 were detected in kidney, neither of these was enriched in BBMV, suggesting that ASCT2 is not expressed in the apical membrane of the proximal tubule in mice. Similarly, we observed weak ASCT2-like immunoreactivity in homogenates from small intestine, which was also not enriched in BBMV, suggesting expression of ASCT2 outside the apical membrane or epithelial cells (Fig. 5C).
FIGURE 5.
Detection of ASCT2 and transport in renal BBMV and sections of inverted intestine. Panel A, SDS-PAGE and Western blotting was used to detect ASCT2 ((Slc1a5) calculated mass 58-kDa monomer and 116-kDa dimer) in mouse kidney homogenate (K), BBMV and brain homogenate (Br). B, protein extracts were made from brain tissue (lane 1), oocyte plasma membranes expressing ASCT2 (lane 2), and non-injected oocytes (lane 3). After separation by SDS-PAGE, samples were blotted onto nitrocellulose and detected with ASCT2 antiserum (−). In the lower panel (+) the immunoreactivity was blocked by preincubation of the antiserum with the immunogenic peptide (2 μg/ml). C, detection of ASCT2 by immunoblotting after separation of protein extracts from brain (Br), intestinal BBMV, and intestinal tissue homogenate (I) is shown. D, proline and glycine uptake (0.1 mm) was measured in the presence and absence of Na+ and in the absence and presence of 10 mm unlabeled amino acids. Kidneys from at least three animals were pooled for each experiment, and each bar represents the mean ± S.D. of three vesicle samples. Significant differences to uninhibited controls are indicated. E, leucine uptake activity in Na+-containing and Na+-free buffer was measured in 10 randomly selected 1-cm-long pieces of mouse small intestine, derived from 3 different mice, and is depicted as a quartile box-and-whisker plot. The Slc6a19 genotypes are indicated as +/+ and −/−.
Renal dipeptide uptake was assayed using the PepT2 (Slc15a2) substrate carnosine (β-alanyl-histidine, Fig. 4A). Carnosine uptake in kidney BBMV was Na+-independent and appeared to be slightly reduced in Slc6a19 nullizygous mice. However, its uptake was small compared with leucine uptake at the same concentration (100 μm).
Transport experiments with renal BBMV revealed that B0AT1 also mediates a substantial part of proline and glycine transport (Fig. 5D). Glycine uptake, which was largely Na+-dependent, was reduced by ∼60% in Slc6a19 nullizygous mice. Glycine uptake in both animal groups was inhibited by leucine, suggesting the presence of a second neutral amino acid transporter. Proline uptake was reduced by about 50% in Slc6a19 nullizygous mice. The remaining activity was Na+-dependent and sensitive to inhibition by MeAib, but not by glycine, suggesting that it was mediated by the IMINO transporter (Slc6a20a). Overall, the results demonstrate that B0AT1 is the major neutral amino acid transporter in the kidney. Additional transport activities were found for glutamine/histidine, proline, and glycine.
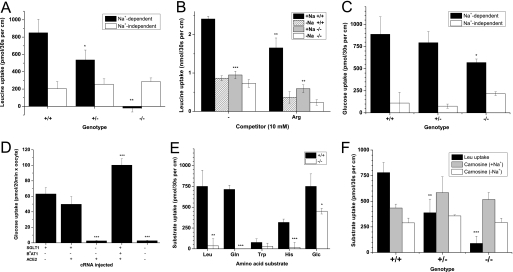
Intestinal vesicles, despite containing large amounts of B0AT1 protein (see Fig. 1C), showed a very low transport activity. As a result we used inverted intestine to study transport in this tissue. For transport experiments, randomly selected 1-cm-long sections of the complete small intestine were used as no obvious gradient of transport activity was observed along the small intestine (Fig. 5E). Leucine uptake in inverted sections of the small intestine was largely Na+-dependent, but the residual Na+-independent transport in the intestine was greater than in kidney BBMV (Figs. 5E and 6A). The Na+-dependent leucine uptake was reduced by ∼50% in heterozygous animals (p < 0.05) and disappeared completely in Slc6a19 nullizygous mice (Fig. 6A). In contrast, the Na+-independent component remained largely unchanged in all genotypes. This component was partially inhibited by arginine, suggesting that it was mediated in part by the heterodimeric cationic amino acid transporter rBAT/b0,+AT (Slc3a1/Slc7a9) (Fig. 6B). Similar to the kidney, the lack of B0AT1 also had an effect on intestinal glucose uptake, which was reduced by ∼40% in Slc6a19 nullizygous mice (p < 0.01; Fig. 6C). To explain this finding, we considered the possibility that the apical glucose transporter SGLT1 (Slc5a1) may form a complex with B0AT1. Consistent with this idea, coexpression of B0AT1, ACE2, and SGLT1 in oocytes increased the activity of SGLT1 (Fig. 6D).
FIGURE 6.
Nutrient uptake in mouse intestine. Sections of inverted intestine (1 cm) were incubated with radiolabeled substrates (0.1 mm) for 30 s at 37 °C. Subsequently, sections were washed three times in ice-cold transport buffer, and the incorporated activity was determined by scintillation counting. Leucine uptake was measured in the presence and absence of Na+ in Slc6a19 wild type (+/+), heterozygous (+/−), and nullizygous (−/−) intestines (A) and in the absence and presence of 10 mm arginine (B). C, glucose uptake was measured in the presence and absence of Na+ in wild type, heterozygous, and Slc6a19 nullizygous intestines. D, oocytes were injected with cRNA encoding SGLT1, B0AT1, and ACE2. Glucose uptake was measured for 20 min, and the activity of non-injected control oocytes was subtracted in each case. E, Na+-dependent uptake of radiolabeled nutrients (each 0.1 mm) was measured in sections of inverted intestine derived from wild type and Slc6a19 nullizygous mice. F, uptake of carnosine (0.1 mm) was measured in sections of inverted intestine derived from wild type and slc6a19 nullizygous mice in the presence and absence of Na+. For each transport experiment, sections from at least three animals were pooled, and each bar represents the mean ± S.D. of three intestinal sections. Each experiment was performed at least three times with similar results. Statistical significance is indicated in relation to wild type activity in panels A, B, C, E, and F or to the control condition in D.
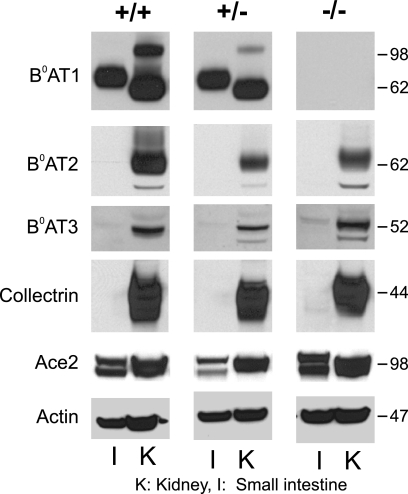
Na+-dependent glutamine, histidine, and tryptophan uptake was completely absent in Slc6a19 nullizygous mice (Fig. 6E) as well, indicating that active uptake of neutral amino acids in the intestine is mediated entirely by B0AT1. Leucine and glucose uptake were repeated in this panel for comparison. Dipeptide uptake, measured as carnosine transport, was largely Na+-independent, consistent with it being mediated by the proton-coupled peptide transporter PepT1 (Fig. 6F). The transport activity was similar in all three genotypes. Because peptide uptake was not up-regulated in Slc6a19 nullizygous mice, we investigated whether the expression of other neutral amino acid transporters was altered in response to the lack of B0AT1. SDS-PAGE and Western blotting of BBMV proteins from small intestine and kidney suggested that neither of the two related neutral amino acid transporters B0AT2 (Slc6a15) or B0AT3 (Slc6a18) was up-regulated in Slc6a19 nullizygous mice (Fig. 7). Moreover, no compensatory changes were observed for collectrin and ACE2, which are required for surface expression of B0AT1 in the kidney and in the intestine, respectively (10).
FIGURE 7.
Immunodetection of nutrient transporters and their ancillary proteins in mouse renal and intestinal brush-border membrane vesicles. BBMV were isolated from intestine (I) and kidney (K) derived from wild type (+/+), heterozygous (+/−), and Slc6a19 nullizygous (−/−) mice. Protein (30 μg) was separated by SDS-PAGE. Nutrient transporters and auxiliary proteins were detected by Western blotting using specific antibodies at the dilutions listed in supplemental Table 1.
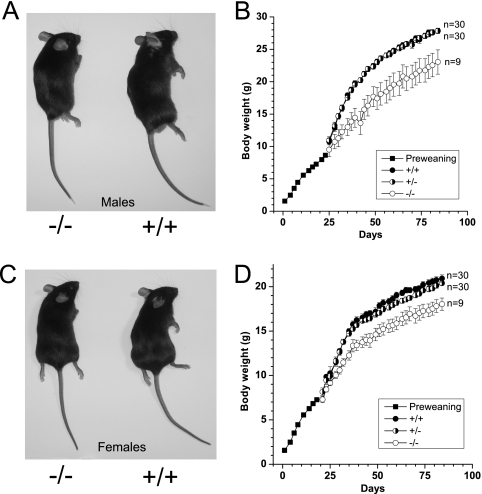
For human adults a daily protein intake of 0.8 g/kg of body weight is recommended (26). Amino acids, particularly glutamine, are used as energy substrates as well as to build up tissue mass. Skeletal muscle is the main storage organ for amino acids in the body. We hypothesized that the absence of B0AT1 could have an impact on body mass. Consistent with this hypothesis, Slc6a19 nullizygous mice appeared to be smaller in body size compared with heterozygous and wild type mice (Fig. 8, A and C). Body weight measurements of female and male groups of each genotype throughout postnatal development showed that Slc6a19 nullizygous mice had a lower body weight than heterozygous and wild type litter mates (Fig. 8, B and D). Before weaning and gender determination, which occurred at ∼22 days post-birth, homozygous, heterozygous, and wild type mice exhibited a similar rate of growth regardless of gender (Fig. 8, B and D). All litters were weaned from heterozygous Slc6a19 mothers to reduce any variation in maternal nutritional supplementation. However, post-weaning, the growth curves for male (Fig. 8B) and female (Fig. 8D) homozygous mice diverged from their heterozygous and wild type littermates. By 12 weeks of age, male and female Slc6a19 nullizygous mice weighed ∼17 and 14% less, respectively, than gender-matched adult wild type mice. The experiment was performed with both N4 and N8 (shown in the figure) mice compared with litter mates, both giving the same conclusion.
FIGURE 8.
Body weight and appearance of wild type and slc6a19 nullizygous mice. Appearance of male (54 days old) (A) and female (79 days old) (C) wild type and Slc6a19 nullizygous mice is shown. The body weight of male (B) and female (D) mice from mixed Slc6a19 wild type (+/+), heterozygous (+/−), and nullizygous (−/−) litters was measured over a period of 84 days. Genotypes were determined after weaning on day 22. Before day 22 the average body weight of all three genotypes is depicted.
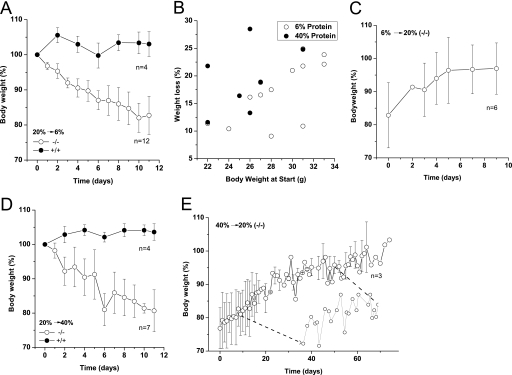
The change of body weight became more dramatic when mice were fed with diets of different protein composition. After reaching adulthood, mice of all genotypes maintained a relatively constant body weight on a standard 20% protein chow. However, Slc6a19 nullizygous mice rapidly lost weight on a 6% protein diet, whereas wild type mice maintained a constant body weight (Fig. 9A). Heavier Slc6a19 nullizygous mice tended to lose more weight (up to 25%) than lighter mice, even when analyzed on a percentage scale (Fig. 9B). Upon resumption of the normal diet (20% protein), Slc6a19 nullizygous mice regained weight within 8 days, some even compensating above their pre-diet weight (Fig. 9C). Surprisingly, the Slc6a19 nullizygous mice also lost weight when placed on a 40% protein diet, whereas wild type mice remained constant or even gained some weight (Fig. 9D). The weight recovery took longer when the mice were returned from a 40% diet onto 20% protein diet (Fig. 9E), and fluctuations of body weight were observed during recovery (Fig. 9E, inset). Together these results demonstrate that efficient absorption of amino acids in the intestine is critical for the control of body weight.
FIGURE 9.
Body weight changes in response to different diets. Wild type (+/+) and Slc6a19 nullizygous (−/−) mice were fed isocaloric diets with protein contents of 6, 20, and 40%. The 20% protein diet corresponds to standard mouse chow, with which no body weight change was observed (not shown). A, shown is body weight development on 6% protein diet. B, the correlation between weight loss and absolute body weight on diets of different protein content in Slc6a19 nullizygous mice is shown. Weight loss after 10 days is plotted against body weight at the start of the experiment. C, recovery of body weight development when Slc6a19 nullizygous mice were returned from a 6% protein diet to standard 20% protein diet is shown. D, body weight development on a 40% diet is shown. E, recovery of body weight development when Slc6a19 nullizygous mice were returned from a 40% protein diet to standard 20% protein diet is shown. The weight traces were averaged, and the mean ± S.D. for the indicated number of mice is depicted. Diets were used for 12 days before change to another diet. The inset shows the weight oscillation of an individual mouse between days 10 and day 50, which is not discernible in the averaged data.
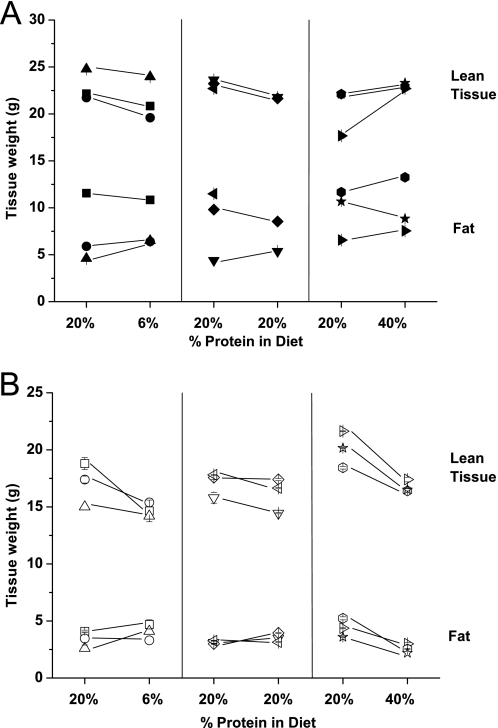
To analyze which components of the body changed during these experiments, we measured body fat and water content using x-ray-based densitometry. These data indicate that on a 6% protein diet, the Slc6a19 nullizygous mice mainly lost lean tissue (consisting mainly of muscle), whereas on a 40% diet they lost both lean tissue and fat (Fig. 10). Wild type mice exhibited only a small loss in lean tissue on the 6% diet, with smaller weight changes on both 20 and 40% diets. In addition they showed more variability in fat content than Slc6a19 nullizygous mice.
FIGURE 10.
Analysis of body tissue composition. Mice body composition in wild type (A) and Slc6a19 nullizygous mice (B) was analyzed using dual-energy x-ray absorption. Each data point presents an individual mouse and is the average of three repeat measurements. The amount of fat and lean tissue is shown for each mouse on a standard diet (20% protein) and after 10 days on diets of different protein content (6, 20 or 40%). The measurements on day 0 and day 10 are connected by lines.
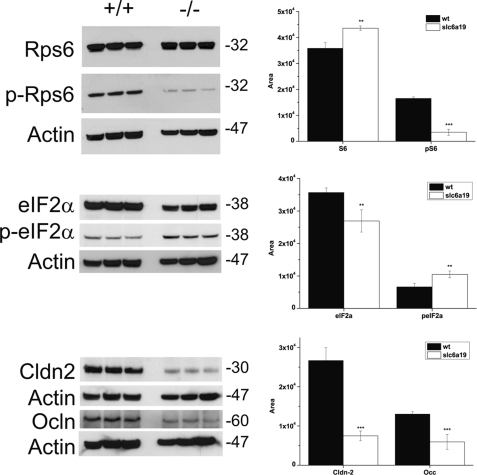
Amino acids are known to activate signaling via the mTOR pathway, thereby increasing protein translation. A lack of amino acids is sensed by the GCN2-ATF4 stress response pathway leading to a reduction of general protein synthesis (27). To investigate whether deletion of Slc6a19 results in altered mTOR signaling in the intestine, we measured the levels of total and phosphorylated S6 protein (Rps6 and p-Rps6). Similarly, we measured the levels of total and phosphorylated eIF2α, indicating the activity of the GCN2-ATF4 pathway. The total levels of Rps6 were similar in wild type and Slc6a19 nullizygous mice (Fig. 11). However, p-Rps6 was generally lower in Slc6a19 nullizygous mice, suggesting reduced signaling by the mTOR pathway due to the lack of amino acid uptake. Consistent with this, we observed a small increase in the phosphorylation of eIF2α, suggesting that the absence of B0AT1 causes amino acid deprivation in epithelial cells.
FIGURE 11.
Amino acid signal transduction in the intestine. Three sections of the small intestine (1 cm each) were removed from wild type and Slc6a19 nullizygous mice, combined, and homogenized to generate one sample. Three parallel samples (100 μg protein each) were separated by SDS-PAGE and blotted onto nitrocellulose. Subsequently, key proteins of amino acid signaling pathways were detected by specific antibodies as listed in supplemental Table 1. Bands were quantified by densitometry and normalized to the actin control as shown in the histograms. Black bars represent wild type data, and white bars represent Slc6a19 nullizygous mouse data.
Paracellular transport is a significant route for ion and water transport in the intestine and may also provide an alternative route for amino acid absorption. Permeability of tight junctions is controlled by claudins and occludins (28). To investigate whether the lack of B0AT1 had an impact on tight junction permeability, we measured the amount of the tight-junction markers claudin-2 (Cldn2) and occludin (Ocln) by SDS-PAGE Western blotting (Fig. 11). Both markers were significantly reduced in Slc6a19 nullizygous mice, suggesting that the lack of the transporter has a significant impact on epithelial permeability.
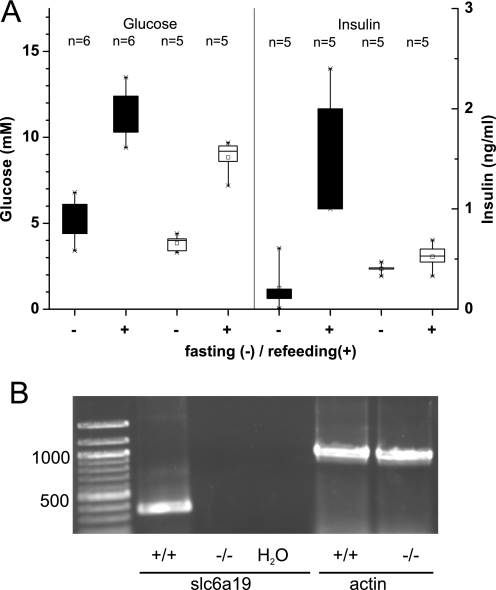
Amino acid uptake during digestion and absorption of foods leads to signaling processes not only in the intestine but also in other organs. The response of plasma insulin to the feeding-fasting cycle was blunted in Slc6a19 nullizygous mice (Fig. 12A). After 16 h of fasting, plasma insulin levels were higher in Slc6a19 nullizygous mice than in wild type mice, whereas 1 h after refeeding, insulin levels were lower in the Slc6a19 nullizygous animals than in wild type animals (Fig. 12A). Consistent with an effect of B0AT1 activity on insulin secretion, we could detect Slc6a19 mRNA in extracts of wild type mouse pancreas but not in Slc6a19 nullizygous mice (Fig. 12B).
FIGURE 12.
Insulin response and expression of Slc6a19 mRNA in mouse pancreas. A, wild type (black boxes) and Slc6a19 nullizygous animals (white boxes) were fasted for 16 h. Before refeeding, a blood sample was taken, and blood glucose and insulin levels were determined. 1 h after refeeding, a second blood sample was taken and analyzed for glucose and insulin. The number of animals used is indicated. B, mouse pancreas was rapidly isolated, and total RNA was used to detect transcription of Slc6a19 and actin with specific primers in wild type (+/+) and Slc6a19 nullizygous mice (−/−). A reaction without added RNA (H2O) was used as a control.
DISCUSSION
In this study we demonstrate that Slc6a19 nullizygous mice provide more than just a model of human Hartnup disorder. The mice offer insights into amino acid transport in kidney and intestine as well as signaling processes generated by nutritional protein. Neutral aminoaciduria, the most reliable Hartnup disorder phenotype, is reproduced in these mice. In humans, additional clinical symptoms are sometimes observed in young individuals, such as a skin rash, cerebellar ataxia, and psychotic behavior (25). We have not observed any signs of ataxia even when Slc6a19 nullizygous mice were held on a 6% protein diet, which resulted in significant weight loss. Some Slc6a19 nullizygous develop dermatitis; however, the numbers were too small for further analysis.
A putative mouse model for Hartnup disorder has been generated previously using random mutagenesis by N-ethyl-N-nitrosourea combined with screening by urine amino acid analysis (29). Surprisingly, the mutated locus in this mouse model was located within 0.8 centimorgans of the fibroblast growth factor 3 gene on chromosome 7 (30). This locus is not close to Slc6a19 (chromosome 13), Tmem27, or Ace2 (both chromosome X); moreover, there are no obvious candidate genes in this interval. As a result, the aminoaciduria observed in this strain remains unexplained.
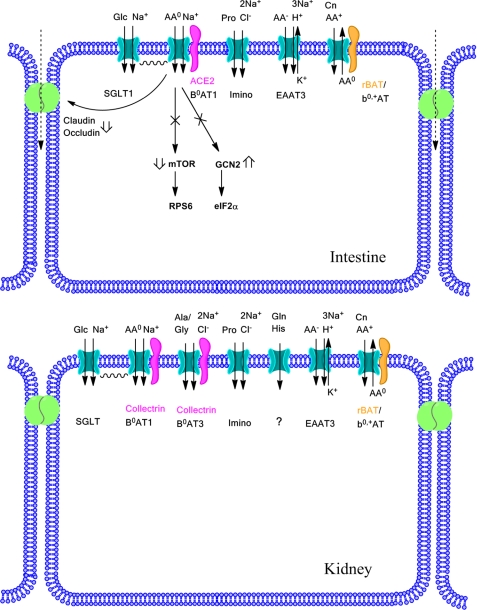
The transport studies demonstrate a surprisingly simple picture of neutral amino acid transport in the intestine (Fig. 13). It appears that B0AT1 is the only active neutral amino acid transporter for leucine, glutamine, histidine, and tryptophan. The ASCT2 transporter has previously been suggested to mediate a significant part of glutamine uptake in both intestine and kidney (8, 31). However, due to its Na+ dependence and substrate specificity, ASCT2 activity can be confused with that of B0AT1. Glutamine is one of the preferred substrates of ASCT2, and the complete absence of Na+-dependent glutamine uptake in intestinal sections of Slc6a19 nullizygous mice suggests that ASCT2 does not participate in glutamine uptake in this tissue. Nevertheless, immunofluorescence studies have suggested the presence of ASCT2 in the apical membrane of rabbit small intestine (8). By contrast, we did not detect ASCT2-like immunoreactivity in intestinal BBMV. Together these findings show that in mouse intestine, neutral amino acids are mainly transported by B0AT1. In addition, we detected significant Na+-independent uptake of neutral amino acids, which appears to reflect a non-productive neutral amino acid exchange via the heterodimeric amino acid transporter rbat/b0,+AT. Physiologically, this transporter exchanges luminal cationic amino acids against cytosolic neutral amino acids (32) and can thus be inhibited by neutral amino acids. In addition, paracellular uptake could contribute to Na+-independent uptake of neutral amino acids. Alternatively, neutral amino acids can be absorbed as di- or tripeptides (33). Uptake of the PepT1 substrate carnosine (34) was lower than leucine uptake, suggesting that amino acid uptake via B0AT1 has a similar or even higher capacity than peptide uptake via PepT1 (Slc15a1) at a substrate concentration of 100 μm. There was no compensatory increase of peptide uptake in Slc6a19 nullizygous mice. A recent analysis of Slc15a1 nullizygous mice supports the view that amino acid uptake is more dominant than peptide uptake in the intestine (2). SLC15A1 nullizygous mice did not show reduced growth or body weight. However, PepT1 appeared to be relevant for absorption of high protein loads.
FIGURE 13.
Overview of amino acid transport in intestine and kidney. Emphasis is given to processes affected by deletion of Slc6a19. More details are provided in “Discussion”. AA, amino acid; Cn, cystine; Glc, glucose.
In mouse kidney, B0AT1 provides the main transport activity for neutral amino acids. Flux measurements suggested the additional presence of a Na+-dependent glutamine/histidine transporter, which was inhibited by MeAib and thus may reflect system A activity. Detailed immunofluorescence studies of system A transporters SNAT1 (SLC38A1) and SNAT2 (SLC38A2) in the kidney have not been reported, but the transporters are expected to have a basolateral expression. ASCT2-like activity has been reconstituted from rat renal BBMV (35). However, we did not detect glutamine uptake in glutamine-preloaded BBMV from this tissue in mice and also could not detect ASCT2-like immunoreactivity in mouse renal BBMV. Thus, in contrast to previous reports using rabbit and rat tissue (8, 35) we conclude that there is no ASCT2-like activity in mouse renal BBMV. However, we cannot exclude species differences with regard to amino acid transport.
Because of the dominance of B0AT1 in neutral amino acid uptake, the complexity of glycine and proline transport has been difficult to evaluate (32). Recent studies from our laboratories provided evidence for the involvement of the proton-dependent glycine and proline transporter PAT2 (SLC36A2), the IMINO transporter (SLC6A20), and the glycine/alanine transporter B0AT3 (SLC6A18) in renal tubular transport of these two amino acids (6, 19). Glycine transport in both wild type and Slc6a19 nullizygous mice was completely inhibited by leucine, pointing to another neutral amino acid transporter and at the same time excluding a significant role of PAT2. Thus, glycine transport is most likely mediated by B0AT1 and B0AT3. This is consistent with the glycinuria and minor neutral aminoaciduria displayed by Slc6a18 nullizygous mice (16, 36) as well as the lack of inhibition of proline uptake by glycine observed in this study. The Na+ dependence and MeAib sensitivity of proline uptake indicates that it was most likely mediated by the IMINO transporter (37). Thus, in contrast to humans, where the bulk of glycine uptake is mediated by PAT2 and B0AT1 (6), in mice it is likely to be mediated by B0AT1 and B0AT3. Consistent with this observation, we found in a previous study that humans lacking SLC6A18 do not show glycinuria (6).
In addition to the insights gained into neutral amino acid uptake in kidney and intestine, this study represents the first demonstration that a lack of neutral amino acid uptake can cause significant changes in intracellular signaling processes and whole body homeostasis. The body weight and size of Slc6a19 nullizygous mice was reduced compared with wild type mice, which is in agreement with anecdotal observations in humans (12). Furthermore, we observed that these mice not only have a lower body weight but also have problems maintaining a constant body weight in response to diets of different protein content. Analysis of the different components of body mass in Slc6a19 nullizygous mice suggested that a switch to diets containing either 6 or 40% protein resulted in loss of lean tissue mass (mainly muscle), but in addition there was a reduction of fat on the 40% protein diet. The 40 and 20% diets are isocaloric, and as a result the 40% protein diet contains fewer carbohydrates. The loss of weight on the 40% protein diet may thus result from the reduced insulin response in the Slc6a19 nullizygous mice, which would normally stimulate conversion of glucose into fat. In addition Slc6a19 nullizygous mice showed reduced glucose uptake. The insulin response in Slc6a19 nullizygous mice was blunted both during fasting and feeding, demonstrating that nutritional protein levels have a modulatory role of the insulin response. This is consistent with the observed role of glutamine in the release of insulin from pancreatic β-cells (38). We could detect B0AT1 mRNA in pancreas but do not know whether it is expressed in β-cells, where the B0AT1 trafficking subunit collectrin has been found (39, 40). It has been reported that some strains of C57Bl/6J mice have deletions in the nicotinamide nucleotide transhydrogenase (Nnt), resulting in a reduced insulin response (17). Genotyping of the mice used in this study showed that all mice had the complete genomic sequence of Nnt gene (data not shown).
In addition we found that two key amino acid signaling pathways are altered in Slc6a19 nullizygous mice. The ribosomal S6 protein showed reduced phosphorylation, suggesting that the mTOR pathway in intestinal cells does respond to amino acids absorbed through the apical membrane and that this response is reduced in Slc6a19 nullizygous mice. Thus, the lack of apical uptake is not compensated by increased uptake across the basolateral membrane. Consistent with this observation, we found increased amounts of phospho-eIF2α, which indicates amino acid starvation and results in reduced protein synthesis (27). The consequences of these changes in signaling are as yet unknown; however, we observed reduced amounts of the tight-junction proteins claudin-2 and occludin, possibly allowing a higher level of paracellular amino acid transport to compensate for the lack of transcellular transport.
Our characterization of Slc6a19 nullizygous mice reveals that the major neutral amino acid transporter is an active regulator of amino acid signaling and whole body homeostasis. The B0AT1 transporter appears to be the major mechanism for neutral amino acid uptake in intestine and kidney.
Supplementary Material
Acknowledgments
We thank Nyasa Fook at the Animal Services Division (John Curtin School of Medical Research, Australian National University) for excellent maintenance of our mouse colonies. Many thanks to Jennifer Kofler (Australian Phenomics Facility, Australian National University) for technical assistance with the metabolic cage experiments and Angelo Theodoratos (Molecular Genetics Group, Department of Translational Biosciences, John Curtin School of Medical Research, Australian National University) for detailed discussions of Piximus Technology.
This work was supported by National Health and Medical Research Council Grant 525415, Australian Research Council Grant DP0877897, University of Sydney Bridging Grant RIMS2009-02579), and by an anonymous foundation.

The on-line version of this article (available at http://www.jbc.org) contains supplemental Tables 1 and 2.
- ACE2
- angiotensin-converting enzyme 2
- BBMV
- brush-border membrane vesicles
- MeAib
- N-methylaminisobutryic acid
- mTOR
- mammalian target of rapamycin.
REFERENCES
- 1. Matthews D. M. (1991) Protein Absorption, 1st Ed., Wiley-Liss, New York [Google Scholar]
- 2. Nassl A. M., Rubio-Aliaga I., Fenselau H., Marth M. K., Kottra G., Daniel H. (2011) Am. J. Physiol. Gastrointest. Liver Physiol., in press [DOI] [PubMed] [Google Scholar]
- 3. Bröer A., Klingel K., Kowalczuk S., Rasko J. E., Cavanaugh J., Bröer S. (2004) J. Biol. Chem. 279, 24467–24476 [DOI] [PubMed] [Google Scholar]
- 4. Böhmer C., Bröer A., Munzinger M., Kowalczuk S., Rasko J. E., Lang F., Bröer S. (2005) Biochem. J. 389, 745–751 [DOI] [PMC free article] [PubMed] [Google Scholar]
- 5. Camargo S. M., Makrides V., Virkki L. V., Forster I. C., Verrey F. (2005) Pflugers Arch. 451, 338–348 [DOI] [PubMed] [Google Scholar]
- 6. Bröer S., Bailey C. G., Kowalczuk S., Ng C., Vanslambrouck J. M., Rodgers H., Auray-Blais C., Cavanaugh J. A., Bröer A., Rasko J. E. (2008) J. Clin. Invest. 118, 3881–3892 [DOI] [PMC free article] [PubMed] [Google Scholar]
- 7. Stevens B. R., Ross H. J., Wright E. M. (1982) J. Membr. Biol. 66, 213–225 [DOI] [PubMed] [Google Scholar]
- 8. Avissar N. E., Ryan C. K., Ganapathy V., Sax H. C. (2001) Am. J. Physiol. Cell Physiol. 281, C963–C971 [DOI] [PubMed] [Google Scholar]
- 9. Danilczyk U., Sarao R., Remy C., Benabbas C., Stange G., Richter A., Arya S., Pospisilik J. A., Singer D., Camargo S. M., Makrides V., Ramadan T., Verrey F., Wagner C. A., Penninger J. M. (2006) Nature 444, 1088–1091 [DOI] [PubMed] [Google Scholar]
- 10. Kowalczuk S., Bröer A., Tietze N., Vanslambrouck J. M., Rasko J. E., Bröer S. (2008) FASEB J. 22, 2880–2887 [DOI] [PubMed] [Google Scholar]
- 11. Baron D. N., Dent C. E., Harris H., Hart E. W., Jepson J. B. (1956) Lancet 268, 421–428 [DOI] [PubMed] [Google Scholar]
- 12. Scriver C. R., Mahon B., Levy H. L., Clow C. L., Reade T. M., Kronick J., Lemieux B., Laberge C. (1987) Am. J. Hum. Genet. 40, 401–412 [PMC free article] [PubMed] [Google Scholar]
- 13. Seow H. F., Bröer S., Bröer A., Bailey C. G., Potter S. J., Cavanaugh J. A., Rasko J. E. (2004) Nat. Genet. 36, 1003–1007 [DOI] [PubMed] [Google Scholar]
- 14. Kleta R., Romeo E., Ristic Z., Ohura T., Stuart C., Arcos-Burgos M., Dave M. H., Wagner C. A., Camargo S. R., Inoue S., Matsuura N., Helip-Wooley A., Bockenhauer D., Warth R., Bernardini I., Visser G., Eggermann T., Lee P., Chairoungdua A., Jutabha P., Babu E., Nilwarangkoon S., Anzai N., Kanai Y., Verrey F., Gahl W. A., Koizumi A. (2004) Nat. Genet. 36, 999–1002 [DOI] [PubMed] [Google Scholar]
- 15. Imai Y., Kuba K., Ohto-Nakanishi T., Penninger J. M. (2010) Circ. J. 74, 405–410 [DOI] [PubMed] [Google Scholar]
- 16. Singer D., Camargo S. M., Huggel K., Romeo E., Danilczyk U., Kuba K., Chesnov S., Caron M. G., Penninger J. M., Verrey F. (2009) J. Biol. Chem. 284, 19953–19960 [DOI] [PMC free article] [PubMed] [Google Scholar]
- 17. Freeman H. C., Hugill A., Dear N. T., Ashcroft F. M., Cox R. D. (2006) Diabetes 55, 2153–2156 [DOI] [PubMed] [Google Scholar]
- 18. Biber J., Stieger B., Stange G., Murer H. (2007) Nat. Protoc. 2, 1356–1359 [DOI] [PubMed] [Google Scholar]
- 19. Vanslambrouck J. M., Bröer A., Thavyogarajah T., Holst J., Bailey C. G., Bröer S., Rasko J. E. (2010) Biochem. J. 428, 397–407 [DOI] [PubMed] [Google Scholar]
- 20. Romeo E., Dave M. H., Bacic D., Ristic Z., Camargo S. M., Loffing J., Wagner C. A., Verrey F. (2006) Am. J. Physiol. Renal Physiol. 290, F376–F383 [DOI] [PubMed] [Google Scholar]
- 21. Evers J., Murer H., Kinne R. (1976) Biochim. Biophys. Acta 426, 598–615 [DOI] [PubMed] [Google Scholar]
- 22. Fass S. J., Hammerman M. R., Sacktor B. (1977) J. Biol. Chem. 252, 583–590 [PubMed] [Google Scholar]
- 23. Bailey C. G., Ryan R. M., Thoeng A. D., Ng C., King K., Vanslambrouck J. M., Auray-Blais C., Vandenberg R. J., Bröer S., Rasko J. E. (2011) J. Clin. Invest. 121, 446–453 [DOI] [PMC free article] [PubMed] [Google Scholar]
- 24. Peghini P., Janzen J., Stoffel W. (1997) EMBO. J. 16, 3822–3832 [DOI] [PMC free article] [PubMed] [Google Scholar]
- 25. Bröer S. (2009) IUBMB Life 61, 591–599 [DOI] [PMC free article] [PubMed] [Google Scholar]
- 26. Lieberman M., Marks A. D. (2009) Basic Medical Biochemistry; A Clinical Appraoch, 3rd Ed., p. 12, Lippincott Williams & Wilkins, Baltimore [Google Scholar]
- 27. Kilberg M. S., Shan J., Su N. (2009) Trends Endocrinol. Metab. 20, 436–443 [DOI] [PMC free article] [PubMed] [Google Scholar]
- 28. Anderson J. M., Van Itallie C. M. (2009) Cold Spring Harb. Perspect. Biol. 1, a002584 [DOI] [PMC free article] [PubMed] [Google Scholar]
- 29. Symula D. J., Shedlovsky A., Guillery E. N., Dove W. F. (1997) Mamm. Genome 8, 102–107 [DOI] [PubMed] [Google Scholar]
- 30. Symula D. J., Shedlovsky A., Dove W. F. (1997) Mamm. Genome 8, 98–101 [DOI] [PubMed] [Google Scholar]
- 31. Ray E. C., Avissar N. E., Vukcevic D., Toia L., Ryan C. K., Berlanga-Acosta J., Sax H. C. (2003) J. Surg. Res. 115, 164–170 [DOI] [PubMed] [Google Scholar]
- 32. Bröer S. (2008) Physiol. Rev. 88, 249–286 [DOI] [PubMed] [Google Scholar]
- 33. Matthews D. M. (1972) Proc. Nutr. Soc. 31, 171–177 [DOI] [PubMed] [Google Scholar]
- 34. Son D. O., Satsu H., Kiso Y., Shimizu M. (2004) Biofactors 21, 395–398 [DOI] [PubMed] [Google Scholar]
- 35. Oppedisano F., Pochini L., Galluccio M., Cavarelli M., Indiveri C. (2004) Biochim. Biophys. Acta 1667, 122–131 [DOI] [PubMed] [Google Scholar]
- 36. Quan H., Athirakul K., Wetsel W. C., Torres G. E., Stevens R., Chen Y. T., Coffman T. M., Caron M. G. (2004) Mol. Cell. Biol. 24, 4166–4173 [DOI] [PMC free article] [PubMed] [Google Scholar]
- 37. Kowalczuk S., Bröer A., Munzinger M., Tietze N., Klingel K., Bröer S. (2005) Biochem. J. 386, 417–422 [DOI] [PMC free article] [PubMed] [Google Scholar]
- 38. Li C., Buettger C., Kwagh J., Matter A., Daikhin Y., Nissim I. B., Collins H. W., Yudkoff M., Stanley C. A., Matschinsky F. M. (2004) J. Biol. Chem. 279, 13393–13401 [DOI] [PubMed] [Google Scholar]
- 39. Fukui K., Yang Q., Cao Y., Takahashi N., Hatakeyama H., Wang H., Wada J., Zhang Y., Marselli L., Nammo T., Yoneda K., Onishi M., Higashiyama S., Matsuzawa Y., Gonzalez F. J., Weir G. C., Kasai H., Shimomura I., Miyagawa J., Wollheim C. B., Yamagata K. (2005) Cell Metab. 2, 373–384 [DOI] [PubMed] [Google Scholar]
- 40. Akpinar P., Kuwajima S., Krützfeldt J., Stoffel M. (2005) Cell Metab. 2, 385–397 [DOI] [PubMed] [Google Scholar]
Associated Data
This section collects any data citations, data availability statements, or supplementary materials included in this article.


