

Abstract
Accurately modeling unpaired regions of RNA is important for predicting structure, dynamics, and thermodynamics of folded RNA. Comparisons between NMR data and molecular dynamics simulations provide a test of force fields used for modeling. Here, NMR spectroscopy, including NOESY, 1H–31P HETCOR, DQF-COSY, and TOCSY, was used to determine conformational preferences for single-stranded GACC RNA. The spectra are consistent with a conformational ensemble containing major and minor A-form-like structures. In a series of 50 ns molecular dynamics (MD) simulations with the AMBER99 force field in explicit solvent, initial A-form-like structures rapidly evolve to disordered conformations. A set of 50 ns simulations with revised χ torsions (AMBER99χ force field) gives two primary conformations, consistent with the NMR spectra. A single 1.9 μs MD simulation with the AMBER99χ force field showed that the major and minor conformations are retained for almost 68% of the time in the first 700 ns, with multiple transformations from A-form to non-A-form conformations. For the rest of the simulation, random-coil structures and a stable non-A-form conformation inconsistent with NMR spectra were seen. Evidently, the AMBER99χ force field improves structural predictions for single-stranded GACC RNA compared to the AMBER99 force field, but further force field improvements are needed.
1. Introduction
Computational prediction of the sequence dependent structure, dynamics, and thermodynamics of RNA is important for extracting information from genome sequences. This is particularly important for RNA because it has many biological functions,(1) including catalysis,2,3 control of gene expression,4,5 roles in enzymatic activities,(6) and perhaps affecting protein folding.(7) Yet, the database of three-dimensional structures of RNA is limited in comparison to that of proteins. Experimental methods such as X-ray crystallography and NMR are unable to keep pace with the rapid discovery of important RNA sequences. Even when experimental data are available, computational methods employing force fields are used for refinement of structure. Due to computational expense, approximate methods are typically used for predicting structure. These methods include residue-centered force fields (coarse-grained(8)), atom-centered force fields (AMBER,(9) CHARMM,10,11 and GROMOS12−14), approximate quantum mechanics,15,16 and mixed quantum-mechanics/molecular mechanics (QM/MM).17−24 Molecular mechanics force fields are inexpensive enough that molecular dynamics (MD) simulations on the microsecond and beyond time scale25−29 are now possible, enabling the comparison of structural and thermodynamic properties of nucleic acids with experiment.30−35 For some systems such as RNA with tandem GA base pairs and unnatural ribonucleotides, and quadruplex DNA with single stranded loops, the current, widely used AMBER99 force field does not reproduce experimental results.30,36−38
It is not surprising that AMBER99 does not always reproduce experimental results for RNA. It was originally parametrized in 1995 on the basis of QM calculations on small model systems because computer power was limited.(9) Moreover, the biological importance of RNA was only beginning to be discovered so that model systems for QM computations focused on proteins and DNA. Faster computers now allow more extensive QM computations.15,39−42 Recently, the torsions for χ43−45 and for α/γ(46) have been reparameterized. Here, we test the effect of the χ reparameterization as substituted into the AMBER99 force field to give AMBER99χ.(44) Briefly, the parametrization for χ used QM calculations on each of the complete nucleosides, adenosine, cytidine, guanosine, and uridine. This was prompted by the observation that MD calculations for single stranded tetramers produced an unlikely fraction of syn conformers. Thus, for each nucleoside, 288 data points were fit to two dihedrals with four cosine terms.(44) Comparison between NMR spectra and MD simulations for cytidine and uridine revealed that AMBER99χ improved predictions of the fractions of nucleosides having C3′-endo sugar puckers and anti orientations of bases.(44) Recently, the effect of AMBER99χ and other χ revisions on structural predictions for UUCG and GNRA RNA hairpins were analyzed.(45) The χ revisions were crucial to maintain the structural characteristics of these hairpins.(45)
Experimental benchmarks can facilitate the improvement of force fields. For example, interpretation of NMR spectra of short single-stranded oligoribonucleotides can be complicated due to multiple conformations and dynamics, but can reveal structural propensities. In particular, the nuclear Overhauser effect (NOE) differs by roughly 20-fold between syn and anti conformations of a base relative to its ribose, the ribose pucker can be determined from 3J1′2′ coupling constants, and various NOEs report on base–base stacking.47−49 For example, single-stranded AACC RNA exhibits base–base stacking, especially for the middle nearest neighbor of A-C.(50) Similarly, single-stranded GAAAC has adenine–adenine stacking both as DNA and RNA.(51) NMR spectra of CAAU, CMAMAMUM, and CLAMALUM, where M and L stand for 2′O-methyl and locked nucleic acid (LNA) sugars (i.e., ribose with a methylene bridge between the 2′ oxygen and 4′ carbon), respectively, revealed helical preorganization, especially for oligonucleotides with LNA residues.(52) Short single strands provide a stringent test of RNA force fields for torsions because the conformational space is not limited by hydrogen bonding between bases and is minimally limited by steric exclusions. Moreover, structural transitions in single stranded RNA typically occur in ∼100 ns so that comparisons can be made to MD calculations on accessible time scales.53−56
In this paper, 1H nuclear Overhauser effect spectroscopy (NOESY), 1H double-quantum-filtered correlation spectroscopy (DQF-COSY), total correlation spectroscopy (TOCSY), and 1H–31P correlation spectroscopy (HETCOR) NMR spectra reveal that single-stranded GACC RNA (Figure 1) has a preference for A-form-like conformations as defined by C3′-endo sugar puckers, anti orientation of bases relative to sugars and base–base stacking. These results are compared to predictions from MD simulations with AMBER99(9) and AMBER99χ(44) force fields. The latter improves comparisons with the NMR results. Thus, AMBER99χ should improve modeling of the structures and dynamics of unpaired regions and the thermodynamics of folding an RNA from an unpaired single strand.
Figure 1.

(left) Single-stranded GACC RNA and atom notations used (right, top to bottom) in guanine, adenine, cytosine, and ribose and phosphate. For G/A, and C, χ dihedral angle is defined by O4′-C1′-N9-C4 and O4′-C1′-N1-C2, respectively.
2. Methods
2.1. NMR
GACC was purchased from Dharmacon Inc. The NMR sample had 3.2 mM GACC in 80 mM NaCl, 10 mM sodium phosphate, and 0.5 mM disodium EDTA at pH 7.0. Two deuterium exchanges were performed on the sample with 99.9% D2O (Cambridge Isotopes Laboratories). One final deuterium exchange was performed with 99.990% D2O (Sigma Aldrich).
All spectra were acquired on Varian Inova 500 or 600 MHz NMR spectrometers. The nonexchangeable protons of GACC were assigned from NOESY, 1H–31P HETCOR, DQF-COSY, and TOCSY at 2 and 20 °C (Table S1). NOESY spectra were recorded with mixing times (τm) of 200 and 800 ms. Relevant acquisition parameters are shown in Table S2.
2.2. Simulated Annealing Protocol for NMR Structure Modeling
3J1′2′ spin–spin coupling constants were used to deduce the sugar puckers for each residue (Table S3). Proton–proton distance restraints were calculated from magnitudes of NOEs in 200 ms mixing time NOESY spectra at 2 °C (Table S4) using the two-spin approximation.(57) Restraint limits were calculated by allowing for a ± 4-fold range in each NOE volume to account for relaxation effects, spin diffusion, and/or baseline distortions. The magnitudes of NOEs are proportional to 1/(rij)6, where rij is the distance between protons i and j. H1′ to H2′ NOEs were used as reference NOEs in the distance calculations with H1′ to H2′ distances taken as 2.75 and 3.00 Å, respectively, for C3′-endo and C2′-endo conformations (see Supporting Information for detail).
Cross-peaks in NOESY spectra reveal protons separated by <5 Å. The upper limit of some of the distance restraints was set to 10.0 Å in order to search a broader conformational space even though the magnitudes of these NOE peaks are medium in size indicating a distance <5 Å. Similarly, the lower and upper limits of some distance restraints were set to 4.5 and 99.0 Å, respectively, when no NOE was seen (Table S4).
Simulated annealing MD simulations with NMR restraints were done with sander(58) using the AMBER99 force field. The first MD simulation was initiated from a starting structure of GACC in A-form. Another 199 simulations were performed with the starting structure for each taken from the final structure of the previous simulation. Different random seed numbers were used in each simulation.
The generalized Born implicit solvent model59−61 with a 1 M salt concentration was used in the simulated annealing protocol. For each simulation, a total of 50 ps of MD were run with a 1 fs time step. A long-range cutoff of 20.0 Å was used for nonbonded interactions. Berendsen temperature control(62) with a coupling time of 1 ps was used in all simulated annealing MD simulations. Distance and sugar pucker restraints extracted from NOE data were applied using square bottom wells with parabolic sides with force constants of 50.0 kcal/mol Å2 and 50.0 kcal/mol rad2, respectively (Table S5). Chirality restraints with 50.0 kcal/mol rad2 were used to keep chiral atoms in the correct orientations so that the covalent bonds do not flip at high temperatures in the simulated annealing protocol (Table S5). No additional torsional restraints were used. Temperature was increased to 3000 K in 5 ps and gradually cooled to 0 K in 45 ps. During the first 5 ps, relative weights of the NMR restraints were set to 0.1 to make sure that the structure was independent of the starting conformation (see Supporting Information for structural parameters as a function of time during simulation). The NMR restraint weight was set to 1.0 during the rest of the simulation (Table S6).
2.3. Molecular Dynamics Simulations of GACC
A-form single-stranded GACC RNA was created with the nucgen module of AMBER9.(58) GACC was solvated with TIP3P water molecules(63) in a truncated octahedral box with 1076 water molecules. Three Na+ ions58,64 were used to neutralize the system.
The system was minimized in two steps: (1) With GACC held fixed with a restraint force of 500 kcal/mol Å2, steepest descent minimization of 500 steps was followed by a conjugate gradient minimization of 500 steps in order to minimize the potential energy due to water molecules. (2) With all restraints removed, steepest descent minimization of 1000 steps was followed by a conjugate gradient minimization of 1500 steps. The long-range cutoff for nonbonded interactions during the minimization was 10.0 Å.
After minimization, two steps of pressure equilibration were done with the sander module in AMBER9: (1) GACC was held fixed with a restraint force of 10 kcal/mol-Å2. Constant volume dynamics with an atom-based cutoff of 10.0 Å was used for the direct space sum. SHAKE(65) was turned on for bonds involving hydrogen atoms. Temperature was raised from 0 to 300 K in 20 ps. Langevin dynamics with a collision frequency of 1 ps–1 was used. A total of 20 ps of MD were run with a 2 fs time step. (2) The above conditions were chosen, except that constant pressure dynamics with isotropic position scaling was turned on. Reference pressure was 1 atm with a pressure relaxation time of 2 ps. A total of 100 ps of MD were run with a 2 fs time step. Particle mesh Ewald (PME)66,67 was used for all calculations.
Each production run was similar to the second step of the pressure equilibration described above. Constant pressure dynamics was performed with a long-range cutoff of 10.0 Å. SHAKE was turned on for bonds involving hydrogen atoms. A total of 50 ns of MD was run at 300 K with a 1 fs time step. In production runs, simulations were carried out with the PMEMD module in AMBER9.(58) Trajectory files were written at each 500 fs time step. The first 1 ns of each MD simulation was omitted from calculations.
Simulations were done on systems using AMBER99(9) and AMBER99χ(44) force fields. For each system and force field, 15 separate 50 ns simulations were run. Different random seed numbers were used for each simulation.
In order to examine the time evolution of GACC with the AMBER99χ force field, a single simulation of 1.9 μs was also run at 300 K. This simulation took over six months on a Dell Precision T5400 workstation using the eight 2.33 MHz Intel Xeon dual quad cores, and was stopped after no new stable structures appeared during the last 800 ns. Root-mean-square deviations of whole structure and backbone from A-form GACC single strand as well as χ and δ dihedral angles of each residue were analyzed. Measured rate constants for stacking and unstacking of nucleotides in AC, CA, CC, A7, poly A, and poly C range from 5 × 10⁶ to 2 × 10⁷ s–1,53−56 indicating that structural transitions occur in roughly 100 ns. Thus, a single 1.9 μs simulation should allow several transitions.
3. Results
3.1. NMR
3J1′2′ spin–spin coupling constants from 1D 1H NMR spectra of GACC revealed that from 2 to 55 °C all the residues prefer C3′-endo sugar pucker, especially the middle nucleotides, A2 and C3 (Tables 1 and S3 and Figure S1). Figure 2 shows the NOESY walk for GACC in an 800 ms mixing time NOESY spectrum. In the 200 ms NOESY spectrum, the NOEs of G1H1′-H8, A2H1′-H8, C3H1′-H6, and C4H1′-H6 are all weak, implying anti base orientation for the residues (Table 1 and Figure S2). NOEs of G1H2′/H3′-A2H8, A2H2′/H3′-C3H6, and C3H2′/H3′-C4H6 are consistent with base stacking in A-form structures (Figure 3). Weak C3H6-C4H2′ and C3H3′-C4H2′ cross-peaks are seen in 200 and 800 ms NOESY spectra (Figures 3 and S3), however, which suggests a population of conformations with a flipped, upside down C4 sugar. Such reversal of ribose has been observed previously68−71 but is rare. Thus, no C3H6-C4H2′ and C3H3′-C4H2′ distance restraints were used in the simulated annealing protocol. The chemical shifts of all phosphorus resonances were within 0.2 ppm indicating no unusual backbone conformations (Table S1).
Table 1. Percentages of Sugar Pucker in C3′-endo Conformation, Base Orientation in Anti Conformation, and Conformations Satisfying H–H NOE Distance Restraints Measured and Predicted by NMR, AMBER99, and AMBER99χ Force Fields, Respectivelya.
| Sugar Pucker (% C3′-endo) | |||
|---|---|---|---|
| AMBER99 | AMBER99χ | NMRb | |
| G1 | 49 ± 23 | 98 ± 7 (90/100/52/76) | 60–70 |
| A2 | 33 ± 22 | 97 ± 7 (85/94/69/81) | 80–90 |
| C3 | 64 ± 16 | 95 ± 11 (92/100/67/83) | 80–90 |
| C4 | 41 ± 9 | 82 ± 16 (74/58/65/67) | 70–80 |
| Base Orientation (% Anti) | |||
|---|---|---|---|
| AMBER99c | AMBER99χd | NMRe | |
| G1 | 37 ± 24 | 93 ± 15 (70/100/15/53) | anti |
| A2 | 97 ± 6 | 96 ± 14 (73/98/23/57) | anti |
| C3 | 90 ± 25 | 99 ± 1 (98/100/86/93) | anti |
| C4 | 92 ± 12 | 95 ± 11 (93/99/84/90) | anti |
| Percentage of Structures Consistent with NMR Distance Restraints | |||
|---|---|---|---|
| NOE cross-peakf | AMBER99g (%) | AMBER99χg (%) | NOE distance restraintse (Å) |
| G1H2′-A2H8 | 19 ± 12 | 91 ± 17 (72/0/10/31) | 2.23–3.55 |
| A2H2′-C3H6 | 24 ± 11 | 89 ± 13 (69/87/24/54) | 2.04–3.25 |
| A2H3′-C3H6 | 49 ± 27 | 88 ± 12 (68/100/32/60) | 2.16–3.45 |
| A2H2–C3H1′ | 9 ± 9 | 91 ± 11 (78/95/35/63) | 3.10–4.94 |
| C3H2′-C4H6 | 41 ± 15 | 79 ± 23 (68/0/23/35) | 2.23–3.55 |
| C3H3′-C4H6 | 65 ± 15 | 91 ± 17 (85/72/61/72) | 2.23–5.00 |
Values for AMBER99 and AMBER99χ not in parentheses are on the basis of fifteen individual 50 ns simulations with errors corresponding to sample standard deviations. Values in parentheses for AMBER99χ are from a single 1.9 μs simulation. The percentages are listed for different time domains in the simulation in the following order: 1–700 ns/701–1100 ns/1101–1900 ns/1–1900 ns. Fractions of sugar pucker in C3′endo conformation are calculated from plots such as Figure S5. For NMR values, Table S3 was used. The same thing is done for % anti using plots such as Figure S6. χ angles of 200°, 300°, and 60° correspond to anti, high-anti, and syn conformations, respectively. Intranucleoside H1′ to H8/H6 distances for anti and syn conformations are typically ∼3.5 Ǻ and 2.1 Ǻ, respectively, so that the NOE volumes for anti and syn differ by ∼20-fold. Values labeled ± are standard deviations, but are not due to random error. Because GACC is dynamic, a perfect force field would still give different percentages for different 50 ns simulations. No standard deviations are given for the 1.9 μs simulation because it shows different structural behavior in the 1–700 ns, 701–1100 ns, and 1101–1900 ns time domains. Only the 1–700 ns domain is consistent with NMR spectra.
These results are at 25 °C (see Table S3).
These values include both anti and high-anti conformations (see Figure S6).
Most of the syn conformations occur after 1.1 μs when GACC is not in a stable conformation (Figure 4). Prior to 1.1 μs, G1 and A2 are 80% anti, with the remainder syn and high-anti.
These results are extracted from 200 ms NOEs at 2 °C.
The distances between these proton pairs are characteristic of RNA structure.
The percentage of structures consistent with NMR spectra was calculated by integrating the number of structures with distances between 1.50 Å and the upper limit of the NOE distance restraint and dividing by the total number of structures generated. This reflects the fact that NMR NOEs depend on (1/rij)6 as weighted by the fraction of population with distance, rij.
Figure 2.

NOESY walk of GACC from 800 ms mixing time NOESY experiment (2 °C).
Figure 3.

200 ms 2D NOESY of GACC at 2 °C showing cross-peaks of the sugar and H6/H8 protons. Note that intense peaks are seen between the inter-residue protons, G1H2′/H3′-A2H8, A2H2′/H3′-C3H6, and C3H2′/H3′-C4H6, implying base–base stacking. Cross-peak of C3H6-C4H2′ is due to minor conformation (see also Figure S3).
3.2. Dynamics of A-Form GACC in MD Simulations with the AMBER99 and AMBER99χ Force Fields
For each of the 50 ns unrestrained MD simulations, snapshots were extracted from the trajectories at intervals of 5 ns and analyzed in order to cluster them into structural groups. No preferred conformation was found for the fifteen 50 ns AMBER99 MD simulations, and G1 of GACC went to a syn base orientation within 0.5 ns on average. Coupled with the force field’s preference for C2′-endo sugar pucker,(44) this creates distortions in the backbone and the other residues. As a result, random-coil conformations are observed within less than 10 ns with the AMBER99 force field.
While simulations with AMBER99 generated rapid and large structural fluctuations of GACC within 50 ns, simulations with AMBER99χ did not. For the fifteen 50 ns AMBER99χ MD simulations, 107 and 11 out of 150 structures cluster into A-form-like major and minor conformations, respectively. To further explore the time dependence of dynamics with AMBER99χ, a single 1.9 μs MD simulation was run. Time evolutions of rms deviations of all atoms and backbone heavy atoms with respect to a pure A-form GACC conformation and of the χ and δ torsion angles of each residue are shown in Figure 4. This decomposition provides insight into the individual conformational transformations of the structural dynamics of GACC. Cluster analysis was done on this single 1.9 μs MD simulation and revealed that 63 and 18 out of 380 structures represent major and minor conformations, respectively, while 77 structures represent a stable non-A-form conformation (see Figures 4 and S4), which is not consistent with NMR spectra. The latter structure appears after 700 ns. In the first 700 ns, 68% of the structures are A-form-like (Figure 4). The rest of the structures in the 1.9 μs MD simulation do not cluster to any conformation and are in non-A-form conformations. The results show that for 700 ns AMBER99χ generates structures consistent with NMR but that additional revisions are necessary. In particular, GACC did not return to an A-form-like structure during the 800 ns between 1.1 and 1.9 μs when the predicted structures were random coil.
Figure 4.

Time evolution (in ns) of GACC single-strand with AMBER99χ force field. The starting structure is A-form GACC. Top two plots show rms deviations (in Å) of whole structure and backbone from A-form GACC. Remaining plots are for χ and δ dihedral angles of each residue. χ dihedral angles around 180°, 300°, and 90° represent anti, high-anti, and syn base orientations, respectively. δ dihedral angles around 90° and 120° represent sugar puckering of C3′-endo and C2′-endo, respectively. Red and green colors in top plot show sampling of major and minor conformations, respectively, while blue color shows sampling of a non-A-form conformation (see Figure S4). See text for detail.
3.3. Predictions of Sugar Pucker and Base Orientation of Individual Residues of GACC
Structures extracted every 0.5 ps from the unrestrained MD trajectories were analyzed to quantify the sugar pucker and base orientation of GACC residues predicted by each force field. Population distribution plots of pseudorotation phase angles and χ torsions for each residue were created (Figures S5 and S6) to obtain the percentages of C3′-endo sugar pucker and anti type base orientation (Table 1). The sugar pucker of a five-membered ring can be described by the pseudorotation phase angle.72,73 In RNA and DNA, pseudorotation phase angles of 18° and 162° that correspond to C3′-endo and C2′-endo sugar pucker, respectively, are mainly found.
These percentages can be quantitatively compared to NMR results (Table 1). At 25 °C, NMR indicates around 65%, 85%, 85%, and 75% C3′-endo sugar pucker for G1, A2, C3, and C4, respectively. For a series of fifteen 50 ns simulations that start in A-form, the AMBER99 force field predicts 49%, 33%, 64%, and 41% C3′-endo sugar pucker for G1, A2, C3, and C4, respectively (Table 1 and Figure S5). Evidently, AMBER99 underestimates the favorability of the C3′-endo sugar pucker for GACC. The 1.9 μs AMBER99χ simulation predicts 76%, 81%, 83%, and 67% C3′-endo sugar pucker for G1, A2, C3, and C4, respectively, which agrees reasonably well with the NMR data (Table 1).
The predicted percentages of C3′-endo sugar pucker, however, depend on the time domain within the 1.9 μs simulation (Table 1). For example, they are 90%, 85%, 92%, and 74% for G1, A2, C3, and C4, respectively, in the first 700 ns, where GACC samples A-form-like and random coil conformations (Figure 4). In contrast, they are 52%, 69%, 67%, and 65% in the 1101–1900 ns region where MD predicts random coil.
Quantitative comparisons can also be made between predicted and NMR determined orientation of bases relative to sugars. NMR reveals anti conformations for all the residues of GACC. For a series of fifteen 50 ns simulations that start in A-form, the AMBER99 force field predicts GACC to have 37%, 97%, 90%, and 92% anti/high-anti conformations for G1, A2, C3, and C4, respectively. The anti range of the χ torsions observed in AMBER99 simulations was 180–360° and 180–300° for G1/A2 and C3/C4, respectively (see Figure S6). The broad range for AMBER99 is due to generation of both anti and high-anti conformations. The 1.9 μs AMBER99χ simulation predicts 53%, 57%, 93%, and 90%, anti conformations for G1, A2, C3, and C4, respectively, with only 2–6% of high-anti conformations for these residues. Most of the syn conformations, however, occur after 1.1 μs when GACC is not in a stable structure (Table 1 and Figure 4). Prior to 1.1 μs, G1 and A2 are 80% anti on average, with the rest either syn or high-anti.
3.4. Predictions of Structures Satisfying H–H NOE Distance Restraints
For each force field, the structures used in Part 3.3 were also used to calculate the percentages of structures consistent with the NMR distance restraints for some of the H–H NOEs (Table 1). These predictions were extracted from the population distribution plots shown in Figures S7–S9 and provide another measure of prediction accuracy.
In 50 ns simulations starting with A-form and using the AMBER99 force field, the percentages of structures consistent with NMR distance restraints for G1H2′-A2H8, A2H2′-C3H6, A2H3′-C3H6, A2H2-C3H1′, C3H2′-C4H6, and C3H3′-C4H6 are 19%, 24%, 49%, 9%, 41%, and 65%, respectively. With the 1.9 μs AMBER99χ simulation, the fractions are 31%, 54%, 60%, 63%, 35%, and 72%, respectively (Table 1). The NOE cross-peak A2H2-C3H1′ represents stacking of the middle bases A2 and C3, and this cross-peak is underestimated much more by AMBER99 than by the AMBER99χ force field, even when the AMBER99χ simulation is run to 1.9 μs. As expected, the percentages of structures in the 1.9 μs simulation that are consistent with NMR distance restraints depend on the time domain (Table 1). For example, between 701 and 1100 ns, the G1H2′-A2H8 and C3H2′-C4H6 distances never fall in the range consistent with NMR data. As discussed below, the stable structure generated between 701 and 1100 ns is inconsistent with NMR spectra.
3.5. NOE “Distances” Measured by NMR and Predicted by AMBER99/AMBER99χ Force Fields
Comparison of NMR measured and MD predicted NOE “distances” (R) is a more direct test of the force fields. These “distances” are not true distances if GACC populates more than one conformation. The structures used in Part 3.3 were used to calculate the NOEs (1/rij6) for each snapshot, which then yielded average NOE and, therefore, average “distance”, R. That is, the “distance” is an ensemble average with each exact distance weighted by its inverse sixth power. For the combined fifteen 50 ns MD simulations, rms deviations of six NOE “distances” between NMR and, respectively, AMBER99 and AMBER99χ are 0.84 and 0.39 Å. For the single 1.9 μs MD simulation of AMBER99χ, this rms deviation is 0.24 Å (Tables 2 and S7). Thus, AMBER99χ performs better with this benchmark.
Table 2. Experimentally Measured and Computationally Predicted NOE Distances (R) for Some Cross-Peaksa.
| EXP | 1.9 μs | 15 × 50 ns |
||
|---|---|---|---|---|
| Rexp (Å) | RA99χ (Å) | RA99χ (Å) | RA99 (Å) | |
| G1H2′-A2H8 | 2.8 | 2.8 (2.4/5.6/3.8) | 2.3 | 3.6 |
| A2H2′-C3H6 | 2.6 | 2.7 (2.5/2.6/3.1) | 2.4 | 3.3 |
| A2H3′-C3H6 | 2.7 | 2.6 (2.6/2.3/3.0) | 2.5 | 2.7 |
| A2H2–C3H1′ | 3.9 | 3.4 (3.3/3.2/3.7) | 3.2 | 5.6 |
| C3H2′-C4H6 | 2.8 | 3.1 (2.7/4.9/3.3) | 2.7 | 3.2 |
| C3H3′-C4H6 | 2.8 | 2.8 (2.5/4.4/3.0) | 2.5 | 3.0 |
| rmsdb | 0.24 | 0.39 | 0.84 | |
R is the “distance” calculated from measured or predicted NOE (1/R6). If more than one conformation is present, then R does not represent any physical distance. The exp, A99χ and A99 subscripts stand for experiment, AMBER99χ, and AMBER99. Predictions are from single 1.9 μs MD simulation of AMBER99χ and for combined fifteen 50 ns MD of both force fields (15 × 50 ns) using structures extracted every 0.5 ps (see Table S7 for detail). “Distances” in parentheses are for the following time domains of the 1.9 μs simulation: 1–700 ns/701–1100 ns/1101–1900 ns.
rms deviation from experimental results. “Distances”, R, for AMBER99χ simulations of 50 ns starting from A-form are consistently shorter than experimental “distances” from NMR, presumably because GACC is not entirely A-form in solution, but remains A-form in 50 ns simulations (see comparisons of NOEs in Table S11). The shorter “distances”, however, fall within the range consistent with NOE distance restraints (Table 1). The 1.9 μs simulation allows more time for sampling structures, so that the systematic effect of short simulation time is reduced (see Figure S16). This results in a lower rmsd relative to the experimental “distances”.
Again as expected, the distance comparison for the 1.9 μs simulation depends on the time domain (Table 2). The distances predicted from the first 700 ns agree better with the NMR than those predicted from the 701 to 1100 ns and 1101 to 1900 ns domains.
3.6. Conformational Fluctuations in the Single 1.9 μs MD Simulation with AMBER99χ Force Field
Figure 4 shows the time evolution for the 1.9 μs MD simulation. In Figure 4, regions highlighted with red and green represent sampling of major and minor A-form-like conformations, respectively, whereas regions highlighted with blue represent a stable non-A-form conformation (Figure S4 and Table S8). The rest of the regions highlighted with black represent sampling of random-coil non-A-form conformations.
During the first 700 ns MD, there are multiple major to minor and A-form-like to non-A-form conformational transitions (Figure 4). The switch from major to minor conformation is due to the conformational change of the backbone (Figure 4). During these periods, χ dihedrals of G1, A2, C3, and C4 are mostly around 180°, which is the anti region. G1 goes to the syn conformation a few times during these periods, but returns to anti conformation almost instantly (Figure 4). Between 200 and 375 ns, 550–600 ns, and around 520 ns, however, the structure resembles neither major nor minor conformations. At the beginning of these times, base orientation of G1 goes to either high-anti or syn, which distorts the backbone. This allows A2 to change its base orientation to either high-anti or syn (Figure 4). During these times, C3 and C4 mostly stay in anti base orientation, but G1, A2, and C3 start sampling C2′-endo sugar puckering (Figure 4). During the whole simulation time, C4 rapidly fluctuates between C3′-endo and C2′-endo sugar puckers (Figure 4).
Between 701 and 1100 ns, a stable and unique non-A-form conformation is sampled by AMBER99χ (Figures 4 and S4). At around 700 ns, the base orientation and sugar puckering of all four residues are anti and C3′-endo, respectively, but the backbone changes dramatically and creates a conformation with G1 between C3 and C4 (Figure S4). This stable conformation has unique potential NOE cross-peaks such as G1H8-C3/C4H2′/H3′, G1H8-C3/C4H5/H6, and C3H6-G1H2′/H3′ due to proton–proton distances <5 Ǻ. These potential cross-peaks would be easy to detect because they would appear in unique and uncrowded NOESY regions but no such cross-peaks have been detected.
After 1100 ns, the structure transforms to random coil conformations. Again, first G1 goes to a syn base orientation that gives enough flexibility to the backbone to search other possible configurations. This allows A2 to go to a syn base orientation. C3 and C4 rarely change their base orientations but sample syn a couple of times (Figure 4). Similar to the random-coil conformations seen within 700 ns, fluctuations of the δ torsions are high after 1100 ns where all the residues start to sample C2′-endo sugar puckering significantly (Figure 4).
The terminal G1 and C4 nucleotides are flexible enough to change their conformations from anti to syn and/or C3′-endo to C2′-endo. These changes are seen in Figure 4, but are not the main reason that the structure samples random-coil conformations; this broader sampling is due primarily to conformational changes of A2. C3 and C4, however, are found primarily in anti conformations as expected for cytidine,(44) even when the structure is in a random-coil conformation. One aspect of Figure 4 is that in order for the single-stranded GACC to have a stable conformation, it has to have all the bases in anti orientations (Figure 4). Otherwise, high fluctuations on the χ and δ torsions yield random-coil conformations.
3.7. Simulated Annealing of GACC using NMR Restraints
GACC presumably has an ensemble of structures in rapid exchange that contribute to the NMR spectrum. Simulated annealing with NMR restraints was used to see if any particular structures are consistent with the NMR data. The protocol described in the Methods section generated 182 out of 200 structures with constraint energies less than 0.1 kcal/mol. Of these structures, two had energies greater than the mean plus the standard deviation. As a result, 180 out of 200 structures were analyzed. Cluster analyses showed that 116 and 32 represent A-form-like major and first minor conformations, respectively (Figures 5 and S4 and Tables S9 and S10). Another 18 structures represent a second A-form-like minor conformation with an average energy less favorable than both the major and first minor conformations (Figure S4). Both minor conformations have a flipped, upside down C4 sugar, but with different backbone orientations (Figure S4). The flipped C4 sugar conformation is consistent with weak C3H6–C4H2′ and C3H3′-C4H2′ NOEs that were observed, but not used as restraints. The major and first minor conformations have stacking between G1/A2, A2/C3, and C3/C4, while the C3/C4 stacking is missing in the second minor conformation. With the exception of the flipped C4, the structures generated by simulated annealing are largely A-form-like.
Figure 5.

Overlap of the NMR modeled (black) and AMBER99χ force field predicted (red) conformations of major (left) and minor (right) species. Predicted structures are average from fifteen 50 ns unrestrained simulations starting from A-form. Heavy atom rmsd of major and minor conformations with respect to NMR modeled structures are 0.6 and 0.9 Å, respectively (see text and Figure S4 for detail). Values of dihedral angles for structures are given in the Supporting Information. Major and minor conformations generated during 1.9 μs simulation are similar to these (see Figure S4).
4. Discussion
In molecular mechanics simulations of RNA, the torsional potential for the χ torsion angle has a significant effect on the preferred orientations of the bases. For the AMBER force field, this potential was originally parametrized in 1995.(9) Advances in computers since 1995 allow more thorough QM computations to parametrize the χ torsions for RNA.43−45 Initial comparisons were made between AMBER99 and AMBER99χ simulations and NMR spectra for cytidine and uridine, but comparisons for adenosine and guanosine were prevented due to aggregation at NMR concentrations.(44) NMR results for GACC provide a test for parameters for G and A, and for inclusion of parameters in simulations of an unpaired oligonucleotide with a ribose-phosphate backbone. AMBER99χ and other revised χ parameters have also been tested against structures for UUCG and GNRA hairpins where the nucleotides are more constrained.(45) Accurate simulations of unpaired regions of RNA are important for predicting structures of loops and thermodynamics of folding.
AMBER99χ Torsion Parameters Improve Agreement between NMR and Simulations
The NMR results for GACC can be qualitatively compared to predictions of the AMBER99 and AMBER99χ force fields. In the AMBER99 force field unrestrained simulations, there are large fluctuations within 50 ns in rms deviations of individual residues from anti/C3′-endo conformation and in backbone from A-form (Table 1). Evidently, anti/C3′-endo conformations and A-form are not preferred by the AMBER99 force field and transition barriers allow rapid conformational changes (see Figures S10 and S11). In contrast, all residues of GACC in the fifteen 50 ns AMBER99χ force field simulations show stable conformations similar to anti/C3′-endo. Because few transitions are seen within 50 ns with AMBER99χ, the 1.9 μs simulation provides a better comparison. In that simulation, a stable backbone similar to A-form is retained for almost 68% of the first 700 ns (Figure 4). After 700 ns, various random-coil and a non-A-form stable structure inconsistent with NMR spectra are seen.
The non-A-form conformation is likely an artifact of the force field, and suggests that reparameterization beyond χ is necessary. The high-dimensional character of the conformational space, however, does not allow definitive identification of the torsions causing this non-A-form conformation to be stable enough to be sampled significantly by AMBER99χ. Histogram analyses of RNA backbones in crystal structures show preferred regions for α, β, γ, δ, ε, and ζ,68,69 and most dihedrals in the 1.9 μs MD occur in these regions (Figure S12). All the residues of the stable non-A-form conformation have ζ between 7° and 71° (Table S8), whereas an A-form RNA has ζ around −70° and in crystal structures, ζ is rarely between −40° and +40°.(68) It is possible that a revision of the ζ torsion for RNA might improve predictions. Alternatively, the stable non-A-form and the random-coil conformations may actually exist in solution, but are not prevalent enough to influence the NMR spectra. Testing this hypothesis, however, would require running much longer MD simulations to allow more switches in conformation.
Quantitative comparisons show that the sugar pucker, base orientation, and proton–proton NOE distances derived from NMR results are predicted better by AMBER99χ than AMBER99 (Tables 1 and 2). Even weak C3H6- C4H2′ and C3H3′- C4H2′ NOEs are consistent with the flipped C4 generated by unrestrained AMBER99χ simulations.
In order to test the effects of reparameterizing only χ, the parmbsc0 force field,(46) which has revised parameters for α and γ, was not used in MD simulations. Preliminary results on a different benchmark, however, indicate that combining parmbsc0 with AMBER99χ further improves agreement with experiment (I.Y., H.A.S., D.H.T., unpublished). A different reparameterization of χ produced the Ode force field.(43) Although the Ode force field has more parameters than AMBER99χ, it predicts similar potential energy surfaces for nucleosides.(44) Thus, it should provide predictions similar to those of AMBER99χ, although tests on UUCG and GNRA tetraloop hairpins indicate that the Ode force field overpredicts high-anti conformations while AMBER99χ does not.(45) Additional tests are required to see if this difference is general.
AMBER99χ Torsion Parameters Improve Agreement between Predicted and Expected Dynamics
The structural fluctuations observed with AMBER99 occur in less than 10 ns, which is much faster than the ∼100 ns expected on the basis of experimental measurements on single-stranded oligo and polynucleotides.53−56 In contrast, AMBER99χ generated structures consistent with NMR spectra are typically stable for 50–100 ns (Figure 4). Evidently, AMBER99χ reasonably approximates barriers to conformational change.
Major and Minor Conformations Generated in the Initial 700 ns of Unrestrained AMBER99χ MD Are Similar to Structures Generated by Simulated Annealing with AMBER99 Restrained with NMR Data
Because the dynamics of unpaired oligonucleotides occur in less than 1 μs, NMR reports a population weighted average of spectral properties for the ensemble of structures. Somewhat surprisingly, the NMR spectra for GACC are consistent with expectations for a high population of A-form-like conformations. Simulated annealing with AMBER99 and NMR restraints generates two A-form-like structures with the minor structure having an upside down terminal ribose that is consistent with minor NOESY peaks. This suggests that the ensemble has largely A-form conformations, rather than a high population of random conformations. The first 700 ns of AMBER99χ unrestrained MD is largely consistent with this interpretation (Figure 4). After 700 ns, however, a structure inconsistent with NMR spectra is generated, suggesting that further refinement of the force field will be important. Experimental NMR restraints, however, appear able to compensate for limitations of the current AMBER force field.
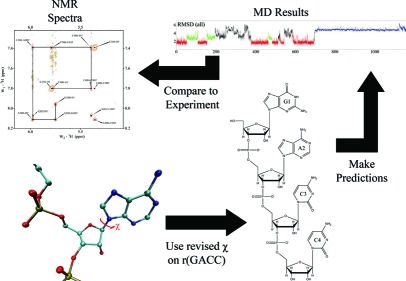
Summary
In order to sample physical regions of conformational space in MD simulations, the force field must accurately describe the interactions that give rise to conformational preferences. Such sampling is important for predicting the structure and dynamics of RNA and the thermodynamics of folding an RNA from an unpaired single strand. Modification of χ parameters in the AMBER99 force field improved agreement between simulations and NMR spectra of single-stranded GACC RNA, as summarized in Figure 6. The modified χ torsion parameters are therefore expected to improve sampling of non-Watson–Crick regions and terminal base pairs in RNA simulations. In Watson–Crick regions of an RNA duplex, the χ torsions are restricted by cross-strand hydrogen bonding, so the AMBER99χ torsion parameters should have less effect. A stable non-A-form and random-coil conformations are observed significantly during the 1.9 μs MD simulation, suggesting refinement of other parameters will be important. In principle, such refinement can rely on QM calculations and the parmbsc0 revisions(46) will likely help. Many subtle interactions, however, define RNA.(42) Thus, some combination of knowledge based force fields(74) with QM may prove useful. Finally, NMR spectra for single-stranded regions of RNA provide useful benchmarks for testing any revisions.
Figure 6.

Summary of comparisons between NMR and explicit solvent MD for GACC.
Acknowledgments
We are grateful to the Center for Research Computing at the University of Rochester for providing the necessary computing systems (BlueHive cluster) and personnel to enable the research presented in this manuscript. We thank AMBER community and mailing list for all their help and support. This work was supported by NIH Grant GM22939 (D.H.T.).
Glossary
Abbreviations
- C
cytidine
- U
uridine
- A
adenosine
- G
guanosine
- QM
quantum mechanical
- MM
molecular mechanics
- MD
molecular dynamics
Supporting Information Available
Chemical shifts of nonexchangeable protons of GACC at 2 and 20 °C; acquisition parameters used in NMR experiments; measured and predicted R and NOE for some cross-peaks; 3J1′2′ spin–spin coupling constants and experimentally deduced sugar pucker of each GACC residue at different temperatures; NMR distance/sugar pucker restraints, and restraint file used in simulated annealing protocol and analysis of first five simulated annealing cycles; sample sander input file for simulated annealing protocol; dihedral angles of major/minor (modeled by NMR), and stable non-A-form (seen in 1.9 μs long MD) conformations; major and minor conformations of GACC modeled by NMR and predicted by AMBER99χ force field; 2D DQF-COSY, 1H–31P HETCOR, and 200/800 ms NOESY spectra of GACC; rms deviation for each GACC residue and backbone; distributions of sugar pucker and base orientation of each GACC residue and the H–H NOE distances shown in Table 1; distributions of H2′/H3′-H6/H8 NOE distances for each GACC residue; histogram analysis of the torsions using the 1.9 μs MD; decomposition of 1.9 μs MD into three regions; convergence analysis of Table 2. This material is available free of charge via the Internet at http://pubs.acs.org.
Funding Statement
National Institutes of Health, United States
Supplementary Material
References
- Atkins J. F.; Gesteland R. F.; Cech T. R.. RNA Worlds: From Life’s Origins to Diversity in Gene Regulation; Cold Spring Harbor Laboratory Press: Cold Spring Harbor, NY, 2010. [Google Scholar]
- Guerrier-Takada C.; Gardiner K.; Marsh T.; Pace N.; Altman S. Cell 1983, 35, 849. [DOI] [PubMed] [Google Scholar]
- Kruger K.; Grabowski P. J.; Zaug A. J.; Sands J.; Gottschling D. E.; Cech T. R. Cell 1982, 31, 147. [DOI] [PubMed] [Google Scholar]
- Lee R. C.; Feinbaum R. L.; Ambros V. Cell 1993, 75, 843. [DOI] [PubMed] [Google Scholar]
- Ruvkun G. Science 2001, 294, 797. [DOI] [PubMed] [Google Scholar]
- Wang G. H.; Zoulim F.; Leber E. H.; Kitson J.; Seeger C. J. Virol. 1994, 68, 8437. [DOI] [PMC free article] [PubMed] [Google Scholar]
- Watts J. M.; Dang K. K.; Gorelick R. J.; Leonard C. W.; Bess J. W.; Swanstrom R.; Burch C. L.; Weeks K. M. Nature 2009, 460, 711. [DOI] [PMC free article] [PubMed] [Google Scholar]
- Malhotra A.; Harvey S. C. J. Mol. Biol. 1994, 240, 308. [DOI] [PubMed] [Google Scholar]
- Cornell W. D.; Cieplak P.; Bayly C. I.; Gould I. R.; Merz K. M.; Ferguson D. M.; Spellmeyer D. C.; Fox T.; Caldwell J. W.; Kollman P. A. J. Am. Chem. Soc. 1995, 117, 5179. [Google Scholar]
- Brooks B. R.; Bruccoleri R. E.; Olafson B. D.; States D. J.; Swaminathan S.; Karplus M. J. Comput. Chem. 1983, 4, 187. [Google Scholar]
- MacKerell J. A. D.; Brooks B.; Brooks C. L. III; Nilsson L.; Roux B.; Won Y.; Karplus M.. CHARMM: The Energy Function and Its Parametrization with an Overview of the Program. In The Encyclopedia of Computational Chemistry; Schleyer P. v. R., Allinger N. L., Clark T., Gasteiger J., Kollman P. A., Schaefer I. H. F., Schreiner P. R., Eds.; John Wiley & Sons: Chichester, U.K., 1998; Vol. 1, p 271. [Google Scholar]
- Scott W. R. P.; Hunenberger P. H.; Tironi I. G.; Mark A. E.; Billeter S. R.; Fennen J.; Torda A. E.; Huber T.; Kruger P.; van Gunsteren W. F. J. Phys. Chem. A 1999, 103, 3596. [Google Scholar]
- Berendsen H. J. C.; van Gunsteren W. F., GROMOS Reference Manual; University of Groningen: Groningen, Germany, 1987. [Google Scholar]
- van Gunsteren W. F.; Billeter S. R.; Eising A. A.; Hünenberger P. H.; Krüger P.; Mark A. E.; Scott W. R. P.; Tironi I. G.. Biomolecular Simulation: The GROMOS96 Manual and User Guide. Verlag der Fachvereine: Zürich, 1996. [Google Scholar]
- Hobza P.; Sponer J. J. Am. Chem. Soc. 2002, 124, 11802. [DOI] [PubMed] [Google Scholar]
- Kratochvil M.; Sponer J.; Hobza P. J. Am. Chem. Soc. 2000, 122, 3495. [Google Scholar]
- Bash P. A.; Field M. J.; Karplus M. J. Am. Chem. Soc. 1987, 109, 8092. [Google Scholar]
- Eichinger M.; Tavan P.; Hutter J.; Parrinello M. J. Chem. Phys. 1999, 110, 10452. [Google Scholar]
- Freindorf M.; Gao J. L. J. Comput. Chem. 1996, 17, 386. [Google Scholar]
- Gao J. L.; Xia X. F. Science 1992, 258, 631. [DOI] [PubMed] [Google Scholar]
- Murphy R. B.; Philipp D. M.; Friesner R. A. J. Comput. Chem. 2000, 21, 1442. [Google Scholar]
- Stanton R. V.; Hartsough D. S.; Merz K. M. J. Phys. Chem. 1993, 97, 11868. [Google Scholar]
- Tunon I.; MartinsCosta M. T. C.; Millot C.; Ruiz Lopez M. F.; Rivail J. L. J. Comput. Chem. 1996, 17, 19. [Google Scholar]
- Warshel A.; Levitt M. J. Mol. Biol. 1976, 103, 227. [DOI] [PubMed] [Google Scholar]
- Duan Y.; Kollman P. A. Science 1998, 282, 740. [DOI] [PubMed] [Google Scholar]
- Zagrovic B.; Pande V. J. Comput. Chem. 2003, 24, 1432. [DOI] [PubMed] [Google Scholar]
- Klepeis J. L.; Lindorff-Larsen K.; Dror R. O.; Shaw D. E. Curr. Opin. Struct. Biol. 2009, 19, 120. [DOI] [PubMed] [Google Scholar]
- Maragakis P.; Lindorff-Larsen K.; Eastwood M. P.; Dror R. O.; Klepeis J. L.; Arkin I. T.; Jensen M. O.; Xu H. F.; Trbovic N.; Friesner R. A.; Palmer A. G.; Shaw D. E. J. Phys. Chem. B 2008, 112, 6155. [DOI] [PMC free article] [PubMed] [Google Scholar]
- Shaw D. E.; Deneroff M. M.; Dror R. O.; Kuskin J. S.; Larson R. H.; Salmon J. K.; Young C.; Batson B.; Bowers K. J.; Chao J. C.; Eastwood M. P.; Gagliardo J.; Grossman J. P.; Ho C. R.; Ierardi D. J.; Kolossvary I.; Klepeis J. L.; Layman T.; McLeavey C.; Moraes M. A.; Mueller R.; Priest E. C.; Shan Y. B.; Spengler J.; Theobald M.; Towles B.; Wang S. C. Commun. ACM 2008, 51, 91. [Google Scholar]
- Vokacova Z.; Budesinsky M.; Rosenberg I.; Schneider B.; Sponer J.; Sychrovsky V. J. Phys. Chem. B. 2009, 113, 1182. [DOI] [PubMed] [Google Scholar]
- Giudice E.; Lavery R. Acc. Chem. Res. 2002, 35, 350. [DOI] [PubMed] [Google Scholar]
- Orozco M.; Perez A.; Noy A.; Luque F. J. Chem. Soc. Rev. 2003, 32, 350. [DOI] [PubMed] [Google Scholar]
- Perez A.; Blas J. R.; Rueda M.; Lopez-Bes J. M.; de la Cruz X.; Orozco M. J. Chem. Theory Comput. 2005, 1, 790. [DOI] [PubMed] [Google Scholar]
- Beveridge D. L.; McConnell K. J. Curr. Opin. Struct. Biol. 2000, 10, 182. [DOI] [PubMed] [Google Scholar]
- Cheatham T. E. Curr. Opin. Struct. Biol. 2004, 14, 360. [DOI] [PubMed] [Google Scholar]
- Fadrna E.; Spackova N.; Sarzynska J.; Koca J.; Orozco M.; Cheatham T. E.; Kulinski T.; Sponer J. J. Chem. Theory Comput. 2009, 5, 2514. [DOI] [PubMed] [Google Scholar]
- Yildirim I.; Stern H. A.; Sponer J.; Spackova N.; Turner D. H. J. Chem. Theory Comput. 2009, 5, 2088. [DOI] [PMC free article] [PubMed] [Google Scholar]
- Yildirim I.; Turner D. H. Biochemistry 2005, 44, 13225. [DOI] [PMC free article] [PubMed] [Google Scholar]
- Hobza P.; Sponer J. Chem. Rev. 1999, 99, 3247. [DOI] [PubMed] [Google Scholar]
- Sponer J.; Leszczynski J.; Hobza P. J. Phys. Chem. 1996, 100, 5590. [Google Scholar]
- Sponer J.; Leszczynski J.; Hobza P. Biopolymers 2001, 61, 3. [DOI] [PubMed] [Google Scholar]
- Sponer J.; Sponer J. E.; Petrov A. I.; Leontis N. B. J. Phys. Chem. B 2010, 114, 15723. [DOI] [PMC free article] [PubMed] [Google Scholar]
- Ode H.; Matsuo Y.; Neya S.; Hoshino T. J. Comput. Chem. 2008, 29, 2531. [DOI] [PubMed] [Google Scholar]
- Yildirim I.; Stern H. A.; Kennedy S. D.; Tubbs J. D.; Turner D. H. J. Chem. Theory Comput. 2010, 6, 1520. [DOI] [PMC free article] [PubMed] [Google Scholar]
- Banas P.; Hollas D.; Zgarbova M.; Jurecka P.; Orozco M.; Cheatham T. E.; Sponer J.; Otyepka M. J. Chem. Theory Comput. 2010, 6, 3836. [DOI] [PMC free article] [PubMed] [Google Scholar]
- Perez A.; Marchan I.; Svozil D.; Sponer J.; Cheatham T. E.; Laughton C. A.; Orozco M. Biophys. J. 2007, 92, 3817. [DOI] [PMC free article] [PubMed] [Google Scholar]
- Altona C.; Sundaralingam M. J. Am. Chem. Soc. 1973, 95, 2333. [DOI] [PubMed] [Google Scholar]
- Varani G.; Tinoco I. Q. Rev. Biophys. 1991, 24, 479. [DOI] [PubMed] [Google Scholar]
- Varani G.; Aboulela F.; Allain F. H. T. Prog. Nucl. Magn. Reson. Spectrosc. 1996, 29, 51. [Google Scholar]
- Doornbos J.; Wreesmann C. T. J.; Boom J. H.; Altona C. Eur. J. Biochem. 1983, 131, 571. [DOI] [PubMed] [Google Scholar]
- Isaksson J.; Acharya S.; Barman J.; Cheruku P.; Chattopadhyaya J. Biochemistry 2004, 43, 15996. [DOI] [PubMed] [Google Scholar]
- Kierzek E.; Pasternak A.; Pasternak K.; Gdaniec Z.; Yildirim I.; Turner D. H.; Kierzek R. Biochemistry 2009, 48, 4377. [DOI] [PMC free article] [PubMed] [Google Scholar]
- Dewey T. G.; Turner D. H. Biochemistry 1979, 18, 5757. [DOI] [PubMed] [Google Scholar]
- Freier S. M.; Hill K. O.; Dewey T. G.; Marky L. A.; Breslauer K. J.; Turner D. H. Biochemistry 1981, 20, 1419. [DOI] [PubMed] [Google Scholar]
- Porschke D. Eur. J. Biochem. 1973, 39, 117. [DOI] [PubMed] [Google Scholar]
- Porschke D. Biopolymers 1978, 17, 315. [Google Scholar]
- Slichter C. P.Principles of Magnetic Resonance, 3rd ed.; Springer: New York, 1996. [Google Scholar]
- Case D. A.; Darden T. A.; Cheatham T. E. I.; Simmerling C. L.; Wang J.; Duke R. E.; Luo R.; Merz K. M.; Pearlman D. A.; Crowley M.; Walker R. C.; Zhang W.; Wang B.; Hayik S.; Roitberg A.; Seabra G.; Wong K. F.; Paesani F.; Wu X.; Brozell S.; Tsui V.; Gohlke H.; Yang L.; Tan C.; Mongan J.; Hornak V.; Cui G.; Beroza P.; Mathews D. H.; Schafmeister C.; Ross W. S.; Kollman P. A.. AMBER 9; University of California, San Francisco: San Francisco, CA, 2006. [Google Scholar]
- Hawkins G. D.; Cramer C. J.; Truhlar D. G. Chem. Phys. Lett. 1995, 246, 122. [Google Scholar]
- Hawkins G. D.; Cramer C. J.; Truhlar D. G. J. Phys. Chem. 1996, 100, 19824. [Google Scholar]
- Tsui V.; Case D. A. Biopolymers 2000, 56, 275. [DOI] [PubMed] [Google Scholar]
- Berendsen H. J. C.; Postma J. P. M.; van Gunsteren W. F.; Dinola A.; Haak J. R. J. Chem. Phys. 1984, 81, 3684. [Google Scholar]
- Jorgensen W. L.; Chandrasekhar J.; Madura J. D.; Impey R. W.; Klein M. L. J. Chem. Phys. 1983, 79, 926. [Google Scholar]
- Aqvist J. J. Phys. Chem. 1990, 94, 8021. [Google Scholar]
- Ryckaert J. P.; Ciccotti G.; Berendsen H. J. C. J. Comput. Phys. 1977, 23, 327. [Google Scholar]
- Sagui C.; Pedersen L. G.; Darden T. A. J. Chem. Phys. 2004, 120, 73. [DOI] [PubMed] [Google Scholar]
- Toukmaji A.; Sagui C.; Board J.; Darden T. J. Chem. Phys. 2000, 113, 10913. [Google Scholar]
- Schneider B.; Moravek Z.; Berman H. M. Nucleic Acids Res. 2004, 32, 1666. [DOI] [PMC free article] [PubMed] [Google Scholar]
- Richardson J. S.; Schneider B.; Murray L. W.; Kapral G. J.; Immormino R. M.; Headd J. J.; Richardson D. C.; Ham D.; Hershkovits E.; Williams L. D.; Keating K. S.; Pyle A. M.; Micallef D.; Westbrook J.; Berman H. M. RNA 2008, 14, 465. [DOI] [PMC free article] [PubMed] [Google Scholar]
- Correll C. C.; Beneken J.; Plantinga M. J.; Lubbers M.; Chan Y. L. Nucleic Acids Res. 2003, 31, 6806. [DOI] [PMC free article] [PubMed] [Google Scholar]
- Szewczak A. A.; Moore P. B. J. Mol. Biol. 1995, 247, 81. [DOI] [PubMed] [Google Scholar]
- Bloomfield V. A.; Crothers D. M.; Tinoco I. Jr.. Nucleic Acids: Structures, Properties, and Functions; University Science Books: Sausalito, CA, 2000. [Google Scholar]
- Altona C.; Sundaralingam M. J. Am. Chem. Soc. 1972, 94, 8205. [DOI] [PubMed] [Google Scholar]
- Das R.; Karanicolas J.; Baker D. Nat. Methods 2010, 7, 291. [DOI] [PMC free article] [PubMed] [Google Scholar]
Associated Data
This section collects any data citations, data availability statements, or supplementary materials included in this article.