Abstract
Circadian rhythms are oscillations of physiology, behavior, and metabolism that have period lengths of 24 hours. In several model organisms and man, circadian clock genes have been characterized and found to be transcription factors. Because of this, researchers have used microarrays to characterize global regulation of gene expression and algorithmic approaches to detect cycling. Here we present a new algorithm, JTK_CYCLE, designed to efficiently identify and characterize cycling variables in large datasets. Compared to COSOPT and the Fisher’s G test, two commonly used methods for detecting cycling transcripts, JTK_CYCLE distinguishes between rhythmic and non-rhythmic transcripts more reliably and efficiently. We also show that JTK_CYCLE’s increased resistance to outliers results in considerably greater sensitivity and specificity. Moreover, JTK_CYCLE accurately measures the period, phase, and amplitude of cycling transcripts, facilitating downstream analyses. Finally, it is several orders of magnitude faster than COSOPT, making it ideal for large scale data sets. We used JTK_CYCLE to analyze legacy data sets including NIH3T3 cells, which have comparatively low amplitude. JTK_CYCLE’s improved power led to the identification of a novel cluster of RNA-interacting genes whose abundance is under clear circadian regulation. These data suggest that JTK_CYCLE is an ideal tool for identifying and characterizing oscillations in genome-scale datasets.
Keywords: Circadian Rhythms, Biological Oscillations, Statistical Methods, Systems Biology, Genomics, Microarrays
Introduction
Circadian rhythms are daily oscillations of physiology and behavior that are found in a wide array of species, including animals, plants, fungi, and cyanobacteria (Dunlap 1999; Wijnen and Young 2006). By providing an internal timekeeping mechanism, circadian rhythms allow an organism to anticipate and adapt to predictable daily oscillations in their environment. As a consequence, circadian rhythms provide an adaptive advantage by permitting organisms to consolidate metabolic processes to coincide with appropriate levels of light, heat, moisture, and nutrient availability(Harmer 2009). Moreover, among animals, sleep/wake cycles are regulated by the circadian network to maximize the availability of food as well as avoid predation (Andretic et al. 2008).
Notably, circadian rhythms have important consequences for human health. Blood pressure, body temperature, and metabolism are all under the regulation of the circadian clock (Curtis and Fitzgerald 2006; Hastings et al. 2003), and heritable mutations in genes involved in circadian regulation cause significant disruptions in sleep/wake cycles of affected individuals (Ptácek et al. 2007). Moreover, the efficacy and toxicity of many different drugs has been shown to depend considerably of the time of day they are administered (Antoch et al. 2005; Halberg et al. 2006). Consequently, studying interactions between the circadian network and pharmaceuticals (termed chronotherapeutics) has become an important aspect of modern medicine (Smolensky and Peppas 2007). Most significantly, disruptions of circadian rhythms have been linked to a variety of pathologies in humans, including cancer, increased susceptibility to heart disease, metabolic disorders as well as some mental illnesses (Curtis and Fitzgerald 2006; Klerman 2005; Levi and Schibler 2007; Paschos et al. 2010).
The circadian clock is a network of mutually interacting proteins that generate a transcriptional/translational feedback loop (Ko and Takahashi 2006). This feedback loop is thought to drive complex physiological rhythms such as daily oscillations in blood pressure and metabolism through rhythmic transcription of output genes downstream of the core circadian clock (Hastings et al. 2003). Consequently, there has been considerable interest in identifying transcripts with rhythmic abundances, both to identify possible components of the circadian clock and to identify genes whose protein products might regulate rhythmic physiologies. Microarray technologies have been particularly useful in this respect, allowing investigators to measure simultaneously the abundances of tens of thousands of transcripts(reviewed in (Hayes et al. 2005)).
Successful circadian analysis of microarray datasets requires powerful and specific statistical tests to identify cycling genes in noisy datasets as well as accurate and precise statistical measures to determine crucial attributes of their rhythms including period, phase, and amplitude. Several approaches have been previously used with success including those based on autocorrelation (Levine et al. 2002), curve-fitting (Straume 2004), and Fourier analysis (Wichert et al. 2004). Here we present JTK_CYCLE, a novel non-parametric statistical algorithm designed to identify and characterize cycling variables in large datasets. The JTK_CYCLE algorithm is available as a computationally efficient R script and offers an unsurpassed combination of statistical power, specificity, accuracy, and precision in identification and characterization of cycling transcripts in genome-scale datasets.
Materials and Methods
Design
The Jonckheere-Terpstra (JT) test in a non-parametric test that is most powerful for detecting monotonic orderings of data across ordered independent groups. Kendall’s tau is a measure of rank correlation that is used to measure the association between two measured quantities. The Jonckheere-Terpstra-Kendall (JTK) algorithm applies the JT test to a family of alternative hypothesized group orderings, while keeping the group sizes fixed. For enhanced computational efficiency, these tests are performed by utilizing the mathematical equivalence between the exact null JT distribution and the exact null distribution of Kendall’s tau correlation between a continuous random variate and an ordinal grouping factor. JTK makes use of the Harding algorithm to efficiently calculate exact permutation probabilities for all possible values of the JT test statistics(Harding 1984); thus, exact p-values for JTK statistics may be rapidly determined by simply referencing a look-up table calculated in advance.
The algorithm presented here, JTK_CYCLE, applies the JTK algorithm to alternative hypothesized group orderings corresponding to a range of user-defined period lengths and phases. In effect, the JTK_CYCLE algorithm finds the optimal combination of period and phase that minimizes the exact p-value of Kendall’s tau correlation between an experimental time series and each tested cyclical ordering. For the ease of interpretation, group orderings are derived from cosine curves, although generally speaking, the choice of group order can be anything. Each minimal p-value is Bonferroni-adjusted for multiple testing and consequently, the adjusted minimal p-values reported by JTK-CYCLE are uniformly conservative, i.e., they are never lower than the true p-value (Figure S1).
Because Kendall’s tau depends only on the signs of the inter-group differences between pairs of values, the optimal periods and phases found by JTK_CYCLE are invariant under monotonic transformations of the time series (e.g. logarithmic). Moreover, the optimal periods and phases found by JTK_CYCLE are highly resistant to outliers, because Kendall’s tau depends only on the signs of the inter-group differences between pairs of values.
JTK_CYCLE estimates the amplitude of each optimal cyclical pattern by calculating the one-cycle median sign-adjusted deviation from the median (msad), where each sign-adjusted deviation equals the product of the deviation and the associated sign of the optimal cosine pattern. For a perfect cosine pattern with amplitude A, the one-cycle msad equals the mad (median absolute deviation from the median) which in turn equals A/sqrt(2).
Computational efficiency
The exact null JT distribution is completely determined by the number of replicates at each time point. Consequently, the complete JT distribution can be calculated once and then used as a lookup table. There is no need to perform permutation tests on the resulting p-values, because the Harding algorithm takes account of all possible permutations.
As a result, JTK_CYCLE is extremely computationally efficient. In our tests (Intel Core 2 Duo P8800, 2.66 GHz, 4GB RAM, Windows Vista, R version 2.10.0), most standard analyses (48 time points, ~45k transcripts, 3 hour (23–25h) period range) finish within 15–20 minutes. In contrast, a similar COSOPT analysis takes several days to complete, a difference on the order of 100-fold.
Test sets
To simulate circadian gene expression, synthetic ‘transcripts’ were generated with variable amplitude, phase and period length. Amplitudes for cycling transcripts were uniformly distributed between 1 and 6, period lengths were uniformly distributed between 20 and 30, and phase was uniformly distributed across the entire cycle. A standard normal random variable was used to simulate experimental noise; and outliers(amplitude = 20) were included at randomly selected time points comprising ~1% of the test data values (R script to generate test set available in the supplemental data). COSOPT and Fisher’s G tests were performed on these data as previously described (Hughes et al. 2009). To identify functional classes of genes enriched in cycling data sets, DAVID analysis was performed as described (Huang et al. 2009).
Results and Discussion
Identification of cycling transcripts
To test the sensitivity and specificity of JTK_CYCLE, we generated a test set of 1024 random transcripts that simulate data from a typical circadian microarray experiment. These data included 48 data points per transcript, 1-hour sampling density across two full days. Each data point was multiplied by a standard normal random variable to simulate experimental noise, and about 1% of data points were selected at random to be outliers with an amplitude of 20. To assess the frequency of false-positives, half of the transcripts were entirely non-rhythmic (amplitude = 0). The remaining transcripts were rhythmic with a wide range of amplitudes (1–6) to test the sensitivity of JTK_CYCLE to both low and high amplitude oscillations. We then ran JTK_CYCLE, COSOPT (Straume 2004), and Fisher’s G test (Wichert et al. 2004) to detect cycling transcripts.
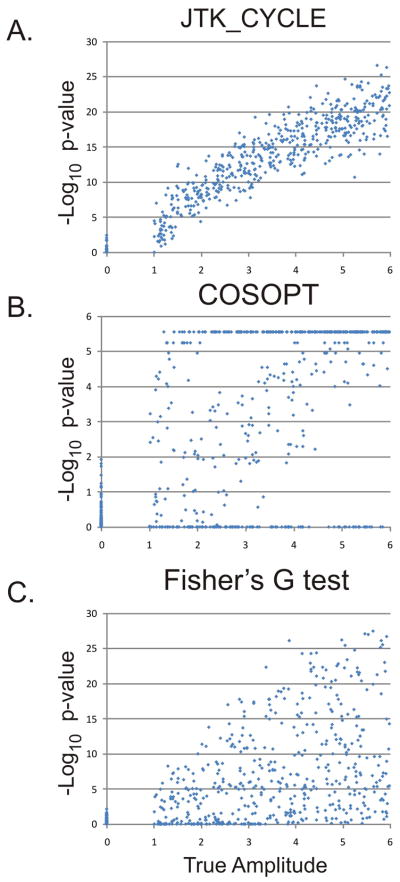
Figure 1 shows the Log 10 p-values of all three tests plotted versus the true amplitude of each transcript. As expected, JTK_CYCLE (A) shows a clear positive correlation, indicating that the confidence with which JTK_CYCLE can identify a transcript as cycling increases as a function of the amplitude of oscillation. The distribution of the true-null transcripts (amplitude = 0) shows little overlap with the distribution of the genuinely cycling transcripts. In fact, at amplitudes greater than ~1.5, JTK_CYCLE can unambiguously identify all cycling transcripts. Similarly, both COSOPT (B) and Fisher’s G test (C) show positive correlations between their −Log 10 p-vales and amplitude; however, the p-value distributions of the non-rhythmic transcripts overlaps extensively with the true-positives. The inability to unambiguously distinguish rhythmic from non-rhythmic transcripts gets worse as amplitude decreases. Unlike JTK_CYCLE, neither COSOPT nor Fisher’s G test reliably distinguishes between rhythmic and non-rhythmic transcripts at amplitudes less than two. Consequently, the number of false-negatives is considerably greater for COSOPT and Fisher’s G test relative to JTK_CYCLE (Table 1, Figure 2), with comparable numbers of false-positives. COSOPT in particular shows a vulnerability to outliers which dramatically increases the frequency of false-negatives and thus, limits the statistical power of this, and similar goodness-of-fit statistics.
Figure 1. JTK_CYCLE reliably detects cycling transcripts.
To simulate circadian gene expression, a test set of 1024 ‘transcripts’ was randomly generated with 48 time points per transcript. Half of these transcripts were non-rhythmic with amplitudes equal to zero; the other half consisted of transcripts with amplitudes ranging from one (weakly rhythmic) to six (strongly rhythmic). JTK_CYCLE (A), COSOPT (B), and Fisher’s G-test (C) were used to analyze these data, and −Log 10 p-values were plotted as a function of the true amplitude. JTK_CYCLE reliably distinguished rhythmic from non-rhythmic transcripts; in comparison, COSOPT and Fisher’s G-test showed considerable overlap between the null-distribution and the true-positives.
Table 1.
Comparison of false-positive and false-negative rates between JTK_CYCLE, COSOPT, and Fisher’s G-test.
| Threshold | False-positives | False-negatives | |
|---|---|---|---|
| JTK_CYCLE | p < 0.05 | 5 | 3 |
| p< 0.01 | 2 | 9 | |
| p < 0.001 | 0 | 17 | |
| COSOPT | p < 0.05 | 4 | 135 |
| p< 0.01 | 0 | 152 | |
| p < 0.001 | 0 | 187 | |
| Fisher’s G | p < 0.05 | 10 | 131 |
| p< 0.01 | 1 | 156 | |
| p < 0.001 | 0 | 187 |
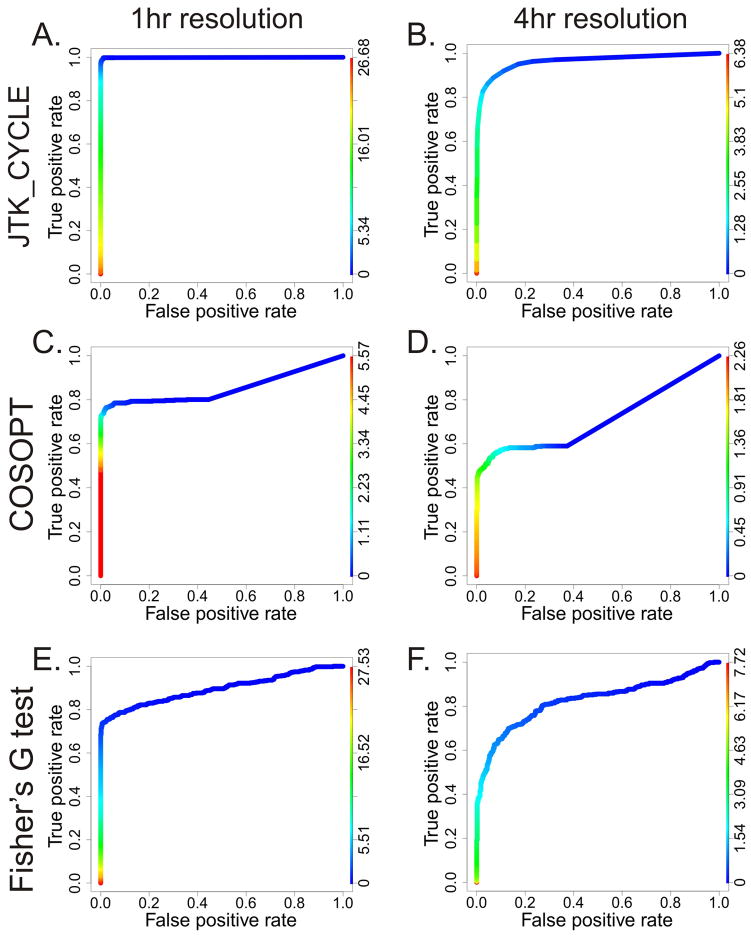
Figure 2. JTK_Cycle outperforms Fisher’s G-test and COSOPT at both 1-and 4-hour sampling resolutions.
Using the results from Figure 1, ROC plots were generated to visualize the sensitivity and specificity of JTK_Cycle (A, B), COSOPT (C, D) and Fisher’s G-test (E, F) at both one (left) and four (right) hour sampling resolutions. Color-coded lines represent −Log 10 p-values.
Since many circadian microarray papers have sampled RNA expression every four hours, we repeated these simulations using lower sampling resolutions. In every case, JTK_Cycle shows greater sensitivity and specificity than either alternative algorithm (Figure 2). These results were replicated using a test set that did not include simulated outliers (Figure S2). As expected, COSOPT and Fisher’s G-test showed improved statistical power when outliers are removed, while JTK_Cycle was largely unaffected, demonstrating JTK_Cycle’s resistance to outliers.
Similarly, when JTK_CYCLE and COSOPT are run against a test set with 24 time points in replicate pairs rather than 48 individual time points, JTK_CYCLE shows significantly greater statistical power (Figure S3 A–F). Moreover, the correlation between replicate pairs is higher for JTK-CYCLE than COSOPT (Figure S3 G–H), highlighting the sensitivity and reproducibility of JTK_CYCLE.
Measuring Period Length
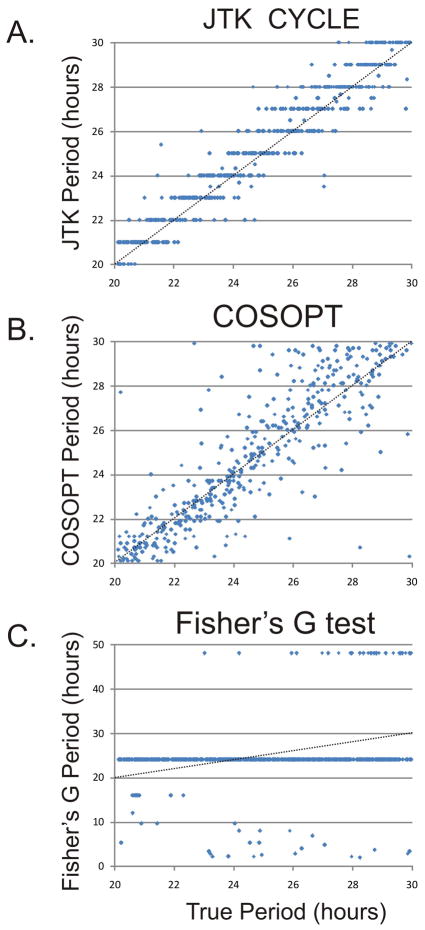
Wild type organisms under entraining conditions (e.g. daily light cycles) have precisely 24 hour transcriptional rhythms. However, in constant conditions and in clock mutant models, the period of circadian rhythms can vary significantly. Accurate estimation of this period difference can inform mechanism. Moreover, the surprising discovery of 12 and 8 hour transcriptional oscillations in the mouse liver (Hughes et al. 2009)further motivates the use of statistical tools which can identify and characterize rhythmic transcripts with a wide range of period lengths. To examine the accuracy of JTK_CYCLE’s period length measurement, we created a test set with 512 rhythmic transcripts with periods ranging from 20 to 30 hours. JTK_CYCLE, COSOPT, and Fisher’s G test were run on these data and period measurements were plotted versus their true periods(Figure 3).
Figure 3. JTK_CYCLE accurately estimates the period length of cycling transcripts.
A test set of 512 rhythmic ‘transcripts’ was generated with period lengths ranging from 20–30 hours. JTK_CYCLE (A), COSOPT (B), and Fisher’s G-test (C) were used to estimate the period length of these transcripts. JTK_CYCLE (R2 = 0.926) and COSOPT (R2 = 0.732) periods varied linearly with the true period; in contrast, Fisher’s G test (R2 = 0.053) was considerably less accurate in estimating period. Dotted lines represent the expected values of these distributions.
JTK_CYCLE (A) and COSOPT (B) showed a clear linear correlation between the measured and actual values, with JTK_CYCLE showing greater overall accuracy (JTK_CYCLE R2 = 0.926 versus COSOPT R2 =0.732). In contrast, Fisher’s G test (C) was unable to measure differences in period lengths between transcripts, due to the discrete number of Fourier frequencies used in the analysis. Consequently, the majority of transcripts were assigned periods precisely equal to 24 hours, although a number of outliers were assigned periods considerably different than their true value. While Fisher’s G test has proven to be effective for identifying cycling transcripts in wild type organisms, these limitations in period length measurements hinder the application of this algorithm to mutant genotypes as well as experiments where the period(s) of oscillation are not known a priori.
Measuring Phase and Amplitude
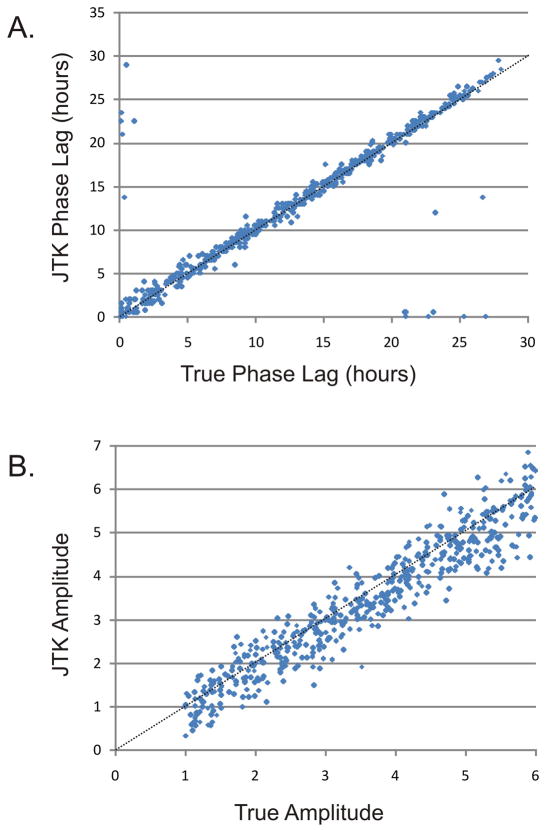
In addition to period length, accurate measurement of the phase and amplitude of a cycling transcript is essential for downstream analyses. Grouping cycling transcripts by phase may suggest a common underlying regulatory mechanism as well as indicate regulated circadian processes. Likewise, the most robust cycling candidates can be identified using an amplitude filter. JTK_CYCLE phase measurements were plotted against the true phase (Figure 4A), indicating a strong linear correlation with an accuracy modestly superior to COSOPT (R2 0.766 versus 0.611, data not shown). Similarly, JTK_CYCLE amplitude measurements were strongly linear (R2 = 0.912), indicating that JTK_CYCLE accurately measures both phase and amplitude of cycling transcripts.
Figure 4. JTK_CYCLE reliably estimates phase and amplitude of cycling transcripts.
A test set of 512 rhythmic ‘transcripts’ was generated with phases varying uniformly across the period length and amplitudes ranging from one (essentially non-rhythmic) to six (strongly rhythmic). JTK_CYCLE was used to estimate the phase of these transcripts. In (A), JTK_CYCLE phase is plotted as a function of the true phase showing a strong linear correlation (R2 = 0.766). Note that phase is defined as the time point at which the underlying curve reaches its maximum value; consequently, given the cyclical nature of the circadian clock, the outliers observed on both the x-and y-axes are in much closer agreement with their expected values than they appear. In (B), JTK_CYCLE amplitude is plotted as a function of true amplitude, revealing a strong linear correlation (R2 = 0.912). Dotted lines represent the expected values of these distributions.
Application to circadian datasets
We applied JTK_CYCLE to four different high resolution circadian microarray experiments including the mouse liver, mouse pituitary, NIH3T3 cells, and U2OS cells (Hughes et al. 2007; Hughes et al. 2009). The resulting JTK_CYCLE output is available at http://bioinf.itmat.upenn.edu/circa as well as being provided in supplemental Tables S1–4. In all four tissues, JTK_CYCLE identified more cycling genes at higher confidence levels than previously reported (Table 2). In agreement with previous work, JTK_CYCLE identified considerably more cycling transcripts in liver than pituitary, and far more cycling transcripts in either of these tissues than in synchronized cell lines. Encouragingly, JTK_CYCLE detected all three major period lengths(~8, 12, and 24 hr)in the mouse liver in proportions comparable to those previously reported (Figure S4). Taken as a whole, these data support the notion that JTK_CYCLE is an effective tool for identifying and characterizing transcriptional rhythms.
Table 2.
Number of cycling transcripts detected by JTK_CYCLE in four different tissue-types.
| BH Q value | Liver | Pituitary | NIH3T3 | U2OS |
|---|---|---|---|---|
| < 0.001 | 2280 | 158 | 12 | 8 |
| < 0.01 | 3653 | 262 | 16 | 9 |
| < 0.05 | 5425 | 392 | 25 | 21 |
| < 0.1 | 6532 | 509 | 30 | 34 |
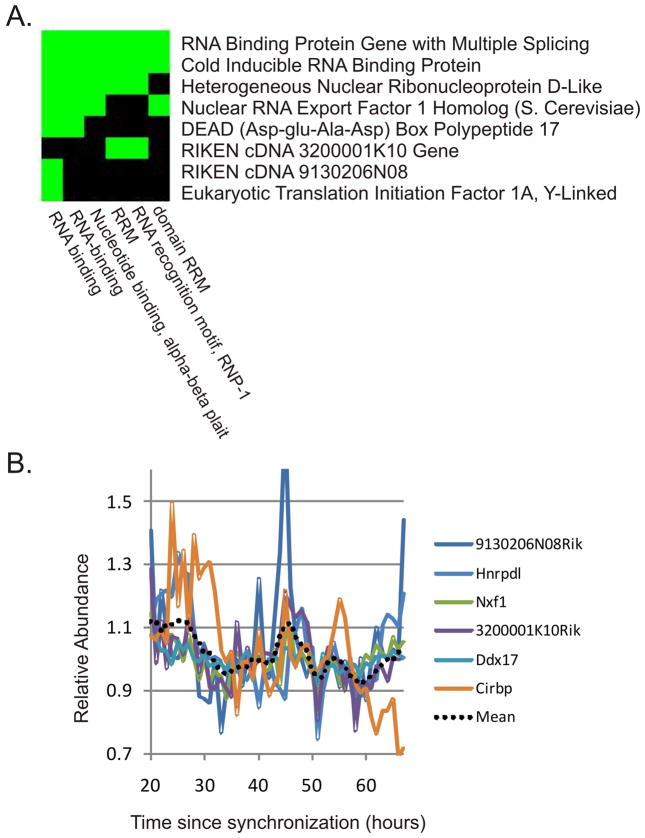
JTK_CYCLE’s advantages over COSOPT and Fisher’s G test are most apparent in the analysis of synchronized cell lines. Unlike tissue samples from an intact animal, transcriptional rhythms in cell lines are not reinforced by systemic cues, resulting in generally low amplitude rhythms that are more dramatically affected by experimental and biological noise. Compared to the combination of COSOPT and Fisher’s G test, JTK_CYCLE identified approximately twice as many cycling transcripts in these data(Table 2). To determine whether the greater sensitivity of JTK_CYCLE is of practical importance to circadian investigators, we performed DAVID analysis (Huang et al. 2009) to identify clusters of enriched genes in this set. As expected, we found the most enriched functional class were genes involved in circadian rhythms (Table S5). At the same time, we identified a cluster of eight cycling genes that are involved in RNA binding and recognition (Figure 5A and Table S5). Interestingly, six of the eight genes show similar phases, suggesting a common underlying regulatory mechanism (Figure 5B). Three of these six genes (Hnrpdl, Ddx17, and Cirbp) also oscillate in the liver, further increasing confidence that these genes are bona fide circadian outputs. The ability of JTK_CYCLE to identify this cluster of cycling genes in addition to those identified by the combination of COSOPT and Fisher’s G test highlights the practical advantages of JTK_CYCLE. Moreover, given the increased resistance to outliers in this approach, we speculate that JTK_CYCLE may be particularly well suited for identifying low amplitude cycling genes in noisy data sets such as synchronized cell lines.
Figure 5. DAVID analysis of cycling genes detected by JTK_CYCLE in NIH3T3 cells reveals a cluster of RNA-binding genes with similar phases.
JTK_CYCLE was used to re-analyze cycling transcripts in synchronized NIH3T3 cells (Hughes et al. 2009). JTK_CYCLE detected more than twice as many cycling transcripts (N=30) as previously reported. DAVID analysis was performed on these 30 transcripts to detect enriched functional classes. Among the most enriched groups was a cluster of eight genes involved in RNA binding and recognition (A). Green blocks indicate that the annotations on the x-axis are present in the genes on the y-axis. Of these eight genes, six show similar phases of their oscillations (B), suggesting a common underlying mechanism (the dotted line represents a moving average of the median-normalized expression patterns of all six transcripts).
Previously, we used a combination of COSOPT and Fisher’s G test to identify cycling transcripts in circadian microarray experiments. The reasoning for this approach was straight forward; by using multiple algorithms, the strengths of one test can be used to offset the weaknesses of another. Specifically, COSOPT is highly intuitive and accurately measures period lengths and phases of rhythmic transcripts; however, because it is permutation-based, it is statistically under powered and takes several days to run a standard analysis. Fisher’s G test, on the other hand, is computationally efficient and more powerful than COSOPT, but fails to adequately characterize the properties of identified cycling transcripts. Here we present a novel approach which we believe combines the best aspects of each algorithm while also providing additional statistical power. Like Fisher’s G test, JTK_CYCLE is extremely efficient; a typical analysis (e.g. 48 time points, 45 thousand probe sets) generally takes less than a half hour on a standard desktop machine. Unlike Fisher’s G test, JTK_CYCLE provides amplitude, period and phase measurements that are even more accurate than COSOPT. In comparison with both approaches, JTK_CYCLE successfully identifies more rhythmic transcripts with fewer false positive observations (Figures 1 and 2, Tables 1 and 2).
We believe this approach will be of considerable use for circadian biologists who need to identify cycling transcripts in large datasets with maximal sensitivity and specificity. However, it is important to emphasize that JTK_CYCLE has applications beyond circadian microarray studies. Within the broader circadian field, JTK_CYCLE may be easily applied to exon array and RNA-sequencing studies, as well as cell-based screens using kinetic imaging to identify novel circadian phenotypes (Baggs et al. 2009; Zhang et al. 2009). The latter case may be a particularly advantageous application of JTK_CYCLE as the computational advantages of JTK_CYCLE become most apparent with increasing sampling density. More broadly, to test the applicability of JTK_CYCLE to non-circadian datasets, we used JTK_CYCLE to identify rhythmic transcripts in a microarray study of human cell division(Whitfield et al. 2002). As expected, JTK_CYCLE reliably detects transcripts whose abundance oscillates with the cell division cycle, including identifying a number of candidates not previously considered to be highly rhythmic (Table S6). Taken as a whole, these data indicate that JTK_CYCLE can be used to identify cycling variables within a broad range of quantitative datasets, which suggests a role for JTK_CYCLE in such diverse fields as cell division, physiology, metabolism, and population biology.
Supplementary Material
Acknowledgments
We would like to thank Laura Hughes, Ellena McCarthy and members of the Hogenesch lab for helpful comments during the preparation of the manuscript. This work was supported by the National Institute of Mental Health (NIMH) P50 Conte Center grant MH074924 (Research Center Grant awarded to Center Director Joseph S. Takahashi, Project Principal Investigator JBH), the National Heart, Lung, and Blood Institute (NHBLI, 1R01HL097800), and Pennsylvania Commonwealth Health Research Formula Funds (JBH).
References
- Andretic R, Franken P, Tafti M. Genetics of sleep. Annual Review of Genetics. 2008;42:361–388. doi: 10.1146/annurev.genet.42.110807.091541. [DOI] [PubMed] [Google Scholar]
- Antoch MP, Kondratov RV, Takahashi JS. Circadian clock genes as modulators of sensitivity to genotoxic stress. Cell Cycle (Georgetown, Tex) 2005;4:901–907. doi: 10.4161/cc.4.7.1792. [DOI] [PMC free article] [PubMed] [Google Scholar]
- Baggs JE, Price TS, DiTacchio L, Panda S, Fitzgerald GA, Hogenesch JB. Network features of the mammalian circadian clock. PLoS Biology. 2009;7:e52. doi: 10.1371/journal.pbio.1000052. [DOI] [PMC free article] [PubMed] [Google Scholar]
- Curtis AM, Fitzgerald GA. Central and peripheral clocks in cardiovascular and metabolic function. Annals of Medicine. 2006;38:552–559. doi: 10.1080/07853890600995010. [DOI] [PubMed] [Google Scholar]
- Dunlap JC. Molecular Bases for Circadian Clocks. Cell. 1999;96:271–290. doi: 10.1016/s0092-8674(00)80566-8. [DOI] [PubMed] [Google Scholar]
- Halberg F, Cornélissen G, Ulmer W, Blank M, Hrushesky W, Wood P, Singh RK, Wang Z. Cancer chronomics III. Chronomics for cancer, aging, melatonin and experimental therapeutics researchers. Journal of Experimental Therapeutics & Oncology. 2006;6:73–84. [PMC free article] [PubMed] [Google Scholar]
- Harding EF. An Efficient, Minimal-Storage Procedure for Calculating the Mann-Whitney U, Generalized U and Similar Distributions. Journal of the Royal Statistical Society Series C (Applied Statistics) 1984;33:1–6. [Google Scholar]
- Harmer SL. The circadian system in higher plants. Annual Review of Plant Biology. 2009;60:357–377. doi: 10.1146/annurev.arplant.043008.092054. [DOI] [PubMed] [Google Scholar]
- Hastings MH, Reddy AB, Maywood ES. A clockwork web: circadian timing in brain and periphery, in health and disease. Nature Reviews Neuroscience. 2003;4:649–661. doi: 10.1038/nrn1177. [DOI] [PubMed] [Google Scholar]
- Hayes KR, Baggs JE, Hogenesch JB. Circadian clocks are seeing the systems biology light. Genome Biology. 2005;6:219. doi: 10.1186/gb-2005-6-5-219. [DOI] [PMC free article] [PubMed] [Google Scholar]
- Huang DW, Sherman BT, Lempicki RA. Systematic and integrative analysis of large gene lists using DAVID bioinformatics resources. Nature Protocols. 2009;4:44–57. doi: 10.1038/nprot.2008.211. [DOI] [PubMed] [Google Scholar]
- Hughes M, Deharo L, Pulivarthy SR, Gu J, Hayes K, Panda S, Hogenesch JB. High-resolution time course analysis of gene expression from pituitary. Cold Spring Harbor Symposia on Quantitative Biology. 2007;72:381–386. doi: 10.1101/sqb.2007.72.011. [DOI] [PMC free article] [PubMed] [Google Scholar]
- Hughes ME, DiTacchio L, Hayes KR, Vollmers C, Pulivarthy S, Baggs JE, Panda S, Hogenesch JB. Harmonics of circadian gene transcription in mammals. PLoS Genetics. 2009;5:e1000442. doi: 10.1371/journal.pgen.1000442. [DOI] [PMC free article] [PubMed] [Google Scholar]
- Klerman EB. Clinical aspects of human circadian rhythms. Journal of Biological Rhythms. 2005;20:375–386. doi: 10.1177/0748730405278353. [DOI] [PubMed] [Google Scholar]
- Ko CH, Takahashi JS. Molecular components of the mammalian circadian clock. Human Molecular Genetics 15 Spec No. 2006;2:R271–277. doi: 10.1093/hmg/ddl207. [DOI] [PubMed] [Google Scholar]
- Levi F, Schibler U. Circadian rhythms: mechanisms and therapeutic implications. Annual Review of Pharmacology and Toxicology. 2007;47:593–628. doi: 10.1146/annurev.pharmtox.47.120505.105208. [DOI] [PubMed] [Google Scholar]
- Levine JD, Funes P, Dowse HB, Hall JC. Signal analysis of behavioral and molecular cycles. BMC Neuroscience. 2002;3:1. doi: 10.1186/1471-2202-3-1. [DOI] [PMC free article] [PubMed] [Google Scholar]
- Paschos GK, Baggs JE, Hogenesch JB, FitzGerald GA. The role of clock genes in pharmacology. Annual Review of Pharmacology and Toxicology. 2010;50:187–214. doi: 10.1146/annurev.pharmtox.010909.105621. [DOI] [PubMed] [Google Scholar]
- Ptácek LJ, Jones CR, Fu YH. Novel insights from genetic and molecular characterization of the human clock. Cold Spring Harbor Symposia on Quantitative Biology. 2007;72:273–277. doi: 10.1101/sqb.2007.72.017. [DOI] [PubMed] [Google Scholar]
- Smolensky MH, Peppas NA. Chronobiology, drug delivery, and chronotherapeutics. Advanced Drug Delivery Reviews. 2007;59:828–851. doi: 10.1016/j.addr.2007.07.001. [DOI] [PubMed] [Google Scholar]
- Straume M. DNA microarray time series analysis: automated statistical assessment of circadian rhythms in gene expression patterning. Methods in Enzymology. 2004;383:149–166. doi: 10.1016/S0076-6879(04)83007-6. [DOI] [PubMed] [Google Scholar]
- Whitfield ML, Sherlock G, Saldanha AJ, Murray JI, Ball CA, Alexander KE, Matese JC, Perou CM, Hurt MM, Brown PO, Botstein D. Identification of genes periodically expressed in the human cell cycle and their expression in tumors. Molecular Biology of the Cell. 2002;13:1977–2000. doi: 10.1091/mbc.02-02-0030.. [DOI] [PMC free article] [PubMed] [Google Scholar]
- Wichert S, Fokianos K, Strimmer K. Identifying periodically expressed transcripts in microarray time series data. Bioinformatics (Oxford, England) 2004;20:5–20. doi: 10.1093/bioinformatics/btg364. [DOI] [PubMed] [Google Scholar]
- Wijnen H, Young MW. Interplay of circadian clocks and metabolic rhythms. Annual Review of Genetics. 2006;40:409–448. doi: 10.1146/annurev.genet.40.110405.090603. [DOI] [PubMed] [Google Scholar]
- Zhang EE, Liu AC, Hirota T, Miraglia LJ, Welch G, Pongsawakul PY, Liu X, Atwood A, Huss JW, Janes J, Su AI, Hogenesch JB, Kay SA. A genome-wide RNAi screen for modifiers of the circadian clock in human cells. Cell. 2009;139:199–210. doi: 10.1016/j.cell.2009.08.031. [DOI] [PMC free article] [PubMed] [Google Scholar]
Associated Data
This section collects any data citations, data availability statements, or supplementary materials included in this article.


