Abstract
Drosophila melanogaster cell lines are important resources for cell biologists. Here, we catalog the expression of exons, genes, and unannotated transcriptional signals for 25 lines. Unannotated transcription is substantial (typically 19% of euchromatic signal). Conservatively, we identify 1405 novel transcribed regions; 684 of these appear to be new exons of neighboring, often distant, genes. Sixty-four percent of genes are expressed detectably in at least one line, but only 21% are detected in all lines. Each cell line expresses, on average, 5885 genes, including a common set of 3109. Expression levels vary over several orders of magnitude. Major signaling pathways are well represented: most differentiation pathways are “off” and survival/growth pathways “on.” Roughly 50% of the genes expressed by each line are not part of the common set, and these show considerable individuality. Thirty-one percent are expressed at a higher level in at least one cell line than in any single developmental stage, suggesting that each line is enriched for genes characteristic of small sets of cells. Most remarkable is that imaginal disc-derived lines can generally be assigned, on the basis of expression, to small territories within developing discs. These mappings reveal unexpected stability of even fine-grained spatial determination. No two cell lines show identical transcription factor expression. We conclude that each line has retained features of an individual founder cell superimposed on a common “cell line“ gene expression pattern.
Since the first embryonic Drosophila melanogaster cell lines were established in the late 1960s, hundreds of new lines have been initiated from embryos and from isolated tissues (imaginal discs, central nervous system [CNS], tumorous blood cells, and ovary), and they have played increasingly prominent roles in the work of developmental geneticists and cell biologists. In Echalier's 1997 review of the biology of the cell lines (Echalier 1997), only a few lines were readily available; still, it was clear that those lines retained many normal features that made them useful in the study of hormone responses, immune responses, heat shock, and diverse other processes. Since that review, many workers have devised ways to use the cell line assays to study developmental signaling and intercellular adhesion and, especially, as test systems for RNAi-based screens (Bakal and Perrimon 2010; Mohr et al. 2010). Public databases record more than 50 genome-wide screens based on Drosophila cell lines.
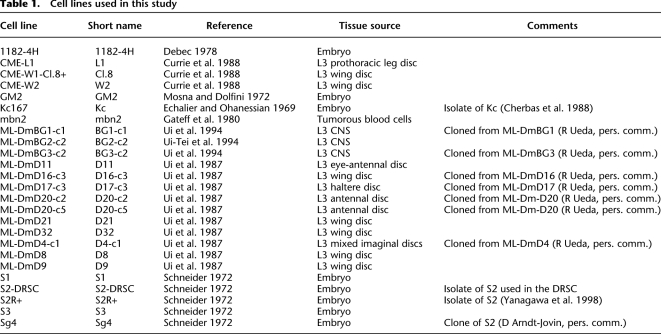
Prior to 2005, only a few lines were readily available; currently, over 100 lines are publicly available and are finding even more widespread application. Thus, the time is ripe for a more complete characterization. Here, we report the transcriptional profiles of 25 Drosophila melanogaster cell lines, principally by whole-genome tiling microarray analysis of total RNA, carried out as part of the modENCODE project (Celniker et al. 2009; The modENCODE Consortium 2010). The 25 cell lines used in this study are representative of the diversity of the publicly available lines; for a list of the lines and their tissues of origin, see Table 1, and for more extensive descriptions of their properties, see Supplemental Text.
Table 1.
Cell lines used in this study
The data produced in this study add to our knowledge of the cell lines and of the Drosophila transcriptome in several ways. We summarize the expression of previously annotated genes in each of the 25 lines with emphasis on what those patterns reveal about the origins of the lines and the stability of spatial expression patterns. We also offer an initial analysis of previously unannotated transcripts in the cell lines, an analysis that constitutes a major goal of the modENCODE project and that will be expanded in other publications (Graveley et al. 2011).
Results
Overview of the expression data
Samples of total RNA were prepared from healthy, exponentially growing cells. Transcript levels were measured by hybridization of total RNA probes to whole-genome tiling microarrays for all 25 lines in triplicate and by poly(A)+ paired-end RNA sequencing (RNA-seq) for four of the lines in duplicate. In the analyses reported here, we employed the transcript annotations in FlyBase v5.12 (Tweedie et al. 2009) as a standard of comparison. Using the hybridization signals, we calculated expression scores for both annotated exons and unannotated regions (see Methods). We also calculated gene scores, defined as the maximum score of any exon included in the relevant FlyBase gene model; thus, a gene will register as expressed when any of its known transcripts is expressed. Expression scores are reproduced in Supplemental Tables S2 (exons), S3 (genes), and S6 (novel transcript contigs). Microarray hybridization efficiencies vary among probes; while it is reasonable to compare a given exon across cell lines, it is dangerous to compare signals (except semiquantitatively) between exons. As described in the Methods, we selected a threshold score of 300 to distinguish the expressed from unexpressed genes. These scores are intended to provide a rough estimate of expression levels, and we have made no attempt to correct for errors caused by overlapping transcripts.
RNA-seq data were obtained for four of the cell lines. For these lines, arrays and RNA-seq provide correlated but distinct pictures of the data. Comparisons of the two techniques are described in detail in the Methods and in the Supplemental Figures and are consistent with the levels of correlation observed by others (Agarwal et al. 2010). As illustrated by the examples in Table 2, the tiling array data are consistent with biological expectations and are internally consistent.
Table 2.
Examples of genes whose expected expression pattern is seen in the cell lines
Gene scores for the cell lines were exponentially distributed, varying from undetectable (<300, see Methods) to 53,808, with the vast majority of genes expressed at the lower end of this spectrum (Supplemental Fig. S3). The distribution is consistent with earlier hybridization analyses (Levy and McCarthy 1975; Arthur et al. 1979; Izquierdo and Bishop 1979; Zimmerman et al. 1980, 1982) that showed that the titers of individual RNA species in Drosophila vary over four orders of magnitude, with the vast majority of species present at low levels (about one to three copies per cell). For the entire set of exon scores, the average value was 420 (median, 108; standard deviation, 1134). We note, as a measure of sensitivity, that in Kc167 cells saturation hybridizations showed the presence of about 200–300 Eip71CD transcripts per cell (Bieber 1986), and on Northern blots and by protein synthesis actin 5C gives a signal five to 10 times stronger than Eip71CD. In the microarray data, the Eip71CD gene score in Kc167 cells is 6742, while that for Act5C is 23,287.
The expression profiles of the cell lines are distinct; although most of the annotated transcriptome is expressed at a detectable level in at least one of the 25 lines, most genes are expressed in only a subset of the cell lines, and their expression levels vary widely among the lines. Of 14,807 genes that were probed, 64% are expressed at a detectable level in at least one cell line, but only 21% of genes are detected in all 25 lines. On average, each line expresses 5885 genes at a detectable level (range 5398–6221). In comparison, a similar analysis of tiling array data from 30 developmental stages detected 76% of genes in at least one developmental stage (Graveley et al. 2011; data available at http://modencode.org). One-thousand-one-hundred ninety-eight genes were detected in at least one cell line but not in any developmental stage, while 2142 genes were detected in at least one developmental stage but not in any cell line. Thirty-one percent of the probed genes were expressed at a higher level in at least one cell line than in any single developmental stage; this is to be expected, given the relative homogeneity of cultured cells compared to intact animals and conforms to previous observations comparing isolated tissues and whole animals (Chintapalli et al. 2007).
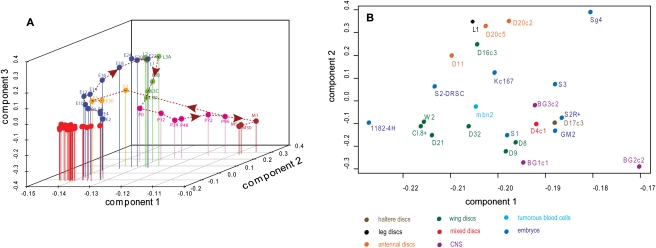
We used principal components analysis (PCA) to look for broad patterns of expression. Figure 1A shows the first three components of a PCA that includes the array-based gene scores for all 25 cell lines and 30 developmental stages. The figure shows a coherent trajectory of changing gene expression patterns during development with a clear progression through the embryonic, larval, and pupal stages, and it shows the expected clustering of female adults (bearing oocytes) with early embryos. The remarkable feature of this picture is the tight clustering of all the cell lines near early embryos.
Figure 1.
Clustering of cell lines by principal component analysis. (A) Clustering of cell lines with whole-animal developmental stages, showing components 1, 2, and 3. The whole-animal data were obtained using the same procedures as the cell line data (Graveley et al. 2011). (Red) Cell lines. (Dotted line) A trajectory for the developmental data. (Blue) Embryonic stages (Ex, where x is the time, in hours, at the end of a 2-h period measured from egg-laying); (green) larval stages (Lx where x is the instar number; 3A, 3B, 3C, and 3D represent sequential periods in the third larval instar); (pink) pupal stages (Px, where x is the time, in hours, after white prepupa); (brown) adult males (Mx, where x is the time, in days, after adult eclosion); (yellow) adult females (Fx, where x is the time, in days, after adult eclosion). (B) Clustering of 25 cell lines; components 1 and 2 are shown. Cell lines are color-coded to indicate the tissues from which they were derived; a key is shown below the graph.
Figure 1B shows PCA of the cell lines alone. Lines obtained from a similar tissue type (identified in the figure by spots of the same color) tend to be loosely clustered, but there is a substantial intermingling of lines derived from different tissue types. D20-c2 and D20-c5, sibling clones from a single original antennal disc line, are tightly clustered, but S2R+ and S2-DRSC, two isolates of the original Schneider's line 2, are not. Overall, the lines are remarkably independent of each other, and multiple lines made in the same way from the same tissue type generally have quite distinct characters. Similar results were obtained with hierarchical clustering (data not shown); we chose to present the PCA to emphasize that the cell lines are not related in any hierarchical way.
At first glance, the results shown in Figure 1, A and B, seem contradictory; in fact they reveal different aspects of the cell line gene expression patterns. Each PCA calculation made use of a set of genes that varies among the samples included (see Methods); thus, different gene sets were used for the two panels. Panel A reveals that the cell lines express a “core” of common genes (i.e., the set of 3109 genes expressed in all the lines) and that the lines cannot be distinguished on the basis of those genes that most prominently distinguish the various developmental stages of whole organisms. The latter group presumably includes markers for fat body, muscle, gut, epidermis, and other major differentiated tissues. Panel B excludes, by design, those genes common to all the lines so that they are compared inter se, revealing the unique characters of the individual lines. In short, the PCA patterns reflect the fact that each line expresses 3109 core genes and (on average) 2776 other genes that are, to varying extents, cell line specific. Moreover, cell lines derived from the same tissues are not tightly clustered but are individual. Examination of the 3109 core genes reveals a highly significant (P < 10−20) overrepresentation of Gene Ontology (GO) terms associated with a wide variety of basic cellular functions, such as ribosomes, lipid particles, transport, endocytosis, post-translational protein modification, nucleic acid metabolism, and cytoskeleton. This observation suggests that the core genes expressed in all cell lines are those required to make cellular components common to all cell types.
Diversity of gene expression in individual lines
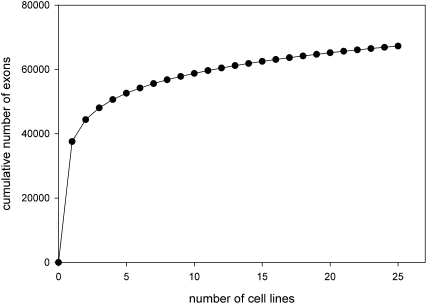
We reported above that all 25 cell lines express a common set of 3109 genes. Each line expresses, in addition, an average of 2776 “facultative” genes (range, 2289–3112) that are not universal but may be shared with one or more other lines. These facultative gene sets are highly idiosyncratic; as noted previously, most (64%) annotated genes probed are expressed in at least one line. Despite the large collection of cell lines examined here, each incremental line led to the detection of additional expressed genes (see Fig. 5).
Figure 5.
Detection of known exons as a function of the cell lines studied. The number of annotated exons with detectable expression (score ≥ 200) in at least one cell line was computed as a function of the number of cell lines included in the calculation. The calculation was repeated 1000 times using randomly permuted orders for the addition of cell lines.
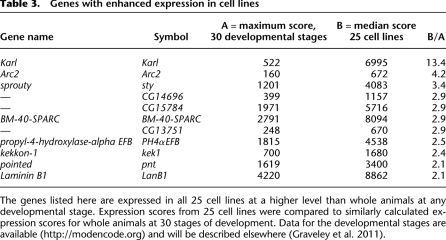
Some genes are expressed in all 25 lines at a level that far exceeds their expression in whole animals at any developmental stage. Table 3 lists the most extreme examples. Because these genes are expressed in all the lines, they are unlikely to represent the enrichment of a particular expression pattern in a homogeneous population. More likely, their expression reflects adaptation to growth in culture.
Table 3.
Genes with enhanced expression in cell lines
The genes listed here are expressed in all 25 cell lines at a higher level than whole animals at any developmental stage. Expression scores from 25 cell lines were compared to similarly calculated expression scores for whole animals at 30 stages of development. Data for the developmental stages are available (http://modencode.org) and will be described elsewhere (Graveley et al. 2011).
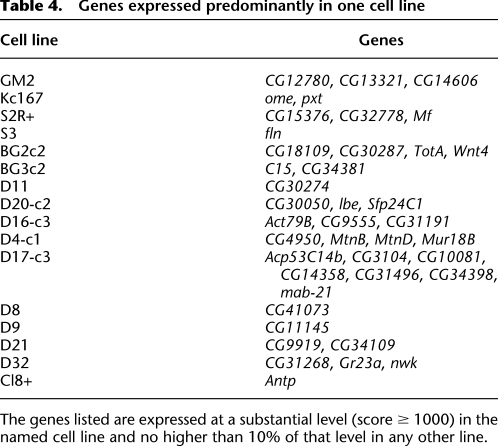
In contrast, Table 4 lists 41 genes whose substantial expression is confined to a single cell line. For the genes recorded here, expression in the indicated line is substantial (score ≥ 1000) and is at least 10-fold higher than in any other line. Table 4 includes 23 examples of relatively uncharacterized genes known only by their “CG” designations. For 36 of the 41 of the genes in the table and 22 of 23 of the CG genes, this specialized, line-specific expression also exceeds the gene's expression in whole animals at any developmental stage. That these genes are specific to single lines is consistent with the idea that the line in question represents in pure population a cell type that is relatively rare in whole animals (Chintapalli et al. 2007). That CG genes are overrepresented in this class is consistent with the notion that many poorly characterized genes are expressed in only a few cells of the animal.
Table 4.
Genes expressed predominantly in one cell line
The genes listed are expressed at a substantial level (score ≥ 1000) in the named cell line and no higher than 10% of that level in any other line.
Signaling pathways
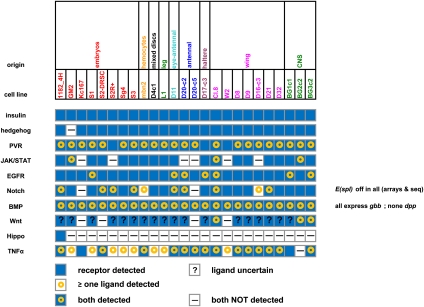
We analyzed the expression in the various cell lines of 10 signaling pathways: Insulin, PVR, EGFR, JAK/STAT, Wnt, TGF-beta/BMP, Hedgehog (Hh), TNF-alpha, Hippo, and Notch. In each case, we examined the expression levels of the known ligands as well as the cytoplasmic transducers and the main transcription factors that are regulated by the pathways (Supplemental Table S5). In general, ligands and receptors (but not cytoplasmic and transcription factor/DNA components) show differential expression among the cell lines. The expression patterns of ligands and receptors, shown in Figure 2, suggest that in most of the cell lines, the insulin signaling is low, EGFR is off, PVR is on, JAK/STAT is low, Hh is off, Wg is off, Hippo is off, TGF-beta/BMP is off or low, Notch is off, and TNF-alpha is on.
Figure 2.
Expression of key signaling pathways in the 25 cell lines. Summary data are shown for 10 pathways, indicating the expression of known ligands and receptors for each pathway in each cell line; for a more complete description, see text. Cell lines are color-coded according to the tissue origin, which is shown above.
Insulin-like receptor RNA is present at substantial levels in all 25 lines, but RNAs for its ligands are below detection limits. This observation is consistent with the fact that the cell lines are sensitive to exogenous insulin; all of the imaginal disc and CNS lines require exogenous insulin for growth, and the growth of embryonic lines is inhibited by exogenous insulin.
Similarly, though most cell lines express at least one Hh receptor, none show detectable expression of the ligand; hence we predict that most of the lines that express Ci might respond to exogenous Hh, but this important developmental pathway is not constitutively active in any line. PVR, which encodes a PDGF/VEGFR receptor tyrosine kinase that plays an essential role in cell survival, is highly expressed in all 25 lines, and transcripts for its ligands, especially PVF2, are found in most if not all of the lines. The JAK/STAT pathway is most likely active in only a few cell lines (the CNS line BG2-c2, the wing disc line Cl.8, and the embryonic line GM2), where both the receptor dome and the ligand upd3 are clearly expressed. Similarly, the EGFR pathway appears to be active in some cell lines; in this case, all the cell lines express one or more ligands, but only a few express the receptor. The Notch pathways, which in many developmental contexts are associated with cell differentiation, appear to be inactive in all cell lines. Notch signaling is most likely turned off as suggested by the lack of expression of E(spl), a transcriptional target whose presence can be considered diagnostic of the pathway's activation; in this case, most cells express the receptor gene Notch, but apparently the low level of expression of the ligand genes Delta or Serrate in a few cell lines is not sufficient to activate Notch signaling.
The cases of the TGF-beta/BMP and Wnt pathways are not as clear. While dpp RNA is undetectable, gbb, which encodes another TGF-beta/BMP ligand, is expressed at high level. If Gbb in the absence of Dpp can form productive homodimers, it potentially could activate the Smad pathway since the receptors are present. Expression of Dad, a transcriptional target of Smad, does not allow us to definitely conclude whether the pathway is activated as Dad is expressed at variable levels in the cell lines.
The tiling arrays detected little if any expression of genes encoding Wg and the other Wnt ligands in most lines; the single exception is Wnt4 in the CNS line BG2-c2. However, RNA-seq data for BG3-c2 and Cl.8 indicate significant expression of Wnt2, Wnt4, and Wnt5 in BG3-c2 and of Wnt5 in Cl.8. We infer that these transcripts are detected with poor efficiency in the tiling arrays; therefore, the expression of Wnt ligands is unknown for most of the lines. Of all of the ligand and receptor genes included in this analysis, the Wnt ligands are the only ones in which the microarray results were substantially different from the RNA-seq results; although we do not know the reason for this discrepancy, the nkd expression pattern described below suggests that the RNA-seq result is the more accurate one for the Wnt genes, Genes encoding the two well-defined Wnt pathway receptors (fzi and fz2) are expressed in only some of the cell lines, but other predicted receptors are also expressed in some of the lines. The expression of naked cuticle, a transcriptional target of Wg signaling that acts in a negative feedback loop, is low in most cell lines, consistent with little or no Wnt signaling in these lines. However, nkd is strongly expressed in three lines (the wing disc lines Cl.8 and D9 and the CNS line BG3-c2); thus, it is possible that nkd expression can be taken as a good indicator of Wnt signaling where information about the expression of Wnt ligands is inadequate.
The Hippo pathway, implicated in contact inhibition in tissues, is most likely off, as transcripts for the ligand and receptor, Dachsous and Fat, respectively, are not expressed. Finally, TNF-alpha signaling, regulated by binding of the Eiger ligand to the Wengen receptor, is most likely on as RNAs encoding both components are expressed at high level, as are RNAs for JNK pathway components that are regulated by Eiger.
Transcription factors
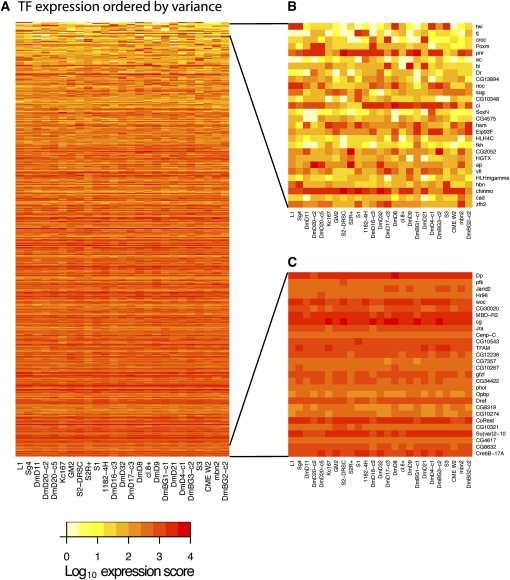
We examined the expression of transcription factors in the cell lines, restricting our analysis to 711 site-specific transcription factors with characterized DNA-binding domains (A Hammonds and S Celniker, unpubl.). Of these, 228 are not expressed in the cell lines. For the remaining 483 factors, there is a wide diversity in levels of expression and variation among lines (Fig. 3). Figure 3B illustrates the expression levels for the 28 transcription factors that vary most among the cell lines; in it, no two lines share the same signature (though the sibling clones DmD20-c2 and DmD20-c5 are very similar). Figure 3C shows expression levels for the 28 least variable transcription factors: for these, expression is generally higher, and the lines may be seen to have much in common.
Figure 3.
Expression of transcription factors in 25 cell lines. The heat map indicates log10(expression score) for the genes indicated and for all 25 cell lines. The color key is shown below. (A) All 483 transcription factor genes detected in the cell lines. (B) The 28 transcription factor genes whose expression is most variable among the cell lines. (C) The 28 transcription factor genes exhibiting the least variation among the lines.
Spatial mapping and cell type markers
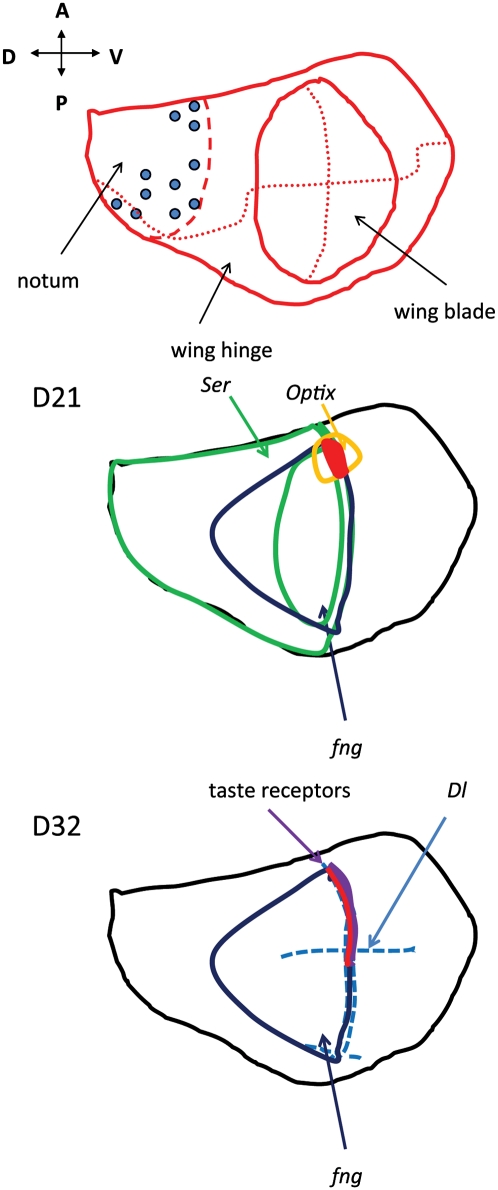
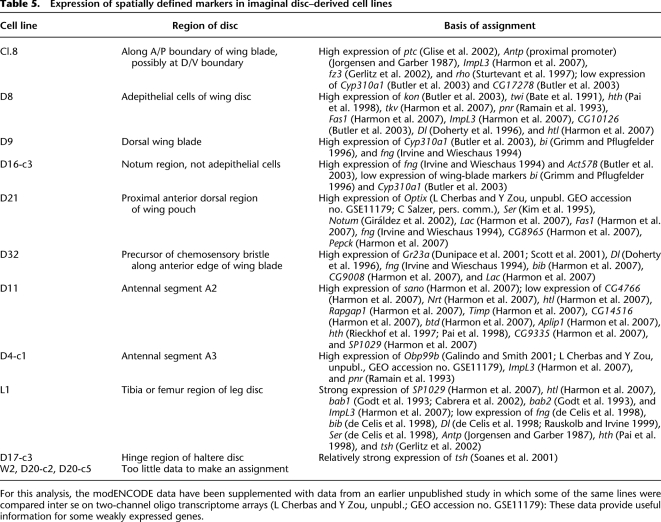
As illustrated in Figure 1B, there is substantial diversity in the properties of even those lines derived from a single tissue type. For the imaginal disc–derived lines, there is considerable variation in genes known to be expressed in spatially defined patterns in the discs themselves. We therefore asked whether the genes expressed in each disc-derived line are consistent with the known spatial maps. It is remarkable that for 10 of the 13 imaginal disc–derived lines we were able to map each line to a specific region of the disc; for the other three lines insufficient marker data were available. We have observed neither spatial inconsistencies nor examples of incorrect coexpression of genes whose spatial positions have been studied. The logic is illustrated in Figure 4 using part of the evidence for two cell lines. Superimposed on representations of the fate map of the Drosophila wing disc, these cartoons illustrate the known expression domains for particular genes expressed in the lines. The middle panel describes the line D21, which expresses Optix, fng, and Ser. Known expression domains for these genes are indicated; the intersection of those domains suggests that D21 originates from—or mimics—cells in the small region indicated in red. Similarly the bottom panel describes the line D32. It strongly expresses the taste receptor Gr23a, as well as Dl and fng. By the logic described above, we locate the origin of D32 cells somewhere along the red line, just dorsal to the dorsal/ventral (D/V) boundary within the anterior compartment. The complete evidence for these and the other imaginal disc–derived lines is given in Table 5.
Figure 4.
Examples of spatial assignments of two wing disc lines, illustrating the logic used to make these assignments. The examples shown in these cartoons are a few of the genes used to assign spatial identity to cell lines; a more complete list can be found in Table 3. The top panel shows a fate map of a Drosophila wing disc (based on a figure from (Held 2002). The middle panel illustrates the sites of expression of three genes expressed in line D21: Optix expression is confined to a small area of the prospective wing blade, straddling the dorsal/ventral (D/V) boundary near the proximal portion of the anterior wing blade (outlined in yellow). fng is a marker for the dorsal compartment in the wing blade and part of the hinge and notal regions (dark blue). Ser is expressed widely in the dorsal compartment, but in the wing blade region, it is confined to the region just on the dorsal side of the D/V boundary (green). Line D21 therefore has expression properties suggesting an origin in the small region colored red. The bottom panel illustrates the sites of expression of three genes expressed in line D32. Gr23a is expressed strongly in this line; taste receptors in the adult (presumably including Gr23a) are confined to the anterior margin of the wing blade, derived from the region of the D/V boundary within the anterior compartment (thick purple line). Dl is expressed in a line of cells on each side of the D/V boundary (dashed blue lines). fng, as described above, is a marker for the dorsal compartment in the wing blade region (dark blue). The region whose expression resembles D32 therefore is somewhere along the red line, just dorsal to the D/V boundary within the anterior compartment.
Table 5.
Expression of spatially defined markers in imaginal disc–derived cell lines
For this analysis, the modENCODE data have been supplemented with data from an earlier unpublished study in which some of the same lines were compared inter se on two-channel oligo transcriptome arrays (L Cherbas and Y Zou, unpubl.; GEO accession no. GSE11179): These data provide useful information for some weakly expressed genes.
Some of the embryonic lines express genes suggestive of hemocyte or hematopoietic origin. In what follows, we will summarize data from three embryonic lines, Kc, S2-DRSC, and S2R+, and the tumorous blood cell line mbn2; we chose to concentrate on these four lines because they are widely used, and the tiling array data are supported by RNA-seq data for the first two. In Drosophila, three classes of hemocytes arise from a common precursor by divergent pathways: crystal cells plasmatocytes (and closely related macrophages) and lamellocytes. Kc cells (including the line Kc167), which have been previously reported to have hemocyte properties (Andres and Cherbas 1992), express the plasmatocyte marker Pxn as well as ush, whose expression inhibits crystal cell differentiation (Fossett et al. 2001) and more general hemocyte markers, including Hml (Charroux and Royet 2009) and He (Lebestky et al. 2000; Jung et al. 2005; Jacques et al. 2009). None of these genes are entirely specific for hemocytes, as illustrated by their expression in other cell lines and by tissue expression data from FlyAtlas (Chintapalli et al. 2007), but taken together, they suggest a plasmatocyte identity for Kc167 cells. S2-DRSC and S2R+, two isolates of Schneider's line 2, both express hemocyte markers but are quite distinct. Like Kc167, S2R+ and the tumorous blood cell line mbn2 express Pxn, Hml, and He. In contrast, S2-DRSC expresses a high level of proPO-A1 (formerly Bc) and a detectable level of lz, both associated with crystal cells and not with plasmatocytes (Jung et al. 2005; Jacques et al. 2009); it also expresses a very high level of the plasmatocyte marker Pxn along with ush, an inhibitor of crystal cell differentiation. Thus, S2-DRSC combines properties of plasmatocytes and crystal cells; our data do not permit us to determine whether individual cells express both plasmatocyte markers and crystal cell markers, but we think it likely that this line contains a mixture of cell types. It is also worth noting that all of these lines have been grown extensively and that different isolates of both Kc and S2 are known to display quite variable levels of some critical hemocyte markers (see Supplemental Text). Thus, at least under the conditions in which these lines have been grown, the cell type identity of these hemocyte-like embryonic lines seems to be somewhat plastic.
The three CNS lines that we examined are quite distinct in their transcriptional properties. Unfortunately, there are not sufficient data available concerning gene expression in the cells of the L3 central nervous system (from which they were derived) to support any attempt at spatial mapping.
Unannotated transcripts
Using a large number of cell lines has proven to be a good way of detecting the expression of known transcripts. Figure 5 shows that, for known exons, our analysis appears to be approaching saturation with 25 lines.
A principal goal of the modENCODE project is to go beyond the annotations and identify previously unannotated transcripts in Drosophila. A more definitive effort is being published separately (Graveley et al. 2011); this study draws on developmental data and supplements tiling array data with copious RNA-seq data. Nonetheless, the tiling array analysis of 25 cell lines can fruitfully be examined for clues to the existence of novel transcribed regions. Examination of the raw tiling array signal graphs shows considerable signal originating from regions outside the known annotations; for example, in Kc cells 81% of the total euchromatic signal coincides with annotated transcripts, while the remaining 19% originates from probes that lie outside those regions. In what follows, we offer an initial description of transcripts in these unannotated regions. Since our purpose here is simply to alert readers to the prevalence of unannotated signals, we have deliberately chosen a conservative approach that underestimates novelty.
Transcribed fragments (transfrags) were defined from tiling array signal data for all 25 cell lines and from 30 developmental stages. Using FlyBase (v. 5.12) as a standard, we classified each transfrag as a match to an annotation (i.e., encompassed by it), a partial overlap, or novel (i.e., disjoint). The novel euchromatic transfrags derived from all 55 RNA sources were assembled into 85,413 contigs. For each novel contig, we assigned an expression score for each RNA source (Supplemental Table S6).
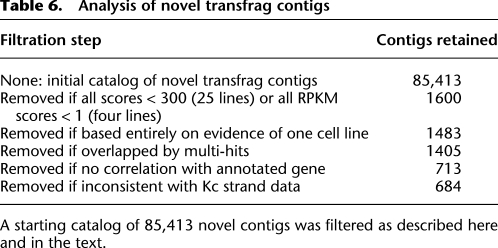
We filtered these contigs as shown in Table 6. The large majority of novel contigs have low scores, less than the threshold of 300 that we have used as a cut-off for detectable expression. Pending further study, we eliminated low scoring contigs to reduce the candidate set to 1600. On similarly conservative grounds, we removed contigs supported only by expression in a single cell line since rearrangement and transposon-induced artifacts are known to occur in the lines (Potter et al. 1979; Junakovic et al. 1988; Maisonhaute et al. 2007), and we removed contigs rendered ambiguous by multi-hit mappings in RNA-seq analyses, because of their potential for cross-hybridization. The remaining 1405 contigs (described in Supplemental Table S7) can be considered a conservative estimate of well-supported novel contigs.
Table 6.
Analysis of novel transfrag contigs
A starting catalog of 85,413 novel contigs was filtered as described here and in the text.
Among these novel transcribed regions, we anticipated that many might represent unknown exons of known genes. To find that subset, we calculated the Pearson correlation coefficient, over all 55 RNA sources (25 cell lines and 30 developmental stages), between each novel contig and each feature (known exon or novel contig) within a 200-kb region centered on the novel contig. A threshold correlation coefficient of 0.75 gave a 1% false discovery rate, estimated from a parallel correlation analysis of annotated exons alone. Seven-hundred-thirteen contigs (51%) showed correlations with at least one annotated exon; none showed correlations with exons from more than one annotated gene. Strand-specific RNA-seq data from Kc cells showed 453 of these contigs to be transcribed on the same strand as the correlated annotated gene; 29, on the opposite strand. The remaining contigs gave either no strand data or ambiguous data. This remarkable asymmetry suggests that the vast majority of correlations arise because of molecular contiguity rather than coregulation. We conclude that at least 684 of the novel contigs are good candidates for novel exons of known genes.
Of these 684 putative “extensions,” 122 are located 5′ of, 238 3′ of, and 324 internal to the correlated gene. The frequency of novel internal exons may be exaggerated, since some of the internal contigs probably result from incompletely processed transcripts rather than alternative exons. The mean distance between novel contigs and their correlated genes was 16,208 bp for 5′ contigs and 6496 bp for 3′ contigs.
We sought support for these inferences from four sources: (1) We searched a more recent annotation of the genome (FlyBase v.5.23) for annotated transcripts that included sequences from both the contig and the correlated gene. (2) We searched sequences from full-length cDNAs in the BDGP (http://www.fruitfly.org), (Stapleton et al. 2002) for overlaps with both contigs and their correlated genes. (3) We searched paired-end sequence data from four cell lines for which these data were available, seeking mate-pairs in which one sequence is contained in the contig and its mate is contained in an exon of the correlated gene, or sets of overlapping mate-pairs span the space between the contig and the correlated gene. (4) We looked for annotated transcripts in MB8 (MJ van Baren, L Langton, CL Comstock, BC Koebbe, and MR Bren, unpubl.; http://www.modencode.org/), a working annotation of the Drosophila genome that incorporates cDNA sequence data from the BDGP and novel splice junctions deduced from the modENCODE RNA-seq data.
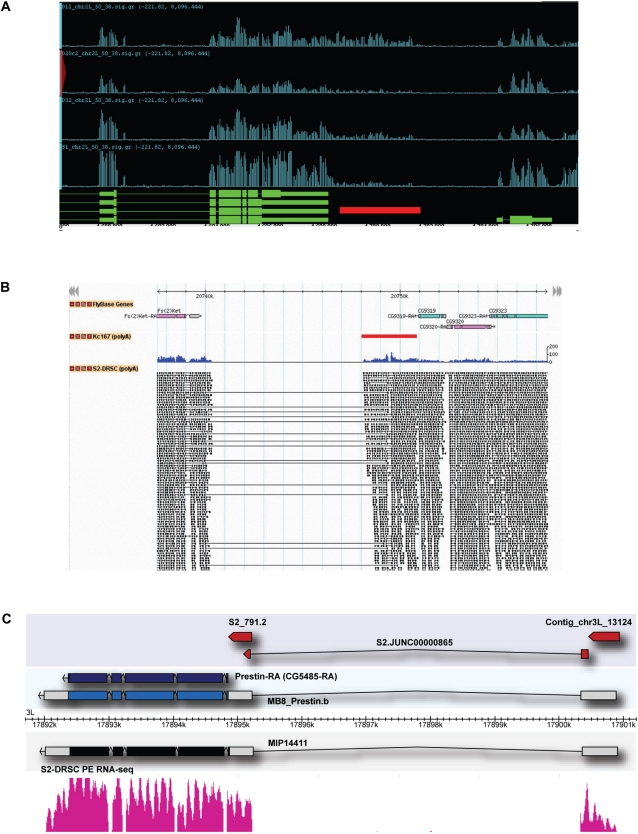
Remarkably, 426 (62%) of the 684 contig–gene associations are supported by at least one of these sources, and only 43 (6%) of the contigs were associated instead with a gene other than the one identified by correlation analysis. Supplemental Table S7 details the support for each prediction, and Figure 6 shows a few examples. Figure 6A illustrates the evidence for a 3′ extension of the known gene chinmo; Figure 6B documents a novel 3′ exon for Fs(2)Ket; and Figure 6C shows a new gene model for Prestin, fully supported by cDNA evidence, which provides previously undefined untranslated regions (UTRs), including extensions of the previously annotated 5′ and 3′ exons and the addition of a novel 5′ exon. As shown in Supplemental Table S7, an additional 70 novel contig sequences were found in full-length cDNA sequences from the BDGP. Of these, 11 appear to be functional transcripts from previously unannotated genes, 14 appear to be short, nonfunctional transcripts, and the remainder are novel transcripts from known genes for which the correlation was below our threshold of 0.75. We emphasize that these models are offered only as suggestions of previously unknown transcripts from annotated genes; a much larger list of new transcripts, with support of RNA sequencing data, will be presented in another paper (Graveley et al. 2011).
Figure 6.
Examples of new UTRs revealed by novel contigs. (A) Novel contig whose expression is correlated with that of chinmo. The region illustrated includes the 3′ portion of the annotated chinmo gene and all of its downstream neighbor, cpb. Signal graphs for the transcripts are shown for eight cell lines. (Red bar) The position of the novel contig; a region of continuously overlapping paired-end sequences (blue line) connects the novel contig to chinmo. (B) Novel contig that appears to encode a novel 3′ exon for Fs(2)Ket. The display is similar to panel A, showing the convergently transcribed genes Fs(2)Ket and CG9310. Much of the region between the two genes is covered by a transposable element and is therefore masked from both tiling array and RNA-seq analysis. However, paired-end RNA-seq showed multiple clones in all four of the lines that were analyzed in which one end lies in the 3′ region of the annotated Fs(2)Ket transcript and the other end lies in the novel contig 7 kb away; the dashed blue line indicates the region that is bridged by these clones. The novel contig also contains overlapping paired-end clones that extend into the annotated CG9310 transcript. These data indicate that the contig probably corresponds to novel overlapping 3′ regions from the two genes. (C) A contig that corresponds to a novel 5′ exon for Prestin, a gene for which only the coding region was previously annotated. (From top to bottom) The novel contig (red bar); a novel splice junction identified from RNA-seq data from S2-DRSC RNA; the FlyBase v5.12 annotation for Prestin, which includes only the coding region (purple); a Prestin transcript from the unpublished annotation MB8 (MJ van Baren, L Langton, CL Comstock, BC Koebbe, and MR Brent, unpubl.; http://www.modencode.org/), which used the RNA-seq splicing data as input for the annotation (blue and white); sequence of a full-length cDNA clone MIP14411 (GenBank accession no. BT120083) retrieved by targeting with the FB 5.12 gene model; and pattern of transcripts from RNA-seq analysis of S2-DRSC cells.
Discussion
The data described here provide the first general assessment of the transcriptomes of a diverse collection of publicly available Drosophila cell lines. They furnish a catalog of the expression of most known (annotated) genes and support a preliminary look at the scope and implications of unannotated transcription. At a practical level, the catalog should prove invaluable to those contemplating experiments using cell lines. Whether the experiment be designed to examine a normal biological process or to examine the effects of introducing exogenous genes or RNAi, the selection of an appropriate line will be aided by foreknowledge of these transcriptomes.
Our preliminary analysis of novel transcription suggests that, even when the threshold of significance is set quite high, regions of previously unannotated transcription are frequent. We have identified 1405 strong candidates (Supplemental Table S7). Correlation has been used previously to identify connections between novel signals and known annotations (Manak et al. 2006), and we have confirmed its power, by connecting 684 candidates to known genes, often as new 5′ or 3′ UTRs. Again we emphasize the practical implication that those studying particular genes and their regulation may wish to consult Supplemental Table S6 and the original signal graph files available at http://modencode.org to discern whether transcription in the region of interest is complicated by unannotated signals and to select cell lines in which those signals are present (or absent).
Of greatest interest here are the insights that transcriptome analysis provides into the biology of the Drosophila cell lines. Both simple tabulation and PCA (Fig. 1) lead us to divide each line's expression into a core component (3109 genes expressed in all the lines) and line-specific component (on average, 2776 genes). It is important to recognize that, because our analysis does not distinguish alternative transcripts, the actual numbers of core and line-specific transcript species (as opposed to genes) may be different.
Both core and line-specific gene expression will undoubtedly repay further, more detailed study. We know that many key metabolic pathways are represented, but we do not yet know whether the core is a close replica of core expression in all Drosophila cells or whether, alternatively, it is greatly modified by the adaptation to growth in cell culture. Most cell lines appear to be competent to respond to insulin, hedgehog, and BMP signals (Fig. 2). In the case of insulin, this is a gratifying confirmation of prior biological observations: All the cell lines are known to be either positively or negatively sensitive to insulin. The expression of other signaling pathways appears to vary more among lines. Despite variations among lines, this survey suggests a common and expected trend in all the cell lines, namely, that most differentiation pathways are off and that survival and growth pathways are on.
Some genes are expressed at especially high levels in all the cell lines (Table 3), and it seems likely that their heightened expression does represent adaptation. The extremely high expression of Karl strikes us as especially interesting. Karl, like its cognate NLAZ, is thought to be a secreted lipocalin that modulates insulin signaling (Hull-Thompson et al. 2009), and it is attractive to hypothesize that secreted Karl protein plays an important role in “conditioning” cell culture media and modulating insulin signaling. Among the other examples in Table 3, the joint overexpression of sprouty and pointed is of interest because these two genes are known to interact in the formation of cell processes.
The converse picture—the individuality of the cell lines—is more striking. It is evident in the PCA representation (Fig. 1B), in the examples of genes that are expressed predominantly in a single line (Table 4), and in the line-specific expression of the cuticle protein genes. Indeed, the little-studied genes (“CG genes”) included in Table 4 are generally more strongly expressed in a single cell line than in whole animals at any developmental stage. As we have suggested above, this observation supports the notion that each cell line provides a strongly enriched source of a single cell type, often a type that is represented by few cells in the intact animal.
The S2 cell line has had a long history in Drosophila laboratories, starting from its casual use as a source of carrier RNAs. During the course of that history, a variety of isolates have been labeled “S2.” Here we have studied three S2 isolates: S2-DRSC (currently used at the Drosophila RNAi Screening Center), S2R+, and Sg4. As shown in Figure 1B, the three lines do not form a coherent cluster; users of S2-derived lines should be careful to specify the history of their cells. We also find, as did a previous publication based on transcriptome arrays (Neal et al. 2003), that the expression patterns of S2 cells and Kc167 cells are quite distinct.
It is possible that some of the differences among lines are caused by instances of segmental aneuploidy in these cultured cells. This merits further study, but we think it unlikely to be a major determinant, because of prior results (Zhang et al. 2010) showing compensation in expression level per gene copy adjusting for aneuploidy, and also because of the biological coherence of the patterns we observe especially in imaginal disc–derived lines.
Indeed, the most striking evidence for the individuality of the lines is provided by the spatial mappings illustrated in Figure 4 and cataloged in Table 5. While none of the cell lines can be described as “normal”—they have, after all, undergone transformation to immortal growth and are adapted to growth in culture—it is remarkable that each imaginal disc–derived line shows a marked resemblance to a small, specific territory within the disc from which it is derived and that these spatial assignments are different for each disc line. Similarly, the lines that appear to be derived from hematopoietic cells express gene sets that are generally consistent with that origin.
While it is possible that these remarkable expression patterns reveal some secondary process of transdetermination that leads individual lines to mimic normal patterns, it seems far more likely that the patterns we observe reflect the origins of the cells. We infer that individual lines arose from particular founder cells within the diverse populations in the starting cultures and that the lines now provide us with representations, undoubtedly attenuated by adaptation to cell culture, of those founder cells. If this is so these observations suggest remarkable stability of even fine-grained spatial determination. While genomic analyses of mammalian tumor-derived cell lines (e.g. Wang et al. 2006) have confirmed that the cells often retain global similarities to their tissues of origin, those studies have not pursued the cell-by-cell distinctions made possible here by comparison to a large developmental literature on imaginal discs.
Finally we wish to point out that each cell line expresses a different sample of transcription factors: No pair of lines is identical in the data shown in Figure 3, and no two lines are identical when the data are reanalyzed to emphasize only highly significant differences in expression. Thus, although 25 cell lines may be an ample set for discovering transcripts (Fig. 5), we see no evidence that this set of 25 lines is approaching saturation for developmental “states.” For the systems biologist, each Drosophila cell line appears to provide a distinct developmental laboratory.
Methods
Cell culture
The 25 cell lines used in this study are listed in Table 1; all were obtained from the collection of the Drosophila Genomics Resource Center (https://dgrc.cgb.indiana.edu/). The collection includes lines made from embryos and the following tissues from mature larvae: central nervous system, wing disc, antennal disc, leg disc, haltere disc, and tumorous blood cells. Cells were maintained between ∼2 × 10⁶ and 1 × 10⁷ cells/mL and were harvested at about 5 × 10⁶ cells/mL; for the media in which they were grown, see Supplemental Table S1. In all cases, the full history of the cell lines is unknown, but in general, the imaginal disc and central nervous system lines have been subject to much shorter periods of growth in culture since their establishment than have the embryonic lines.
RNA isolation
RNA was made from five to 10 plates of cells at ∼5 × 10⁶/mL (10 mL/plate) collected by centrifugation (∼1000g, 5 min) and washed in 5 mL Drosophila phosphate-buffered saline (2.7 mM KCl, 4.3 mM Na2HPO4, 1.8 mM KH2PO4, 137 mM NaCl at pH 7.2). After centrifugation, the pellet was resuspended in 0.75 mL TRIzol reagent (Invitrogen), and RNA was extracted according to the manufacturer's directions and dissolved in DNase/RNase-free water (Invitrogen), and the concentration determined by absorbance, using a Nanodrop ND-1000 spectrophotometer. The RNA was then purified on an RNeasy spin column (Qiagen), according to the manufacturer's instructions, including DNase treatment and the optional second wash on the column. The RNA was eluted using DNase/RNase-free water, and the concentration was determined as described above. The quality of each RNA sample was confirmed by Northern blots, using the Ambion NorthernMax-Gly, BrightStar Psoralen-Biotin, and BrightStar BioDetect kits, according to the manufacturer's instructions. Each Northern lane contained about 5 μg of total RNA, and the probe was made from the sequence of transcript RpL11-RA. All RNA samples were stored at −80°C and, when necessary, were shipped on dry ice, using an overnight delivery service.
RNA expression measured on tiling arrays
RNA samples were prepared from three biological replicates representing each cell line. Each was independently hybridized on 38-bp Affymetrix arrays (Affymetrix GeneChip Drosophila Tiling 2.0R Array), using standard procedures (Manak et al. 2006). Raw signals from the replicates were combined and smoothed using a three-probe sliding window (bandwidth = 50), with the intensity of each probe calculated as its background-corrected pseudomedian. The resulting “signal graph” files giving signal intensity as a function of genomic position are available at http://modencode.org. From the signal graphs, the transfrags were identified using a threshold of three consecutive probes above background (maxgap = 90, minrun = 90). We compared transfrag coordinates with annotations from FlyBase (v5.12) and the unpublished annotation MB6 (MJ van Baren, L Langton, CL Comstock, BC Koebbe, and MR Brent, unpubl.) and classified each transfrag as being either a match to an annotation, a partial overlap with an annotation, or a novel transfrag.
To calculate expression scores, we used signal graph files calculated as above but with bandwidth = 0. Expression scores for both annotated exons and novel transfrags are simply the medians of probe intensities for all probes found within that feature. Negative signal scores were set to zero. Total raw signal varied among cell lines; consequently, we normalized the exon scores for each cell line, setting the median to 100. A gene's expression score (“gene score”) is simply the maximum score for all exons included in that gene. Note that both alternative splicing and overlapping genes complicate the interpretation of these scores.
We took exon expression scores less than a threshold (300) to be insignificant. The threshold was chosen by qualitative examination of the signal graph traces and by analyzing the correlations between tiling array scores and RNA-seq scores (for the four cell lines for which both kinds of data were available) and the correlations between exons of annotated genes. Both kinds of correlation improve with increasing threshold, but thresholds in excess of 300 exclude thousands of exons that, on the evidence of the signal graphs, exhibit unambiguous peaks. Supplemental Figure S1 shows the correlation between tiling array scores and RNA-seq reads per kilobase per million (RPKM) values for 17,623 exons expressed above threshold in Kc167 cells. Supplemental Table S4 illustrates the same point by showing the average (and range) of both tiling array and RNA-seq scores for 85 ribosomal protein genes. For these scores, the Pearson correlation coefficient is 0.713.
Exon scores are not adjusted for length of probed segment (exon); nor are we able to make any adjustment for hybridization efficiency. Therefore, they cannot and should not be interpreted as numbers of molecules. It is informative to compare the score for a given exon across samples; it is only suggestive to compare scores between exons. Supplemental Figure S2 shows that the agreement between the techniques is improved when one considers only the ratios between scores in two cell lines (for a given exon); the excess of deviations above the regression line suggests that RNA-seq scores have a greater range of linearity.
RNA expression measured by sequencing
Libraries were generated using the mRNA-seq preparation kit as recommended by the manufacturer (Illumina). Briefly, 10 μg of total RNA was enriched for poly(A)+ RNA by two successive rounds of oligo(dT) selection. The poly(A)+ RNA was then fragmented, and first-strand cDNA synthesis was performed using random hexamer priming. Following second-strand cDNA synthesis, the ends were cleaned up, a nontemplated 3′ A was added, and adapters were ligated to the ends. The libraries were enriched by 16 rounds of PCR and gel purified. The libraries were used for paired-end sequencing on an Illumina GAIIx, and 37 nucleotides were sequenced from each end. Following sequencing, the fastq files were aligned using Bowtie to a combined index consisting of the D. melanogaster genome sequence and a database of annotated and predicted splice junctions (Brooks et al. 2010). Reads that aligned uniquely with up to two mismatches were kept for further analysis. Aligned data were used to calculate quantitative RPKM scores as described (Mortazavi et al. 2008).
For stranded RNA-seq, 10 μg of DNase-treated poly(A)+ RNA from Kc167 cells was subjected to limited hydrolysis followed by end-repair using shrimp alkaline phosphatase, then T4 polynucleotide kinase. The RNA was then treated with tobacco acid pyrophosphatase to make the capped ends clonable. The fragmented RNAs were then cloned as processed as described previously (Affymetrix/Cold Spring Harbor Laboratory ENCODE Transcriptome Project 2009).
Clustering expression data
Cell lines were clustered using PCA, on the basis of expression scores from 886 genes. The list of genes was chosen by filtering out genes without a measurable level of expression in at least one cell line and genes that displayed little variation in expression among cell lines. The parameters for choosing the gene set were as follows: minimum expression of 500 in at least one cell line, [maximum − minimum] score > 2000, and [maximum/minimum] score > 10. The expression scores for this gene set were analyzed using PCA. Expression scores were log-transformed, centered (column-mean subtracted), and scaled (column divided by root mean square), and singular value decomposition was used to calculate loadings and scores. For visualization, we used the score loadings of the variables (cell lines) from the first three components, which together explain 70% of variance. An identical procedure was used for PCA of expression scores from the combined set of 25 cell lines and 30 developmental stages.
Acknowledgments
We thank the modENCODE Data Coordination Center (DCC) for data submissions. We thank all of the members of the modENCODE Drosophila Transcriptome Group for helpful discussion, and particularly thank Brian Oliver and Delphine Fagegaltier for critical reading of the manuscript. Shujie Xiao, Kenneth H. Wan, Charles L. Comstock, Brian C. Koebbe, and Randall Brown contributed to the experiments and analysis reported here. This work was funded by an award from the National Human Genome Research Institute modENCODE Project (U01 HG004271) to S.E.C., under Department of Energy contract no. DE-AC02-05CH11231.
Author contributions: M.B., R.H., T.C.K., J.A, B.G., N.P., S.E.C., T.G, and P.C. conceived and directed the study; A.W., D.Z., L.Y, P.K., J. D., J.R., C.A.D., K.B., and L.L. collected and assembled the data; L.C., Y.Z., B.E., J.W.C., J.M.L., A.S., J.-H.C., H.T, M.J.vanB., S.G., A.D., and W.L. analyzed and interpreted the data; M.O.D., A.E.T. and C.Z. provided reagents, materials, and/or analysis tools; and L.C. and P.C. wrote the paper.
Footnotes
[Supplemental material is available for this article. The data from this study have been submitted to the NCBI Gene Expression Omnibus (http://www.ncbi.nlm.nih.gov/geo) under accession nos. GSE15596, GSE16269–GSE16290, GSE16321–GSE16322, GSE16325, and GSE18040. All of the microarray data, RNA-seq data, and expression scores for genes and exons are available from the Data Coordination Center of modENCODE (http://modencode.org), and much of the data are also available from the Drosophila Genomic Resources Center (https://dgrc.cgb.indiana.edu/) and FlyBase (http://flybase.org/).]
Article published online before print. Article, supplemental material, and publication date are at http://www.genome.org/cgi/doi/10.1101/gr.112961.110.
References
- Affymetrix/Cold Spring Harbor Laboratory ENCODE Transcriptome Project 2009. Post-transcriptional processing generates a diversity of 5′-modified long and short RNAs. Nature 457: 1028–1032 [DOI] [PMC free article] [PubMed] [Google Scholar]
- Agarwal A, Koppstein D, Rozowsky J, Sboner A, Habetter L, Hillier LW, Sasidharan R, Reinke V, Waterston RH, Gerstein M 2010. Comparison and calibration of transcriptome data from RNA-Seq and tiling arrays. BMC Genomics 11: 383 doi: 10.1186/1471-2164-11-383 [DOI] [PMC free article] [PubMed] [Google Scholar]
- Andres AJ, Cherbas P 1992. Tissue-specific ecdysone responses: Regulation of the Drosophila genes Eip28/29 and Eip40 during larval development. Development 16: 865–876 [DOI] [PubMed] [Google Scholar]
- Arthur CG, Weide CM, Vincent WSI, Goldstein ES 1979. mRNA sequence diversity during early embryogenesis in Drosophila melanogaster. Exp Cell Res 121: 87–94 [DOI] [PubMed] [Google Scholar]
- Bakal C, Perrimon N 2010. Realizing the promise of RNAi high throughput screening. Dev Cell 18: 506–507 [DOI] [PMC free article] [PubMed] [Google Scholar]
- Bate M, Rushton E, Currie DA 1991. Cells with persistent twist expression are the embryonic precursors of adult muscles in Drosophila. Development 113: 79–89 [DOI] [PubMed] [Google Scholar]
- Bialojan S, Falkenburg D, Renkawitz-Pohl R 1984. Characterization and developmental expression of tubulin genes in Drosophila melanogaster. EMBO J 3: 2543–2548 [DOI] [PMC free article] [PubMed] [Google Scholar]
- Bieber AJ 1986. “Ecdysteroid inducible polypeptides in Drosophila Kc cells: Kinetics of mRNA induction and aspects of protein structure.” PhD thesis, Harvard University, Cambridge, MA [Google Scholar]
- Brooks AN, Yang L, Duff MO, Hansen KD, Dudoit S, Brenner SE, Graveley BR 2010. Conservation of an RNA regulatory map between Drosophila and mammals. Genome Res (in press). doi: 0.1101/gr.108662.110 [DOI] [PMC free article] [PubMed] [Google Scholar]
- Butler MJ, Jacobsen TL, Cain DM, Jarman MG, Huban M, Whittle JRS, Phillips R, Simcox A 2003. Discovery of genes with highly restricted expression patterns in the Drosophila wing disc using DNA oligonucleotide microarrays. Development 130: 659–670 [DOI] [PubMed] [Google Scholar]
- Cabrera GR, Godt D, Fang P-Y, Couderc J-L, Laski FA 2002. Expression pattern of Gal4 enhancer trap insertions into the bric à brac locus generated by P element replacement. Genesis 34: 62–65 [DOI] [PubMed] [Google Scholar]
- Celniker SE, Dillon LA, Gerstein MB, Gunsalus KC, Henikoff S, Karpen GH, Kellis M, Lai EC, Lieb JD, MacAlpine DM, et al. 2009. Unlocking the secrets of the genome. Nature 459: 927–930 [DOI] [PMC free article] [PubMed] [Google Scholar]
- Charroux B, Royet J 2009. Elimination of plasmatocytes by targeted apoptosis reveals their role in multiple aspects of the Drosophila immune response. Proc Natl Acad Sci 106: 9797–9802 [DOI] [PMC free article] [PubMed] [Google Scholar]
- Cherbas P, Cherbas L, Lee SS, Nakanishi K 1988. 26-[125I]Iodoponasterone A is a potent ecdysone and a sensitive radioligand for ecdysone receptors. Proc Natl Acad Sci 85: 2096–2100 [DOI] [PMC free article] [PubMed] [Google Scholar]
- Chintapalli VR, Wang J, Dow JAT 2007. Using FlyAtlas to identify better Drosophila models of human disease. Nat Genet 39: 715–720 [DOI] [PubMed] [Google Scholar]
- Currie DA, Milner MJ, Evans CW 1988. The growth and differentiation in vitro of leg and wing imaginal disc cells from Drosophila melanogaster. Development 102: 805–814 [Google Scholar]
- de Celis JF, Tyler DM, de Celis J, Bray SJ 1998. Notch signaling mediates segmentation of the Drosophila wing. Development 125: 4617–4626 [DOI] [PubMed] [Google Scholar]
- Debec A 1978. Haploid cell cultures of Drosophila melanogaster. Nature 274: 255–256 [DOI] [PubMed] [Google Scholar]
- Doherty D, Feger G, Younger-Shepherd S, Jan LY, Jan YN 1996. Delta is a ventral to dorsal signal complementary to Serrate, another Notch ligand, in Drosophila wing formation. Genes Dev 10: 421–434 [DOI] [PubMed] [Google Scholar]
- Dunipace L, Meister S, McNealy C, Amrein H 2001. Spatially restricted expression of candidate taste receptors in the Drosophila gustatory system. Curr Biol 11: 822–835 [DOI] [PubMed] [Google Scholar]
- Echalier G 1997. Drosophila cells in culture. Academic Press, San Diego [Google Scholar]
- Echalier G, Ohanessian A 1969. [Isolation, in tissue culture, of Drosophila melanogaster cell lines.] C R Acad Sci Hebd Seances Acad Sci D 268: 1771–1773 [PubMed] [Google Scholar]
- Fossett N, Tevosian SG, Gajewski K, Zhang Q, Orkin SH, Schulz RA 2001. The Friend of GATA proteins U-shaped, FOG-1, and FOG-2 function as negative regulators of blood, heart, and eye development in Drosophila. Proc Natl Acad Sci 98: 7342–7347 [DOI] [PMC free article] [PubMed] [Google Scholar]
- Galindo K, Smith DP 2001. A large family of divergent Drosophila odorant-binding proteins expressed in gustatory and olfactory sensilla. Genetics 159: 1059–1072 [DOI] [PMC free article] [PubMed] [Google Scholar]
- Gateff E, Gissmann L, Shrestha R, Plus N, Pfister H, Shroder J, Hausen HZ 1980.. Characterization of two tumorous blood cell lines of Drosophila melanogaster and the viruses they contain. In Invertebrate Systems In Vitro Fifth International Conference on Invertebrate Tissue Culture, Rigi-Kaltbad, Switzerland, 1979 (ed. Kurstak E et al. ), pp. 517–533 Elsevier, Amsterdam [Google Scholar]
- Gerlitz O, Nellen D, Ottiger M, Basler K 2002. A screen for genes expressed in Drosophila imaginal discs. Int J Dev Biol 46: 173–176 [PubMed] [Google Scholar]
- Giráldez AJ, Copley RR, Cohen SM 2002. HSPG modification by the secreted enzyme Notum shapes the Wingless morphogen gradient. Dev Cell 2: 667–676 [DOI] [PubMed] [Google Scholar]
- Glise B, Jones DL, Ingram PW 2002. Notch and Wingless modulate the response of cells to Hedgehog signalling in the Drosophila wing. Dev Biol 248: 93–106 [DOI] [PubMed] [Google Scholar]
- Godt D, Couderc J-L, Camton SF, Laski FA 1993. Pattern formation in the limbs of Drosophila: bric à brac is expressed in both a gradient and a wave-like pattern and is required for specification and proper segmentation of the tarsus. Development 119: 799–812 [DOI] [PubMed] [Google Scholar]
- Graveley BR, Brooks AN, Carlson JW, Duff MO, Landolin JM, Yang L, Artieri CG, van Baren MJ, Boley N, Booth BW, et al. 2011. The developmental transcriptome of Drosophila melanogaster. Nature (in press). doi: 10.1038/nature09715 [DOI] [PMC free article] [PubMed] [Google Scholar]
- Grimm S, Pflugfelder GO 1996. Control of the gene optomotor-blind in Drosophila wing development by decapentaplegic and wingless. Science 271: 1601–1604 [DOI] [PubMed] [Google Scholar]
- Harmon CL, Ahammad P, Hammonds A, Weiszann R, Celniker SE, Sastry S, Rubin GM 2007. Comparative analysis of spatial patterns of gene expression in Drosophila melanogaster imaginal discs. Lect Notes Comp Sci 4453: 533–547 [Google Scholar]
- Held LIJ 2002. Imaginal discs: The genetic and cellular logic of pattern formation. Cambridge University Press, Cambridge [Google Scholar]
- Hull-Thompson J, Muffat J, Sanchez D, Walker DW, Benzer S, Ganfornina MD, Jasper H 2009. Control of metabolic homeostasis by stress signaling is mediated by the lipocalin NLaz. PLoS Genet 5: e1000460 doi: 10.1371/journal.pgen.1000460 [DOI] [PMC free article] [PubMed] [Google Scholar]
- Irvine KD, Wieschaus E 1994. fringe, a boundary-specific signaling molecule, mediates interactions between dorsal and ventral cells during Drosophila wing development. Cell 79: 595–606 [DOI] [PubMed] [Google Scholar]
- Izquierdo M, Bishop JO 1979. An analysis of cytoplasmid RNA populations in Drosophila melanogaster, Oregon R. Biochem Genet 17: 473–497 [DOI] [PubMed] [Google Scholar]
- Jacques C, Soustelle L, Nagy I, Diebold C, Giangrande A 2009. A novel role of the glial fate determinant glial cells missing in hematopoiesis. Int J Dev Biol 53: 1013–1022 [DOI] [PubMed] [Google Scholar]
- Jorgensen EM, Garber RL 1987. Function and misfunction of the two promoters of the Drosophila Antennapedia gene. Genes Dev 1: 544–555 [DOI] [PubMed] [Google Scholar]
- Junakovic N, DiFranco C, Best-Belpomme M, Echalier G 1988. On the transposition of copia-like nomadic elements in cultured Drosophila cells. Chromosoma 97: 212–218 [DOI] [PubMed] [Google Scholar]
- Jung SH, Evans CJ, Uemura C, Banerjee U 2005. The Drosophila lymph gland as a developmental model of hematopoiesis. Development 132: 2521–2533 [DOI] [PubMed] [Google Scholar]
- Kim J, Irvine KD, Carroll SB 1995. Cell recognition, signal induction and symmetrical gene activation at the dorsal-ventral boundary of the developing Drosophila wing. Cell 82: 795–802 [DOI] [PubMed] [Google Scholar]
- Lebestky T, Chang T, Hartenstein V, Banerjee U 2000. Specification of Drosophila hematopoietic lineage by conserved transcription factors. Science 288: 146–149 [DOI] [PubMed] [Google Scholar]
- Levy WB, McCarthy BJ 1975. Messenger RNA complexity in Drosophila melanogaster. Biochemistry 14: 2440–2446 [DOI] [PubMed] [Google Scholar]
- Maisonhaute C, Ogereau D, Hua-Van A, Capy P 2007. Amplification of the 1731 LTR retrotransposon in Drosophila melanogaster cultured cells: origin of neocopies and impact on the genome. Gene 393: 116–126 [DOI] [PubMed] [Google Scholar]
- Manak JR, Dike S, Sementchenko V, Kapranov P, Biemar F, Long J, Cheng J, Bell I, Ghosh S, Piccolboni A, et al. 2006. Functional roles of unannotated intergenic transcription revealed by genome-wide transcription maps of Drosophila melanogaster during embryonic development. Nat Genet 38: 1151–1158 [DOI] [PubMed] [Google Scholar]
- The modENCODE Consortium 2010. Identification of functional elements and regulatory circuits by Drosophila modENCODE. Science 330: 1787–1797 [DOI] [PMC free article] [PubMed] [Google Scholar]
- Mohr S, Bakal C, Perrimon N 2010. Genomic screening with RNAi: Results and challenges. Annu Rev Biochem 79: 37–64 [DOI] [PMC free article] [PubMed] [Google Scholar]
- Mortazavi A, Williams BA, McCue K, Schaeffer L, Wold B 2008. Mapping and quantifying mammalian transcriptomes by RNA-Seq. Nat Methods 5: 621–628 [DOI] [PubMed] [Google Scholar]
- Mosna G, Dolfini S 1972. Morphological and chromosomal characterization of three new continuous cell lines of Drosophila melanogaster. Chromosoma 38: 1–9 [DOI] [PubMed] [Google Scholar]
- Natzle JE, McCarthy BJ 1984. Regulation of Drosophila alpha- and beta-tubulin genes during development. Dev Biol 104: 187–198 [DOI] [PubMed] [Google Scholar]
- Neal SJ, Gibson ML, So AK, Westwood JT 2003. Construction of a cDNA-based microarray for Drosophila melanogaster: A comparison of gene transcription profiles from SL2 and Kc167 cells. Genome 46: 879–892 [DOI] [PubMed] [Google Scholar]
- Pai C-Y, Kuo T-S, Jaw TJ, Kurant E, Chen C-T, Bessarab DA, Salzberg A, Sun YH 1998. The Homothorax homeoprotein activates the nuclear localization of another homeoprotein, Extradenticle, and suppresses eye development in Drosophila. Genes Dev 12: 435–446 [DOI] [PMC free article] [PubMed] [Google Scholar]
- Potter SS, Brorein WJJ, Dunsmuir P, Rubin GM 1979. Transposition of elements of the 412, copia and 297 dispersed repeated gene families in Drosophila. Cell 17: 415–427 [DOI] [PubMed] [Google Scholar]
- Ramain P, Heitler P, Haenlin M, Simpson P 1993. pannier, a negative regulator of achaete and scute in Drosophila, encodes a zinc finger protein with homology to the vertebrate transcription factor GATA-1. Development 119: 1277–1291 [DOI] [PubMed] [Google Scholar]
- Rauskolb C, Irvine KD 1999. Notch-mediated segmentation and growth control of the Drosophila leg. Dev Biol 210: 339–350 [DOI] [PubMed] [Google Scholar]
- Rieckhof GE, Casares F, Ryoo HD, Abu-Shaar M, Mann RS 1997. Nuclear translocation of Extradenticle requires homothorax, which encodes an Extradenticle-related homeodomain protein. Cell 91: 171–183 [DOI] [PubMed] [Google Scholar]
- Schneider I 1972. Cell lines derived from late embryonic stages of Drosophila melanogaster. J Embryol Exp Morphol 27: 353–365 [PubMed] [Google Scholar]
- Schulz RA, Shlomchik W, Cherbas L, Cherbas P 1989. Diverse expression of overlapping genes: the Drosophila Eip28/29 gene and its upstream neighbors. Dev Biol 131: 515–523 [DOI] [PubMed] [Google Scholar]
- Scott K, Brady RJ, Cravchik A, Morozov P, Rzhetsky A, Zuker C, Axel R 2001. A chemosensory gene family encoding candidate gustatory and olfactory receptors in Drosophila. Cell 104: 661–673 [DOI] [PubMed] [Google Scholar]
- Soanes KH, MacKay JO, Core N, Heslip T, Kerridge S, Bell JB 2001. Identification of a regulatory allele of teashirt (tsh) in Drosophila melanogaster that affects wing hinge development: An adult-specific tsh enhancer in Drosophila. Development 105: 145–151 [DOI] [PubMed] [Google Scholar]
- Stapleton M, Carlson J, Brokstein P, Yu C, Champe M, George R, Guarin H, Kronmiller B, Pacleb J, Park S, et al. 2002. A Drosophila full-length cDNA resource. Genome Biol 3: RESEARCH0080 doi: 10.1186/gb-2002-3-12-research0080 [DOI] [PMC free article] [PubMed] [Google Scholar]
- Sturtevant MA, Biehs B, Marin E, Bier E 1997. The spalt gene links the A/P compartment boundary to a linear adult structure in the Drosophila wing. Development 124: 21–32 [DOI] [PubMed] [Google Scholar]
- Tobin SL, Cook PJ, Burn TC 1990. Transcripts of individual Drosophila actin genes are differentially distributed during embryogenesis. Dev Genet 11: 15–26 [DOI] [PubMed] [Google Scholar]
- Tweedie S, Ashburner M, Falls K, Leyland P, McQuilton P, Marygold S, Millburn D, Osumi-Sutherland D, Schroeder A, Seal R, et al. 2009. FlyBase: Enhancing Drosophila Gene Ontology annotations. Nucleic Acids Res 37: D555–D559 [DOI] [PMC free article] [PubMed] [Google Scholar]
- Ui K, Ueda R, Miyake T 1987. Cell lines from imaginal discs of Drosophila melanogaster. In Vitro Cell Dev Biol Anim 23: 707–711 [DOI] [PubMed] [Google Scholar]
- Ui K, Nishihara S, Sakuma M, Togashi S, Ueda R, Miyata Y, Miyake T 1994. Newly established cell lines from Drosophila larval CNS express neural specific characteristics. In Vitro Cell Dev Biol Anim 30: 209–216 [DOI] [PubMed] [Google Scholar]
- Ui-Tei K, Nishihara S, Sakuma M, Matsuda K, Miyake T, Miyata Y 1994. Chemical analysis of neurotransmitter candidates in clonal cell lines from Drosophila central nervous system. I. ACh and L-DOPA. Neurosci Lett 174: 85–88 [DOI] [PubMed] [Google Scholar]
- Wang H, Huang S, Shou J, Su EW, Onyia JE, Liao B, Li S 2006. Comparative analysis and integrative classification of NC160 cell lines and primary tumors using gene expression profiling data. BMC Genomics 7: 166 doi: 10.1186/1471-2164-7-166 [DOI] [PMC free article] [PubMed] [Google Scholar]
- Yanagawa S, Lee JS, Ishimoto A 1998. Identification and characterization of a novel line of Drosophila Schneider S2 cells that respond to wingless signaling. J Biol Chem 273: 32353–32359 [DOI] [PubMed] [Google Scholar]
- Zhang Y, Malone JH, Powell SK, Periwal V, Spana E, MacAlpine DM, Oliver B 2010. Expression in aneuploid Drosophila S2 cells. PLoS Biol 8: e1000320 doi: 10.1371/journal.pbio.1000320 [DOI] [PMC free article] [PubMed] [Google Scholar]
- Zimmerman JL, Fouts DL, Manning JE 1980. Evidence for a complex class of nonadenlated mRNA in Drosophila. Genetics 95: 673–691 [DOI] [PMC free article] [PubMed] [Google Scholar]
- Zimmerman JL, Fouts DL, Levy LS, Manning JE 1982. Nonadenylylated mRNA is present as polyadenylylated RNA in nuclei of Drosophila. Proc Natl Acad Sci 79: 3148–3152 [DOI] [PMC free article] [PubMed] [Google Scholar]


