

Abstract
Motivation: DNA binding proteins play crucial roles in the regulation of gene expression. Transcription factors (TFs) activate or repress genes directly while other proteins influence chromatin structure for transcription. Binding sites of a TF exhibit a similar sequence pattern called a motif. However, a one-to-one map does not exist between each TF and motif. Many TFs in a protein family may recognize the same motif with subtle nucleotide differences leading to different binding affinities. Additionally, a particular TF may bind different motifs under certain conditions, for example in the presence of different co-regulators. The availability of genome-wide binding data of multiple collaborative TFs makes it possible to detect such context-dependent motifs.
Results: We developed a contrast motif finder (CMF) for the de novo identification of motifs that are differentially enriched in two sets of sequences. Applying this method to a number of TF binding datasets from mouse embryonic stem cells, we demonstrate that CMF achieves substantially higher accuracy than several well-known motif finding methods. By contrasting sequences bound by distinct sets of TFs, CMF identified two different motifs that may be recognized by Oct4 dependent on the presence of another co-regulator and detected subtle motif signals that may be associated with potential competitive binding between Sox2 and Tcf3.
Availability: The software CMF is freely available for academic use at www.stat.ucla.edu/∼zhou/CMF
Contact: zhou@stat.ucla.edu
Supplementary information: Supplementary data are available at Bioinformatics online and the CMF website.
1 INTRODUCTION
A TF binds the promoter or enhancer region of a gene, and in turn regulates the expression of the gene. TF binding sites (TFBSs) have a similar pattern or a motif usually described by a position-specific weight matrix (PWM) (Stormo and Hartzell, 1989; Stormo, 2000). A PWM is a w × 4 matrix, Θ = (θij)w×4, where each element θij represents the probability of nucleotide j ∈ {A, C, G, T} being at position i ∈ {1,…, w} and w is the length of the motif. Each position is modeled independently and each row of a PWM sums to 1. Motif discovery can be regarded as a missing data problem in the sense that neither the locations of TFBSs nor the motif parameters (PWM) are known. Many computational methods have been developed for motif discovery (Sandve and Drabløs, 2006; Vingron et al., 2009), with most fitting into two broad categories, those based on mixture models (Lawrence et al., 1993; Liu et al., 1995; Roth et al., 1998) and those based on discrimination (Elemento et al., 2007; Smith et al., 2005). Mixture models assume that a set of sequences consists of a mix of TFBSs and background nucleotides. While there are multiple approaches, most methods employ the EM algorithm or Gibbs sampling to identify TFBSs and estimate PWMs via iterative updating schemes. These iterative approaches tend to rely on two steps: first, sequences are scanned given an estimated PWM and background model to produce a set of predicted sites; secondly, the PWM is updated using the predicted sites. Under the mixture model, the counts of nucleotides from predicted sites can be used to estimate the PWM in a closed form. Discriminative motif finders (discriminators for short), on the other hand, use two sets of sequences, usually a bound set and an unbound control set, and attempt to find motifs that best distinguish between the two groups (Barash et al., 2001; Elemento et al., 2007; Leung and Chin, 2006; Readhead and Bailey, 2007; Smith et al., 2005). Most discriminators aim to maximize a measure of separation between the two sequence sets. For example, discriminating matrix enumerator (DME) (Smith et al., 2005) uses a measure based on likelihood ratio (LR) and FIRE (Elemento et al., 2007) uses mutual information. Again, these methods utilize iterative approaches to update a PWM such that their measure of separation improves. However, even with TFBSs predicted there is generally no closed-form estimation of the PWM under a discriminative model. As such discriminators often discretize the parameter space of the PWM to render discovery computationally feasible and thus sacrifice accuracy in estimation.
Recent improvements in genomic coverage by chromatin immunoprecipitation microarrays (ChIP-chip) and the coupling of ChIP with high-throughput sequencing technologies (ChIP-seq) have increased the number of bound regions identified while decreasing the width of such regions. This increase in accuracy and data size now enables many motif finders to easily identify the consensus motif of a TF. We hypothesize, however, that a TF may have context-dependent binding patterns and believe that the accuracy of newer ChIP datasets, along with the greater availability of such datasets, can be leveraged to discover these patterns. We are motivated by two possible context-dependent TF binding scenarios. The first is a co-regulation scenario where a TF binds DNA with a cofactor in some sequences and binds alone or with a different cofactor in other sequences. While the cofactor may have its own motif, the motif recognized by the original TF might be different when binding occurs with and without its cofactor. The second is a competition scenario where two TFs share similar DNA binding domains that may compete for the same binding sites. Here, sequences can be split into two groups based on context (i.e. the two TFs compete for the sequence versus only one TF binding the sequence). Differences in the motifs between the two groups might provide insight into how each TF is targeted to its binding sites.
Here, we propose a contrast motif finder (CMF) that aims to take advantage of multiple high-quality binding datasets to identify subtle regulatory signals, such as context-dependent motifs, within bound sequences. CMF is specifically designed to discriminate between two sets of bound sequences and provide a non-discretized estimation of PWMs. This method takes into account false positive sites when updating PWMs and other model parameters. In this article, we apply CMF to three recently published genome-wide binding studies of TFs in mouse embryonic stem cells (ESCs) (Chen et al., 2008; Marson et al., 2008; Sridharan et al., 2009). Each study used ChIP-chip or ChIP-seq to investigate TFs thought to play a role in ESC pluripotency and self-renewal (Table 1, for details see Supplementary Materials).
Table 1.
Genome-wide binding datasets
| Study | Data type | Factors |
|---|---|---|
| Sridharan et al. | ChIP-chip | Oct4, Sox2, Nanog, cMyc, Klf4 |
| Chen et al. | ChIP-seq | Oct4, Sox2, Nanog, Smad1, Klf4, Stat3, Tcfcp2l1, Esrrb, cMyc, nMyc, E2f1, Zfx, Ctcf |
| Marson et al. | ChIP-seq | Oct4, Sox2, Nanog, Tcf3 |
2 METHODS
While CMF is designed to contrast two binding datasets, S1 and S2, it is useful to motivate our method with a more traditional scenario where S1 is a ChIP dataset (bound sequences) and S2 is a set of control sequences. Suppose we are predicting binding sites with a given PWM Θ. For every segment s = (s1,…, sw), si ∈ {A, C, G, T}, of length w in a given sequence we compute the LR:
| (1) |
where the background model, θ0, is assumed to be a first-order Markov chain, i.e. θ0(si−1, si) is the transition probability from si−1 to si. We then predict binding sites by finding those segments with LR(s) greater than some threshold, τ. In this application, predicted sites in S1 are a mix of true sites and false positives, while all those found in S2 are false positives. As such, we can use the false positives found in S2 to both identify a proper threshold in predicting binding sites and to correct the contribution from false positives when estimating the PWM in S1. As a concrete example, Figure 1A shows the distributions of normalized log-likelihood ratios, log LR(s), for all segments of length w in Oct4 bound sequences in the Chen study and in a set of control sequences, both scanned by the Oct4 PWM. Figure 1B shows the right tails of the two distributions with LR > τ = 100. Here, the two distributions diverge with the Oct4 bound sequences containing a higher density of sites with LR(s) > 100. One sees that predicted sites in the Oct4 bound sequences, S1, are made of a mix of true sites and false positives (shaded area in Fig. 1B). CMF is designed specifically to prevent such false positive sites from corrupting the resulting PWM. It consists of two main steps, seed creation and updating motif parameters.
Fig. 1.

Motivational example for CMF. (A) The lowess smoothed distributions of log LR(s) in Chen Oct4 bound sequences and control sequences scanned by the Oct4 PWM. Each distribution was normalized by the median and the SD of the control dataset. The vertical dashed line indicates τ = 100. (B) A zoomed-in view of the right tails of the distributions.
2.1 Seed creation
Many motif finding methods use word enumeration to identify promising seeds (Liu et al., 2002; Sharov and Ko, 2009). Here, we develop a seeding scheme that finds words enriched in one set of sequences as compared with another set. Given two sets of sequences, S1 and S2, we denote by L1 and L2 the total numbers of length-w segments in S1 and S2, respectively. For every w-mer x = (x1,…, xw) in the two sets of sequences, we compute its z-score,
| (2) |
where  ,
,  , and
, and  with C1 and C2 the numbers of occurrences of the w-mer x in S1 and S2, respectively. We define a seed centered at a w-mer x by incorporating neighboring w-mers, where a w-mer y is considered a neighbor of x if it matches x with at most m mismatches (Table 2, All). For all results in the article, we use w = 7 and m = 2, unless noted otherwise. We further filter these neighbors by two biologically motivated constraints. First, we reason that only those neighbors y that are overrepresented in the same set of sequences as the center w-mer, x, should be included in the seed, i.e. {y : z(y)z(x) > 0} (Table 2, Dir). After this step, we further filter by considering subsets of y called sub-neighborhoods. We define a sub-neighborhood yJ of the central w-mer x as those neighbors with the same mismatch position(s) J, where J is a size-m subset of {1,…, w}. For example, in Table 2 if J = {2} then y{2} = {ATGCAAA, AcGCAAA, AgGCAAA} is the sub-neighborhood for mismatch position 2, where AaGCAAA is omitted since its enrichment direction differs from that of the center ATGCAAA. Considering sub-neighborhoods is useful since motifs do not exhibit great flexibility in each of their w positions; instead most motif positions are rather rigid (high information content) with a few positions being flexible. However, even when an initial seed is more rigid than it should be, the iterative updating step, to be introduced next, can modify the initial seed into a more degenerate PWM. For each sub-neighborhood yJ we compute the z-score (2) with the counts C1 and C2 being the total numbers of occurrences of w-mers in yJ. We use the best sub-neighborhood (Table 2, Best), i.e. the yJ with the greatest z-score, to construct the seed. Each seed is summarized by two w × 4 count matrices, N(1)1 and N(1)2, where N(1)1 is composed of the best sub-neighborhood sites in S1 and N(1)2 is similarly composed of the best sub-neighborhood sites in S2 adjusted for length (i.e. rescaled by L1/L2). Because S2 is a set of control sequences, after being adjusted for length, N(1)2 can be regarded as the expected count matrix constructed from false positive sites in S1.
Table 2.
Illustration of seed construction for the Oct4 consensus from the Chen Oct4 dataset (w = 7, m = 1)
| Seed: ATGCAAA |
7.45 |
599 |
171.9 |
|||
|---|---|---|---|---|---|---|
| Pos |
All |
Dir |
Best |
z |
+ count − |
|
| 1 | cTGCAAA | cTGCAAA | 1.13 | 154 | 119.8 | |
| gTGCAAA | gTGCAAA | 0.33 | 102 | 93.8 | ||
| tTGCAAA | tTGCAAA | 1.39 | 169 | 125 | ||
| 2 | AaGCAAA | −1.3 | 189 | 234.4 | ||
| AcGCAAA | AcGCAAA | 1.80 | 27 | 5.2 | ||
| AgGCAAA | AgGCAAA | 0.5 | 145 | 130.2 | ||
| ··· | ··· | ··· | ··· | ··· | ||
| 6 | ATGCAcA | −0.51 | 151 | 166.7 | ||
| ATGCAgA | ATGCAgA | ATGCAgA | 3.4 | 247 | 119.8 | |
| ATGCAtA | ATGCAtA | ATGCAtA | 3.4 | 226 | 104.2 | |
| 7 | ATGCAAc | −1.08 | 44 | 62.5 | ||
| ATGCAAg | ATGCAAg | 2.48 | 108 | 46.9 | ||
| ATGCAAt | ATGCAAt | 0.004 | 73 | 73 | ||
Lowercase nucleotides indicate mismatch position. ‘+ count −’: site counts and length−adjusted site counts from S1 and S2. Neighbors with a mismatch at positions 3–5 are omitted to save space.
2.2 Iterative updating
Once the best sub-neighborhood of each seed is determined, we take an iterative approach to update the PWM for each seed whose sub-neighborhood z-score or exact z-score (i.e. the z-score of the center) ranks within the top M. The parameter M gives an upper bound for the number of motifs to be found. In general, we recommend a choice of M = 20; if the output motifs are highly similar we recommend increasing M in order to find any secondary motifs. Note that some seeds may share the same sub-neighborhood and thus their respective count matrices, N(1)1 and N(1)2, will be identical. In this case we only use the seed with the most significant exact z-score.
Recall that a seed is summarized by two count matrices N(1)1 and N(1)2. At iteration t (t = 1, 2,…), denote the two count matrices constructed by predicted sites in S1 and S2 by N1(t) = (N1,ij(t))w×4 and N2(t) = (N2,ij(t))w×4, respectively. Similarly, N(t)2 contains length-adjusted counts and represents the expected count matrix of false positives in S1. Let Ft = (Fij(t))w×4 be the count matrix constructed by false positive sites predicted in S1. If Ft is given, the log-likelihood of Θ is
| (3) |
However, Ft is unknown and thus we estimate Θ by maximizing the expectation of l(Θ) with Fij(t) replaced by its expectation N2,ij(t), subject to the constraints that θij ≥ 0 and ∑j θij = 1. This leads to the use of a differential matrix
| (4) |
in the estimation of Θ, where N(t)ij = max(N(t)1,ij − N(t)2,ij, 0) for all i and j. To prevent CMF from being trapped in a local mode, we then add 5% pseudo-counts to each position in N(t) and normalize each row into probabilities to obtain the updated PWM, Θ(t). Intuitively, subtracting off N(t)2 mitigates the contribution that false positives would otherwise make to the PWM as motivated in Figure 1.
Given Θ(t) and a threshold τ, we use the LR (1) to scan S1 and S2 to predict TFBSs. The false discovery rate (FDR) of the sites predicted in S1 can be estimated by FDR(τ) = (C2L1/L2)/C1, where C1 = ∑s∈S1 I(LR(s) > τ) is the number of sites found in S1, C2 = ∑s∈S2I(LR(s) > τ) is the number of sites in S2 and L1 and L2 are defined as before. We find the lowest τ such that FDR(τ) < δ, where δ is an upper bound chosen by the user and τ is discretized to τ ∈ {100, 200,…, 2000} for computational efficiency. In practice, we employ δ = 2/3. Once τ is determined, denoted by τ(t), sites in S1 and S2 with LR(s) > τ(t) are used to create count matrix N(t+1)1 and length-adjusted count matrix N(t+1)2, respectively. Note that by correcting for the influence of false positives in Equation (4) the algorithm becomes robust to the discretization of τ and the choice of δ. At each iteration we also determine whether the motif should grow or shrink by 1 bp on either side based on the Bayes factors at the flanking positions (see Supplementary Materials for details).
Lastly, we check whether the algorithm has converged by measuring the distance, d(t) = maxi,j|θ(t+1)ij − θ(t)ij|, between Θ(t+1) and Θ(t). If d(t) < ϵ (= 0.01), we stop iterating. We summarize this iterative algorithm of CMF as follows.
Initialize N(1)1 and N(1)2 by seed creation. For t = 1, 2,… and d(t) < ϵ:
Update Θ(t) using N(t)1 and N(t)2 by Equation (4);
Scan S1 and S2 with Θ(t) and determine τ(t);
Use sites with LR(s) > τ(t) to create N(t+1)1 and N(t+1)2.
2.3 Contrasting two bound datasets
CMF provides an option to indicate whether the second set of sequences is a control set or a set of bound sequences, i.e. whether S2 may contain enriched motifs. When two bound datasets are contrasted, seed creation is identical to the case when a ChIP dataset is contrasted to a control dataset, except that seeds with the most negative z-scores (the bottom M) are also updated into PWMs. For these seeds, PWMs are updated with the iterative algorithm described above but with S1 and S2 switched. In this case, CMF outputs two groups of motifs, one enriched in S1 and the other enriched in S2.
When discriminating between two bound datasets, CMF not only corrects for false positives but also masks out dominant motif signals present in both datasets allowing weaker signals to be detected. For example, a consensus motif present in both datasets will not lead to an enriched seed and will lack stable differential counts when updating PWMs by Equation (4). Similarly, GC-rich motifs will not be produced when two bound sequence sets, both of high GC content, are contrasted.
3 RESULTS
3.1 A comparison of seeding methods
To assess the validity of our seeding method, we compared our use of the best sub-neighborhood in seed construction to using all neighbors or using those neighbors that match the enrichment direction of the central w-mer. CMF was applied to a subset of 500 randomly sampled sequences of each Sridharan dataset (Table 1) along with a set of control sequences created to match the binding data distributions of width and distance to nearest gene. Note that all subsequent sets of control sequences are created in a similar manner for each TF dataset. Table 3 shows the consensus w-mers of Oct4, Sox2, cMyc and Klf4 ranked according to z-scores computed from all neighbors (All Nhoods), from neighbors with the same enrichment direction (Dir Nhoods) and from the best sub-neighborhood (Best Nhoods). Here, one sees that using the best sub-neighborhood outperforms the other neighborhood constructions and often provides a higher ranking than using the exact match. For example, the ranking of the Oct4 consensus w-mer improves drastically with the best sub-neighborhood. It is ranked 4747th and 324th when using all neighbors and those neighbors with the same enrichment direction, respectively. Using the best sub-neighborhood it is ranked second, which is higher than the ranking of the exact match. Similar results were seen in the Chen and Marson datasets. Sox2 is the only TF for which the exact match outperforms the best sub-neighborhood, which can occur if the true motif has few low-information positions.
Table 3.
A comparison of seeding methods
| TF | Consensus | Exact | All | Dir | Best |
|---|---|---|---|---|---|
| w-mer | match | Nhoods | Nhoods | Nhoods | |
| Oct4 | ATGCAAA | 11 (3.8) | 4747 (1.7) | 324 (14.3) | 2 (6.5) |
| Sox2 | ACAAAG | 35 (3.7) | 5983 (−1.5) | 3294 (11.7) | 60 (5) |
| cMyc | CACGTG | 10 (4.3) | 314 (9.9) | 60 (18.4) | 5 (7.8) |
| Klf4 | CCCACCC | 4 (4.7) | 54 (16.3) | 12 (22.6) | 1 (8.7) |
| Rank (z-score) | |||||
3.2 A comparison against popular motif finders
We compared CMF against three other motif finders: two discriminators, DME (version 2) (Smith et al., 2005) and FIRE (Elemento et al., 2007) and a Gibbs motif sampler, BioProspector (Liu et al., 2001), based on mixture modeling. Although there are many variants of Gibbs motif samplers, we chose BioProspector since its run time is similar to that of CMF. We ran DME using 50 seeds and w = 10. We ran FIRE using its default parameters, where w starts at 7 and grows automatically. We ran BioProspector with w = 10 and 40 randomized attempts and utilized its option to build a third-order Markov chain background model from the control sequences. For CMF we took the top M = 20 seeds with w = 7 and m = 2. In the case of Nanog, where the top 20 seeds of CMF produced similar Sox2 motifs for each dataset, we used 50 seeds to allow for other potential motifs.
To conduct an unbiased comparison, we randomly split each dataset in Table 1 into training and test sets. Training sequences were composed of 80% of a TF binding dataset and a control dataset of ∼750 sequences. A test dataset consisted of the remaining 20% of bound sequences, S1t, and an independent control dataset of ∼4000 sequences, S2t. Motifs were found by applying a motif finder to the training datasets. Identified motifs were then used to scan the test datasets for predicting binding sites. Denote by ℓ the number of sequences in S1t. As a way to determine a proper LR cutoff, τℓ, we chose the ℓ-th highest LR found in scanning S1t, under the assumption that each bound sequence should have one binding site on average. Then we estimated the FDR from the number of predicted sites in St2 with LR > τℓ:
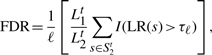 |
where Lt1 and Lt2 are the numbers of length-w segments in the test bound and control datasets, respectively. In this way, the total number of predicted sites in S1t was fixed to ℓ for every method so that our comparison on FDR was meaningful. Table 4 shows the FDRs of each motif finder with the percent changes relative to CMF's FDRs in parentheses. CMF exhibited a lower FDR in almost every dataset. Similar results were obtained for different choices of the LR cutoff τ. Some exceptions are seen in nMyc and cMyc from the Chen study where other methods showed a slightly lower FDR or the difference was negligible. However, there are many cases where CMF's accuracy was much higher (≥20%) than the other finders marked in bold text in Table 4. For example, the motifs found in all Oct4 and Sox2 datasets were much more accurate than those of the other finders, regardless of whether the consensus motif or the composite SoxOct motif was found. Oct4 and Sox2 often form a heterodimer that binds a Oct4 motif located adjacent to a Sox2 motif, called the SoxOct motif (Reményi et al., 2003). Furthermore, only CMF was able to find the Nanog motif, CCATTA (Jauch et al., 2008), Supplementary Fig. 1, in the Chen study. Note that Zfx, E2f1 and Smad1 from the Chen study are not included in Table 4, since Zfx has no known consensus motif and none of the methods found E2f1 or Smad1's consensus motifs. We repeated the same FDR comparison with simulated test control sequences, and observed consistent improvement of CMF over the other three motif finders (see Supplementary Materials for details). To ascertain whether CMF's decreased FDR was due to our seeding or PWM updating techniques, we applied the EM algorithm under the mixture model to update the PWMs initialized by the seeding method of CMF. This method produced inferior results in most cases (Table 4, mix MLE), suggesting that CMF's improved accuracy was not solely due to its seed creation.
Table 4.
A comparison of motif finding methods
| ChIP(Motif) | CMF | DME | FIRE | BioP | mix MLE | |
|---|---|---|---|---|---|---|
| Sridharan | Oct4(Oct4) | 0.55 | 0.61 (10) | 0.62 (12) | 0.67 (22) | NA |
| Sox2(Sox2) | 0.41 | NA | 0.51 (23) | 0.92 (120) | NA | |
| cMyc(Ebox) | 0.40 | 0.48 (20) | 0.63 (58) | NA | 0.71 (78) | |
| Klf4(Klf4) | 0.43 | 0.59 (38) | 0.45 (5) | 0.68 (59) | 0.62 (43) | |
| Nanog(Sox2) | 0.55 | 0.76 (36) | NA | 0.70 (26) | NA | |
| Chen | Oct4(Oct4) | 0.31 | 0.78 (150) | NA | NA | NA |
| Sox2(Sox2) | 0.20 | 0.32 (59) | 0.5 (150) | 0.24 (20) | 0.26 (30) | |
| cMyc(Ebox) | 0.19 | 0.19 (0) | 0.20 (8) | NA | NA | |
| nMyc(Ebox) | 0.30 | 0.25 (−18) | 0.28 (−6) | NA | NA | |
| Klf4(Klf4) | 0.24 | 0.26 (11) | 0.52 (120) | 0.26 (8) | 0.46 (94) | |
| Nanog(Nanog) | 0.60 | NA | NA | NA | NA | |
| Nanog(Sox2) | 0.38 | 0.58 (51) | 0.64 (67) | 0.62 (60) | 0.45 (17) | |
| STAT3(Stat3) | 0.17 | 0.22 (30) | 0.40 (140) | NA | 0.13 (−24) | |
| CTCF(Ctcf) | 0.18 | 0.23 (26) | 0.49 (150) | 0.44 (140) | NA | |
| Esrrb(Esrrb) | 0.18 | 0.19 (4) | 0.37 (110) | 0.20 (13) | 0.13 (−25) | |
| Marson | Oct4(SoxOct) | 0.24 | 0.42 (71) | 0.62 (160) | 0.39 (60) | 0.53 (120) |
| Sox2(SoxOct) | 0.31 | 0.43 (40) | 0.68 (120) | 0.40 (29) | NA | |
| Nanog(SoxOct) | 0.40 | 0.71 (80) | 0.69 (73) | 0.65 (64) | NA | |
| Tcf3(Sox2) | 0.34 | 0.39 (14) | 0.55 (62) | 0.57 (68) | 0.42 (25) |
FDRs are presented with the percent increase over the FDR of CMF in parentheses. NA indicates that the method was unable to find the motif.
The results described above confirm the effectiveness of CMF in finding consensus motifs. Hereafter, we focus on applying CMF to identify context-dependent motifs by contrasting two sets of bound sequences. To understand the implications of finding motifs in this manner we considered ChIP-seq datasets in the Marson study, which contains data for four TFs, Oct4, Sox2, Nanog and Tcf3 (Table 1). Oct4, Sox2 and Nanog are key regulators of the main attributes of ESCs, pluripotency (the ability to differentiate into any cell type) and self-renewal (the ability to go through cell division an infinite number of times) (Yu et al., 2007). Tcf3 is thought to temper the expression of genes bound by Sox2 and keep them from being highly expressed (Yi et al., 2008).
3.3 Context-dependent motifs of Oct4
Oct4 and Sox2 often form a heterodimer though both TFs also bind DNA as monomers. While the consensus motif of Oct4 is well characterized, some studies have suggested that it may bind other motifs in the presence of other cofactors (Tomilin et al., 2000). We wanted to investigate the possibility of distinct Oct4 motifs occurring in the presence and absence of Sox2. To that end we contrasted sequences cobound by Oct4 and Sox2 (OS-cobound seqs) with those only bound by Oct4 (Oct4-only seqs) in the Marson study. Exact technical definitions of the two sequence sets are given in Supplementary Materials. While the consensus SoxOct motif, ATTTGCATAACAAAG, was found in OS-cobound seqs, a different motif, ATGCGCAT, was found in the Oct4-only sequences (Fig. 2). This new motif, which we term palindromic GCAT (pGCAT), consists of two palindromic GCAT half-sites first described in Tantin et al. (2008). This result can be replicated by contrasting similarly defined sequence sets from the Chen study. To investigate the biological implications of the two motifs, we checked the occurrences of the other 11 TFs in the Chen study (Table 1) in the respective neighborhoods of the pGCAT motif and the consensus Oct4 motif. We scanned all Oct4 binding peaks in the Chen study for the two motifs and split them into two groups: those that only contain the Oct4 consensus motif, called Oct4-motif peaks, and those that only contain the pGCAT motif, called pGCAT peaks (see Supplementary Materials for details). We computed the proportion of Oct4-motif peaks that have a binding peak of another TF within 500 bp. We computed the same proportion for pGCAT peaks and determined the significance of the difference between the two proportions for every one of the 11 TFs (Fig. 2c).
Fig. 2.

Context-dependent motifs recognized by Oct4. (A) The consensus Oct4 motif. (B) pGCAT motif found by CMF when contrasting sequences cobound by Oct4 and Sox2 against sequences bound solely by Oct4. Boxes indicate positions that change from the consensus. (C) Proportions of cofactor binding within 500 bp of the Oct4-motif peaks and the pGCAT peaks in the Chen study with corresponding P-values (− log10p) from difference of proportions tests. There are 1107 Oct4-motif peaks and 224 pGCAT peaks.
We found that the Oct4-motif peaks and the pGCAT peaks were co-occupied by two distinct groups of TFs. Oct4-motif peaks are enriched for cobinding by Nanog, Sox2 and Smad1, which have been shown to regulate pluripotency genes, while pGCAT peaks are enriched for binding by nMyc, cMyc, E2f1 and Zfx, which regulate genes related to protein metabolism (Chen et al., 2008; Kim et al., 2008). Furthermore, Stat3, Tcfcp2l1 and Esrrb also co-occupied more often with Oct4-motif peaks (Fig. 2c) and may be included in the first TF group. The two TF groups defined here have previously been shown to regulate two separate groups of genes (Chen et al., 2008; Kim et al., 2008; Ouyang et al., 2009; Sharov and Ko, 2009). For example, Ouyang et al. (2009) showed that cMyc, nMyc, E2f1 and Zfx function as activators in general while TFs in the other group can be either activators or repressors dependent on the target gene. Binding of these two groups of TFs together can explain much of the variation in gene expression in ESCs (R2 = 0.65). Interestingly, in a similar comparison of enrichments based on binding peaks instead of motifs, the co-occupancy of the cMyc-group TFs is not significantly different between Oct4/Sox2 cobound peaks and Oct4-only peaks demonstrating the usefulness of the two motifs in classifying Oct4 binding peaks (see Supplementary Materials for details). The distinct sets of cofactors enriched near Oct4-motif peaks and pGCAT peaks suggest that the context-dependent motifs of Oct4 may be related to the combinatorial binding of the two TF groups. Target genes of Oct4 with only the Oct4 consensus motif include many known pluripotency related genes like Nanog, Dppa5a and Chd1 (Gaspar-Maia et al., 2009; Yu et al., 2007) while the pGCAT sites seem to regulate developmentally important genes (e.g. Id3, Hoxc5, Jmjd6). Supplementary Datasets 1 and 2 contain lists of target genes of Oct4 binding peaks that contain either the Oct4 consensus motif or the pGCAT motif.
3.4 Differences in motifs for HMG domains
Sox2 and Tcf3 both have HMG-box domains that bind similar DNA patterns (Kormish et al., 2010). While both TFs are highly expressed in ESCs, Sox2 mostly activates its targets and Tcf3 tends to repress its targets (Cole et al., 2008). Furthermore, many Sox2 and Tcf3 binding sites overlap, which suggests that the two TFs may compete for the same binding sites given their opposite regulatory roles. Approximately half of all Sox2 sites are bound by Tcf3 while about 2/3 of Tcf3 sites are bound by Sox2 in the Marson study. To investigate whether subtle signals might affect the targeting of the two proteins, we contrasted different subsets of sequences bound by Sox2 and/or Tcf3. Interestingly, we found that Sox2 consistently binds its consensus motif, ACAA[A/T]G (Maruyama et al., 2005), in every subset of sequences bound by Sox2 regardless of whether Tcf3 binds the sequences (Supplementary Fig. 2a–c). Tcf3, on the other hand, has different binding patterns depending on whether Sox2 also binds. The context-dependent motifs of Tcf3 can easily be found by contrasting two bound datasets. Figure 3 shows motifs found by CMF when contrasting Tcf3 bound sequences with and without Sox2 binding: we found the consensus Sox2 motif (Fig. 3a) in sequences bound by both TFs (ST-cobound), while sequences bound solely by Tcf3 (Tcf3-only) had a slightly different motif, TCAAAG (Fig. 3b), which we call the Tcf3-specific motif. This result is consistent with the motifs identified by contrasting ST-cobound sequences, Tcf3-only sequences or all Tcf3 bound sequences against control datasets (Supplementary Fig. 2c–e). Particularly, the motif found in all Tcf3 bound sequences is a mixture of the Sox2 motif and the Tcf3-specific motif. The change from an adenine in position 2 in the Sox2 motif (Fig. 3a) to a thymine in the Tcf3-specific motif (Fig. 3b) is significantly associated with the cobinding of Sox2: the P-value for observing such an extreme difference by random partition of all Tcf3 bound sequences is practically zero (P < 5 × 10⁻⁸). This different nucleotide preference may prevent Sox2 binding while still permitting Tcf3 binding as it may recognize both motifs. Although this finding has not been experimentally validated, similar results have been found for Sox4 and Tcf1 by Selex (van de Wetering et al., 1993). Here, one sees that by contrasting subsets of bound sequences CMF can identify subtle signals with implications to functional binding. Many pluripotency genes bound by Tcf3 can be categorized by the context-dependent patterns. For example, Sox2, cMyc, Utf1 and Jarid2 have only the Sox2 motif in their promoters, while others like Klf2, Nr5a2 and Sall4 have the Tcf3-specific motif. Supplementary Datasets 3 and 4 provide lists of those targets bound by Tcf3 with either the Sox2 motif or the Tcf3-specific motif.
Fig. 3.

Context-dependent motifs of Tcf3 found when contrasting sequences bound by Tcf3 and Sox2 against those only bound by Tcf3. (A) The Sox2 consensus motif found enriched in the sequences bound by both Tcf3 and Sox2. (B) The motif found in sequences bound by Tcf3 but not Sox2. Corresponding positions between (A) and (B) with different nucleotide distributions are indicated (boxed and circled).
It should be noted that DME and BioProspector can be used to find motifs enriched in one of two bound sequence sets by employing one sequence set as the background in order to find motifs enriched in the other and that FIRE can handle more than one bound sequence set. Using these approaches with the Oct4-only seqs and OS-cobound seqs, DME and BioProspector found motifs resembling the pGCAT motif but FIRE did not; for the Sox2 and Tcf3 datasets, FIRE and DME found the Sox2 and the Tcf3-specific motifs but BioProspector failed to detect either of them.
4 DISCUSSION
CMF yields PWMs that are corrected for false positives and outperforms PWMs found by other popular motif finders. When contrasting bound sequence datasets, CMF also mitigates the dominant signal of the consensus motif, enabling small differences from the canonical motif to be observed. Using CMF we detected context-dependent motifs of a few key TFs in ESCs, which demonstrates a concrete example for the use of large-scale ChIP-seq data to discover subtle and complex regulatory signals. The context in this work is defined by combinatorial or competitive binding of multiple TFs, which is different from the binding context studied in previous works that refers to the orientation, the location or the surrounding background nucleotides of a binding site (Beer and Tavazoie, 2004; Chen and Zhou, 2010; Huang et al., 2004; Nguyen and D'Haeseleer, 2006; Westholm et al., 2008; Yu et al., 2006). In future studies, we will develop a more principled approach to determine how many motifs CMF should output, in addition to the current use of an upper bound M. We also hope to adapt CMF to enable the discovery of motifs containing variably separated half-sites, such as Nrsf which can tolerate gaps that vary as much as 10 bp (Johnson et al., 2007). Furthermore, CMF does not take into account the interactions among binding sites in discriminating between S1 and S2. Incorporation of more sophisticated statistical models, such as classification trees and hierarchical mixture modeling (Zhou and Wong, 2004), in CMF should be helpful for finding interactive motif combinations and cis-regulatory modules.
Funding: UCLA Dissertation Year Fellowship; NIH Director's Young Innovator Award (DP2OD001686); California Institue of Regenerative Medicine Young Investigator Award (RN1-00564); NSF grant (DMS-0805491).
Conflict of Interest: none declared.
Supplementary Material
REFERENCES
- Barash Y, et al. A simple hyper-geometric approach for discovering putative transcription factor binding sites. Proc. WABI. 2001;1:278–293. [Google Scholar]
- Beer MA, Tavazoie S. Predicting gene expression from sequence. Cell. 2004;117:185–198. doi: 10.1016/s0092-8674(04)00304-6. [DOI] [PubMed] [Google Scholar]
- Chen X, et al. Integration of external signaling pathways with the core transcriptional network in embryonic stem cells. Cell. 2008;133:1106–1117. doi: 10.1016/j.cell.2008.04.043. [DOI] [PubMed] [Google Scholar]
- Chen G, Zhou Q. Heterogeneity in DNA multiple alignments: modeling, inference, and applications in motif finding. Biometrics. 2010;66:694–704. doi: 10.1111/j.1541-0420.2009.01362.x. [DOI] [PubMed] [Google Scholar]
- Cole M, et al. Tcf3 is an integral component of the core regulatory circuitry of embryonic stem cells. Genes Dev. 2008;22:746–755. doi: 10.1101/gad.1642408. [DOI] [PMC free article] [PubMed] [Google Scholar]
- Elemento O, et al. A universal framework for regulatory element discovery across all genomes and data types. Molecular Cell. 2007;28:337–350. doi: 10.1016/j.molcel.2007.09.027. [DOI] [PMC free article] [PubMed] [Google Scholar]
- Gaspar-Maia A, et al. Chd1 regulates open chromatin and pluripotency of embryonic stem cells. Nature. 2009;460:863–868. doi: 10.1038/nature08212. [DOI] [PMC free article] [PubMed] [Google Scholar]
- Huang H, et al. Determination of local statistical significance of patterns in Markov sequences with application to promoter element identification. J. Comput. Biol. 2004;11:1–14. doi: 10.1089/106652704773416858. [DOI] [PubMed] [Google Scholar]
- Jauch R, et al. Crystal structure and DNA binding of the homeodomain of the stem cell transcription factor Nanog. J. Mol. Biol. 2008;376:758–770. doi: 10.1016/j.jmb.2007.11.091. [DOI] [PubMed] [Google Scholar]
- Johnson D, et al. Genome-wide mapping of in vivo protein-DNA interactions. Science. 2007;316:1497–1502. doi: 10.1126/science.1141319. [DOI] [PubMed] [Google Scholar]
- Kim J, et al. An extended transcriptional network for pluripotency of embryonic stem cells. Cell. 2008;132:1049–1061. doi: 10.1016/j.cell.2008.02.039. [DOI] [PMC free article] [PubMed] [Google Scholar]
- Kormish J, et al. Interactions between SOX sactors and Wnt/β-Catenin signaling in development and disease. Dev. Dynamics. 2010;339:56–68. doi: 10.1002/dvdy.22046. [DOI] [PMC free article] [PubMed] [Google Scholar]
- Lawrence C, et al. Detecting subtle sequence signals: a Gibbs sampling strategy for multiple alignment. Science. 1993;262:208–214. doi: 10.1126/science.8211139. [DOI] [PubMed] [Google Scholar]
- Leung H, Chin F. Finding motifs from all sequences with and without binding sites. Bioinformatics. 2006;22:2217–2223. doi: 10.1093/bioinformatics/btl371. [DOI] [PubMed] [Google Scholar]
- Liu X, et al. BioProspector: discovering conserved DNA motifs in upstream regulatory regions of co-expressed genes. Pac. Symp. Biocomput. 2001;6:127–138. [PubMed] [Google Scholar]
- Liu X, et al. An algorithm for finding protein-DNA binding sites with applications to chromatin-immunoprecipitation microarray experiments. Nat. Biotechnol. 2002;20:835–839. doi: 10.1038/nbt717. [DOI] [PubMed] [Google Scholar]
- Liu J, et al. Bayesian models for multiple sequence alignment and Gibbs sampling strategies. J. Am. Stat. Assoc. 1995;90:1156–1170. [Google Scholar]
- Marson A, et al. Connecting microRNA genes to the core transcriptional regulatory circuitry of embryonic stem cells. Cell. 2008;134:521–533. doi: 10.1016/j.cell.2008.07.020. [DOI] [PMC free article] [PubMed] [Google Scholar]
- Maruyama M, et al. Differential roles for Sox15 and Sox2 in transcriptional control in mouse embryonic stem cells. J. Biol. Chem. 2005;280:24371–24379. doi: 10.1074/jbc.M501423200. [DOI] [PubMed] [Google Scholar]
- Nguyen DH, D'Haeseleer P. Deciphering principles of transcription regulation in eukaryotic genomes. Mol. Syst. Biol. 2006;2 doi: 10.1038/msb4100054. 2006.0012. [DOI] [PMC free article] [PubMed] [Google Scholar]
- Ouyang Z, et al. ChIP-Seq of transcription factors predicts absolute and differential expression in embryonic stem cells. Proc. Natl Acad. Sci. USA. 2009;106:21521–21526. doi: 10.1073/pnas.0904863106. [DOI] [PMC free article] [PubMed] [Google Scholar]
- Readhead E, Bailey TL. Discriminative motif discovery in DNA and protein sequences using the DEME algorithm. BMC Bioinformatics. 2007;8:385. doi: 10.1186/1471-2105-8-385. [DOI] [PMC free article] [PubMed] [Google Scholar]
- Reményi A, et al. Crystal structure of a POU/HMG/DNA ternary complex suggests differential assembly of Oct4 and Sox2 on two enhancers. Genes Dev. 2003;17:2048–2059. doi: 10.1101/gad.269303. [DOI] [PMC free article] [PubMed] [Google Scholar]
- Roth FR, et al. Finding DNA regulatory motifs within unaligned noncoding sequences clustered by whole genome mRNA quantization. Nat. Biotechnol. 1998;16:939–945. doi: 10.1038/nbt1098-939. [DOI] [PubMed] [Google Scholar]
- Sandve G, Drabløs F. A survey of motif discovery methods in an integrated framework. Biol. Direct. 2006;1:11. doi: 10.1186/1745-6150-1-11. [DOI] [PMC free article] [PubMed] [Google Scholar]
- Sharov A, Ko M. Exhaustive search for over-represented DNA sequence motifs with CisFinder. DNA Res. 2009;16:261–273. doi: 10.1093/dnares/dsp014. [DOI] [PMC free article] [PubMed] [Google Scholar]
- Smith A, et al. Identifying tissue-selective transcription factor binding sites in vertebrate promoters. Proc. Natl Acad. Sci. USA. 2005;102:1560–1565. doi: 10.1073/pnas.0406123102. [DOI] [PMC free article] [PubMed] [Google Scholar]
- Sridharan R, et al. Role of the murine reprogramming factors in the induction of pluripotency. Cell. 2009;136:364–377. doi: 10.1016/j.cell.2009.01.001. [DOI] [PMC free article] [PubMed] [Google Scholar]
- Stormo GD. DNA binding sites: representation and discovery. Bioinformatics. 2000;16:16–23. doi: 10.1093/bioinformatics/16.1.16. [DOI] [PubMed] [Google Scholar]
- Stormo GD, Hartzell GW. Identifying protein-binding sites from unaligned DNA fragments. Proc. Natl Acad. Sci. USA. 1989;86:1183–1187. doi: 10.1073/pnas.86.4.1183. [DOI] [PMC free article] [PubMed] [Google Scholar]
- Tantin D, et al. High-throughput biochemical analysis of in vivo location data reveals novel distinct classes of POU5F1(Oct4)/DNA complexes. Genome Res. 2008;18:631–639. doi: 10.1101/gr.072942.107. [DOI] [PMC free article] [PubMed] [Google Scholar]
- Tomilin A, et al. Synergism with the coactivator OBF-1 (OCA-B, BOB-1) is mediated by a specific POU dimer configuration. Cell. 2000;103:853–864. doi: 10.1016/s0092-8674(00)00189-6. [DOI] [PubMed] [Google Scholar]
- van de Wetering M, et al. Sox-4, an Sry-like HMG box protein, is a transcriptional activator in lymphocytes. EMBO J. 1993;12:3847–3854. doi: 10.1002/j.1460-2075.1993.tb06063.x. [DOI] [PMC free article] [PubMed] [Google Scholar]
- Vingron M, et al. Integrating sequence, evolution and functional genomics in regulatory genomics. Genome Biol. 2009;10:202. doi: 10.1186/gb-2009-10-1-202. [DOI] [PMC free article] [PubMed] [Google Scholar]
- Westholm J, et al. Genome-scale study of the importance of binding site context for transcription factor binding and gene regulation. BMC Bioinformatics. 2008;9:484. doi: 10.1186/1471-2105-9-484. [DOI] [PMC free article] [PubMed] [Google Scholar]
- Yi F, et al. Tcf3 functions as a steady-state limiter of transcriptional programs of mouse embryonic stem cell self-renewal. Stem Cells. 2008;26:1951–1960. doi: 10.1634/stemcells.2008-0229. [DOI] [PMC free article] [PubMed] [Google Scholar]
- Yu X, et al. Genome-wide prediction and characterization of interactions between transcription factors in Saccharomyces cerevisiae. Nucleic Acids Res. 2006;34:917–927. doi: 10.1093/nar/gkj487. [DOI] [PMC free article] [PubMed] [Google Scholar]
- Yu J, et al. Induced pluripotent stem cell lines derived from human somatic cells. Science. 2007;318:1917–1920. doi: 10.1126/science.1151526. [DOI] [PubMed] [Google Scholar]
- Zhou Q, Wong W. CisModule: De novo discovery of cis-regulatory modules by hierarchical mixture modeling. Proc. Natl Acad. Sci. USA. 2004;101:12114–12119. doi: 10.1073/pnas.0402858101. [DOI] [PMC free article] [PubMed] [Google Scholar]
Associated Data
This section collects any data citations, data availability statements, or supplementary materials included in this article.