

Abstract
It is well established that the risk of developing multiple sclerosis is substantially increased in the relatives of affected individuals and that most of this increase is genetically determined. The observed pattern of familial recurrence risk has long suggested that multiple variants are involved, but it has proven difficult to identify individual risk variants and little has been established about the genetic architecture underlying susceptibility. By using data from two independent genome-wide association studies (GWAS), we demonstrate that a substantial proportion of the thousands of variants that individually fail to show statistically significant evidence of association have allele frequencies in cases that are skewed away from the null distribution through the effects of multiple as-yet-unidentified risk loci. The collective effect of 12,627 SNPs with Cochran-Mantel-Haenszel test (p < 0.2) in our discovery GWAS set optimally explains ∼3% of the variance in MS risk in our independent target GWAS set, estimated by Nagelkerke's pseudo-R2. This model has a highly significant fit (p = 9.90E-19). These results statistically demonstrate a polygenic component to MS susceptibility and suggest that the risk alleles identified to date represent just the tip of an iceberg of risk variants likely to include hundreds of modest effects and possibly thousands of very small effects.
Main Text
Multiple sclerosis (MS [MIM 126200]) is a complex demyelinating disorder of the central nervous system. The etiology of the disease is not well understood but epidemiological studies provide undeniable evidence that genetic factors are involved.1–4 Despite these extensive data, there was little progress identifying relevant genes prior to the emergence of genome-wide association studies (GWAS). For more than 30 years the only known MS genetic risk locus was the major histocompatibility complex (MHC) on chromosome 6p21.5,6 All this changed in 2007 when the International Multiple Sclerosis Genetics Consortium (IMSGC) completed the first MS GWAS7 and identified one new susceptibility locus, IL2RA (MIM 147730), and simultaneously with two other reports confirmed another susceptibility locus, IL7R (MIM 146661).8,9 Since then progress has been rapid and the list of established MS risk loci has grown considerably (see Table 1). To date all of the newly identified MS risk alleles are common, exert only modest individual effects on risk (odds ratios 1.1–1.3), and ostensibly act independently. Even in combination with the much more substantial effects attributable to the MHC, these known MS risk loci account for less than half of the familial clustering observed epidemiologically. It is inescapable that other genetic risk factors exist and that much remains to be discovered about the genetics of MS. To aid in this discovery process, it would be helpful to estimate the form of this as-yet-undiscovered genetically determined risk.
Table 1.
Established Non-MHC MS Risk Alleles
| Susceptibility Gene | RS Number | OR Estimate | Allele | Reference |
|---|---|---|---|---|
| IL7RA | rs6897932 | 1.18 | C | Gregory et al., 2007;8 IMSGC, 2007;7 Lundmark et al., 20079 |
| IL2RA | rs12722489 | 1.25 | C | IMSGC, 20077 |
| IL2RA | rs2104286 | 1.19 | T | IMSGC, 200825 |
| CLEC16A | rs6498169 | 1.14 | G | IMSGC, 20077 |
| CLEC16A | rs12708716 | 1.19 | A | IMSGC, 200926 |
| CD58 | rs12044852 | 1.24 | C | IMSGC, 20077 |
| CD58 | rs2300747 | 0.77 | G | De Jager et al., 200819 |
| CD226 | rs763361 | 1.12 | A | IMSGC, 200926 |
| TYK2 | rs34536443 | 1.32 | G | Ban et al., 200927 |
| CD6 | rs17824933 | 1.18 | G | De Jager et al., 200819 |
| IRF8 | rs17445836 | 0.8 | A | De Jager et al., 200819 |
| TNFRSF1A | rs1800693 | 1.2 | C | De Jager et al., 200819 |
| TNFRSF1A | rs4149584 | 1.58 | T | De Jager et al., 200819 |
| METTL1 | rs703842 | 0.81 | G | ANZgene, 200928 |
| METTL1 | rs10876994 | 0.82 | C | ANZgene, 200928 |
| METTL1 | rs12368653 | 1.15 | A | ANZgene, 200928 |
| CD40 | rs6074022 | 1.22 | G | ANZgene, 200928 |
| CD40 | rs1569723 | 1.22 | C | ANZgene, 200928 |
GWAS, which by design examine common variation, have naturally driven the identification of common risk alleles for MS rather than rare variants. At the same time, the virtual absence of large extended MS families10 coupled with the total absence of any consistent evidence for linkage outside the MHC region11 indicates that rare alleles exerting very large effects are unlikely to play a prominent role in the genetics of MS. The relationship between familial recurrence risk and the degree of relatedness provides some guidance to the underlying genetic architecture of MS12–14 and several studies have demonstrated that this relationship is distinctly nonlinear, suggesting that susceptibility is probably determined by multiple risk alleles, each exerting modest individual effects.1–4,15,16 Unfortunately, this type of segregation analysis is insensitive to the number of involved loci and is largely unable to distinguish between dozens of modest effects, hundreds of weak effects, or thousands of very weak effects.15 In line with the polygenic model proposed by Fisher,17 it is logical to anticipate that the genetic architecture underlying susceptibility to MS will involve a wide spectrum of risk allele frequencies and effect sizes.13 Under such a polygenic model, we would expect that many of the SNPs tested in a GWAS will be genuinely associated with disease, although most to only a minor degree. In this context we should see a systematic inflation of association scores across the genome, the pattern of which would be a reflection of the linkage disequilibrium (LD) between tested variants and the underlying risk alleles. The genome-wide inflation of association scores, beyond that which would be expected through sampling variance alone, is a well-recognized aspect of GWAS; however, most of this phenomenon is known to stem from subtle experimental biases, such as hidden population stratification and differential missingness.13 In a recently published ground-breaking study, the International Schizophrenia Consortium (ISC)18 confirmed the existence of polygenic influences in schizophrenia (MIM 181500) by showing that a small fraction of the variance in disease status (∼3%) was significantly associated with a score based on multiple SNPs, none of which were significantly associated with the disease at a genome-wide level in their own right. In short, they showed that despite sampling variance and the confounding influences of population stratification and differential missingness, the systematic influences of polygenic effects can be demonstrated. The ISC further demonstrated that the extent of variance explained increased as they incorporated additional SNPs with less significant p values into their scoring. With simulations they showed that this pattern most probably indicated that polygenic risk in schizophrenia is determined by modest numbers of larger effects and increasing numbers of smaller effects.18
Two previously published MS GWAS data sets were employed in this analysis. Data from the International Multiple Sclerosis Genetics Consortium (IMSGC) GWAS7 was used in the discovery phase, while data from the GWAS performed by the Partners MS Center at the Brigham and Women's Hospital (BWH) and published as part of a recent meta-analysis19 was used in the target phase. In both of these GWAS, MS was diagnosed according to standardized clinical criteria20 and stringent quality control (QC) measures were applied to the data prior to analysis (see original publications for details7,19).
The IMSGC GWAS7 was based on the Affymetrix GeneChip Human Mapping 500K Array Set and consisted of reliable data from 334,923 SNPs in 931 affected individuals and 2,431 controls: 1,475 from the Wellcome Trust Case Control Consortium (randomly selected from the 1958 British Birth Cohort and the UK National Blood Transfusion Service) and 956 from the National Institute of Mental Health. Of the 931 cases, 453 were ascertained from sites across the UK, and 478 were ascertained from the Partners Healthcare MS Center in Boston and the UCSF MS Center. The BWH GWAS19 was based on the Affymetrix Genome-wide Human SNP Array 6.0 (GeneChip 6.0) which, after excluding 54 individuals included in both GWAS, provided reliable data from 713,683 SNPs in 806 affected individuals ascertained from the Partners Healthcare MS Center in Boston and 1,720 controls ascertained by the MIGen consortium21 (394 from Spain, 63 from Sweden, 12 from Finland, 746 from Seattle) and an additional 357 controls ascertained in Boston.
To avoid the issue of scoring hemizygous individuals, we based our analysis solely on autosomal SNPs and excluded X and Y linked variants. SNPs with minor allele frequency <0.05 were also excluded because in the sample sizes available to us these SNPs have little or no power. To avoid confounding influences from established MS susceptibility variants (Table 1), we excluded these along with all SNPs within 1 Mb of each established risk variant. Because of the more extensive LD in the MHC region and greater influence of this region, exclusion was extended to the entire MHC (chromosome 6, 29700KB–33300KB). After applying these exclusions, we were left with 311,315 SNPs with high-quality genotypes common to both studies. By using the genotypes from both discovery and target sets, we further pruned this consensus SNP panel with the PLINK software suite to remove SNPs in strong linkage disequilibrium with each other and thereby generate a set of 59,470 essentially independent SNPs. We used an r2 threshold of 0.2 within a 500 SNP window, sliding 5 SNPs at a time.
We applied established methods for computing individual risk score profiles22,23 to assess the polygenic effect of multiple sclerosis. With the PLINK software suite, Cochran-Mantel-Haenszel test statistics were computed for all SNPs in the discovery set, stratifying by geographic origin (UK versus US samples). Based on these CMH association tests, overlapping sets of scoring SNPs were generated based on test significance threshold (pT): pT < 0.01, pT < 0.05, and pT deciles between 0.1 and 1 (Table 2).
Table 2.
Target GWAS Statistics for Each Scoring SNP Set
| p Value Threshold Range | Number of SNPs | p Value | Nagelkerke's Pseudo-R2 |
|---|---|---|---|
| 0-0.01 | 746 | 3.14E-09 | 0.0126 |
| 0-0.05 | 3,272 | 1.39E-16 | 0.0243 |
| 0-0.1 | 6,426 | 2.45E-18 | 0.0271 |
| 0-0.2 | 12,627 | 2.62E-19 | 0.0287 |
| 0-0.3 | 18,564 | 7.53E-19 | 0.0279 |
| 0-0.4 | 24,565 | 1.29E-19 | 0.0292 |
| 0-0.5 | 30,365 | 8.93E-20 | 0.0294 |
| 0-0.6 | 36,160 | 3.35E-20 | 0.0301 |
| 0-0.7 | 42,075 | 1.22E-20 | 0.0308 |
| 0-0.8 | 48,012 | 1.73E-20 | 0.0305 |
| 0-0.9 | 53,748 | 1.05E-20 | 0.0309 |
| 0-1 | 59,470 | 6.12E-21 | 0.0313 |
The number of scoring SNPs falling into each p value threshold defined set is shown (note these numbers are of course overlapping). Both the p value and the pseudo-R2 are reported as a difference between a full model containing score and covariates and a reduced model containing covariates only, evaluated by likelihood ratio test.
By using the odds ratio point estimates from the discovery set, we calculated an aggregate score for each individual in the target set equal to the number of score alleles weighted by the log of the odds ratio. Missing genotypes in target individuals were given the mean score for that locus as seen across the individuals not missing a genotype at that locus. All score profiles were calculated via PLINK's score function.
To allow correction for any residual signal attributable to established risk alleles that had not been removed by our regional exclusion of SNPs flanking established risk alleles, we generated a score profile based on the known susceptibility variants listed in Table 1 (with rs3135388 as the surrogate for the MHC effect). Where susceptibility SNPs were not typed in the target set, we selected proxies with the highest r2 to the susceptibility SNP, with ties broken by lowest physical distance (Table S1 available online).
With the aggregate scores generated in the target set, we conducted logistic regression analysis to test the relationship between the computed scores and disease status. The score based on known-susceptibility variants and the total number of nonmissing alleles over all SNPs were included as covariates in the analysis. Logistic regression analysis was conducted with STATA 10.1. The variance in case/control status explained by the score statistic was estimated as the difference in variance (with the Nagelkerke pseudo-R2) between a model including score and the covariates (full model) versus the covariates alone (reduced model). p values were computed as 1-df likelihood ratio tests between the full and reduced models.
To test for polygenic influences in multiple sclerosis, we considered data from two MS GWAS7,19 and explored how the risk of MS was related to the effects of multiple loci considered collectively (“en masse”).18 After excluding SNPs in LD with known MS susceptibility variants (see Table 1) and filtering SNPs on the basis of quality control measures, allele frequency, and mutual LD, we established a set of 59,470 essentially independent autosomal SNPs common to both MS GWAS. These scoring SNPs were then considered in seven sets defined on the basis of nominal significance thresholds observed in the first GWAS7 (Table 2 indicates the number of scoring SNPs in each significance threshold defined set). The first GWAS7 (the discovery data set) was used to establish a score for each allele at each of the 59,470 SNPs. Although these odds ratio point estimates have wide confidence intervals, they are inevitably correlated with the true risk for the assessed alleles. In the target data set (the second MS GWAS19), we then calculated the aggregate score for each sample by summing the number of risk alleles present in the individual weighted by the score for that allele as calculated in the discovery set. These aggregate scores were then subject to logistic regression analysis to determine whether they account for significant variance in disease status within the target data set. This process was repeated for each of the sets of scoring SNPs.
Each of the scoring SNP sets showed highly significant evidence for association to disease status (p = 3.14E-9–p = 6.12E-21), confirming that polygenic inheritance determined by as-yet-unidentified genetic variation is relevant in multiple sclerosis (see Figure 1 and Table 2).
Figure 1.
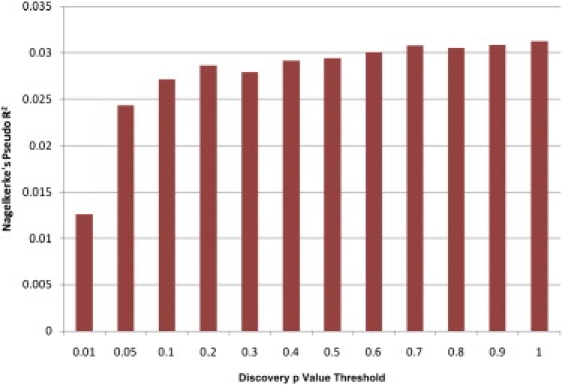
Nagelkerke's Pseudo-R2 for Each Scoring SNP Set
Variance explained in the target set, measured by Nagelkerke's pseudo-R2, is shown for each of the seven scoring SNP sets as defined by arbitrary discovery GWAS p value thresholds.
Our analysis provides highly significant evidence for a polygenic component to the genetics of MS. As with other complex diseases, it is becoming increasingly clear that single genes explaining a large proportion of heritability do not exist.24 The results of this study indicate that MS risk is governed in part by the cumulative effect of multiple genetic variants scattered across the genome, each contributing only a modest individual effect.
In contrast to the results of the schizophrenia study, the variance explained in MS (as measured by the Nagelkerke's pseudo-R2 value) tended to stabilize once the SNP inclusion cut-off reached an initial p value of 0.2. On the surface, this might suggest that SNPs with somewhat larger effects (e.g., odds ratios of 1.1–1.3) are more prevalent in MS than in schizophrenia. However, the fact that the level of pseudo-R2 does not fall in scoring sets based on less significant thresholds suggests that this flattening may be due to limited power more than an absence of genuinely associated variants among those SNPs with p values of 0.2–0.5.
Some portion of the identified polygenic effect could be due to cryptic population stratification remaining in the samples of European descent. However, common methods for correcting for such stratification rely on the assumption that there is no widely dispersed genomic effect on the trait. This is exactly what we are testing, so applying such correction will probably eliminate a true polygenic effect. As pointed out in the original paper from the ISC,18 en masse effects like those we have demonstrated are unlikely to result from stratification because the same structure would need to be present in both data sets to produce correlation between studies, a highly unlikely scenario.
Although this analysis provides convincing evidence for the existence of a polygenic influence on susceptibility, it provides little if any guidance as to the location of the relevant variants. Mapping these additional effects can be achieved only through larger GWAS. Most of the common variants with odds ratio > 1.2 should emerge from a GWAS involving ∼10,000 cases and ∼10,000 controls, but even larger studies will be required to map weaker effects.
Acknowledgments
This work was supported by the National Institutes of Health (NS049477, NS032830, MH065215), the Wellcome Trust (084702/Z/08/Z), and the Cambridge NIHR Biomedical Research Centre. This study makes use of data generated by the WTCCC and NIMH. Study participants were recruited in agreement with protocols of the institutional review board at each institution.
For a full list of members of the IMSGC, see http://www.imsgc.org. Contributing authors to this work are William S. Bush (Vanderbilt University), Stephen J. Sawcer (University of Cambridge), Philip L. de Jager (Brigham & Women's Hospital and Harvard Medical School), Jorge R. Oksenberg (UCSF), Jacob L. McCauley (University of Miami, Miller School of Medicine), Margaret A. Pericak-Vance (University of Miami, Miller School of Medicine), and Jonathan L. Haines (Vanderbilt University). W.S.B. and S.J.S. contributed equally to this work. Correspondence should be directed to W.S.B. (wbush@chgr.mc.vanderbilt.edu).
Supplemental Data
Web Resources
The URL for data presented herein is as follows:
Online Mendelian Inheritance in Man (OMIM), http://www.ncbi.nlm.nih.gov/Omim/
References
- 1.Kenealy S.J., Pericak-Vance M.A., Haines J.L. The genetic epidemiology of multiple sclerosis. J. Neuroimmunol. 2003;143:7–12. doi: 10.1016/j.jneuroim.2003.08.005. [DOI] [PubMed] [Google Scholar]
- 2.Mumford C.J., Wood N.W., Kellar-Wood H., Thorpe J.W., Miller D.H., Compston D.A. The British Isles survey of multiple sclerosis in twins. Neurology. 1994;44:11–15. doi: 10.1212/wnl.44.1.11. [DOI] [PubMed] [Google Scholar]
- 3.Robertson N.P., Fraser M., Deans J., Clayton D., Walker N., Compston D.A. Age-adjusted recurrence risks for relatives of patients with multiple sclerosis. Brain. 1996;119:449–455. doi: 10.1093/brain/119.2.449. [DOI] [PubMed] [Google Scholar]
- 4.Sadovnick A.D., Ebers G.C. Genetics of multiple sclerosis. Neurol. Clin. 1995;13:99–118. [PubMed] [Google Scholar]
- 5.Barcellos L.F., Sawcer S., Ramsay P.P., Baranzini S.E., Thomson G., Briggs F., Cree B.C., Begovich A.B., Villoslada P., Montalban X., International Multiple Sclerosis Genetics Consortium Heterogeneity at the HLA-DRB1 locus and risk for multiple sclerosis. Hum. Mol. Genet. 2006;15:2813–2824. doi: 10.1093/hmg/ddl223. [DOI] [PubMed] [Google Scholar]
- 6.Yeo T.W., De Jager P.L., Gregory S.G., Barcellos L.F., Walton A., Goris A., Fenoglio C., Ban M., Taylor C.J., Goodman R.S., International Multiple Sclerosis Genetics Consortium A second major histocompatibility complex susceptibility locus for multiple sclerosis. Ann. Neurol. 2007;61:228–236. doi: 10.1002/ana.21063. [DOI] [PMC free article] [PubMed] [Google Scholar]
- 7.Hafler D.A., Compston A., Sawcer S., Lander E.S., Daly M.J., De Jager P.L., de Bakker P.I., Gabriel S.B., Mirel D.B., Ivinson A.J., International Multiple Sclerosis Genetics Consortium Risk alleles for multiple sclerosis identified by a genomewide study. N. Engl. J. Med. 2007;357:851–862. doi: 10.1056/NEJMoa073493. [DOI] [PubMed] [Google Scholar]
- 8.Gregory S.G., Schmidt S., Seth P., Oksenberg J.R., Hart J., Prokop A., Caillier S.J., Ban M., Goris A., Barcellos L.F., Multiple Sclerosis Genetics Group Interleukin 7 receptor alpha chain (IL7R) shows allelic and functional association with multiple sclerosis. Nat. Genet. 2007;39:1083–1091. doi: 10.1038/ng2103. [DOI] [PubMed] [Google Scholar]
- 9.Lundmark F., Duvefelt K., Iacobaeus E., Kockum I., Wallström E., Khademi M., Oturai A., Ryder L.P., Saarela J., Harbo H.F. Variation in interleukin 7 receptor alpha chain (IL7R) influences risk of multiple sclerosis. Nat. Genet. 2007;39:1108–1113. doi: 10.1038/ng2106. [DOI] [PubMed] [Google Scholar]
- 10.Willer C.J., Dyment D.A., Cherny S., Ramagopalan S.V., Herrera B.M., Morrison K.M., Sadovnick A.D., Risch N.J., Ebers G.C. A genome-wide scan in forty large pedigrees with multiple sclerosis. J. Hum. Genet. 2007;52:955–962. doi: 10.1007/s10038-007-0194-6. [DOI] [PubMed] [Google Scholar]
- 11.Sawcer S., Ban M., Maranian M., Yeo T.W., Compston A., Kirby A., Daly M.J., De Jager P.L., Walsh E., Lander E.S., International Multiple Sclerosis Genetics Consortium A high-density screen for linkage in multiple sclerosis. Am. J. Hum. Genet. 2005;77:454–467. doi: 10.1086/444547. [DOI] [PMC free article] [PubMed] [Google Scholar]
- 12.Risch N. Linkage strategies for genetically complex traits. I. Multilocus models. Am. J. Hum. Genet. 1990;46:222–228. [PMC free article] [PubMed] [Google Scholar]
- 13.Wang W.Y., Barratt B.J., Clayton D.G., Todd J.A. Genome-wide association studies: Theoretical and practical concerns. Nat. Rev. Genet. 2005;6:109–118. doi: 10.1038/nrg1522. [DOI] [PubMed] [Google Scholar]
- 14.Yang Q., Khoury M.J., Friedman J., Little J., Flanders W.D. How many genes underlie the occurrence of common complex diseases in the population? Int. J. Epidemiol. 2005;34:1129–1137. doi: 10.1093/ije/dyi130. [DOI] [PubMed] [Google Scholar]
- 15.Lindsey J.W. Familial recurrence rates and genetic models of multiple sclerosis. Am. J. Med. Genet. A. 2005;135:53–58. doi: 10.1002/ajmg.a.30702. [DOI] [PubMed] [Google Scholar]
- 16.Sadovnick A.D., Dyment D., Ebers G.C. Genetic epidemiology of multiple sclerosis. Epidemiol. Rev. 1997;19:99–106. doi: 10.1093/oxfordjournals.epirev.a017951. [DOI] [PubMed] [Google Scholar]
- 17.Fisher R.A. The correlations between relatives on the supposition of Mendelian inheritance. Trans. R. Soc. Edinb. 2009;52:399–433. [Google Scholar]
- 18.Purcell S.M., Wray N.R., Stone J.L., Visscher P.M., O'Donovan M.C., Sullivan P.F., Sklar P., International Schizophrenia Consortium Common polygenic variation contributes to risk of schizophrenia and bipolar disorder. Nature. 2009;460:748–752. doi: 10.1038/nature08185. [DOI] [PMC free article] [PubMed] [Google Scholar]
- 19.De Jager P.L., Jia X., Wang J., de Bakker P.I., Ottoboni L., Aggarwal N.T., Piccio L., Raychaudhuri S., Tran D., Aubin C., International MS Genetics Consortium Meta-analysis of genome scans and replication identify CD6, IRF8 and TNFRSF1A as new multiple sclerosis susceptibility loci. Nat. Genet. 2009;41:776–782. doi: 10.1038/ng.401. [DOI] [PMC free article] [PubMed] [Google Scholar]
- 20.McDonald W.I., Compston A., Edan G., Goodkin D., Hartung H.P., Lublin F.D., McFarland H.F., Paty D.W., Polman C.H., Reingold S.C. Recommended diagnostic criteria for multiple sclerosis: guidelines from the International Panel on the diagnosis of multiple sclerosis. Ann. Neurol. 2001;50:121–127. doi: 10.1002/ana.1032. [DOI] [PubMed] [Google Scholar]
- 21.Kathiresan S., Voight B.F., Purcell S., Musunuru K., Ardissino D., Mannucci P.M., Anand S., Engert J.C., Samani N.J., Schunkert H., Myocardial Infarction Genetics Consortium, Wellcome Trust Case Control Consortium Genome-wide association of early-onset myocardial infarction with single nucleotide polymorphisms and copy number variants. Nat. Genet. 2009;41:334–341. doi: 10.1038/ng.327. [DOI] [PMC free article] [PubMed] [Google Scholar]
- 22.Wray N.R., Goddard M.E., Visscher P.M. Prediction of individual genetic risk to disease from genome-wide association studies. Genome Res. 2007;17:1520–1528. doi: 10.1101/gr.6665407. [DOI] [PMC free article] [PubMed] [Google Scholar]
- 23.Evans D.M., Visscher P.M., Wray N.R. Harnessing the information contained within genome-wide association studies to improve individual prediction of complex disease risk. Hum. Mol. Genet. 2009;18:3525–3531. doi: 10.1093/hmg/ddp295. [DOI] [PubMed] [Google Scholar]
- 24.Manolio T.A., Collins F.S., Cox N.J., Goldstein D.B., Hindorff L.A., Hunter D.J., McCarthy M.I., Ramos E.M., Cardon L.R., Chakravarti A. Finding the missing heritability of complex diseases. Nature. 2009;461:747–753. doi: 10.1038/nature08494. [DOI] [PMC free article] [PubMed] [Google Scholar]
- 25.International Multiple Sclerosis Genetics Consortium (IMSGC) Refining genetic associations in multiple sclerosis. Lancet Neurol. 2008;7:567–569. doi: 10.1016/S1474-4422(08)70122-4. [DOI] [PMC free article] [PubMed] [Google Scholar]
- 26.International Multiple Sclerosis Genetics Consortium (IMSGC) The expanding genetic overlap between multiple sclerosis and type I diabetes. Genes Immun. 2009;10:11–14. doi: 10.1038/gene.2008.83. [DOI] [PMC free article] [PubMed] [Google Scholar]
- 27.Ban M., Goris A., Lorentzen A.R., Baker A., Mihalova T., Ingram G., Booth D.R., Heard R.N., Stewart G.J., Bogaert E., Wellcome Trust Case-Control Consortium (WTCCC) Replication analysis identifies TYK2 as a multiple sclerosis susceptibility factor. Eur. J. Hum. Genet. 2009;17:1309–1313. doi: 10.1038/ejhg.2009.41. [DOI] [PMC free article] [PubMed] [Google Scholar]
- 28.Australia and New Zealand Multiple Sclerosis Genetics Consortium (ANZgene) Genome-wide association study identifies new multiple sclerosis susceptibility loci on chromosomes 12 and 20. Nat. Genet. 2009;41:824–828. doi: 10.1038/ng.396. [DOI] [PubMed] [Google Scholar]
Associated Data
This section collects any data citations, data availability statements, or supplementary materials included in this article.